Page 1
FP7-ICT-2013-10 - 4.3 - Ultrasound Simulation Component
Project No.
610425 Deliverable Report
D4.3, 31/10/2015, Revision: Final version
Page 1 of 23
REC_TL01_Deliverables_V01_20140101 2015-10-30
Deliverable 4.3
Ultrasound Simulation Component
Dissemination
Level Type Delivery Month
Confidential (CO)
Restricted (RE)
Public (PU)
Report (R)
Prototype (P)
Other (O)
24
Deliverable D4.3
Milestone Not applicable
Work Package Leader URJC
Task/Deliverable Leader RWTH-VR
Deliverable Due Date 31.10.2015
Date of Submission 30.10.2015
Version 2.0
Keywords
Internal Report Review Done by management body
Page 2
FP7-ICT-2013-10 - 4.3 - Ultrasound Simulation Component
Project No.
610425 Deliverable Report
D4.3, 31/10/2015, Revision: Final version
Page 2 of 23
REC_TL01_Deliverables_V01_20140101 2015-10-30
Version Control
Version Date Author (Name) Institution (Project Short Name)
1.0 29.09.2015 Yuen Law RWTH
1.1 29.10.2015 Júlia Oliveira UKA-IMI
2.0 20.10.2015 Yuen Law RWTH
1.X = 1st version circulating between the members / 2.X = 2nd version following comments of members / 3.X = 3rd final version
Page 3
FP7-ICT-2013-10 - 4.3 - Ultrasound Simulation Component
Project No.
610425 Deliverable Report
D4.3, 31/10/2015, Revision: Final version
Page 3 of 23
REC_TL01_Deliverables_V01_20140101 2015-10-30
Table of contents 1 ABSTRACT .......................................................................................................................... 5
2 INTRODUCTION ................................................................................................................... 5
2.1 Context ....................................................................................................... 5
2.2 Objectives ................................................................................................... 6
2.3 Task Dependencies .................................................................................... 7
3 PROGRESS TOWARDS OBJECTIVES ...................................................................................... 9
3.1 Overview of Methods .................................................................................. 9
3.2 Modeling of the tissue textures ................................................................... 9
3.3 Modeling of the Ultrasound beam ............................................................. 11
3.4 Ultrasound propagation ............................................................................ 12
3.5 Image formation ........................................................................................ 13
3.6 Technologies ............................................................................................ 14
3.7 Key Features ............................................................................................ 16
3.7.1 Handling Tissue deformation .................................................................... 16
3.7.2 Parameterization....................................................................................... 18
3.7.3 Multimodality ............................................................................................. 18
3.7.4 Annotations ............................................................................................... 18
4 DEVIATIONS/PROBLEMS .................................................................................................... 19
4.1 Level of detail ........................................................................................... 20
5 RESULTS AND CONCLUSIONS ............................................................................................ 21
6 REFERENCE DOCUMENTS ................................................................................................. 22
Page 4
FP7-ICT-2013-10 - 4.3 - Ultrasound Simulation Component
Project No.
610425 Deliverable Report
D4.3, 31/10/2015, Revision: Final version
Page 4 of 23
REC_TL01_Deliverables_V01_20140101 2015-10-30
List of Figures
Figure 1 Overview of the Simulation Process. ....................................................................... 10
Figure 2 An example of a 3-dimensional model of the ultrasonic beam. ................................ 12
Figure 3. Ultrasound images are formed by activating transducers in sequence and swiping
the anatomy. ........................................................................................................................... 13
Figure 4. Sampled information from the rays contributes to a single pixel row in the image
and produces the characteristic effects of US images: Blurry edges. .................................... 14
Figure 5. The CUDA Architecture gives access to the multiple cores of the GPU and
therefore allows for parallel execution of the simulation. ........................................................ 15
Figure 6 The relation between the deformation mesh and the traced rays. ........................... 17
Figure 7 Series of real ultrasound images showing a pulsating artery. .................................. 16
Figure 8. Simulated images showing overlapping anatomical structures, marked in the right
image. ..................................................................................................................................... 19
Figure 9. A CT slice showing the low level of detail in the small region of interest. ............... 20
List of Tables
Table 1. Comparison between Interpolative and Generative simulation approaches .............. 6
Table 2. Description of required Input ...................................................................................... 8
Table 3. Description of the component’s output ....................................................................... 8
Table 4. Summary of results .................................................................................................. 21
Page 5
FP7-ICT-2013-10 - 4.3 - Ultrasound Simulation Component
Project No.
610425 Deliverable Report
D4.3, 31/10/2015, Revision: Final version
Page 5 of 23
REC_TL01_Deliverables_V01_20140101 2015-10-30
1 Abstract
This document (Deliverable 4.3) presents the results of Task 4.3, the Ultrasound Simulation
Module as described previously in the Grant Agreement and the Simulator Specification
(Deliverable 5.1 – RASim Specifications). Here, we go over the methods used for the
simulation of ultrasound images in the final simulator prototype. The document also
described some of the major problems encountered during the development phase and the
solutions that were implemented to overcome these problems.
2 Introduction
2.1 Context
Ultrasound images can be simulated using different approaches. The two major groups are
interpolative and generative. Both approaches have advantages and disadvantages,
depending on the aim of the simulation. These will be discussed in the following.
Interpolative approaches: generate ultrasound images by taking samples of real pre-
acquired ultrasonic images. These images must be pre-processed, aligned and stitched
together, to create a volumetric data set from which slices are taken to synthesize the new
images. Aligning the real images is not a trivial task, since ultrasound acquisition is done
manually. Special equipment, such as trackers or robots can help during the acquisition to
facilitate the alignment process. Once the images are aligned, inevitably, gaps and areas
where no information is available will exist. The missing information is filled by interpolating
nearby values, hence the name of the approach. During simulation, new images are created
by sampling this volume according to the position and orientation of the virtual ultrasound
probe, resulting in a very fast simulation. Furthermore, the generated images can look very
realistic, however, only if the position and orientation of the virtual probe matches the position
and orientation of the real probe during image acquisition. Additionally, some of the effects,
such as shadowing, which depend on the acoustic properties of tissue, are not simulated
since this information is not available. Additionally, because the appearance of these effects
depends on the position and direction of the US probe, when the effects of the original
images are used, the results are, in most of the cases, wrong.
Generative approaches: simulate sound propagation with accurate wave models and their
interaction with tissue. These approaches try to model the complete interaction of the wave
front with the medium, resulting in more accurate simulations that may require numerical
solutions for partial differential equations or other resource intensive calculations. One
advantage generative approaches have over interpolative approaches is that the underlying
geometry is not directly derived from real US images; in fact, the approach focuses on
modeling the propagation independently of the shape and geometry of the models. It is
common with generative approaches to see examples that use simple artificial shapes, such
Page 6
FP7-ICT-2013-10 - 4.3 - Ultrasound Simulation Component
Project No.
610425 Deliverable Report
D4.3, 31/10/2015, Revision: Final version
Page 6 of 23
REC_TL01_Deliverables_V01_20140101 2015-10-30
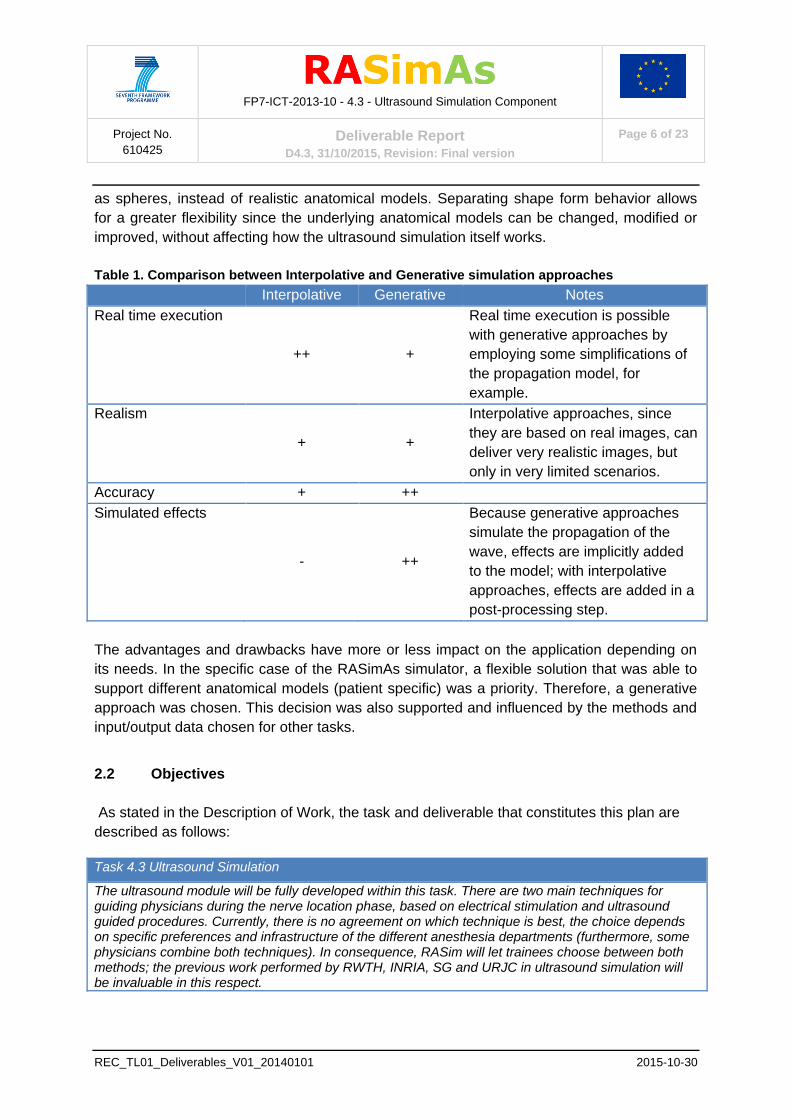
as spheres, instead of realistic anatomical models. Separating shape form behavior allows
for a greater flexibility since the underlying anatomical models can be changed, modified or
improved, without affecting how the ultrasound simulation itself works.
Table 1. Comparison between Interpolative and Generative simulation approaches
Interpolative Generative Notes
Real time execution
++ +
Real time execution is possible
with generative approaches by
employing some simplifications of
the propagation model, for
example.
Realism
+ +
Interpolative approaches, since
they are based on real images, can
deliver very realistic images, but
only in very limited scenarios.
Accuracy + ++
Simulated effects
- ++
Because generative approaches
simulate the propagation of the
wave, effects are implicitly added
to the model; with interpolative
approaches, effects are added in a
post-processing step.
The advantages and drawbacks have more or less impact on the application depending on
its needs. In the specific case of the RASimAs simulator, a flexible solution that was able to
support different anatomical models (patient specific) was a priority. Therefore, a generative
approach was chosen. This decision was also supported and influenced by the methods and
input/output data chosen for other tasks.
2.2 Objectives
As stated in the Description of Work, the task and deliverable that constitutes this plan are
described as follows:
Task 4.3 Ultrasound Simulation
The ultrasound module will be fully developed within this task. There are two main techniques for guiding physicians during the nerve location phase, based on electrical stimulation and ultrasound guided procedures. Currently, there is no agreement on which technique is best, the choice depends on specific preferences and infrastructure of the different anesthesia departments (furthermore, some physicians combine both techniques). In consequence, RASim will let trainees choose between both methods; the previous work performed by RWTH, INRIA, SG and URJC in ultrasound simulation will be invaluable in this respect.
Page 7
FP7-ICT-2013-10 - 4.3 - Ultrasound Simulation Component
Project No.
610425 Deliverable Report
D4.3, 31/10/2015, Revision: Final version
Page 7 of 23
REC_TL01_Deliverables_V01_20140101 2015-10-30
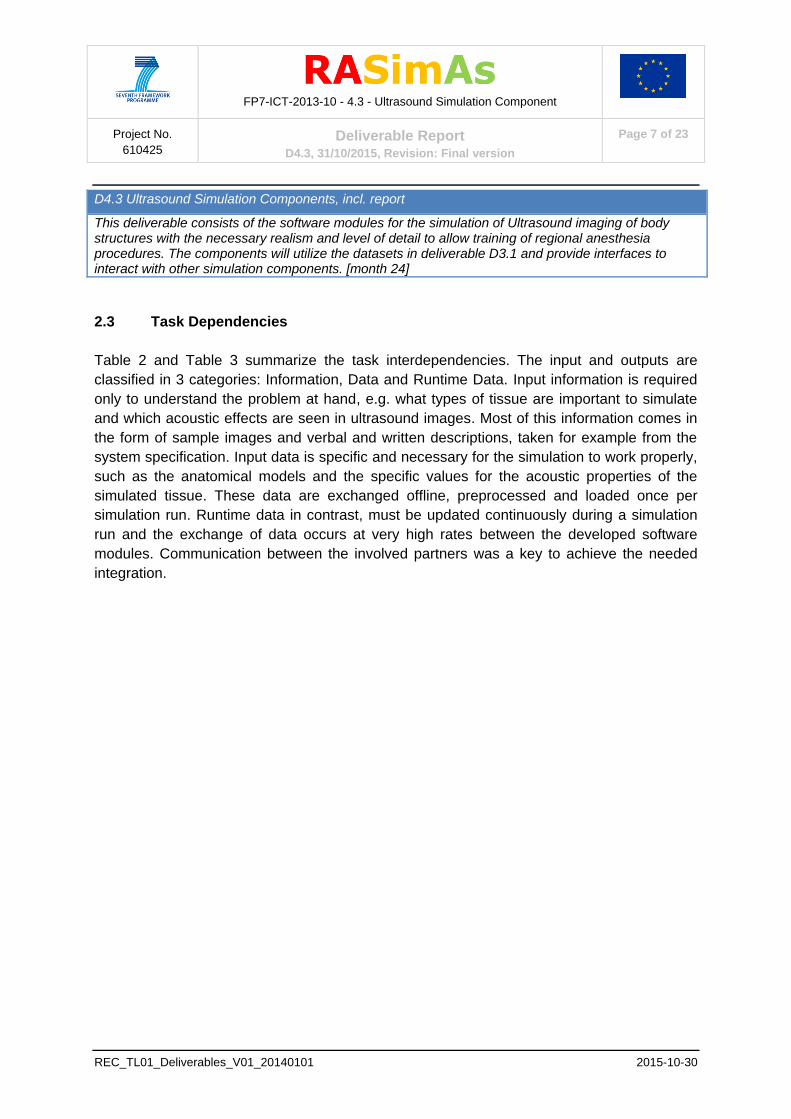
D4.3 Ultrasound Simulation Components, incl. report
This deliverable consists of the software modules for the simulation of Ultrasound imaging of body structures with the necessary realism and level of detail to allow training of regional anesthesia procedures. The components will utilize the datasets in deliverable D3.1 and provide interfaces to interact with other simulation components. [month 24]
2.3 Task Dependencies
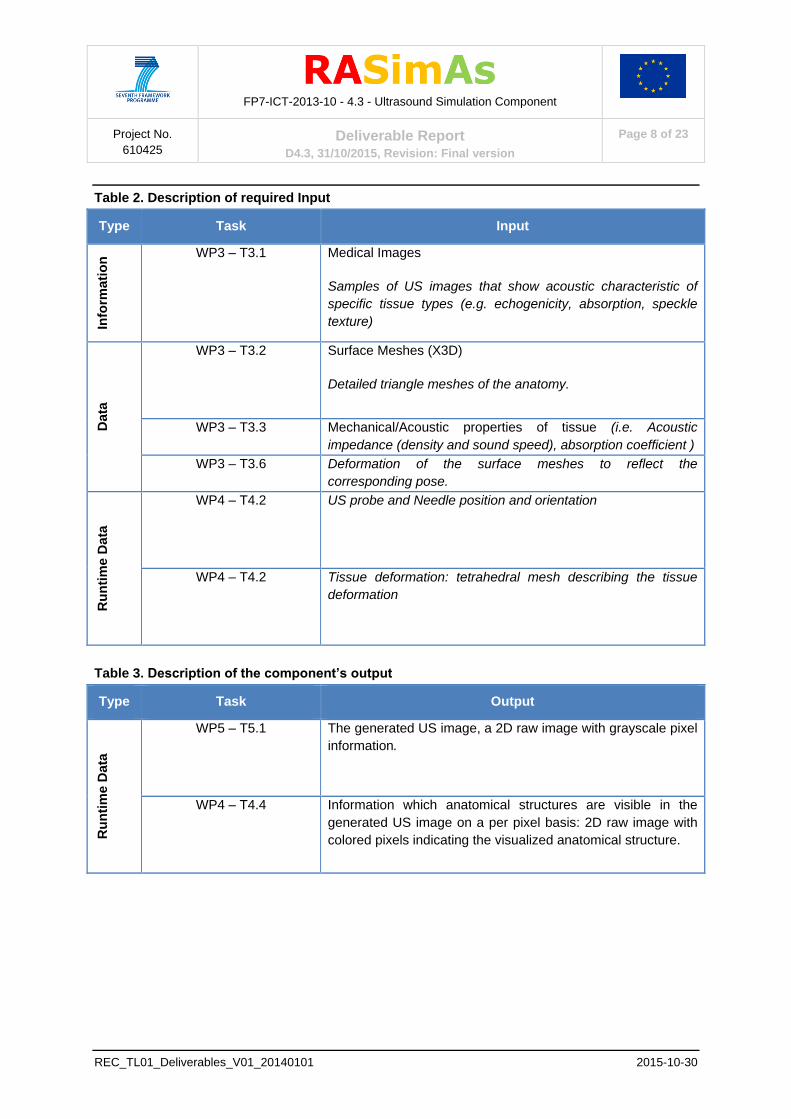
Table 2 and Table 3 summarize the task interdependencies. The input and outputs are
classified in 3 categories: Information, Data and Runtime Data. Input information is required
only to understand the problem at hand, e.g. what types of tissue are important to simulate
and which acoustic effects are seen in ultrasound images. Most of this information comes in
the form of sample images and verbal and written descriptions, taken for example from the
system specification. Input data is specific and necessary for the simulation to work properly,
such as the anatomical models and the specific values for the acoustic properties of the
simulated tissue. These data are exchanged offline, preprocessed and loaded once per
simulation run. Runtime data in contrast, must be updated continuously during a simulation
run and the exchange of data occurs at very high rates between the developed software
modules. Communication between the involved partners was a key to achieve the needed
integration.
Page 8
FP7-ICT-2013-10 - 4.3 - Ultrasound Simulation Component
Project No.
610425 Deliverable Report
D4.3, 31/10/2015, Revision: Final version
Page 8 of 23
REC_TL01_Deliverables_V01_20140101 2015-10-30
Table 2. Description of required Input
Table 3. Description of the component’s output
Type Task Input
Info
rma
tio
n WP3 – T3.1 Medical Images
Samples of US images that show acoustic characteristic of
specific tissue types (e.g. echogenicity, absorption, speckle
texture)
Da
ta
WP3 – T3.2 Surface Meshes (X3D)
Detailed triangle meshes of the anatomy.
WP3 – T3.3 Mechanical/Acoustic properties of tissue (i.e. Acoustic
impedance (density and sound speed), absorption coefficient )
WP3 – T3.6 Deformation of the surface meshes to reflect the
corresponding pose.
Ru
nti
me
Da
ta
WP4 – T4.2 US probe and Needle position and orientation
WP4 – T4.2 Tissue deformation: tetrahedral mesh describing the tissue
deformation
Type Task Output
Ru
nti
me
Da
ta
WP5 – T5.1 The generated US image, a 2D raw image with grayscale pixel
information.
WP4 – T4.4 Information which anatomical structures are visible in the
generated US image on a per pixel basis: 2D raw image with
colored pixels indicating the visualized anatomical structure.
Page 9
FP7-ICT-2013-10 - 4.3 - Ultrasound Simulation Component
Project No.
610425 Deliverable Report
D4.3, 31/10/2015, Revision: Final version
Page 9 of 23
REC_TL01_Deliverables_V01_20140101 2015-10-30
3 Progress towards objectives
3.1 Overview of Methods
The developed simulation method is based on a geometrical acoustics approach, which can
be classified as a generative approach. In geometrical acoustics, the sound wave is
approximated via rays that interact with the scene elements and are, thereby reflected,
refracted and scattered. These rays carry acoustic energy that can be absorbed or dissipated
during the rays’ interaction with the scene. This energy is also used to calculate the
intensities of the echoes and in consequence, the intensity of the pixels, to synthesize the
final image.
To achieve real-time execution, some of the most resource-intensive calculations and
operations are made offline during a configuration step. Specifically, in this step we generate:
an acoustic field corresponding to the beam and transducer properties, the 3-dimensional
textures that are used to simulate the speckle in ultrasound due to scattering, and auxiliary
data structures that accelerate the simulation process. These sub-steps will be described in
detail in the following sections.
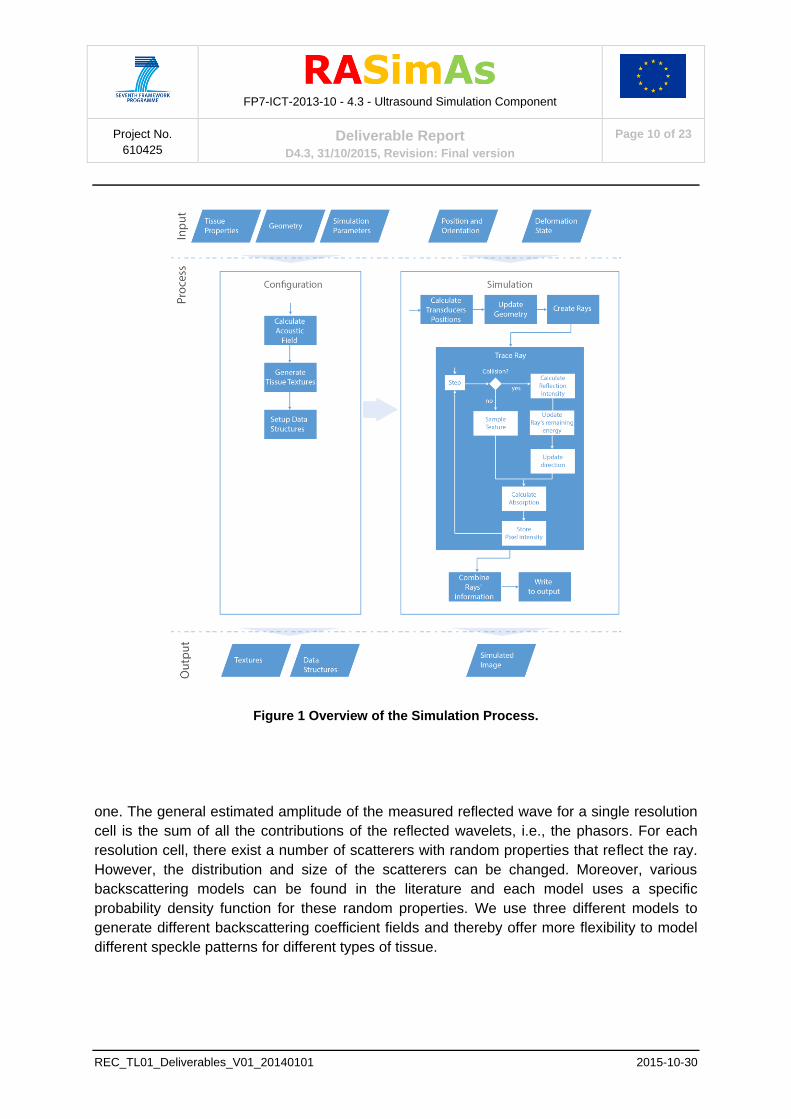
The complete process is depicted in Figure 1. During runtime, the current position and
orientation of the virtual probe are used to calculate the origins and directions of the acoustic
rays. These rays are traced into the scene, recording the estimated reflected energy (based
on known formula and a precomputed beam model) and the distance traveled to the tissue
interfaces. Additionally, the remaining transmitted energy, after absorption and reflection, is
computed. The information obtained by all rays is then combined into the final image.
3.2 Modeling of the tissue textures
One of the most prominent characteristics in B-Mode ultrasound images is their noisy
appearance. This characteristic noise, called speckle, is in reality produced by
inhomogeneities within a material or tissue that are smaller than the wavelength. The
inhomogeneities, or scatterers, cause small perturbations or reflections in the waves' phases.
Such reflected wavelets arrive at the observation point at different times and cause
constructive or destructive interference producing small local attenuation or amplification of
the ultrasonic waves. Speckle patterns depend on the size and distribution of the scatterers
within the tissue and different types of tissue present different patterns that are used by
experts to identify the corresponding tissue type; therefore, it is important for a realistic
simulation to reproduce these patterns as accurately as possible.
The developed method, starts by creating a 3D field, assuming a random number of
scatterers within a so-called resolution cell. This cell is the minimum unit of detail that can be
resolved by the transducers, this means that objects that share the same cell will be seen as
Page 10
FP7-ICT-2013-10 - 4.3 - Ultrasound Simulation Component
Project No.
610425 Deliverable Report
D4.3, 31/10/2015, Revision: Final version
Page 10 of 23
REC_TL01_Deliverables_V01_20140101 2015-10-30
Figure 1 Overview of the Simulation Process.
one. The general estimated amplitude of the measured reflected wave for a single resolution
cell is the sum of all the contributions of the reflected wavelets, i.e., the phasors. For each
resolution cell, there exist a number of scatterers with random properties that reflect the ray.
However, the distribution and size of the scatterers can be changed. Moreover, various
backscattering models can be found in the literature and each model uses a specific
probability density function for these random properties. We use three different models to
generate different backscattering coefficient fields and thereby offer more flexibility to model
different speckle patterns for different types of tissue.
Page 11
FP7-ICT-2013-10 - 4.3 - Ultrasound Simulation Component
Project No.
610425 Deliverable Report
D4.3, 31/10/2015, Revision: Final version
Page 11 of 23
REC_TL01_Deliverables_V01_20140101 2015-10-30
3.3 Modeling of the Ultrasound beam
Real ultrasound probes, commonly created by grouping a number of small transducers
(devices that convert electrical energy to acoustic energy and vice-versa), the ultrasonic
beam is not a perfect straight and focused beam, as a laser would be, but is actually more
similar to the light from a flashlight, that expands away from its axis as it travels farther from
the source. Focused beams can be formed, but also expand beyond the focus area. The
shape of the beam can be changed in different ways. One option is to physically add lenses
to focus the beam, but this is impractical since the focus point and shape of the beam would
be fixed. The second option is to activate groups of transducers with different time delays
with respect to one another. The difference in phases will cause constructive interference
towards a focus point, increasing the wave intensity and therefore, the echoes' intensities
coming from that area. These so-called phased arrays allow controlling the delays to focus or
redirect the beam (mostly used in curvilinear arrays) to a point or area of interest. The
focusing and general shape of the beam has an effect on the resulting US image and thus is
also considered in the simulation pipeline.
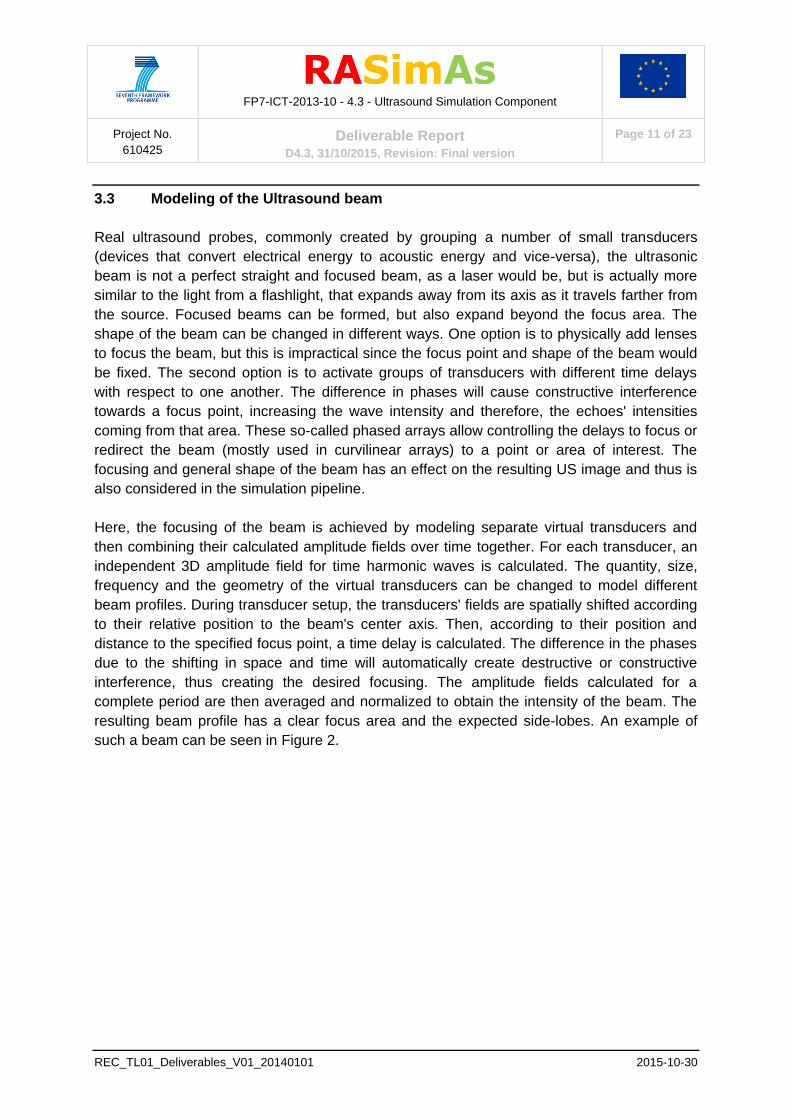
Here, the focusing of the beam is achieved by modeling separate virtual transducers and
then combining their calculated amplitude fields over time together. For each transducer, an
independent 3D amplitude field for time harmonic waves is calculated. The quantity, size,
frequency and the geometry of the virtual transducers can be changed to model different
beam profiles. During transducer setup, the transducers' fields are spatially shifted according
to their relative position to the beam's center axis. Then, according to their position and
distance to the specified focus point, a time delay is calculated. The difference in the phases
due to the shifting in space and time will automatically create destructive or constructive
interference, thus creating the desired focusing. The amplitude fields calculated for a
complete period are then averaged and normalized to obtain the intensity of the beam. The
resulting beam profile has a clear focus area and the expected side-lobes. An example of
such a beam can be seen in Figure 2.
Page 12
FP7-ICT-2013-10 - 4.3 - Ultrasound Simulation Component
Project No.
610425 Deliverable Report
D4.3, 31/10/2015, Revision: Final version
Page 12 of 23
REC_TL01_Deliverables_V01_20140101 2015-10-30
Figure 2 An example of a 3-dimensional model of the ultrasonic beam.
3.4 Ultrasound propagation
In geometrical acoustics, the behavior of the sound wave is approximated with energy
transporting rays [Vor08]. In this approach, the wavefront is treated as a series of rays that
behave in a similar way to a light ray. That is, sound rays are reflected, refracted,
transmitted, absorbed or scattered according to changes in their speed and differences in
media density as they travel in, through and out of them. The process starts by creating and
configuring each of the rays that are traced into the scene. The total wave energy is divided
among all the rays of the same virtual transducer. The rays' origin and direction are
determined from each virtual transducer, which obtain their position and orientation based on
the virtual tool's position and orientation and the Virtual Probe geometry (linear or curved).
Each ray of each of the virtual transducers is traced into the scene (composed of surface
meshes, volumetric data, or both) searching for intersections, or tissue interfaces. Once an
Page 13
FP7-ICT-2013-10 - 4.3 - Ultrasound Simulation Component
Project No.
610425 Deliverable Report
D4.3, 31/10/2015, Revision: Final version
Page 13 of 23
REC_TL01_Deliverables_V01_20140101 2015-10-30
interface is found, the process is divided into two parts. The first part handles the simulation
of the tissue's texture and scattering, absorption and enhancement of the US wave from the
current position to the newly-found interface. The second part handles the effects at the
tissue interface, namely, reflections, refraction and reverberation.
3.5 Image formation
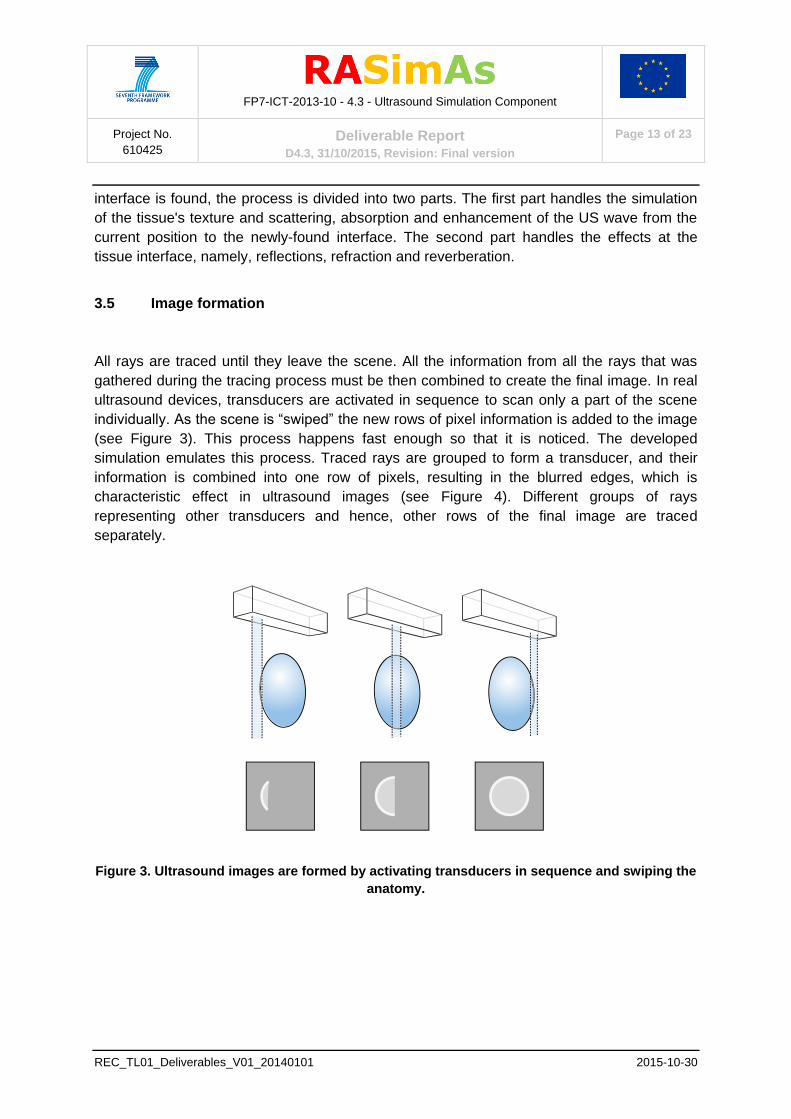
All rays are traced until they leave the scene. All the information from all the rays that was
gathered during the tracing process must be then combined to create the final image. In real
ultrasound devices, transducers are activated in sequence to scan only a part of the scene
individually. As the scene is “swiped” the new rows of pixel information is added to the image
(see Figure 3). This process happens fast enough so that it is noticed. The developed
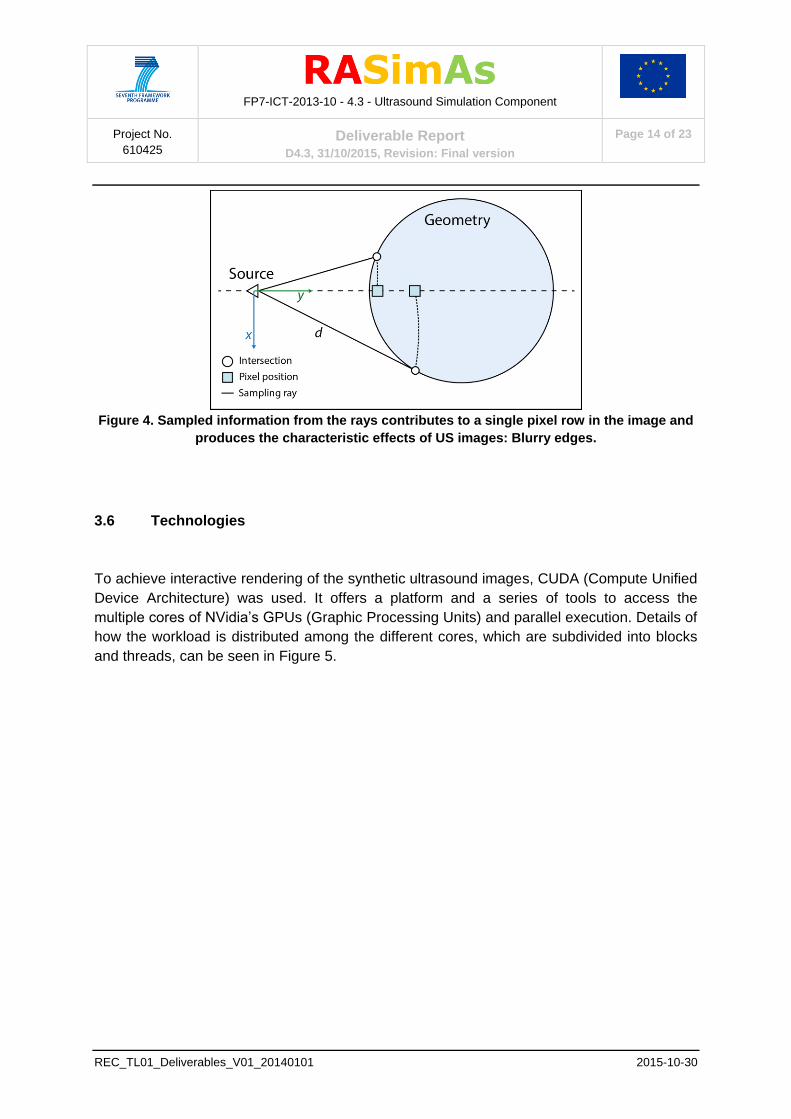
simulation emulates this process. Traced rays are grouped to form a transducer, and their
information is combined into one row of pixels, resulting in the blurred edges, which is
characteristic effect in ultrasound images (see Figure 4). Different groups of rays
representing other transducers and hence, other rows of the final image are traced
separately.
Figure 3. Ultrasound images are formed by activating transducers in sequence and swiping the
anatomy.
Page 14
FP7-ICT-2013-10 - 4.3 - Ultrasound Simulation Component
Project No.
610425 Deliverable Report
D4.3, 31/10/2015, Revision: Final version
Page 14 of 23
REC_TL01_Deliverables_V01_20140101 2015-10-30
Figure 4. Sampled information from the rays contributes to a single pixel row in the image and
produces the characteristic effects of US images: Blurry edges.
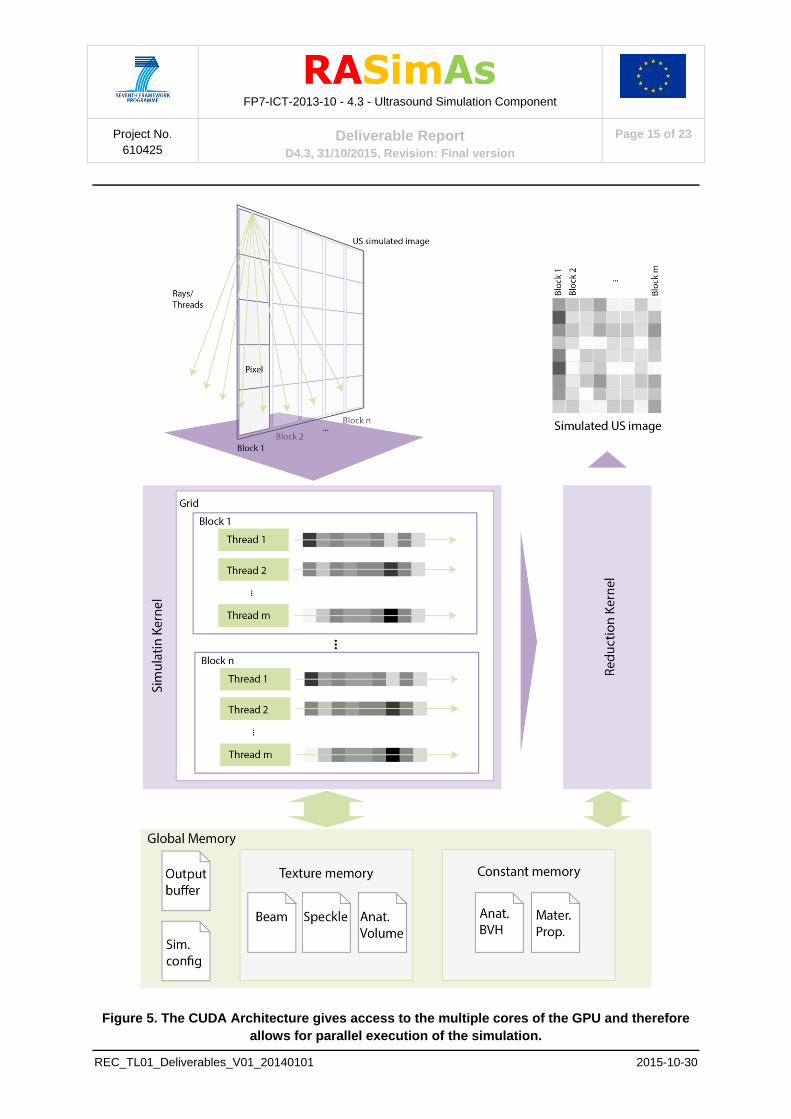
3.6 Technologies
To achieve interactive rendering of the synthetic ultrasound images, CUDA (Compute Unified
Device Architecture) was used. It offers a platform and a series of tools to access the
multiple cores of NVidia’s GPUs (Graphic Processing Units) and parallel execution. Details of
how the workload is distributed among the different cores, which are subdivided into blocks
and threads, can be seen in Figure 5.
Page 15
FP7-ICT-2013-10 - 4.3 - Ultrasound Simulation Component
Project No.
610425 Deliverable Report
D4.3, 31/10/2015, Revision: Final version
Page 15 of 23
REC_TL01_Deliverables_V01_20140101 2015-10-30
Figure 5. The CUDA Architecture gives access to the multiple cores of the GPU and therefore
allows for parallel execution of the simulation.
Page 16
FP7-ICT-2013-10 - 4.3 - Ultrasound Simulation Component
Project No.
610425 Deliverable Report
D4.3, 31/10/2015, Revision: Final version
Page 16 of 23
REC_TL01_Deliverables_V01_20140101 2015-10-30
3.7 Key Features
Beside the mentioned requirements of interactivity and fidelity, the Ultrasound simulation
component had to fulfill the following requirements.
3.7.1 Handling Tissue deformation
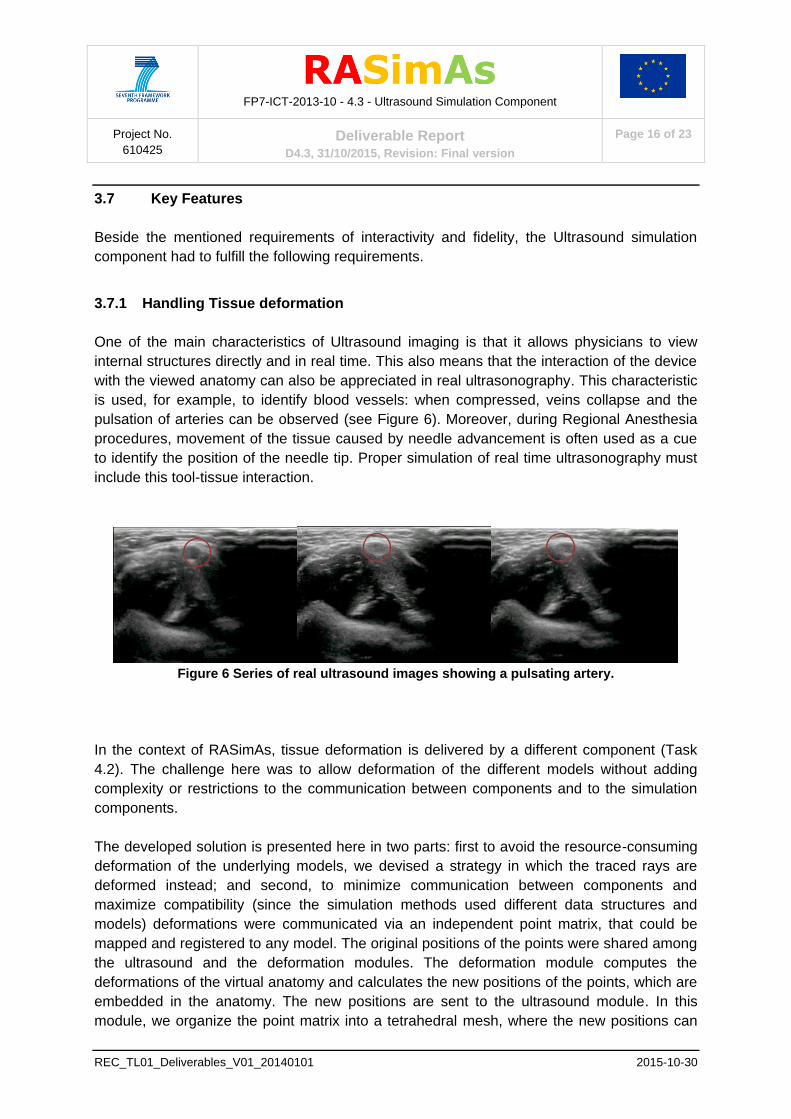
One of the main characteristics of Ultrasound imaging is that it allows physicians to view
internal structures directly and in real time. This also means that the interaction of the device
with the viewed anatomy can also be appreciated in real ultrasonography. This characteristic
is used, for example, to identify blood vessels: when compressed, veins collapse and the
pulsation of arteries can be observed (see Figure 6). Moreover, during Regional Anesthesia
procedures, movement of the tissue caused by needle advancement is often used as a cue
to identify the position of the needle tip. Proper simulation of real time ultrasonography must
include this tool-tissue interaction.
Figure 6 Series of real ultrasound images showing a pulsating artery.
In the context of RASimAs, tissue deformation is delivered by a different component (Task
4.2). The challenge here was to allow deformation of the different models without adding
complexity or restrictions to the communication between components and to the simulation
components.
The developed solution is presented here in two parts: first to avoid the resource-consuming
deformation of the underlying models, we devised a strategy in which the traced rays are
deformed instead; and second, to minimize communication between components and
maximize compatibility (since the simulation methods used different data structures and
models) deformations were communicated via an independent point matrix, that could be
mapped and registered to any model. The original positions of the points were shared among
the ultrasound and the deformation modules. The deformation module computes the
deformations of the virtual anatomy and calculates the new positions of the points, which are
embedded in the anatomy. The new positions are sent to the ultrasound module. In this
module, we organize the point matrix into a tetrahedral mesh, where the new positions can
Page 17
FP7-ICT-2013-10 - 4.3 - Ultrasound Simulation Component
Project No.
610425 Deliverable Report
D4.3, 31/10/2015, Revision: Final version
Page 17 of 23
REC_TL01_Deliverables_V01_20140101 2015-10-30
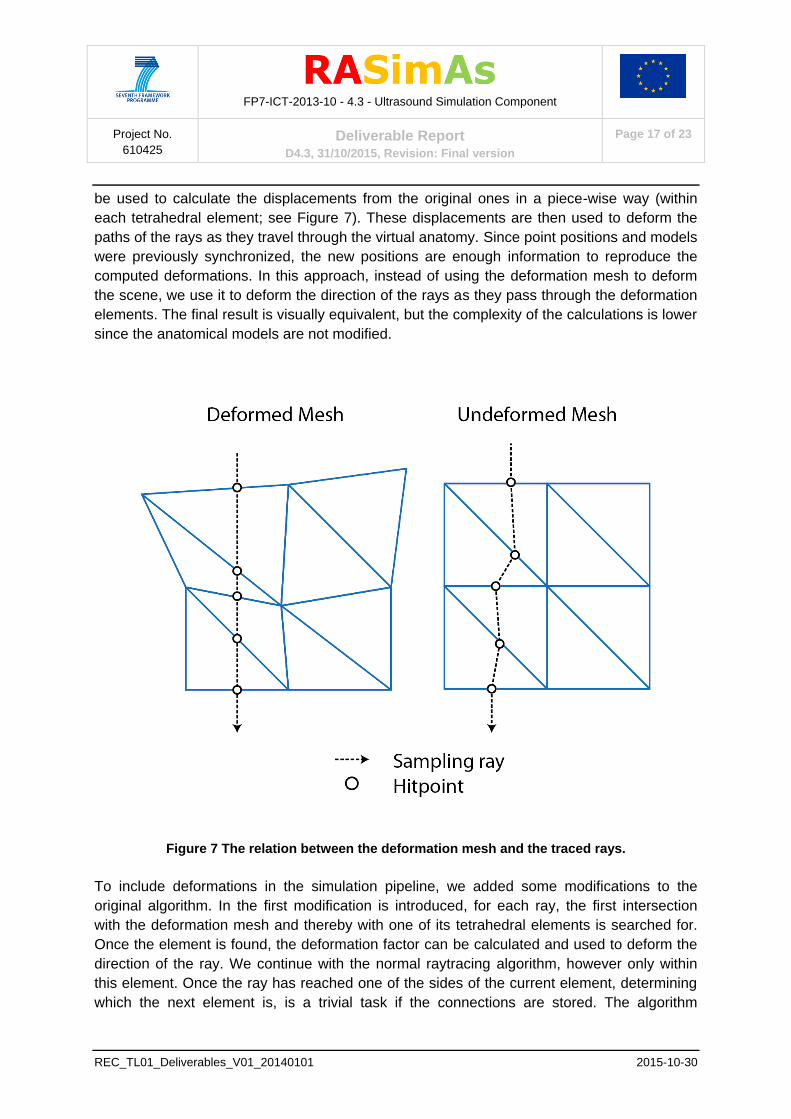
be used to calculate the displacements from the original ones in a piece-wise way (within
each tetrahedral element; see Figure 7). These displacements are then used to deform the
paths of the rays as they travel through the virtual anatomy. Since point positions and models
were previously synchronized, the new positions are enough information to reproduce the
computed deformations. In this approach, instead of using the deformation mesh to deform
the scene, we use it to deform the direction of the rays as they pass through the deformation
elements. The final result is visually equivalent, but the complexity of the calculations is lower
since the anatomical models are not modified.
Figure 7 The relation between the deformation mesh and the traced rays.
To include deformations in the simulation pipeline, we added some modifications to the
original algorithm. In the first modification is introduced, for each ray, the first intersection
with the deformation mesh and thereby with one of its tetrahedral elements is searched for.
Once the element is found, the deformation factor can be calculated and used to deform the
direction of the ray. We continue with the normal raytracing algorithm, however only within
this element. Once the ray has reached one of the sides of the current element, determining
which the next element is, is a trivial task if the connections are stored. The algorithm
Page 18
FP7-ICT-2013-10 - 4.3 - Ultrasound Simulation Component
Project No.
610425 Deliverable Report
D4.3, 31/10/2015, Revision: Final version
Page 18 of 23
REC_TL01_Deliverables_V01_20140101 2015-10-30
continues in these manner traversing the deformation mesh until it reaches its end, or in
other words, until there is no next element.
3.7.2 Parameterization
For the Ultrasound module, it was not only necessary to be able to simulate ultrasound
images interactively, but also, the simulation had to be configurable in a similar way as real
devices are. Based on the specification of the courseware and training scenarios, the
following parameters were chosen: depth, brightness (gain) and contrast (dynamic range).
However, other parameters that control how the simulation works are configurable as well.
These include frequency, transducer geometry, and number of rays per virtual transducer.
Additionally, the acoustic properties of the virtual tissue (i.e. acoustic impedance and
absorption coefficient) may also be modified in real time. This feature is however, used only
during development to fine-tune the simulation and is not accessible to the final user.
3.7.3 Multimodality
The ultrasound simulation module was designed to be able to support different data
modalities and formats since the prototype was expected to work with different types of input
data.
3.7.4 Annotations
In addition to the synthetic ultrasound images, the ultrasound module simultaneously
produces images of the cross-section of the virtual anatomy that is being used to generate
the simulated images. This cross-sectional view is color-coded to show the different types of
tissue that are being displayed. This additional image is not shown to the end users, but is
used by the courseware as a ground truth in various learning tasks. For example, one of the
exercises asks the users to point at different landmarks on the simulated image; the answer
can be more easily checked using the provided color-coded cross-sectional image.
Page 19
FP7-ICT-2013-10 - 4.3 - Ultrasound Simulation Component
Project No.
610425 Deliverable Report
D4.3, 31/10/2015, Revision: Final version
Page 19 of 23
REC_TL01_Deliverables_V01_20140101 2015-10-30
4 Deviations/Problems
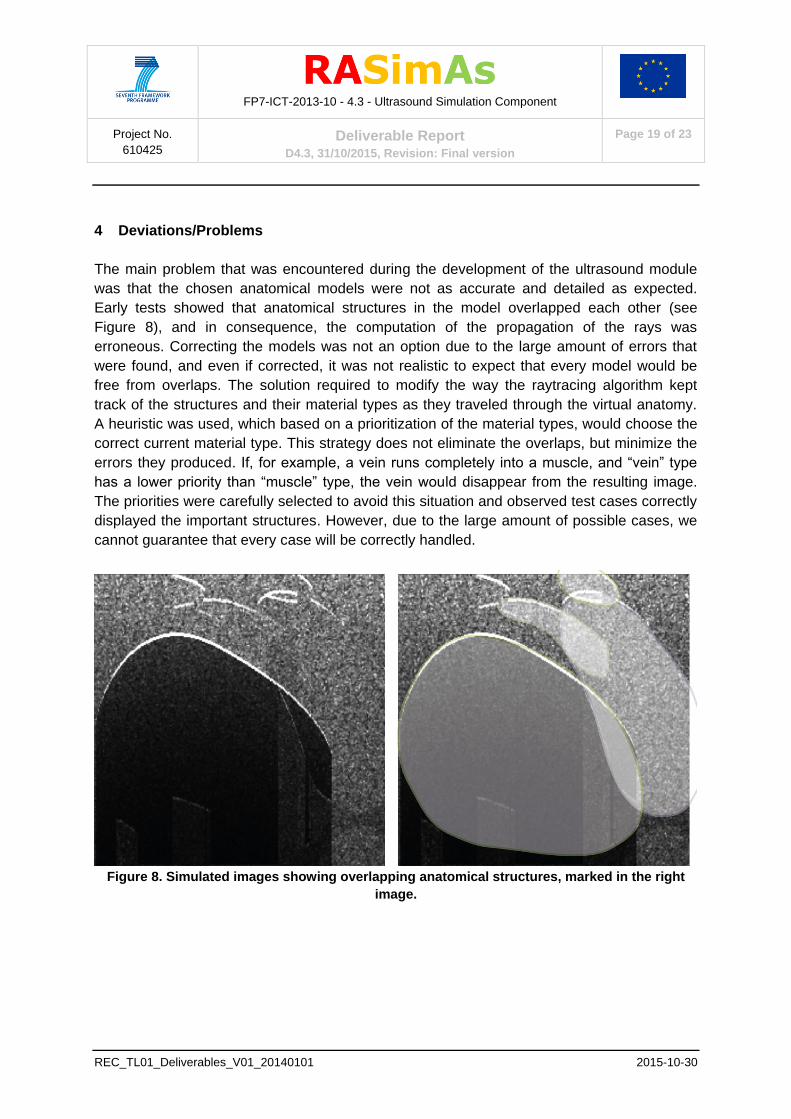
The main problem that was encountered during the development of the ultrasound module
was that the chosen anatomical models were not as accurate and detailed as expected.
Early tests showed that anatomical structures in the model overlapped each other (see
Figure 8), and in consequence, the computation of the propagation of the rays was
erroneous. Correcting the models was not an option due to the large amount of errors that
were found, and even if corrected, it was not realistic to expect that every model would be
free from overlaps. The solution required to modify the way the raytracing algorithm kept
track of the structures and their material types as they traveled through the virtual anatomy.
A heuristic was used, which based on a prioritization of the material types, would choose the
correct current material type. This strategy does not eliminate the overlaps, but minimize the
errors they produced. If, for example, a vein runs completely into a muscle, and “vein” type
has a lower priority than “muscle” type, the vein would disappear from the resulting image.
The priorities were carefully selected to avoid this situation and observed test cases correctly
displayed the important structures. However, due to the large amount of possible cases, we
cannot guarantee that every case will be correctly handled.
Figure 8. Simulated images showing overlapping anatomical structures, marked in the right
image.
Page 20
FP7-ICT-2013-10 - 4.3 - Ultrasound Simulation Component
Project No.
610425 Deliverable Report
D4.3, 31/10/2015, Revision: Final version
Page 20 of 23
REC_TL01_Deliverables_V01_20140101 2015-10-30
4.1 Level of detail
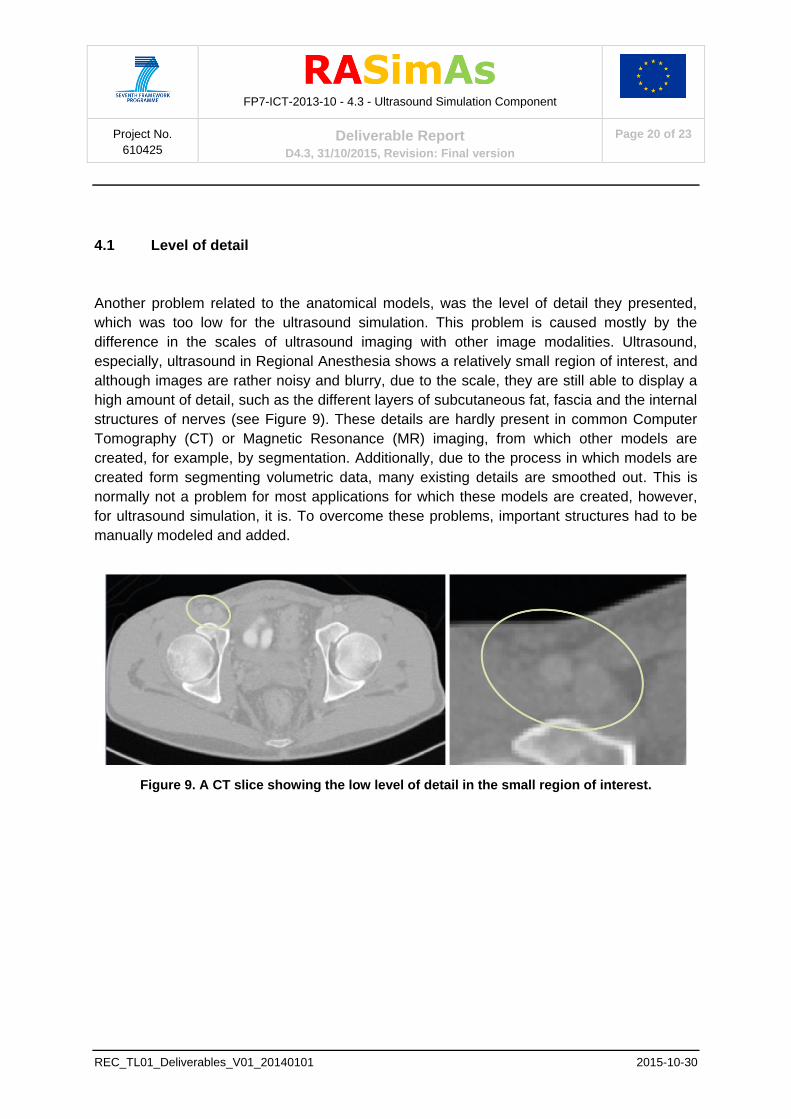
Another problem related to the anatomical models, was the level of detail they presented,
which was too low for the ultrasound simulation. This problem is caused mostly by the
difference in the scales of ultrasound imaging with other image modalities. Ultrasound,
especially, ultrasound in Regional Anesthesia shows a relatively small region of interest, and
although images are rather noisy and blurry, due to the scale, they are still able to display a
high amount of detail, such as the different layers of subcutaneous fat, fascia and the internal
structures of nerves (see Figure 9). These details are hardly present in common Computer
Tomography (CT) or Magnetic Resonance (MR) imaging, from which other models are
created, for example, by segmentation. Additionally, due to the process in which models are
created form segmenting volumetric data, many existing details are smoothed out. This is
normally not a problem for most applications for which these models are created, however,
for ultrasound simulation, it is. To overcome these problems, important structures had to be
manually modeled and added.
Figure 9. A CT slice showing the low level of detail in the small region of interest.
Page 21
FP7-ICT-2013-10 - 4.3 - Ultrasound Simulation Component
Project No.
610425 Deliverable Report
D4.3, 31/10/2015, Revision: Final version
Page 21 of 23
REC_TL01_Deliverables_V01_20140101 2015-10-30
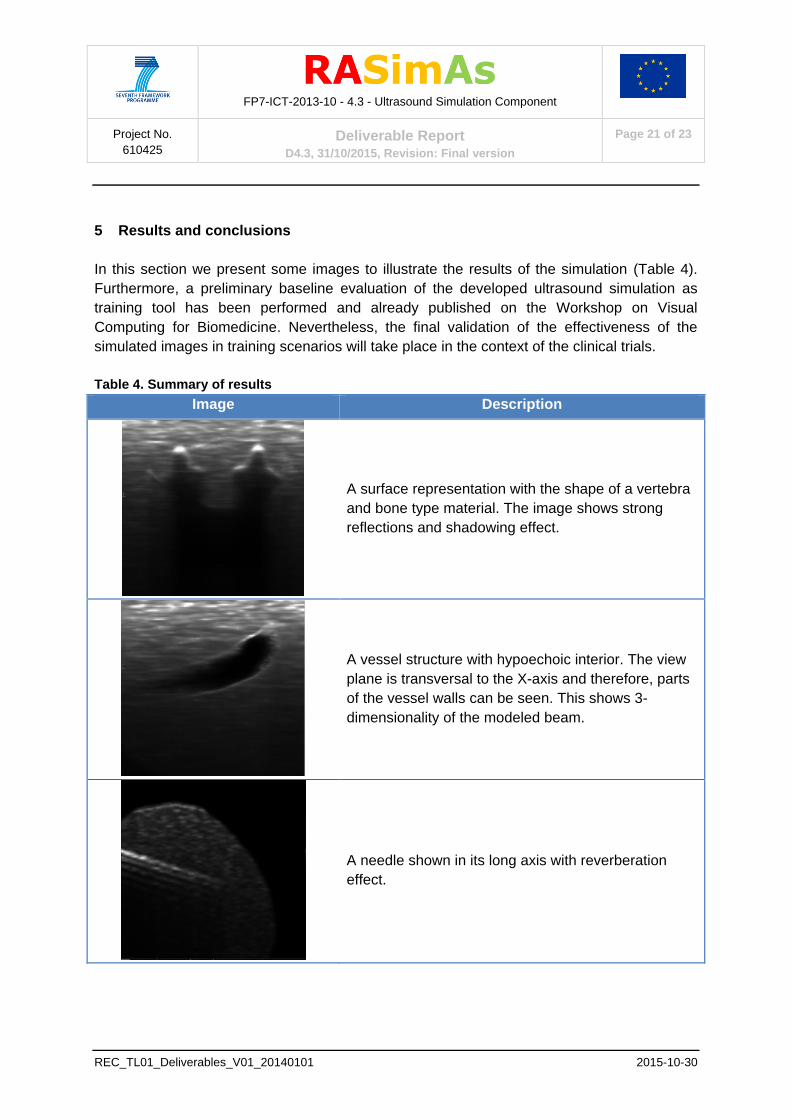
5 Results and conclusions
In this section we present some images to illustrate the results of the simulation (Table 4).
Furthermore, a preliminary baseline evaluation of the developed ultrasound simulation as
training tool has been performed and already published on the Workshop on Visual
Computing for Biomedicine. Nevertheless, the final validation of the effectiveness of the
simulated images in training scenarios will take place in the context of the clinical trials.
Table 4. Summary of results
Image Description
A surface representation with the shape of a vertebra
and bone type material. The image shows strong
reflections and shadowing effect.
A vessel structure with hypoechoic interior. The view
plane is transversal to the X-axis and therefore, parts
of the vessel walls can be seen. This shows 3-
dimensionality of the modeled beam.
A needle shown in its long axis with reverberation
effect.
Page 22
FP7-ICT-2013-10 - 4.3 - Ultrasound Simulation Component
Project No.
610425 Deliverable Report
D4.3, 31/10/2015, Revision: Final version
Page 22 of 23
REC_TL01_Deliverables_V01_20140101 2015-10-30
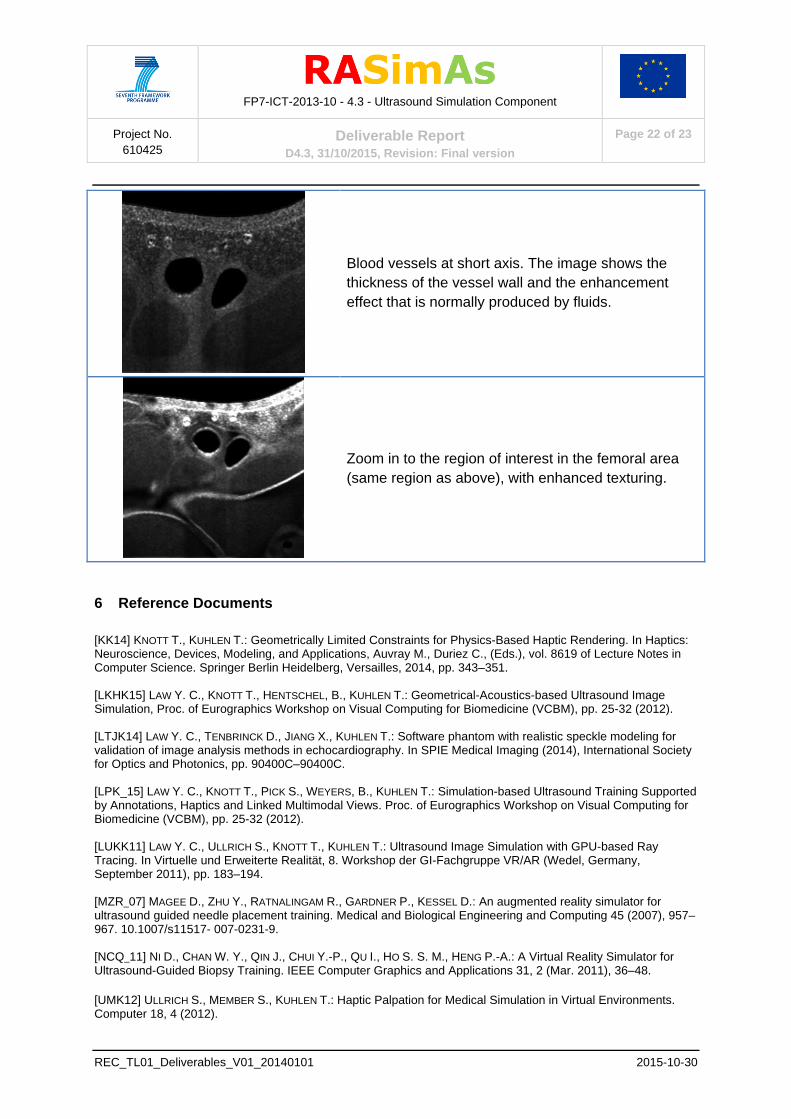
Blood vessels at short axis. The image shows the
thickness of the vessel wall and the enhancement
effect that is normally produced by fluids.
Zoom in to the region of interest in the femoral area
(same region as above), with enhanced texturing.
6 Reference Documents
[KK14] KNOTT T., KUHLEN T.: Geometrically Limited Constraints for Physics-Based Haptic Rendering. In Haptics: Neuroscience, Devices, Modeling, and Applications, Auvray M., Duriez C., (Eds.), vol. 8619 of Lecture Notes in Computer Science. Springer Berlin Heidelberg, Versailles, 2014, pp. 343–351. [LKHK15] LAW Y. C., KNOTT T., HENTSCHEL, B., KUHLEN T.: Geometrical-Acoustics-based Ultrasound Image Simulation, Proc. of Eurographics Workshop on Visual Computing for Biomedicine (VCBM), pp. 25-32 (2012). [LTJK14] LAW Y. C., TENBRINCK D., JIANG X., KUHLEN T.: Software phantom with realistic speckle modeling for validation of image analysis methods in echocardiography. In SPIE Medical Imaging (2014), International Society for Optics and Photonics, pp. 90400C–90400C. [LPK_15] LAW Y. C., KNOTT T., PICK S., WEYERS, B., KUHLEN T.: Simulation-based Ultrasound Training Supported by Annotations, Haptics and Linked Multimodal Views. Proc. of Eurographics Workshop on Visual Computing for Biomedicine (VCBM), pp. 25-32 (2012). [LUKK11] LAW Y. C., ULLRICH S., KNOTT T., KUHLEN T.: Ultrasound Image Simulation with GPU-based Ray Tracing. In Virtuelle und Erweiterte Realität, 8. Workshop der GI-Fachgruppe VR/AR (Wedel, Germany, September 2011), pp. 183–194. [MZR_07] MAGEE D., ZHU Y., RATNALINGAM R., GARDNER P., KESSEL D.: An augmented reality simulator for ultrasound guided needle placement training. Medical and Biological Engineering and Computing 45 (2007), 957–967. 10.1007/s11517- 007-0231-9. [NCQ_11] NI D., CHAN W. Y., QIN J., CHUI Y.-P., QU I., HO S. S. M., HENG P.-A.: A Virtual Reality Simulator for Ultrasound-Guided Biopsy Training. IEEE Computer Graphics and Applications 31, 2 (Mar. 2011), 36–48.
[UMK12] ULLRICH S., MEMBER S., KUHLEN T.: Haptic Palpation for Medical Simulation in Virtual Environments. Computer 18, 4 (2012).
Page 23
FP7-ICT-2013-10 - 4.3 - Ultrasound Simulation Component
Project No.
610425 Deliverable Report
D4.3, 31/10/2015, Revision: Final version
Page 23 of 23
REC_TL01_Deliverables_V01_20140101 2015-10-30
[VHGJ08] VIDAL F., HEALEY A., GOULD D., JOHN N.: Simulation of ultrasound guided needle puncture using patient specific data with 3D textures and volume haptics. Computer Animation and Virtual Worlds 19, 2 (2008), 111–127. [Vor08] VORLÄNDER M.: Auralization: fundamentals of acoustics, modelling, simulation, algorithms and acoustic virtual reality. RWTH edition (Berlin. Print). Springer, 2008.


![Report on Deliverable D4.3 [Human-Robot Interaction] Audition for RobotS (EARS) Deliverable D4.3 Human-Robot Interaction Grant Agreement No. 609465 Revision Draft, [November 11, 2016]](https://static.documents.pub/doc/80x56/5aa870347f8b9a86188b8993/report-on-deliverable-d43-human-robot-interaction-audition-for-robots-ears.jpg)
