+ All Categories
Home > Documents > DEM simulation of impact force exerted by granular flow on ... · RESEARCH PAPER DEM simulation of...

DEM simulation of impact force exerted by granular flow on ... · RESEARCH PAPER DEM simulation of...

Date post: 10-Sep-2019
Category:
Upload: others
View: 3 times
Download: 0 times
Share this document with a friend
15
RESEARCH PAPER DEM simulation of impact force exerted by granular flow on rigid structures H. Teufelsbauer Y. Wang S. P. Pudasaini R. I. Borja W. Wu Received: 25 January 2010 / Accepted: 19 May 2011 Ó Springer-Verlag 2011 Abstract The paper presents a DEM model for simulat- ing dry granular avalanche down an incline. Flow pattern and impact forces on rigid obstacles are considered. Results of the simulations are compared with experimental data reported in the literature. The experiments include granular flow along an inclined channel and three-dimensional free surface flow on an inclined chute merging into a horizontal run-out region. The introduction of the rotation constraint allows realistic description of the flow behavior. Parametric studies are carried out to show the effect of model parameters on granular flow, including the run-out dis- tance, deposition pattern, flow pattern, and impact forces against an obstacle. Keywords Avalanche DEM Granular flow Impact force 1 Introduction Gravity-driven flows including snow avalanches and debris flows are dangerous natural hazards in alpine regions. Estimation of flow velocity, run-out distance, and impact force on protection structures of such flows is still a chal- lenge. Practically proven and widely used snow avalanche and debris flow models are based on the principles of continuum mechanics for two-dimensional shallow flow down gently varying topographies in which the velocity distribution through the depth is assumed to be negligible [8, 19, 24, 34]. However, when there is a sudden change in field variables or topography, or when an obstacle is hit by the avalanche, these theories are too simplistic to accu- rately predict the flow dynamics in the vicinity of the obstacle. In practice, knowledge of avalanche velocities is usually sought around regions where intensive shear pre- vails, and where momentum transfer perpendicular to the sliding surface is significant. In these cases, three-dimen- sional extensions of the flow models are needed in order to accurately estimate the impact force on protection structures. An alternative approach to continuum modeling is pro- vided in this paper by a three-dimensional model based on discrete element method (DEM). DEM was introduced in geomechanics by Cundall and Strack [3] and was later adopted as a research tool by many other researchers [13, 17, 27, 30]. Since snow avalanche and debris flow can be regarded as granular flows [8, 18, 22, 34], DEM pro- vides an ideal tool for modeling such phenomena. In comparison to continuum shallow flow models, the pre- sented DEM model remains applicable to problems with complex topography and sudden change in field variables. Furthermore, the DEM approach allows accurate descrip- tion of the flow dynamics with few material parameters. H. Teufelsbauer Y. Wang W. Wu (&) Institute of Geotechnical Engineering, University of Natural Resources and Life Sciences, Feistmantelstr. 4, 1180 Vienna, Austria e-mail: [email protected] Y. Wang Department of Mechanical Engineering, Darmstadt University of Technology, Darmstadt, Germany S. P. Pudasaini School of Sciences, Katmandu University, Lalitpur, Nepal R. I. Borja Department of Civil and Environmental Engineering, Stanford University, Stanford, CA 94305-4020, USA 123 Acta Geotechnica DOI 10.1007/s11440-011-0140-9
Transcript

RESEARCH PAPER

DEM simulation of impact force exerted by granular flow on rigidstructures

H. Teufelsbauer • Y. Wang • S. P. Pudasaini •

R. I. Borja • W. Wu

Received: 25 January 2010 / Accepted: 19 May 2011

� Springer-Verlag 2011

Abstract The paper presents a DEM model for simulat-

ing dry granular avalanche down an incline. Flow pattern

and impact forces on rigid obstacles are considered. Results

of the simulations are compared with experimental data

reported in the literature. The experiments include granular

flow along an inclined channel and three-dimensional free

surface flow on an inclined chute merging into a horizontal

run-out region. The introduction of the rotation constraint

allows realistic description of the flow behavior. Parametric

studies are carried out to show the effect of model

parameters on granular flow, including the run-out dis-

tance, deposition pattern, flow pattern, and impact forces

against an obstacle.

Keywords Avalanche � DEM � Granular flow �Impact force

1 Introduction

Gravity-driven flows including snow avalanches and debris

flows are dangerous natural hazards in alpine regions.

Estimation of flow velocity, run-out distance, and impact

force on protection structures of such flows is still a chal-

lenge. Practically proven and widely used snow avalanche

and debris flow models are based on the principles of

continuum mechanics for two-dimensional shallow flow

down gently varying topographies in which the velocity

distribution through the depth is assumed to be negligible

[8, 19, 24, 34]. However, when there is a sudden change in

field variables or topography, or when an obstacle is hit by

the avalanche, these theories are too simplistic to accu-

rately predict the flow dynamics in the vicinity of the

obstacle. In practice, knowledge of avalanche velocities is

usually sought around regions where intensive shear pre-

vails, and where momentum transfer perpendicular to the

sliding surface is significant. In these cases, three-dimen-

sional extensions of the flow models are needed in order

to accurately estimate the impact force on protection

structures.

An alternative approach to continuum modeling is pro-

vided in this paper by a three-dimensional model based on

discrete element method (DEM). DEM was introduced in

geomechanics by Cundall and Strack [3] and was later

adopted as a research tool by many other researchers

[13, 17, 27, 30]. Since snow avalanche and debris flow can

be regarded as granular flows [8, 18, 22, 34], DEM pro-

vides an ideal tool for modeling such phenomena. In

comparison to continuum shallow flow models, the pre-

sented DEM model remains applicable to problems with

complex topography and sudden change in field variables.

Furthermore, the DEM approach allows accurate descrip-

tion of the flow dynamics with few material parameters.

H. Teufelsbauer � Y. Wang � W. Wu (&)

Institute of Geotechnical Engineering, University of Natural

Resources and Life Sciences, Feistmantelstr. 4,

1180 Vienna, Austria

e-mail: [email protected]

Y. Wang

Department of Mechanical Engineering, Darmstadt University

of Technology, Darmstadt, Germany

S. P. Pudasaini

School of Sciences, Katmandu University, Lalitpur, Nepal

R. I. Borja

Department of Civil and Environmental Engineering,

Stanford University, Stanford, CA 94305-4020, USA

123

Acta Geotechnica

DOI 10.1007/s11440-011-0140-9

There are only few publications in the literature on

numerical simulation of the impact force exerted by

granular flow against obstacles. Recently, the drag force of

dilute granular flow was studied with the DEM by Bhar-

adwaj et al. [1]. Well-documented laboratory experiments

with dry sand were reported by Pudasaini et al. [20, 22, 23],

Chiou [2], and Moriguchi et al. [16]. Teufelsbauer et al.

[29] presented a DEM model for simulating dry granular

avalanches. Impact force calculations of granular flows

against structures are also presented by Montrasio and

Valentino [15]. In this paper, the simulated impact forces

on obstacles are calculated with the DEM, and the

numerical results are compared with experimental data in

the literature.

2 A DEM model for granular avalanche

The numerical calculations are carried out with the com-

mercial software PFC3d (Particle Flow Code in three

dimensions [9]). PFC3d is a simulation tool based on the

DEM [2] and allows the computation of the dynamic

motion and interaction of assemblies of arbitrarily sized

spherical particles. The distinct elements, so-called balls,

interact with each other based on a force–displacement law

and Newton’s second law of motion. Besides balls, PFC3d

also provides wall elements, which allow the creation of

static boundary elements. The displacements of colliding

particles are represented by the overlap of the particles, and

the interaction forces between the particles depend on the

overlap. The forces between particles during contact are

calculated according to some simple mechanical models

such as springs and dashpots [4, 12, 14]. Usually, the

contact force is decomposed into a normal component and

a shear component. The material properties of the discrete

elements (balls and walls) are characterized by the stiffness

and friction. In addition, the balls are characterized by the

ball radii and densities. The influence of various DEM

parameters to the system behavior was investigated in

former studies [2, 4, 25, 26, 28, 31, 32].

The normal and shear forces between particles and

between particles and the wall are governed by the Kelvin–

Voigt model. This model consists of an elastic spring and a

viscous damper connected in parallel. The viscous damping

controls the energy dissipation during particle collision and

can be related to the restitution coefficient of granular

materials. Both the normal and shear forces are subjected to

some restrictions. For cohesionless granular materials, the

normal force is restricted to be compressive only, i.e., ten-

sile normal force is not allowed. The allowable tangential

force is assumed to obey the Coulomb friction law, which

can be expressed by a linear relationship between the nor-

mal force Fn and the allowable shear force Fsmax of the form

Fsmax ¼ l Fnj j ð1Þ

where l is the friction coefficient. Slip between two adja-

cent particles occurs if the shear force is equal to the

allowable shear force. In the presented granular flow

model, internal and basal friction angles determined in the

laboratory are assigned to the DEM parameters. In general,

the DEM parameters differ from laboratory measurements

[9]. However, in the case of rapid granular flows, Coulomb

sliding friction is dominated by rotational friction, which

allows a rough estimation of internal and basal friction.

The local damping, which defines a drag force to the

particles, is set equal to zero in our numerical studies since

the surrounding air has vanishingly small influence on the

granular avalanche flow in laboratory scale.

An additional rotation control is added to the DEM

model describing the rotation behavior of arbitrarily

shaped granules with a rough surface by spherical DEM

balls [11, 29, 33]. Without any rolling friction, the friction

l is not strong enough to prevent the particles from rolling

down an incline. As a result, the model would strongly

underestimate bed and internal friction angles measured in

the laboratory. By means of the rotation model, it is pos-

sible to simulate gravity-driven flows of granular material

realistically by DEM. The mechanism of rotation control

used in this paper is described in detail by Teufelsbauer

et al. [29]. Two parameters, the retarding time k and the

parameter v, have to be identified to describe the rotational

behavior of the particles. The retarding time k defines the

time span needed to reduce the angular velocity x about

the retarding coefficient kk ¼ 1= 1þ cvð Þ 2 0; 1½ �, where c

is the number of contacts of a particle to its neighbor

particles. If Dt is a discrete time step of the DEM calcu-

lation, the particle rotation xti in each direction i = 1, 2, 3

is reduced to give the new rotation xtþ1i for the following

time step

xtþ1i ¼ k

Dt=kk xt

i ð2Þ

The retarding time is assumed to depend on the shear

velocity vs:

k ¼ kvvs þ kc ð3Þ

The above expression for the retarding time k is

motivated by the observation that the influence of particle

angularity decreases with increasing shear velocity. Hence,

an additional shear-retarding coefficient kv and a shear

velocity-independent retarding time kc describe a linear

relation between shear velocity and retarding time. If a

particle is in contact with several particles, the mean of all

shear velocities to the contacting particles is taken. This

relation allows a more accurate description of the static

deposition and dynamic flow of granular material with one

mathematical model. The velocity-dependent retarding

Acta Geotechnica

123

time is especially important for three-dimensional free

surface flows with unconfined run-out areas (see Fig. 1b).

Furthermore, the threshold velocity vsr can be intro-

duced when a particle passes from pure sliding to rolling. If

the relative particle velocity is below the threshold veloc-

ity, the particle rotation is constrained to zero. This effect

can often be observed in laboratory experiments when an

angular particle slides along a smooth incline. When the

particle begins to move, it is mostly sliding without rota-

tion. If it has reached a certain (mostly stochastically

varying) velocity, it begins to rotate. A similar effect can

be observed in the deposition process. In general, the

threshold velocity vrs when an angular particle passes from

rolling to pure sliding is much lower than the threshold vsr

caused by the kinetic energy of particle spin.

All presented material parameters are separately iden-

tified for internal and basal material behavior. If a differ-

entiation is necessary, the superscript bb and bw is added to

the parameters, denoting ball-ball and ball-wall contacts,

respectively.

3 Evaluation of impact force against obstacles

The impact force of granular flow against obstacles has

been the subject of some experimental investigations,

which can be divided into two categories: quasi two-

dimensional channel flow (Fig. 1a) and fully three-

dimensional chute experiments flow (Fig. 1b). In channel

experiments, the flow in lateral direction is confined by

sidewalls with negligible small friction. Hence, the velocity

gradients in lateral direction are marginal. Chute experi-

ments allow the investigation of the influence of an

obstacle to an unconfined free surface flow. When an

avalanche hits a dam, it is deflected in lateral and basal

surface normal direction.

The present DEM model allows the simulation of

channel and chute flows and provides the possibility to

evaluate normal and shear forces of the impact against

a retaining wall. Therefore, the total force Fb ¼ Fbi

� �; i ¼

1; 2; 3 in each coordinate is evaluated by additional wall

elements, which have the same location and dimension as

the pressure plates in the real experiments. The total force

is projected to normal forces Fn and shear forces Fs

Fni ¼ Fb

j njni; with nk k ¼ 1

Fsi ¼ Fb

i � Fni ;

ð4Þ

where n is the normal vector of the pressure plate. The

norm of the force vectors Fsk k and Fnk k gives the normal

and shear force of the avalanche impact against the pres-

sure plate, respectively.

3.1 Channel experiments

Moriguchi et al. [16] conducted a series of channel experi-

ments with a length and width of 1.8 and 0.3 m for different

inclination angles 45�, 50�, 55�, 60�, and 65�. The experi-

ments were performed with 50 kg Toyoura sand with a bulk

density of 1,379 kg/m3 with minimum and maximum void

Fig. 1 Experimental setup: a channel flow experiment, b chute experiment

Acta Geotechnica

123

ratios of 0.61 and 0.97, respectively. The density of the solid

phase is about 2,650 kg/m3. The mean grain diameter is

about 0.25 mm. The basal surface and the impact wall of the

channel were coated with sand to provide higher surface

friction. The side walls of the channel are made of Plexiglas

with low friction. Basal and internal friction angles are not

provided in [15]. However, for our simulations, a dynamic

internal friction angle of 35� is assumed, which is usually

measured for dry sand [2, 20–22].

One challenge in DEM modeling is the identification

of model parameters. Particle properties like particle

stiffness, damping coefficient, particle density, internal

and basal friction angle, and rotation threshold velocities

can be determined by laboratory experiments, whereas

other parameters like contact influence and retarding

times can not directly be obtained by laboratory

experiments. A detailed description of parameter iden-

tification and their influence on the flow behavior of

granular free surface flows is provided in our previous

work [29].

In the laboratory experiment, the basal surface is coated

with Toyoura sand to provide high surface friction. The

side walls are smooth with very low friction in order to

provide symmetry boundary conditions. Fifty kilograms of

Toyoura sand is stored in a 30 9 30 9 50 cm box. When

the front door of the box is suddenly opened, the sand flows

down the channel and finally hits the pressure plate. The

maximum impact force is strongly dependent on the

inclination angle of the channel (see Fig. 4).

Our calculations show that basal surface condition

(especially the threshold velocity vbwsr , the retarding time

kbw, and the basal friction lbw) have strong influence on the

impact behavior of the avalanche. The retarding time kbw

describes a rotational friction. If the sliding surface has a

very rough structure, retarding times should be assumed

very small in comparison with a smooth sliding surface. In

the experiments of Moriguchi et al. [16], the basal channel

surface is very rough because it is coated with sand parti-

cles. Hence, the ball-wall retarding time is assumed to be

zero.

Case studies CS1 and CS2 demonstrate the influence of

rotation parameters vbb, kbb, and kbb on the flow and impact

behavior of granular material. These both cases are per-

formed with free ball-wall rotation, whereas the ball-ball

rotation is highly constrained in CS1 and free in CS2 (see

Table 1, Fig. 2).

The colors of the PFC results shown in this paper are

based on following color code. Dark blue indicates zero

velocity, and velocities in the range (0, 0.25vmax),

(0.25vmax, 0.5vmax), (0.5vmax, 0.75vmax), and (0.75vmax,

1.0vmax) are colored in light blue, green, yellow, and

Table 1 Case study 1 to case study 3 present DEM parameter sets for sensitivity analysis of the rotation control model

Parameter CS1 CS2 CS3 CS4

Contact stiffness (normal) 108 N/m 108 N/m 108 N/m 108 N/m

Contact stiffness (shear) 108 N/m 108 N/m 108 N/m 108 N/m

Particle density 2,650 kg/m2 2,650 kg/m2 2,650 kg/m2 2,650 kg/m2

Ball-ball friction lbb 0.7 0.7 0.7 0.7

Ball-wall friction lbw ? ? ? ?

Critical damping ratio (normal) 0.1 0.1 0.1 0.1

Critical damping ratio (shear) 0.0 0.0 0.0 0.0

Local damping 0.0 0.0 0.0 0.0

Start rotation threshold velocity (ball-wall) vbwsr

0.0 m/s 0.0 m/s 0.0 m/s ? m/s2

Stop rotation threshold velocity (ball-wall) vbwrs

0.0 m/s 0.0 m/s 0.0 m/s ? m/s2

Start rotation threshold velocity (ball-ball) vbbsr

? m/s 0.0 m/s 100 m/s 0 m/s2

Stop rotation threshold velocity (ball-ball) vbbrs

? m/s 0.0 m/s 100 m/s 0 m/s2

Shear retarding coefficient (ball-wall) kbwv

? s2/m ? s2/m 0.0 s2/m 0.0 s2/m

Velocity-independent retarding time (ball-wall) kbws

? s ? s ? s 5 10-3s

Shear retarding coefficient (ball-ball) kbbv

0.0 s2/m ? s2/m 0.0 s2/m 0.0 s2/m

Velocity-independent retarding time (ball-ball) kbbs

0.0 s ? s 0.0 s 8 10-2s

Contact influence v 0 0 0 0

Uniformly distributed ball diameter in mm [rmin, rmax] [7, 9] [7, 9] [7, 9] [7, 9]

Parameters in case study 4 present material properties according to the experiments of Moriguchi et al. [16]

Acta Geotechnica

123

red, respectively. The maximum velocity vmax is the

maximum value of the magnitude of all the particle

velocities evaluated in each time step. Time is given in

seconds and velocities in m/s. About 9.000 particles are

used in the PFC calculation for the shown channel

experiments.

Fig. 2 Influence of particle rotation on the flow and impact behavior of granular flow. Both cases studies are performed with free ball-wall

rotation, highly constrained ball-ball rotation in CS1, and free ball-ball rotation in CS2

Acta Geotechnica

123

In CS3 and CS4, ball-ball rotation is investigated, while

the particle rotation is constrained for ball-wall contacts.

Therefore, one case study is performed with constrained

ball-ball rotation and constrained ball-wall rotation (CS3),

whereas in CS4 the ball-wall rotation is constrained and the

ball-ball rotation is free (Fig. 3).

Fig. 3 Influence of particle rotation on the flow and impact behavior of granular flow. CS3 shows the case where particle rotation is completely

constrained. CS4 shows the case where the particles are allowed to rotate

Acta Geotechnica

123

3.1.1 Conclusion of case studies 1–4

CS1 and CS2 clearly show that even for an extremely high

Coulomb wall friction angle tan lbw much higher than the

inclination of the channel, the granular flow along the

inclined surface was accelerated very fast. Further

numerical experiments show that for highly (CS4) or

completely (CS3) constrained ball-wall particle rotation,

the released granular material slides much slower or is even

retained in the release area. However, CS1 and CS2 clearly

show the influence of internal particle rotation. In both

experiments, the Coulomb friction was assumed to be

lbb = 0.7. The simulation results show the different flow

regimes and impact forces for constrained and free ball-ball

rotation. If internal rotation is constrained (CS1), the

released granular mass slides down the channel similarly to

a rigid body. The avalanche body is relatively compacted

from initiation till impact against the obstacle. If particle

rotation is constrained, the internal friction is governed by

the Coulomb sliding friction. Otherwise, if particles are

free in rotation, Coulomb sliding friction is dominated by

particle rotation, which drastically reduces shear resistance.

As a consequence, in CS2, the granular flow can be redi-

rected by the obstacles much easier than in CS1. In CS1,

the whole kinetic energy is absorbed by the obstacle,

whereas in CS2, a considerable portion of the avalanche

flows over the dam. Hence, the maximal impact force in

CS2 is much smaller than that in CS1, although travel and

impact velocity of the granular flow are similar in both

experiments. A comparison of the impact force computed

in CS1 and CS2 with laboratory measurements Fig. 4

shows that in both case studies, the peak of the impact

pressure is far too high. A reduction in the impact peak was

reached by a reduction in ball-wall particle rotation as

shown in CS4.

Figure 4 shows a comparison between laboratory

experiments and simulated impact forces. It can be shown

that the distinct element model is able to describe the flow

and impact behavior of dry granular material reasonable

well.

3.2 Chute experiments

In comparison to the channel experiments of Moriguchi

et al. [16], the experiments of Chiou [2] and Pudasaini et al.

[20] investigate three-dimensional free surface flows along

an inclined chute merging into a horizontal run-out region.

The impact forces against obstacles exerted by free surface

flows were measured and described in detail by Chiou [2].

The chute with a width of 1.6 m has an inclined part with a

length of 1.56 m, which merges into a horizontal part of

2.07 m. The transition between the inclined part and the

horizontal run-out zone consists of a cylindrical transition

zone with a length of 0.37 m. In the experiments, a dam

with 20 cm width and 30 cm height was placed at the

beginning of the transition zone (see Figs. 1b, 7). The

challenge in modeling such three-dimensional free surface

flow is to describe all the different flow regimes observed

in experiments. The wall friction and particle rotation

becomes very important in the DEM model [29] to describe

the release behavior, the dense flow along the inclined

chute, the impact with an obstacle, and finally, the depo-

sition in the horizontal run-out zone. After the granular

material is released from a hemispherical cap, the material

starts to flow down the incline and spreads out in flow

direction and lateral direction. The spreading of granulates

depends strongly on the wall friction and on the constraint

of ball-wall rotation. When the avalanche reaches the

horizontal part of the chute, it is retarded by friction, and

the mass is densely deposited over an elliptical area. The

shape of the deposited material is mainly influenced by the

ball-ball and ball-wall friction and rotation. If an obstacle is

placed on the inclined chute, the flow is divided into two

branches with some material retained in front of the

obstacle. The granular mass is deposited in two long tails

(see Fig. 7).

In laboratory experiments, a bi-directional stress gauge

was placed at the front wall of the obstacle. The posi-

tions of the measurement and the chute geometry are

presented in detail in [2]. The bi-directional pressure

gauge is able to measure the normal stress N and shear

stress S perpendicular and parallel to the wall, respec-

tively. Two different test configurations are simulated in

this paper. One experiment deals with granular flow

without dam in order to evaluate the flow pattern and

deposition area. Another experiment investigates the

impact forces on the dam, which is placed at the

beginning of the transition zone between the inclined

plane and run-out zone.

Case studies 5 and 6 are performed for two different

granular materials, quartz sand with a mean grain diameter

of about 5 mm (CS5) and very fine yellow sand less than

1 mm diameter (CS6). Both materials have similar internal

friction angles but different granular surface properties.

The basal friction angle of quartz is lower than that of

yellow sand. Further details about material properties are

documented by Pudasaini et al. [20, 22, 23] and Chiou [2].

The particle diameter in the DEM model is uniformly

distributed in the range of 4–6 mm for both materials in

order to minimize the computation time. Consequently, a

package of several 1,000 particles of yellow sand is rep-

resented by one DEM particle, whereas each quartz particle

is modeled by one DEM particle. Further case studies

investigate the influence of internal and basal particle

rotation on the impact force. The DEM parameters for case

studies 5–8 are given in Table 2. About 43,000 particles

Acta Geotechnica

123

are used in the PFC calculation for the shown chute

experiments.

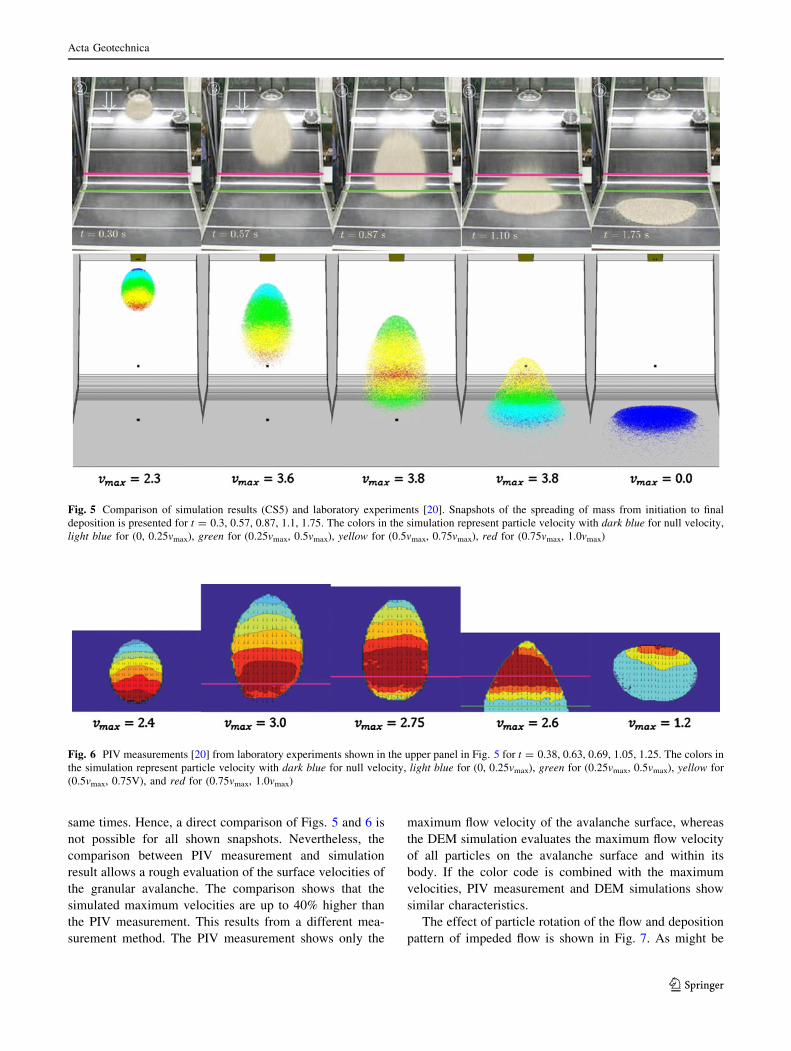
Before simulating the impact force on obstacle, the

behavior of unimpeded granular flow will be investigated.

The numerical simulation of unimpeded flow is compared

with the experiments [20], where the flow was tracked by

PIV (Particle Image Velocimetry). Figure 5 shows some

snapshots of the flow pattern from PIV and DEM

simulation.

A perusal of the experimental and numerical snapshots

shows that the flow patterns from initiation till deposition

are well reproduced by the numerical model.

Snapshots of PIV measurements in Fig. 6 and experi-

mental results in Fig. 5 are not available for exactly the

Fig. 4 Left panel time history of impact force for different channel inclinations measured in experiments by Moriguchi et al. [16], right panelsimulated impact forces with parameter set CS4

Table 2 DEM parameter sets of chute experiments with quartz sand (case study 5) and yellow sand (case study 6)

Parameter CS5 CS6 CS7 CS8

Contact stiffness (normal) 102 N/m 102 N/m 102 N/m 102 N/m

Contact stiffness (shear) 102 N/m 102 N/m 102 N/m 102 N/m

Particle density 2,970 kg/m3 3,030 kg/m2 3,030 kg/m2 3,030 kg/m2

Ball-ball friction lbb 0.84 0.84 0.84 0.84

Ball-wall friction lbw 0.47 0.53 0.53 0.53

Critical damping ratio (normal) 0.1 0.1 0.1 0.1

Critical damping ratio (shear) 0.0 0.0 0.0 0.0

Local damping 0.0 0.0 0.0 0.0

Start rotation threshold velocity (ball-wall) vbwsr

3.0 m/s 3.0 m/s 3.0 m/s 3.0 m/s

Stop rotation threshold velocity (ball-wall) vbwrs

0.1 m/s 0.1 m/s 0.1 m/s 0.1 m/s

Start rotation threshold velocity (ball-ball) vbbsr

0.0 m/s 0.0 m/s 0.0 m/s 0.0 m/s

Stop rotation threshold velocity (ball-ball) vbbrs

0.0 m/s 0.0 m/s 0.0 m/s 0.0 m/s

Shear retarding coefficient (ball-wall) kbwv

0.005 s2/m 0.005 s2/m 0.015 s2/m 0.005 s2/m

Velocity-independent retarding time (ball-wall) kbws

0.0 s 0.0 s 0.0 s 0.0 s

Shear retarding coefficient (ball-ball) kbbv

0.0 s2/m 0 s2/m 0 s2/m 0 s2/m

Velocity-independent retarding time (ball-ball) kbbs

0.002 s 0.002 s 0.002 s 0.1 s

Contact influence v 0 0 0 0

Uniformly distributed ball diameter in mm [rmin, rmax] [2, 3] [2, 3] [2; 3] [2; 3]

Case studies 7 and 8 show the influence of ball rotation in comparison to case study 6

Acta Geotechnica

123

same times. Hence, a direct comparison of Figs. 5 and 6 is

not possible for all shown snapshots. Nevertheless, the

comparison between PIV measurement and simulation

result allows a rough evaluation of the surface velocities of

the granular avalanche. The comparison shows that the

simulated maximum velocities are up to 40% higher than

the PIV measurement. This results from a different mea-

surement method. The PIV measurement shows only the

maximum flow velocity of the avalanche surface, whereas

the DEM simulation evaluates the maximum flow velocity

of all particles on the avalanche surface and within its

body. If the color code is combined with the maximum

velocities, PIV measurement and DEM simulations show

similar characteristics.

The effect of particle rotation of the flow and deposition

pattern of impeded flow is shown in Fig. 7. As might be

Fig. 5 Comparison of simulation results (CS5) and laboratory experiments [20]. Snapshots of the spreading of mass from initiation to final

deposition is presented for t = 0.3, 0.57, 0.87, 1.1, 1.75. The colors in the simulation represent particle velocity with dark blue for null velocity,

light blue for (0, 0.25vmax), green for (0.25vmax, 0.5vmax), yellow for (0.5vmax, 0.75vmax), red for (0.75vmax, 1.0vmax)

Fig. 6 PIV measurements [20] from laboratory experiments shown in the upper panel in Fig. 5 for t = 0.38, 0.63, 0.69, 1.05, 1.25. The colors in

the simulation represent particle velocity with dark blue for null velocity, light blue for (0, 0.25vmax), green for (0.25vmax, 0.5vmax), yellow for

(0.5vmax, 0.75V), and red for (0.75vmax, 1.0vmax)

Acta Geotechnica

123

expected, the simulation with less rotation constraint gives

rise to more scattered deposition. Figure 8 shows the

influence of particle rotation and wall friction on the

impact normal and shear force against obstacle. The

maximum impact peak force depends mainly on the impact

velocity and the mass of granular material that hits the

obstacle. Moreover, the wall friction and ball-wall particle

rotation have a significant influence on the flow behavior

and the impact forces. From numerical experiments, it was

found that a reduced constraint in particle rotation leads to

a more scattered flow, especially in the run-out zone. An

increase in wall friction stretches the avalanche in flow

direction in the inclined part and leads to a shorter run-out

distance in the horizontal part. The flow pattern and the

final deposition in the run-out zone are strongly dependent

on both parameters, the rotation constraint and the wall

friction. If the released granular mass is widely stretched in

flow direction, the mass is spatially dispersed, the impact

duration becomes longer, and the peak impact force

becomes smaller. Otherwise, if the released granular

material flow is highly compacted, the whole released mass

hits the obstacle within a short time and leads to a high

impact peak force.

Our numerical simulations show that the flow pattern

depends mainly on the basal friction and basal rotation

properties. The effects of the variation of just one param-

eter on the impact force cannot be described in general. It

depends strongly on whether basal friction is dominant or

basal rotation is dominant in the current flow regime.

However, in case study 5 and case study 6, it was shown

that just the correlation of the basal friction parameter with

laboratory measurements allows an accurate impact force

simulation of quartz and yellow sand. A comparison of

CS6 and CS7 in Fig. 8 shows that a small variation of basal

ball rotation has only minor effects on the peak of the

impact force but has noticeable effects on the scattering of

the avalanche in the deposition zone (see Fig. 7). A further

influence to the flow characteristics provides a variation of

rotation constraint for ball-ball contacts (internal ball

rotation). A particle is assigned to internal ball rotation if

the particle has contacts to other particles but no contact to

the wall. Otherwise, if a particle has wall contact, the

constraint parameter of ball-wall rotation is assigned to the

particle (basal ball rotation). An increase in internal ball

rotation (compare CS 6 and CS 8) has only minor effects

on the flow pattern and final deposition (Fig. 7) but leads to

Fig. 7 The left panel shows the reference flow pattern for yellow sand (CS6), which was evaluated with laboratory experiments by Chiou [2].

The middle (CS7) and right panels (CS8) show the influence of variations in rotation parameters on the flow pattern and final deposition. The

snapshots in the upper row are evaluated at t = 0.74 s and the lower row at t = 5 s

Acta Geotechnica

123

a decrease in impact force (Fig. 8). It is assumed that a

higher internal particle rotation relieves the avalanche to be

deflected in front of an obstacle. Hence, less kinetic energy

has to be absorbed by the structure. Similar effects could be

observed in Sect. 3.1 (CS1 and CS2). However, the right

parameterization of material properties is very complex

and was performed by a series of case studies for different

chute types and obstacle positions.

3.3 Effect of multiple obstacles

Prevention structures constructed in the path of ava-

lanches play an important role in the mitigation of ava-

lanche hazards. The purpose of the prevention structures

is to reduce or eliminate the hazard from potentially

destructive avalanches. The present practice of snow

prevention is largely based on the strategy of retention by

massive defense structures such as snow bridges and

embankments. While such defense structures have

achieved certain success, their construction in Alpine

terrains often requires the transportation by helicopter and

is therefore rather cost-intensive. An alternative protection

measure to the conventional large obstructions is expected

by a large number of small obstacles, which are arranged

in a matrix and tied down to the slope by ground anchors.

While the massive retention structures attempt to hold up

avalanches, a redistribution system aims at mixing and

redistributing the snow layer in order to absorb the

damaging energy and to reduce the hazard potential of

avalanches. Despite the relatively small size of the

Fig. 8 Impact forces against obstacle for quartz (CS5) and yellow sand (CS6). CS7 and CS8 show the influence of basal (CS7) and internal

(CS8) rotation parameters on the impact force

Acta Geotechnica

123

obstructions, a matrix of such obstructions shows addi-

tionally stabilizing effect of the snowpack and hence

reduces the probability of avalanche ignitions. An

advantage of such systems is the small size and light

weight of the obstructions. The obstructions are prefab-

ricated and can be transported and installed manually in

most difficult terrains. Unlike the massive retention

structures, the fall-out of an individual obstruction does

Fig. 9 Snapshot series (Dt = 0.4 s) of the interaction between protection structure matrix and avalanche

Fig. 10 Comparison of the final deposition for a unimpeded avalanche, b PSM with attack angle 110�, and c PSM with attack angle 45�

Acta Geotechnica

123

not give rise to a system failure, which means higher

reliability of the system.

In this section, some preliminary results of the interac-

tion between granular and multiple obstacles are presented.

In the numerical model, a matrix of obstacles (Protection

Structure Matrix, PSM) is placed on a slope in front of

three blocks, which simulate buildings. The simulation

allows an evaluation of the forces acting on the obstacles of

the PSM and the front walls of the buildings. Three case

studies are presented. The first study presents the impact of

the avalanche against the buildings without PSM. The other

two studies investigate the protection of and the reduction

in impact forces against the building by PSM. The influ-

ence of the attack angle of the obstacles on the protection

effect of the PSM is compared in the last two experiments.

The attack angle is defined as the angle between basal

surface of the chute and the impact plane of the obstacle.

The PSM used in the following case studies consists of 7

rows, each consisting of 10 obstacles with a cross section

of 1 9 1 cm and a height of 5 cm. The distance between

two obstacles in lateral direction is 9 cm, and the rows

have a distance of 10 cm. The three buildings have a

ground area of 20 9 20 cm and a height of 8 cm. The

impact wall of the left house has a distance of 1.94 m from

Fig. 11 Comparison of the impact force against the three buildings in normal direction for a unimpeded avalanche, b PSM with attack angle

110� and c PSM with attack angle 45�

Acta Geotechnica

123

the top corner of the chute, the middle house a distance of

1.56 m, and the right house a distance of 2.15 m. Measured

from lateral symmetry axes of the chute, the left house is

shifted 30 cm to the left, the right house 55 cm to the right,

and the middle house is positioned in the symmetry axes.

Figure 9 shows some snapshots of the interaction

between granular flow and PSM. The reduction in kinetic

energy by the PSM is shown in Fig. 11 by the impact

forces against obstacles. However, a negative effect of the

PSM is the increased lateral scattering of the granular

material (see Fig. 5). The comparison of the final depo-

sition in Fig. 10 clearly points out that the attack angle of

the obstacles has only minor effect on the lateral scat-

tering of granular material. However, compared with the

unimpeded avalanche track, the lateral scattering of the

deposition is definitely higher if PSM is installed. How-

ever, the large reduction in kinetic energy by a PSM

results in reduced impact forces in the boundary regions

of the avalanche. The comparison of the impact forces in

Fig. 11 clearly shows the influence of the attack angle of

the obstacles on the performance of PSM. If the obstacles

are placed vertically (Fig. 11c), the PSM shows better

performance than obstacles with higher attack angle. The

comparison of Fig. 11b and c shows that the influence of

the attack angle on the impact peak force can reach about

20%. The simulations are based on parameter settings in

CS5.

The comparison of the peak forces on the three buildings

(Fig. 11) shows that the PSM has excellent protection

capacity. The installation of PSM reduces the impact peak

by a factor of about 2. If the obstacles are installed verti-

cally (attack angle of 45�), the PSM shows better protec-

tion performance than the PSM with attack angle of 110�.

The main reason for this effect is that the avalanche

overflows the obstacles much easier for higher attack angle

[5–7, 10]. Hence, less kinetic energy is absorbed by the

obstacles, which results in higher impact forces against the

buildings in the transition and the run-out zone.

4 Conclusion

In this paper, we have shown that the three-dimensional

DEM is an appropriate tool for modeling granular flows

and their interactions with obstacles. It is shown that the

model performance is strongly dependent on the rotation

control. Without any rotation constraint, the flow behavior

of rough and angular granules cannot be described by DEM

correctly. The comparison between numerical simulation

and laboratory experiments for different channel inclina-

tions and chute types shows good agreement. A compari-

son of impact forces and flow patterns with laboratory

experiments indicates the potential applicability of the

presented DEM avalanche model for a wide range of lab-

oratory setups. Compared with depth averaged continuum

approaches, the DEM is rather time consuming. However,

DEM allows fully three-dimensional modeling of granular

flows without geometrical restriction and averaging of field

variables. This allows us to study the retention of protec-

tive structures, the impact forces on protective structures,

and run-out and deposition behavior of granular flows.

Acknowledgment The authors are grateful to the Austrian Science

Fund (FWF) for the grant L351: Numerical modelling of innovative

protection against snow avalanches.

References

1. Bharadwaj R, Wassgren C, Zenit R (2006) The unsteady drag

force on a cylinder immersed in a dilute granular flow. Phys

Fluids 16:1511–1517

2. Chiou MC (2005) Modelling dry granular avalanches past dif-

ferent obstructs: numerical simulations and laboratory analyses.

Dissertation, Technical University Darmstadt, Germany

3. Cundall PA, Strack ODL (1979) A distinct element model for

granular assemblies. Geotechnique 29:47–65

4. Cundall PA (1988) Formulation of a three-dimensional distinct

element model—Part I. A scheme to detect and represent contacts

in a system composed of many polyhedral blocks. Int J Rock

Mech Min Sci Geomech Abstr 25(3):107–116

5. Hakonardottir KM, Hogg AJ, Johannesson T, Tomasson GG

(2003) A laboratory study of the retarding effects of braking

mounds on snow avalanches. J Glaciol 49(165):191–200

6. Hakonardottir KM (2004) The interaction between snow ava-

lanches and dams. PhD thesis, University of Bristol, School of

Mathematics

7. Hakonardottir KM, Hogg AJ (2005) Oblique shocks in rapid

granular flows. Phys Fluids 17:077101. doi:10.1063/1.1950688

8. Hutter K, Wang Y, Pudasaini SP (2005) The Savage-Hutter

avalanche model: how far can it be pushed? Philos Transact A

Math Phys Eng Sci 363:1507–1528

9. Itasca Consulting Group, Inc. (2003) ‘‘PFC3D (Particle flow code

in 3D) theory and background manual’’, Version 3.0, ICG,

Minneapolis

10. Johannesson T (2001) Run-up of two avalanches on the deflecting

dams at Flateyri, northwestern Iceland. Ann Glaciol 32:350–354

11. Khan KM, Bushell G (2005) Comment on ‘‘Rolling friction in

the dynamic simulation of sandpile formation’’. Physica A

352:522–524

12. Kruggel-Emden H, Simsek E, Rickelt S, Wirtz S, Scherer V

(2007) Review and extension of normal force models for the

discrete element method. Powder Technol 171:157–173

13. Labra C, Rojek J, Onate E, Zarate F (2008) Advances in discrete

element modelling of underground excavations. Acta Geotech

3:317–322

14. Mindlin RD, Deresiewicz H (1953) Elastic spheres in contact

under varying oblique forces. J. Appl. Mech. 20:327–344

15. Montrasio L, Valentino R (2004) Experimental and numerical

analysis of impact forces on structures due to a granular flow.

Manag Inf Syst 9:267–276

16. Moriguchi S, Borja RI, Yashima A, Sawada K (2009) Estimating

the impact force generated by granular flow on a rigid obstruc-

tion. Acta Geotech 4(1):57–71

17. Muir Wood D, Maeda K (2008) Changing grading of soil: effect

on critical states. Acta Geotech 3:3–14

Acta Geotechnica

123

18. Nicot F (2004) Constitutive modelling of snow as a cohesive-

granular material. Granular Matter 6:47–60

19. Pitman EB, de Long LE (2005) A two-fluid model for avalanche

and debris flows. Philos Transact A Math Phys Eng Sci

363:1573–1601

20. Pudasaini SP, Hsiau S, Wang Y, Hutter K (2005) Velocity

measurements in dry granular avalanches using particle image

velocimetry-technique and comparison with theoretical predic-

tions. Phys Fluids 17(9)

21. Pudasaini SP, Hutter K, Hsiau S, Tai S, Wang Y, Katzenbach R

(2007) Rapid flow of dry granular materials down inclined Chutes

impinging on rigid walls. Phys Fluids 19(5)

22. Pudasaini SP, Hutter K (2007) Avalanche dynamics: dynamics of

rapid flows of dense granular avalanches. Springer, Berlin

23. Pudasaini SP, Kroener C (2008) Shock waves in rapid flows of

dense granular materials: theoretical predictions and experimen-

tal results. Phys Rev E 78(4)

24. Sampl P, Zwinger T (2004) Avalanche simulation with Samos.

Ann Glaciol 38:393–398

25. Schwager T, Poschel T (2007) Coefficient of restitution and

linear–dashpot model revisited. Granular Matter 9:465–469

26. Schwager T, Poschel T (2007) Coefficient of restitution for vis-

coelastic spheres: the effect of delayed recovery. arXiv:07081434

27. Sibille L, Donze F-V, Nicot F, Chareyre B, Darve F (2008) From

bifurcation to failure in a granular material: a DEM analysis. Acta

Geotech 3:15–24

28. Stevens AB, Hrenya CM (2005) Comparison of soft-sphere

models to measurements of collision properties during normal

impacts. Powder Techn 154:99–109

29. Teufelsbauer H, Wang Y, Chiou M-C, Wu W (2009) Flow-

obstacle-interaction in rapid granular avalanches: DEM simula-

tion and comparison with experiment. Granular Matter 11(4),

209–220. doi:10.1007/s10035-009-0142-6

30. Thompson N, Bennett MR, Petford N (2009) Analyses on gran-

ular mass movement mechanics and deformation with distinct

element numerical modeling: implications for large-scale rock

and debris avalanches. Acta Geotech 4:233–247

31. Wu C, Li L, Thornton C (2003) Rebound behaviour of spheres for

plastic impacts. Int J Impact Eng 28:929–946

32. Zhang J, Hu Z, Ge W, Zhang Y, Li T, Li J (2004) Application of

the discrete approach to the simulation of size segregation in

granular chute flow. Ind Eng Chem Res 43:5521–5528

33. Zhou YC, Wright BD, Yang RY, Xu BH, Yu AB (1999) Rolling

friction in the dynamic simulation of sandpile formation. Physica

A 269:536–553

34. Zwinger T (2000) Dynamik einer Trockenschneelawine auf bel-

iebig geformten Berghangen. PhD Thesis, Vienna University of

Technology

Acta Geotechnica

123


Recommended