1
JAMSTEC Rep. Res. Dev., Volume 15, September 2012, 1_11
― Original Paper ―
Kenji Hirata1,2*, Haryadi Permana3, Toshiya Fujiwara2, Udrekh4, Eddy Z. Gaffar3,
Masahiro Kawano2,5a, and Yusuf S. Djajadihardja4
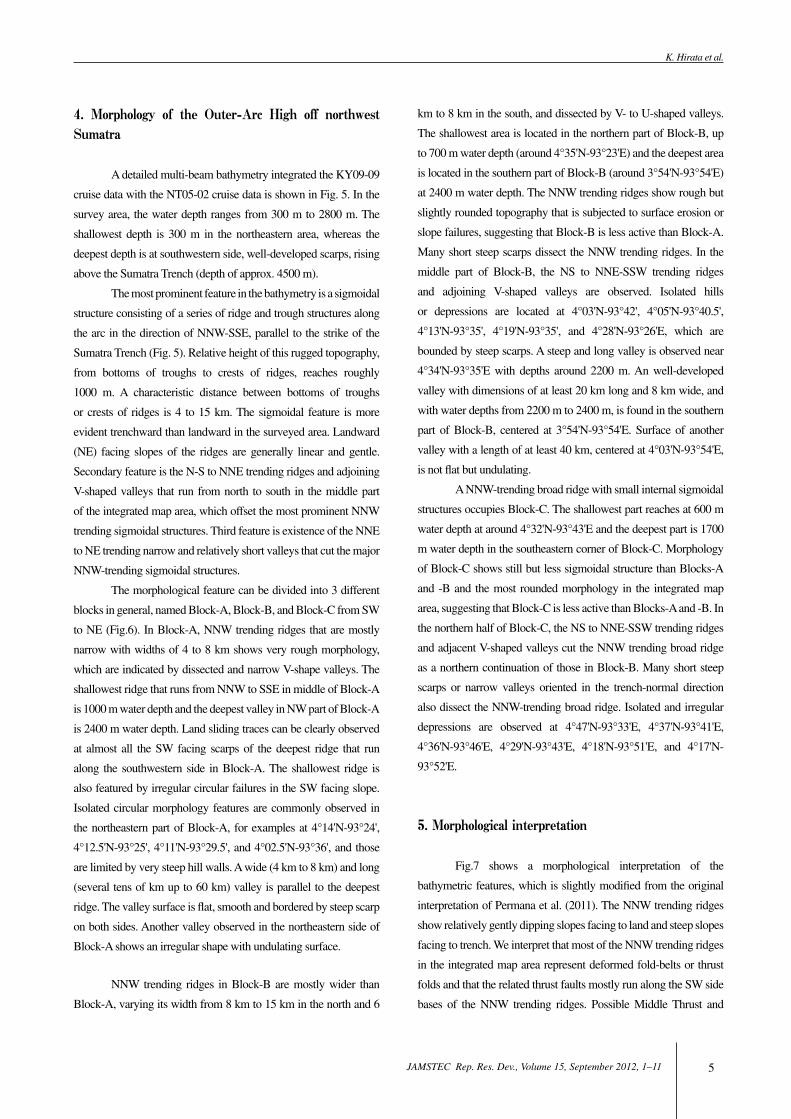
In October to November, 2009, a multi-beam bathymetry survey had been successfully completed in the outer-arc high off
northwest Sumatra during the KY09-09 cruise using R/V KAIYO of JAMSTEC (Japan Agency for Marine-Earth Science and
Technology). Then KY09-09 bathymetry data were integrated with a previous NT05-02 bathymetry data to make a new detailed
bathymetry map, gridded at approximately ~37 m cell size, in the middle part of the outer-arc high. The most predominant
morphological feature is the NNW trending sigmoidal structures consisting of a series of ridges and troughs parallel to the local trench,
which is more evident trenchward than landward. Secondary predominant structure is the N-S to NE-SW trending ridges and adjoining V
shaped valleys that offset the most predominant structures from north to south in the middle part of the integrated map area. Third
predominant structure is the NNE to NE narrow valleys that cut the NNW trending sigmoidal structures elsewhere in the whole
integrated map area.
Keywords: Sumatra, outer-arc high, multi-beam bathymetry, morphological feature, sigmoidal structures
Received 26 March 2012 ; Accepted 30 May 2012
1 Seismology and Volcanology Research Department, Meteorological Research Institute
2 Institute for Research on Earth Evolution (IFREE), Japan Agency for Marine-Earth Science and Technology (JAMSTEC)
3 Research Center of Geotechnology, Indonesian Institute of Science (LIPI)
4 Agency for the Assessment and Application of Technology (BPPT)
5 Department of Natural Environmental Science, Kochi University
Present affiliation
a HOPES Corporation
*Corresponding author:
Kenji Hirata
Seismology and Volcanology Research Department, Meteorological Research Institute
1-1 Nagamine, Tsukuba, Ibaraki 305-0052, Japan
Tel. +81-29-853-8695
Copyright by Japan Agency for Marine-Earth Science and Technology
Detailed bathymetric features in the outer-arc high off the northwest Sumatra- results from KY09-09 cruise -
2
Detailed bathymetry off the northwest Sumatra
JAMSTEC Rep. Res. Dev., Volume 15, September 2012, 1_11
1. Introduction
The December 26, 2004 Great Sumatra-Andaman
earthquake (Mw9.2) caused a huge tsunami with averaged heights
of more than 20 meters that struck the western coast of the northern
tip of Sumatra (e.g., Tsunami field survey team, 2005; Jaffe et al.,
2006). The huge tsunami is ascribed to closely relate to a very large
amount of slip on the fault off northwest Sumatra (e.g., Hirata et al.,
2006; Tanioka et al., 2006; Sladen et al.,2008). However, the far-
field observations are not able to resolve more detailed features of
the December 26, 2004 tsunami generation mechanism.
International offshore surveys have been extensively
conducted to investigate geological features in the wide area of
ocean floor off the northwest Sumatra after the great earthquake
(e.g., Soh et al., 2005; McNeill et al., 2005; Henstock et al., 2006;
Sibuet et al., 2007; Franke et al., 2008; Mosher et al., 2008; Chauhan
et al., 2009). There are several working hypotheses proposed for the
coseismic fault model or the tsunami generation model (e.g., Plafker
et al., 2005; Soh et al., 2005; Sibuet et al., 2007; Mosher et al., 2008;
Lin et al., 2009). Among them, Hirata et al. (2008, 2010) proposed
a hypothesis that the Dec 2004 earthquake ruptured updip near the
deformation front along the megathrust (plate interface) as well as
main thrust, but branched onto one of splay faults in the outer-arc
high: either the Middle Thrust or possibly the Lower Thrust (Note
that the hypothesis includes a working hypothesis postulated by
Soh et al. (2005)). There were, however, lack of bathymetry data
around the Middle Thrust to evaluate the hypothesis (see Fig.1 of
Graindorge et al. (2008)).
From October 26 to November 5, 2009 (port call at Bali,
Indonesia for embarkation and disembarkation), we conducted
a detailed bathymetry survey during the KY09-09 Leg.1 cruise
to collect the bathymetry data around the Middle Thrust (Fig.1).
We here briefly report the result of KY09-09 cruise, including a
morphological interpretation of the outer-arc high off northwest
Sumatra.
2. Bathymetry survey specification
2.1. Bathymetry data acquisitionWe used the SEA BEAM 2100 multi-beam echo sounder
system equipped on R/V KAIYO during the KY09-09 cruise. The
multi-beam bathymetric system uses sonar acoustic arrays placed
in a Mils Cross arrangement to form the beams. The crossed
arrangement of hydrophone and projector arrays enables SEA
BEAM 2100 to process up to 81 soundings spaced at angles of one
degree in an athwartship accurate pattern. Because of the broad
athwartship beam pattern of the projector, the system can achieve
a wide swath in intermediate depths, depending on array size,
sea state, and bottom backscatter. Table 1 lists general hardware
performance specifications for the SEA BEAM 2100 of R/V
KAIYO (SeaBeam Instruments, Inc., 1997, 1999) as well as those
Fig. 1. Survey area of the KY09-09 Leg.1 bathymetry survey cruise on a map based on ETOPO-2 bathymetry (Smith and Sandwell, 1997). Survey tracks
are shown as solid lines. Small square shows the XBT station. A rectangle enclosing survey tracks is the area mapped in Figs. 3 to 7. A star is the epicenter
of the December 26, 2004 Great Sumatra-Andaman earthquake (Mw9.2).
3
K. Hirata et al.
JAMSTEC Rep. Res. Dev., Volume 15, September 2012, 1_11
for the SeaBat 8160 of R/V NATSUHIMA that was used to acquire
the previous NT05-02 bathymetric data which will be integrated
with the present KY09-09 bathymetric data later.
2.2. Sound velocity correctionTo obtain sound velocity profile for water depth correction,
expendable bathythermograph (XBT) measurements were carried
out at 3°07'N, 94°54'E (1505 m in water depth, 29.6ど on surface)
at 13:50 (UT) (Local Time 19:50 (+6 hrs)), October 31, 2009)
(Fig.1). Fig. 2 shows the water temperature profile obtained. We
used the water temperature profile to calculate sound velocity
profile for correcting bathymetry. We conducted an additional
XBT measurement just after the bathymetry survey to confirm
no considerable change in water temperature profile in the area,
although the additional one is not displayed here.
3. Bathymetry data collection
The bathymetry survey started at 19:29 (UT) on October
31, 2009, and ended at 16:07 (UT) on November 5, 2009. Survey
tracks were designed to allign sub-parallel to the along-arc direction
(Fig. 3a). Track spacing was 1.3-1.4 nautical mile (2.4-2.6 km) in
areas deeper than ~2000 m in water depth, and track spacing in other
areas was 1 nautical mile (1.85 km) to get complete bathymetric
Fig. 2. XBT temperature profile by an XBT experiment conducted just
before the KY09-09 bathymetry survey. This XBT temperature profile
was used for sound velocity correction.
Fig. 3. Survey tracks (red lines) for bathymetry. (a) KY09-09 cruise. (b) NT05-02 cruise (NT05-02 scientific party, 2005).
Table 1. General hardware performance specifications of multi-narrow
bathymetric systems used in the KY09-09 and NT05-02 cruises.
SEA BEAM 2100 (KY09-09 cruise)
SeaBat 8160 (NT05-02 cruise)
Beam Frequency 12 kHz 50 kHz, nominal
Depth Range 100 to 11,000 meters 1,750 to 5,000 meters
Beam Spacing 2° x 2° 1.5 ° x 1.5°
Number of Beams 81 126
Available Swath width 80 ° 130 °
4
Detailed bathymetry off the northwest Sumatra
JAMSTEC Rep. Res. Dev., Volume 15, September 2012, 1_11
coverage. However, there remained gaps of the beam coverage
in the portions where the water depths are shallower than 800 m.
Survey ship speed was set to be 10 knot (18.5 km/h). As the result
of our survey, total of approximately 3500 km2 areal coverage was
obtained.
The KY09-09 survey area extends from ~3°50'N, 93°10'E
to ~5°00'N, 94°10'E adjacent to a previous survey area during the
NT05-02 R/V Natsushima cruise, conducted in 2005 (NT05-02
scientific party, 2005) (Fig. 3b). The KY09-09 survey area elongates
a length of 120 km in the along-arc direction, and a width of 40
km in the across-arc direction over the outer-arc-high. The area is
situated off the northwestern Sumatra, ~200 km northwestward
from the epicenter on December 26, 2004, and is one of the regions
of the largest vertical displacement predicted from the modelings
(e.g., Hirata et al.,2006; Tanioka et al., 2006; Sladen et al., 2008).
Spurious depth readings in the bathymetry data were edited
out using a ping-edit function of MB-System software (Caress and
Chayes, 2006). Then the KY09-09 bathymetry data were combined
with the previous bathymetry data of the NT05-02 survey (NT05-
02 scientific party, 2005) to make a complete set of bathymetry map
in this region.
The bathymetry data during the NT05-02 cruise were
collected using a SeaBat 8160 multi-narrow beam echo-sounder
system (Table 1). The survey ship speed was 6-8 knot, and track
spacing at shallower than ~2500 m in water depth was 1 nautical
mile (1.85 km), and the track spacing was about 0.5 nautical mile
(0.925 km) at deeper than ~2500 m to get complete bathymetric
coverage. (NT05-02 scientific party, 2005).
To compile different survey data at random sounding
locations, the bathymetric data in ascii form were gridded by using
the Generic Mapping Tools (GMT) software (Wessel and Smith,
1995). Continuous curvature surface gridding algorithm 'surface'
and pre-processor filter 'blockmedian' were operated for the
gridding, in order to filter out the beam artifact while preserving the
characteristic high resolution of the multi-beam data. Since the water
depth in the survey area is mostly shallower than 2200 m, the data
were gridded at a spacing of 0.02 arc-minute (~37 m, slightly larger
than the mean spacing of the raw soundings) to avoid aliasing. The
gridded data are perhaps the finest among existing bathymetric data
acquired off northwest Sumatra. There was almost no overlap area
between the NT05-02 and KY09-09 surveys, thus depth differences
between two data sets were not checked.
Quality of bathymetric data may be influenced by sea state
condition. Fig. 4a shows wind speed condition during KY09-09
bathymetry survey as a proxy of sea state condition, because the roll
and pitch data was not recorded during the survey. Fig. 4a indicates
that wind speed was mostly less than 5 m/sec so that the bathymetry
survey had been conducted under good weather condition. Fig. 4b
also indicates a good weather condition during the bathymetry data
collection of NT05-02 offshore survey. Fig. 4a and 4b suggest that
either bathymetric data acquired was not affected by the sea state
conditions.
Fig. 4. Wind speed condition during bathymetry surveys as a proxy of sea state condition. (a) KY09-09 cruise. (b) NT05-02 cruise (NT05-02 scientific
party, 2005).
5
K. Hirata et al.
JAMSTEC Rep. Res. Dev., Volume 15, September 2012, 1_11
4. Morphology of the Outer-Arc High off northwest Sumatra
A detailed multi-beam bathymetry integrated the KY09-09
cruise data with the NT05-02 cruise data is shown in Fig. 5. In the
survey area, the water depth ranges from 300 m to 2800 m. The
shallowest depth is 300 m in the northeastern area, whereas the
deepest depth is at southwestern side, well-developed scarps, rising
above the Sumatra Trench (depth of approx. 4500 m).
The most prominent feature in the bathymetry is a sigmoidal
structure consisting of a series of ridge and trough structures along
the arc in the direction of NNW-SSE, parallel to the strike of the
Sumatra Trench (Fig. 5). Relative height of this rugged topography,
from bottoms of troughs to crests of ridges, reaches roughly
1000 m. A characteristic distance between bottoms of troughs
or crests of ridges is 4 to 15 km. The sigmoidal feature is more
evident trenchward than landward in the surveyed area. Landward
(NE) facing slopes of the ridges are generally linear and gentle.
Secondary feature is the N-S to NNE trending ridges and adjoining
V-shaped valleys that run from north to south in the middle part
of the integrated map area, which offset the most prominent NNW
trending sigmoidal structures. Third feature is existence of the NNE
to NE trending narrow and relatively short valleys that cut the major
NNW-trending sigmoidal structures.
The morphological feature can be divided into 3 different
blocks in general, named Block-A, Block-B, and Block-C from SW
to NE (Fig.6). In Block-A, NNW trending ridges that are mostly
narrow with widths of 4 to 8 km shows very rough morphology,
which are indicated by dissected and narrow V-shape valleys. The
shallowest ridge that runs from NNW to SSE in middle of Block-A
is 1000 m water depth and the deepest valley in NW part of Block-A
is 2400 m water depth. Land sliding traces can be clearly observed
at almost all the SW facing scarps of the deepest ridge that run
along the southwestern side in Block-A. The shallowest ridge is
also featured by irregular circular failures in the SW facing slope.
Isolated circular morphology features are commonly observed in
the northeastern part of Block-A, for examples at 4°14'N-93°24',
4°12.5'N-93°25', 4°11'N-93°29.5', and 4°02.5'N-93°36', and those
are limited by very steep hill walls. A wide (4 km to 8 km) and long
(several tens of km up to 60 km) valley is parallel to the deepest
ridge. The valley surface is flat, smooth and bordered by steep scarp
on both sides. Another valley observed in the northeastern side of
Block-A shows an irregular shape with undulating surface.
NNW trending ridges in Block-B are mostly wider than
Block-A, varying its width from 8 km to 15 km in the north and 6
km to 8 km in the south, and dissected by V- to U-shaped valleys.
The shallowest area is located in the northern part of Block-B, up
to 700 m water depth (around 4°35'N-93°23'E) and the deepest area
is located in the southern part of Block-B (around 3°54'N-93°54'E)
at 2400 m water depth. The NNW trending ridges show rough but
slightly rounded topography that is subjected to surface erosion or
slope failures, suggesting that Block-B is less active than Block-A.
Many short steep scarps dissect the NNW trending ridges. In the
middle part of Block-B, the NS to NNE-SSW trending ridges
and adjoining V-shaped valleys are observed. Isolated hills
or depressions are located at 4°03'N-93°42', 4°05'N-93°40.5',
4°13'N-93°35', 4°19'N-93°35', and 4°28'N-93°26'E, which are
bounded by steep scarps. A steep and long valley is observed near
4°34'N-93°35'E with depths around 2200 m. An well-developed
valley with dimensions of at least 20 km long and 8 km wide, and
with water depths from 2200 m to 2400 m, is found in the southern
part of Block-B, centered at 3°54'N-93°54'E. Surface of another
valley with a length of at least 40 km, centered at 4°03'N-93°54'E,
is not flat but undulating.
A NNW-trending broad ridge with small internal sigmoidal
structures occupies Block-C. The shallowest part reaches at 600 m
water depth at around 4°32'N-93°43'E and the deepest part is 1700
m water depth in the southeastern corner of Block-C. Morphology
of Block-C shows still but less sigmoidal structure than Blocks-A
and -B and the most rounded morphology in the integrated map
area, suggesting that Block-C is less active than Blocks-A and -B. In
the northern half of Block-C, the NS to NNE-SSW trending ridges
and adjacent V-shaped valleys cut the NNW trending broad ridge
as a northern continuation of those in Block-B. Many short steep
scarps or narrow valleys oriented in the trench-normal direction
also dissect the NNW-trending broad ridge. Isolated and irregular
depressions are observed at 4°47'N-93°33'E, 4°37'N-93°41'E,
4°36'N-93°46'E, 4°29'N-93°43'E, 4°18'N-93°51'E, and 4°17'N-
93°52'E.
5. Morphological interpretation
Fig.7 shows a morphological interpretation of the
bathymetric features, which is slightly modified from the original
interpretation of Permana et al. (2011). The NNW trending ridges
show relatively gently dipping slopes facing to land and steep slopes
facing to trench. We interpret that most of the NNW trending ridges
in the integrated map area represent deformed fold-belts or thrust
folds and that the related thrust faults mostly run along the SW side
bases of the NNW trending ridges. Possible Middle Thrust and
6
Detailed bathymetry off the northwest Sumatra
JAMSTEC Rep. Res. Dev., Volume 15, September 2012, 1_11
Fig. 5. A new detailed bathymetric map integrated KY09-09 bathymetry data with NT05-02 bathymetry data. Contour interval is 100 meters.
7
K. Hirata et al.
JAMSTEC Rep. Res. Dev., Volume 15, September 2012, 1_11
Fig. 6. Three blocks demarcated morphologically.
8
Detailed bathymetry off the northwest Sumatra
JAMSTEC Rep. Res. Dev., Volume 15, September 2012, 1_11
Fig. 7. Morphological interpretation from the integrated bathymetric map (slightly modified from the original of Permana et al. (2011)).
9
K. Hirata et al.
JAMSTEC Rep. Res. Dev., Volume 15, September 2012, 1_11
Lower Thrust, if those exist, are inferred to appear along any of the
SW side bases of these NNW trending ridges (Sibuet et al.,2007;
Hirata et al., 2008). We will analyze the present bathymetry data
further in detail to identify candidates of fault traces of these possible
major thrusts.
We guess that landward-vergent thrusts, found by Mosher
et al. (2008), become predominant farther trenchward from the
southwestern side of the integrated map area. The N-S to NE-SW
trending ridges and adjoining V shaped valleys, found from north
to south in the middle part of the surveyed region, are interpreted to
be created by dextral strike-slip faults that offset the major NNW-
trending sigmoidal structures. The NNE to NE trending narrow
valleys, seen elsewhere in the whole area, are perhaps normal faults.
We inferred that both of N-S to NE-SW trending and NNE to NE
trending offset structures are attributed to oblique subduction of the
Indo-Australia Plate (KY09-09 scientific party, 2009).
6. Conclusion
During KY09-09 Leg.1 cruise in the late October to the
early November 2009, we conducted a multi-beam bathymetry
survey using R/V KAIYO to collect detailed bathymetric data in a
previously unsurveyed area around Middle Thrust in the outer-arc
high off northwest Sumatra. Then KY09-09 bathymetry data were
integrated with a previous NT05-02 bathymetry data (NT05-02
scientific party, 2005) to make a new fine bathymetry map, gridded
at ~37 m cell size, without any substantial bathymetry gap.
The most predominant morphological feature is the
NNW-trending sigmoidal structures consisting of a series of ridges
and troughs parallel to the trench. We inferred that the sigmoidal
structures represent a series of deformed fold-belts or thrust folds
and that the related thrust faults run on the SW side of these fold
structures. Secondary predominant structures are the N-S to
NE-SW trending ridges and adjoining V-shaped valleys, found
from north to south in the middle part of the integrated map area,
which are interpreted dextral strike-slip faults. Third predominant
structures are the NNE to NE trending narrow valleys dissecting
the predominant NNW trending ridges that can be seen in the
whole integrated map area, which are interpreted normal faults.
Both of second and third structures are perhaps relate to oblique
subduction of the Indo-Australia Plate (NT05-02 scientific party,
2005; Permana et al., 2011).
Acknowledgements
We thank Captain Kohji Samejima and the crews of the
R/V KAIYO for their cooperation and support during the cruise. We
are deeply grateful to Chief radio officer Tokinori Nasu with radio
officers Hiroki Ishiwatari and Mai Minamoto for their great efforts
of collecting and editing the bathymetric data on board. Manuscript
was well improved by valuable comments and suggestions from Dr.
Yukari Kido, an anonymous reviewer, and Dr. Daisuke Suetsugu
(editor). We thank the JAMSTEC Ship Operation Department for
their management of this cruise. We also thank to the JAMSTEC
Research Support Department, Foreign Research Permit of Ristek
and the BPPT to make all the necessary administration works
to allow us the scientific investigation in Indonesian Exclusive
Economic Zone. This work is partially supported by; (1) JSPS-LIPI
Joint Research Program, (2) SATREP by JST-JICA-RISTEK-LIPI,
and (3) KAKENHI (the Grand-in-Aid for Scientific Research (B)
(22403007).
References
Caress, D. W., and D. N. Chayes (2006), MB-System: Mapping the
Seafloor, http://www.mbari.org/data/mbsystem and http://
www.ldeo.columbia.edu/res/pi/MB-System.
Chauhan, A. P. S., S. C. Singh, N. D. Hananto, H. Carton, F.
Klingelhoefer, J.-X. Dessa, H. Permana, N. J. White, D.
Graindorge, and SumatraOBS Scientific Team (2009),
Seismic imaging of forearc backthrusts at northern
Sumatra subduction zone, Geophys.J.Int., 179, 1772-1780,
doi:10.1111 /j.1365-246X.2009.04378.x.
Franke, D., M. Schnabel, S. Ladage, D. R. Tappin, S. Neben, Y. S.
Djajadihardja, C. Müller, H. Kopp, and C. Gaedicke (2008),
The great Sumatra-Andaman earthquakes — Imaging
the boundary between the ruptures of the great 2004 and
2005 earthquakes, Earth Planet. Sci. Lett., 269, 118-130,
doi:10.1016/j.epsl.2008. 01.047.
Graindorge, D., F. Klingelhoefer, J-C. Sibuet, L. McNeill, T. J.
Henstock, S. Dean, M-A. Gutscher, J.X. Dessa, H. Permana,
S. C. Singh, H. Leaug, N. White, H. Carton, J. A. Maloda,
C. Rangini, K. G. Aryawan, A. K. Chaubey, Ajay Chauhan,
D. R. Galih, C. J. Greenroyd, A. Laesanpura, J. Prihantono,
G. Roylef, and U. Shankar (2008), Impact of lower plate
structure on upper plate deformation at the NW Sumatran
convergent margin from seafloor morphology, Earth
10
Detailed bathymetry off the northwest Sumatra
JAMSTEC Rep. Res. Dev., Volume 15, September 2012, 1_11
Planet. Sci. Lett., 275, doi.:10.1016 /j.epsl.2008.04.053.
Henstock, T., L. C. McNeill, and D. R. Tappin (2006), Seafloor
morphology of the Sumatran subduction zone: Surface
rupture during megathrust earthquakes?, Geology, 34, 485-
488, doi: 10.1130/ 22426.1.
Hirata, K., K. Satake, Y. Tanioka, T. Kuragano, Y. Hasegawa, Y.
Hayashi, and N. Hamada (2006), The 2004 Indian Ocean
Tsunami: Tsunami source model from satellite altimetry,
Earth Planets Space, 58,195-201.
Hirata, K., J. A. Hanson, E. L. Geist, T. Seno, W. Soh, T. Fujiwara, C.
Müller, H. Machiyama, E. Araki, K. Arai, K. Watanabe, L.
Seeber, Y. S. Djajadihardia, S. Burhanuddin, B. M. Kemal,
N. D. Hananto, H. Kurnio, Y. Anantasena, and K. Suyehiro
(2008), The fifth model for the huge tsunami generation
off northwest Sumatra during the 2004 Sumatra-Andaman
earthquake, 2008 AGU Fall meeting, G43B-02.
Hirata, K., H. Permana, T. Fujiwara, Udrekh, E. Z. Gaffar, M.
Kawano, Yusuf S. Djajadihardia, and K. Arai (2010),
Geological evidences of the fifth model for the tsunami
generation in ocean floor off northwest Sumatra during
the 2004 Sumatra-Andaman earthquake, 2010 AGU Fall
meeting, T11B-2090.
Jaffe, B.E., J.C. Borrero, G.S. Prasetya, R. Peters, B. McAdoo, G.
Gelfenbaum, R. Morton, P. Ruggiero, B. Higman, and L.
Dengler (2006), Northwest Sumatra and Offshore Islands
Field Survey after the December 2004 Indian Ocean
Tsunami, Earthquake Spectra, 22, S105-S135, doi:http://
dx.doi.org/10.1193/1.2207724.
KY09-09 scientific party (2009), KAIYO Cruise Report YK09-
09 Leg 1 Bathymetry Survey off northwest Sumatra, 25
October - 20 November 2009 Benoa-Benoa, (e.d.) Hirata,
K., and H. Permana, Japan Agency for Marine-Earth
Science and Technology (JAMSTEC), (Unpublished).
Lin, J-Y., X. Le Pichon, R. Claude, J-C. Sibuet, and M. Tanguy (2009),
Spatial aftershock distribution of the 26 December 2004
great Sumatra-Andaman earthquake in the northern Sumatra
area, Geochem. Geophys. Geosyst.,10, doi: 10.1029/2009GC
002454.
McNeill, L., T. Henstock, and D. Tappin (2005), Evidence for
Seafloor Deformation During Great Subduction Zone
Earthquakes of the Sumatran Subduction zone: Results
From the First Seafloor Survey Onboard the HMS Scott,
2005, 2005 AGU Fall meeting, U14A-02, 20051.
Mosher, D. C., J. A. Austin Jr., D. Fisher, and S. P. S. Gulick (2008),
Deformation of the northern Sumatra accretionary prism
from high-resolution seismic reflection profiles and ROV
observations, Marine Geology, 252, 89-99, doi:/10.1016/j.
margeo.2008. 03.014.
NT05-02 scientific party (2005), http://www.jamstec.go.jp/
jamstec-e/sumatra/natsushima/bm/contents.html.
Permana, H., K. Hirata, T. Fujiwara, Udrekh, E. Z. Gaffar, M.
Kawano, and Y. S. Djajadihardja (2011), Fault pattern
and active deformation of outer arc ridge of northwest of
Simeulue Island, Aceh, Indonesia, Bulletin on Marine
Geology (English Bulletin), Indonesia, (in press).
Plafker, G., S. Nishenko, L. Cluff, and M. Syahria (2006), The
Cataclysmic 2004 Tsunami on NW Sumatra-Preliminary
Evidence for a Near-Field Secondary Source Along the
Western Aceh Basin, Seism. Res. Lett., 77, 231.
SeaBeam Instruments, Inc. (1999), Sea Beam 2100 Manual
Supplement (RV-08AGS), Sea Beam 2100 Operator's
Manual, No. 2125-8004, Revision A, 5-6.
SeaBeam Instruments, Inc. (1999), Sea Beam 2100 Factory
Acceptance Test, Sea Beam 2100 Series Multibeam
Bathymetric Survey System, No.2101-8237, Revision G,
1-1.
Sibuet, J-C., C. Rangin, X. Le Pichon, S. Singh, A. Cattaneo, D.
Graindorge, F. Klingelhoefer, J-Y. Lin, J. Malod, T. Maury,
J-L. Schneider, N. Sultan, M. Umber, and H. Yamaguchi,
26th December 2004 great Sumatra-Andaman earthquake:
Co-seismic and post-seismic motions in northern Sumatra,
Earth Planet. Sci. Lett., 263, 88-103, doi:10.1016/j.
epsl.2007.09.005, 2007.
Sladen, A., and H. Hebert (2008), On the use of satellite altimetry
to infer the earthquake rupture characteristics: application
to the 2004 Sumatra event, Geophys. J. Int., 172, 707-714,
DOI: 10.1111/j.1365-246X.2007.03669.x.
Smith, W. H. F, and D. T. Sandwell (1997), Global Sea Floor
Topography from Satellite Altimetry and Ship Depth
Soundings, Science, 277, 1956-1962, DOI: 10.1126/
science.277.5334.1956.
Soh, W., Y. S. Djajadihardja, Y. Anantasena, K. Arai, E. Araki, S.
Burhanuddin, T. Fujiwara, N. D. Hananto, K. Hirata, H.
Kurnio, H. Machiyama, B. K. Mustafa, C. Mueller, L.
Seeber, K. Suyehiro, and K. Watanabe (2005), Sea bottom
shattered by the Sumatra-Andaman Earthquake of 26th
December 2004, EOS Trans. AGU 86, no. 52, Fall Meet.
Suppl., U11B-0842.
Tanioka, Y., Yudhicara, T. Kususose, S. Kathiroli, Y. Nishimura,
S. Iwasaki, and K. Satake (2006), Rupture process of the
2004 great Sumatra-Andaman earthquake estimated from
tsunami waveforms, Earth Planets Space, 58, 203-209.
11
K. Hirata et al.
JAMSTEC Rep. Res. Dev., Volume 15, September 2012, 1_11
Tsunami Field Survey Team in Banda Aceh of Indonesia (2005),
<http://www.drs.dpri.kyoto-u.ac.jp/Sumatra/indonesia-
ynu/indonesiasurveyynue.html>.
Wessel, P., and W. H. F. Smith, New version of the Generic Mapping
Tools released, EOS Trans. AGU, 76, 329, 1995