23
Gas Distribution Network Optimization with Genetic Algorithm Kuntjoro Adji S. Lala Septem Riza Kusuma Chasanah Widita Febi Haryadi
| Date post: | 11-Dec-2015 |
| Category: |
Documents |
| Upload: | raymundo-axtell |
| View: | 221 times |
| Download: | 0 times |

Gas Distribution Network Optimization
with Genetic Algorithm
Kuntjoro Adji S.Lala Septem Riza
Kusuma Chasanah WiditaFebi Haryadi
Introduction
• Natural gas plays an important role in providing clean energy for the community.
• Gas companies have planned to design and build a new gas pipeline network in many places.
• To build pipeline network needs expensive cost in pipeline cost, investment cost, operasional cost, etc.
• So, pipe diameter optimization process must be done to minimize the investment cost with considering to the pressure and flow rates that have been agreed in the contract
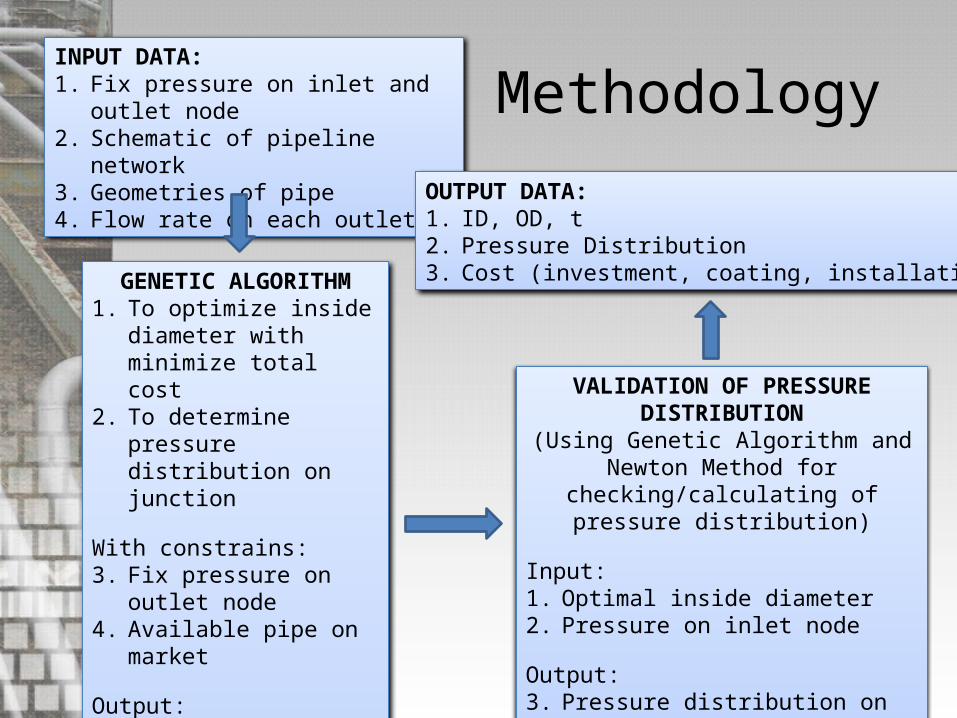
MethodologyINPUT DATA:1. Fix pressure on inlet and outlet node2. Schematic of pipeline network3. Geometries of pipe4. Flow rate on each outlet
GENETIC ALGORITHM1. To optimize inside
diameter with minimize total cost
2. To determine pressure distribution on junction
With constrains:3. Fix pressure on outlet
node4. Available pipe on market
Output:5. Optimal inside diameter6. Cost calculation7. Pressure on each node
VALIDATION OF PRESSURE DISTRIBUTION(Using Genetic Algorithm and Newton
Method for checking/calculating of pressure distribution)
Input:1. Optimal inside diameter2. Pressure on inlet node
Output:3. Pressure distribution on each node
OUTPUT DATA:1. ID, OD, t2. Pressure Distribution3. Cost (investment, coating, installation)
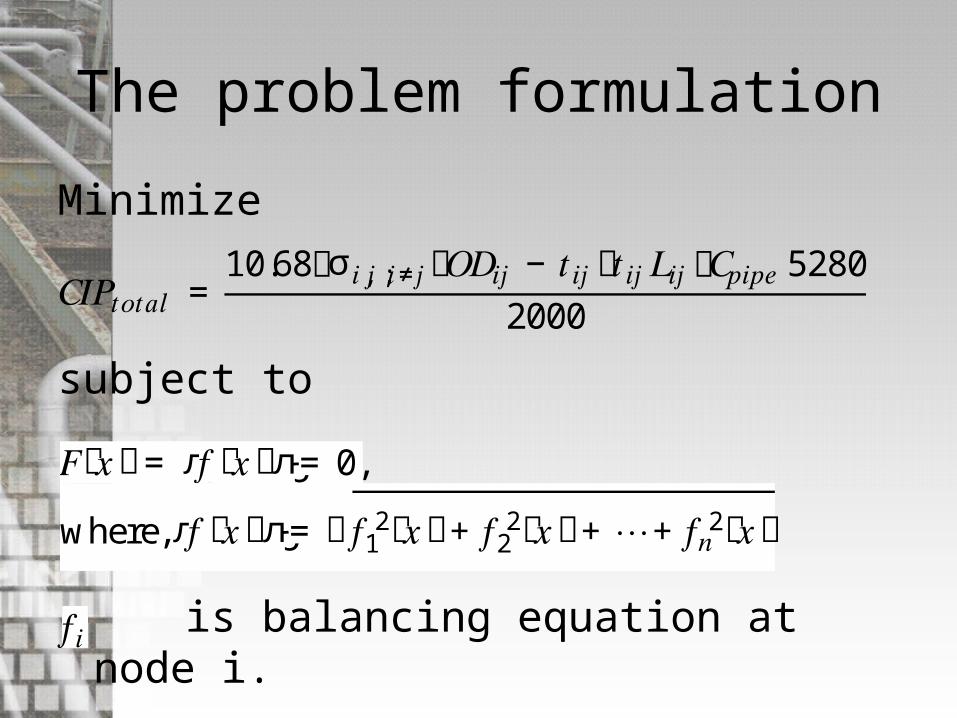
The problem formulation
Minimize
subject to
is balancing equation at node i.
𝐶𝐼𝑃𝑡𝑜𝑡𝑎𝑙 = 10.68൫σ ൫𝑂𝐷𝑖𝑗 − 𝑡𝑖𝑗൯𝑡𝑖𝑗𝐿𝑖𝑗𝑖,𝑗;𝑖≠𝑗 ൯𝐶𝑝𝑖𝑝𝑒52802000
𝐹ሺ𝑥ሻ= ԡ𝑓ሺ𝑥ሻԡ= 0, where,ԡ𝑓ሺ𝑥ሻԡ= ට𝑓12ሺ𝑥ሻ+ 𝑓22ሺ𝑥ሻ+ ⋯+ 𝑓𝑛2ሺ𝑥ሻ 𝑓𝑖
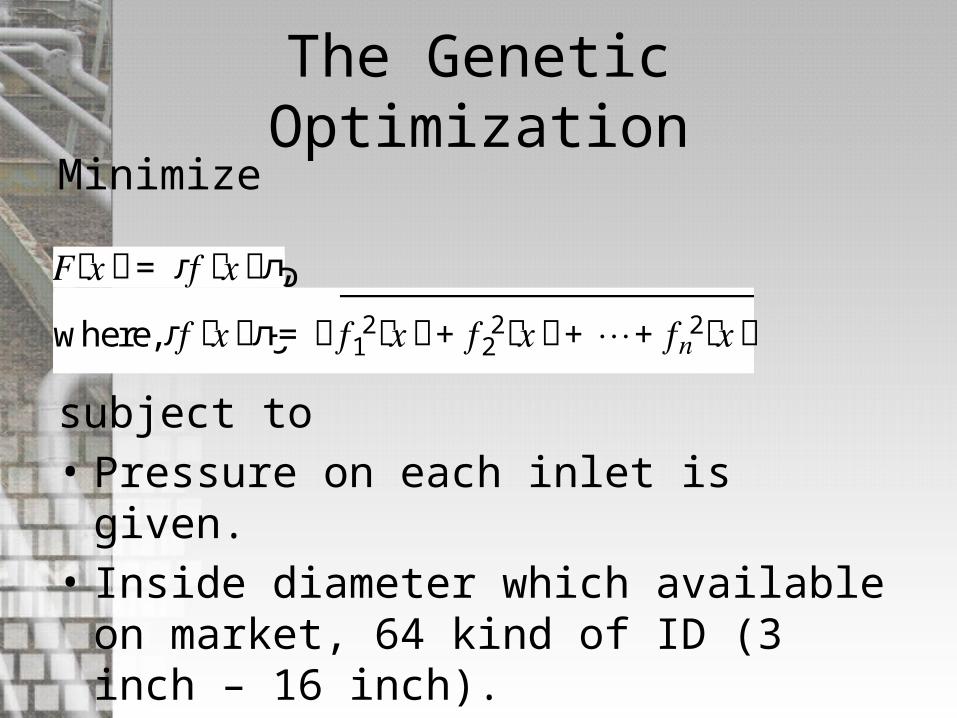
The Genetic OptimizationMinimize
subject to• Pressure on each inlet is given.• Inside diameter which available on market, 64
kind of ID (3 inch – 16 inch).• flow rate on each outlet.
𝐹ሺ𝑥ሻ= ԡ𝑓ሺ𝑥ሻԡ, where,ԡ𝑓ሺ𝑥ሻԡ= ට𝑓12ሺ𝑥ሻ+ 𝑓22ሺ𝑥ሻ+ ⋯+ 𝑓𝑛2ሺ𝑥ሻ
The model of gas flow in pipe
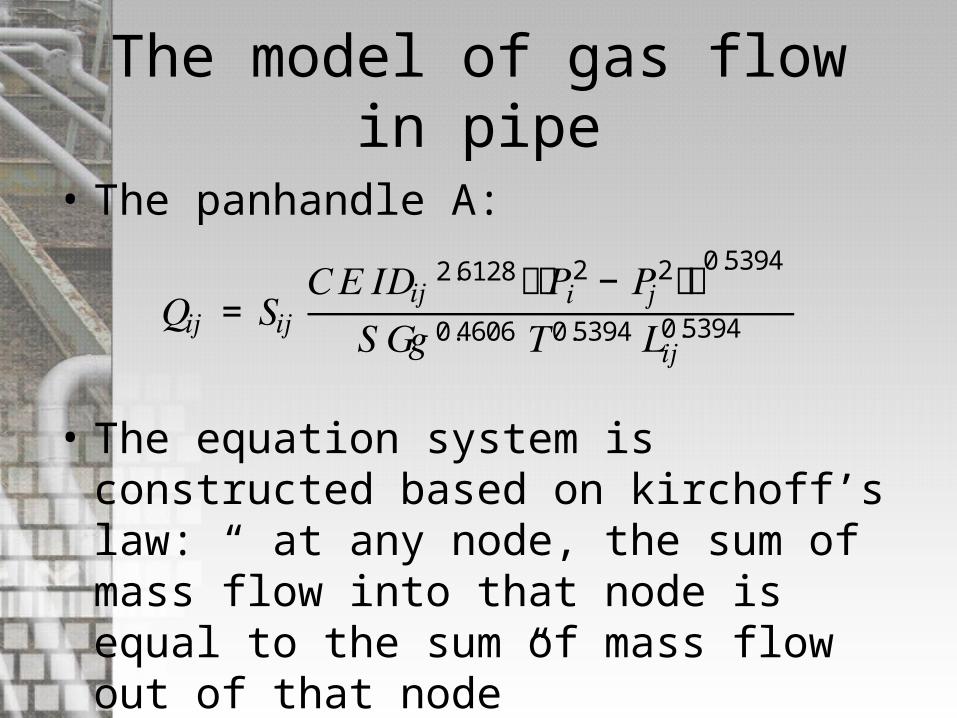
• The panhandle A:
• The equation system is constructed based on kirchoff’s law: “ at any node, the sum of mass flow into that node is equal to the sum of mass flow out of that node”
𝑄𝑖𝑗 = 𝑆𝑖𝑗 𝐶 𝐸 𝐼𝐷𝑖𝑗2.6128൫ห𝑃𝑖2 − 𝑃𝑗2ห൯0.5394 𝑆 𝐺𝑔0.4606 𝑇0.5394 𝐿𝑖𝑗0.5394
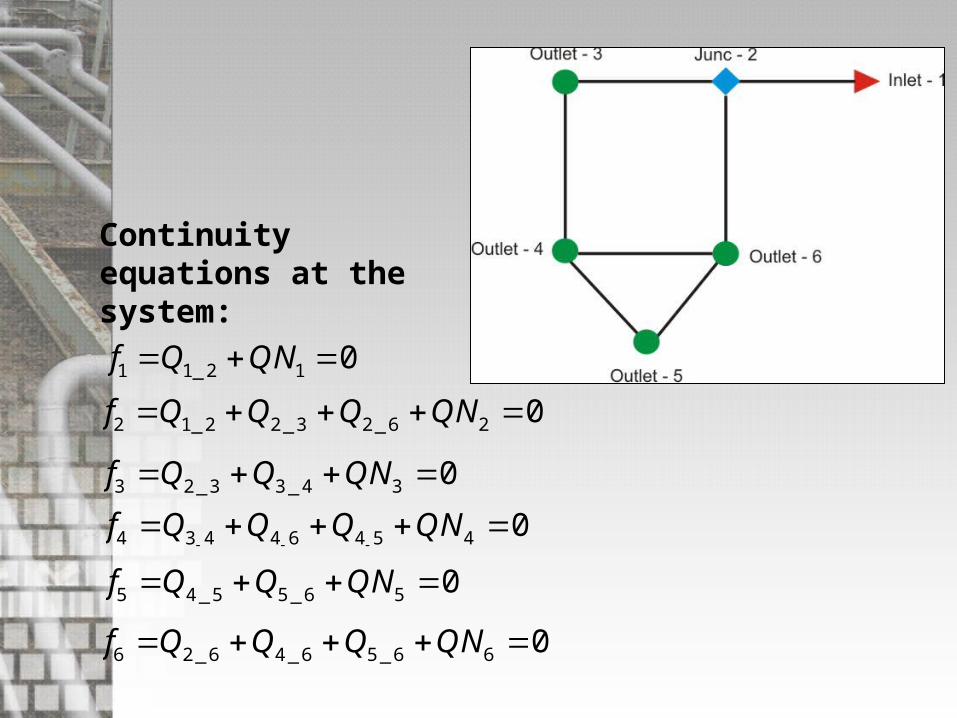
f Q QN1 1_ 2 1 0
f Q Q Q QN2 1_ 2 2 _ 3 2 _ 6 2 0
f Q Q QN3 2 _ 3 3 _ 4 3 0
f Q Q Q QN4 3 4 4 6 4 5 4 0
f Q Q QN5 4 _ 5 5 _ 6 5 0
f Q Q Q QN6 2 _ 6 4 _ 6 5 _ 6 6 0
Continuity equations at the system:
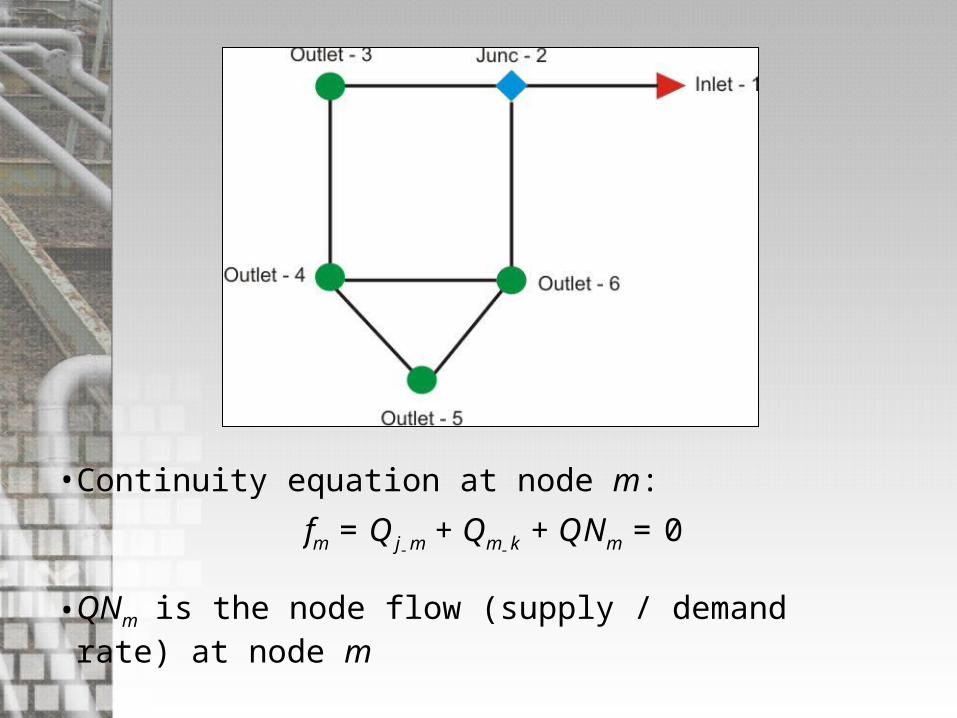
• Continuity equation at node m:
• QNm is the node flow (supply / demand rate) at node m
- -= + + =m j m m k mf Q Q QN 0
06
5394.06_5
5394.026
25
6182.26_5
6_5
5394.06_4
5394.026
24
6182.26_4
4
5394.06_2
5394.026
22
6182.26_2
6_26
QN
L
ppDKS
L
ppDKS
L
ppDKSf
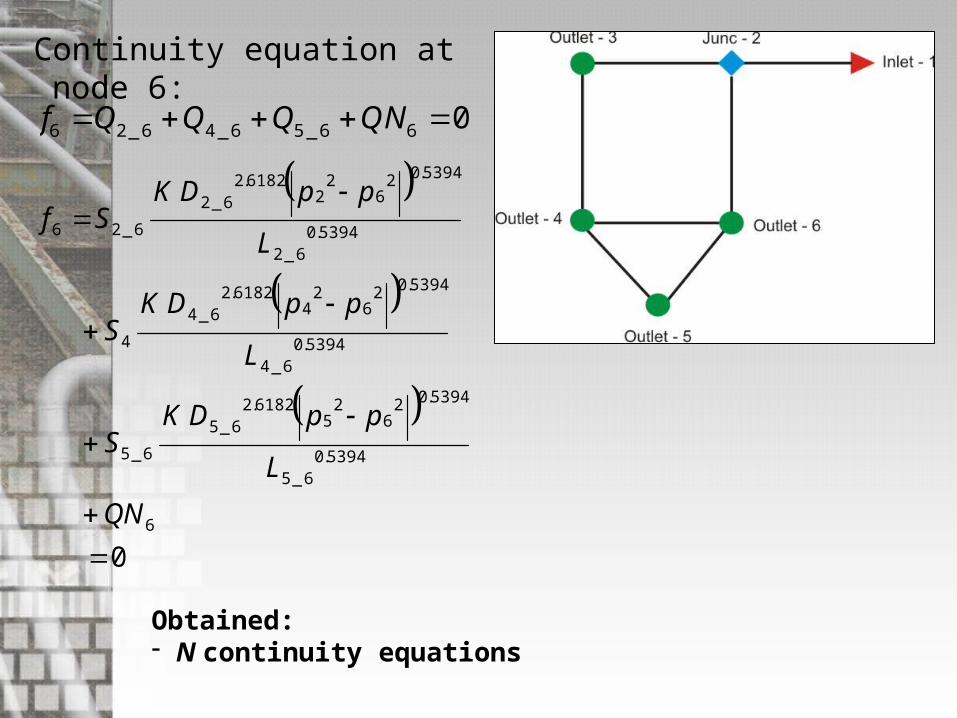
f Q Q Q QN6 2 _ 6 4 _ 6 5 _ 6 6 0
Continuity equation at node 6:
Obtained:- N continuity equations
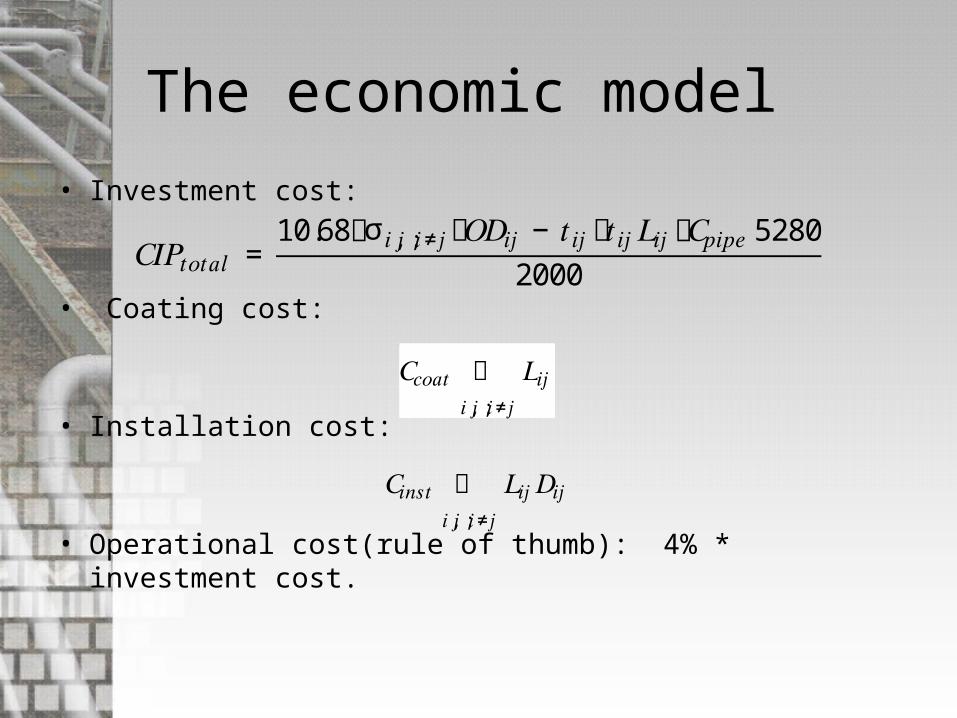
The economic model
• Investment cost:
• Coating cost:
• Installation cost:
• Operational cost(rule of thumb): 4% * investment cost.
𝐶𝐼𝑃𝑡𝑜𝑡𝑎𝑙 = 10.68൫σ ൫𝑂𝐷𝑖𝑗 − 𝑡𝑖𝑗൯𝑡𝑖𝑗𝐿𝑖𝑗𝑖,𝑗;𝑖≠𝑗 ൯𝐶𝑝𝑖𝑝𝑒52802000
𝐶𝑐𝑜𝑎𝑡 𝐿𝑖𝑗𝑖,𝑗;𝑖≠𝑗
𝐶𝑖𝑛𝑠𝑡 𝐿𝑖𝑗𝐷𝑖𝑗𝑖,𝑗;𝑖≠𝑗

Flow Chart of Genetic Algorithm

The Computation Method:The Genetic Algorithm
• To search the suitable pressure and index of inside diameter available on the market which give the best fitness.
• The representation of population:

The Computation Method:The Genetic Algorithm (con’t)
• Fitness function:
• We use usual the Selection, crossover and mutation operator.
2 2 21 2
min ( ) ( ) ,
, ( ) ( ) ( ) ... ( )n
F x f x
where f x f x f x f x
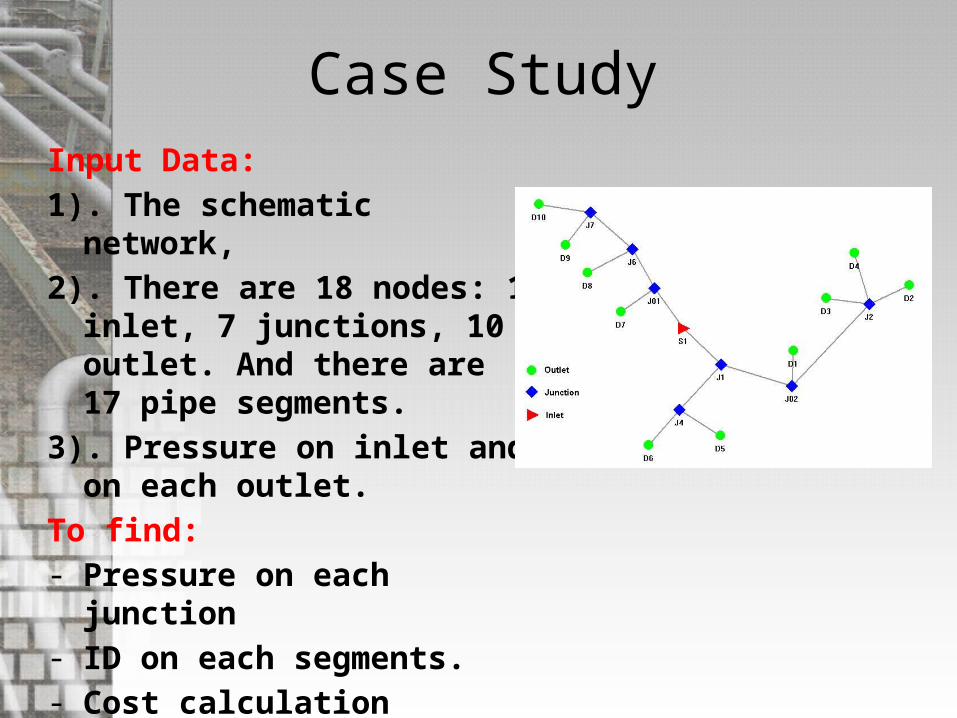
Case StudyInput Data:1). The schematic network, 2). There are 18 nodes: 1 inlet, 7
junctions, 10 outlet. And there are 17 pipe segments.
3). Pressure on inlet and on each outlet.
To find: - Pressure on each junction- ID on each segments.- Cost calculation
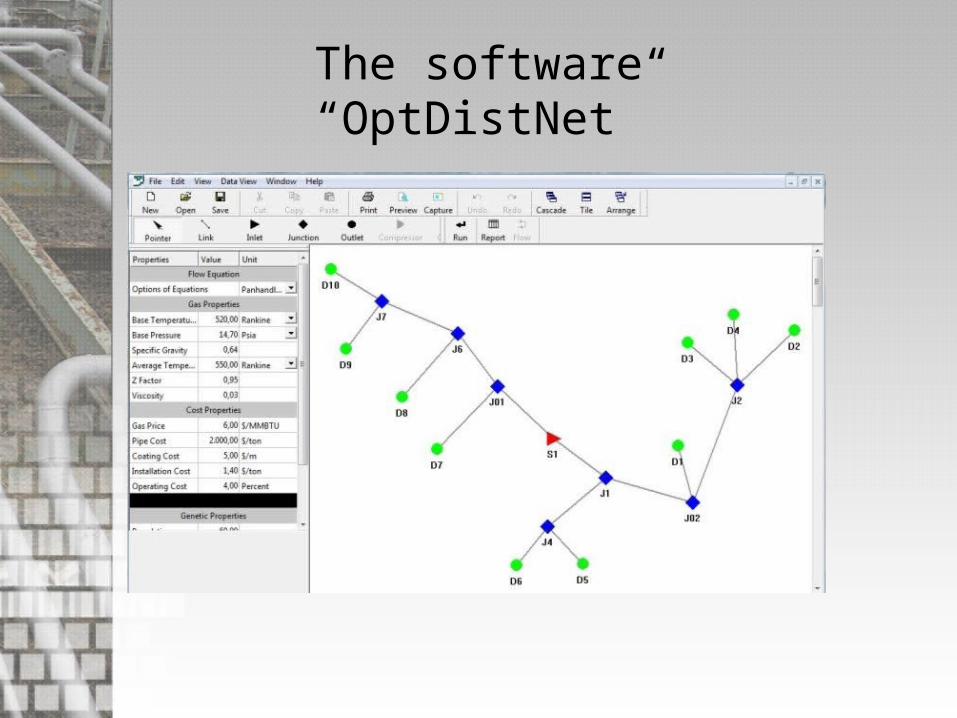
The software“OptDistNet”
1st simulation
• To calculate the optimum diameter using GA• Input: pressure on inlet “S1” and pressure on
each outlet, length of pipe.• Output: ID on 17 segment pipe and pressure
on each junction.
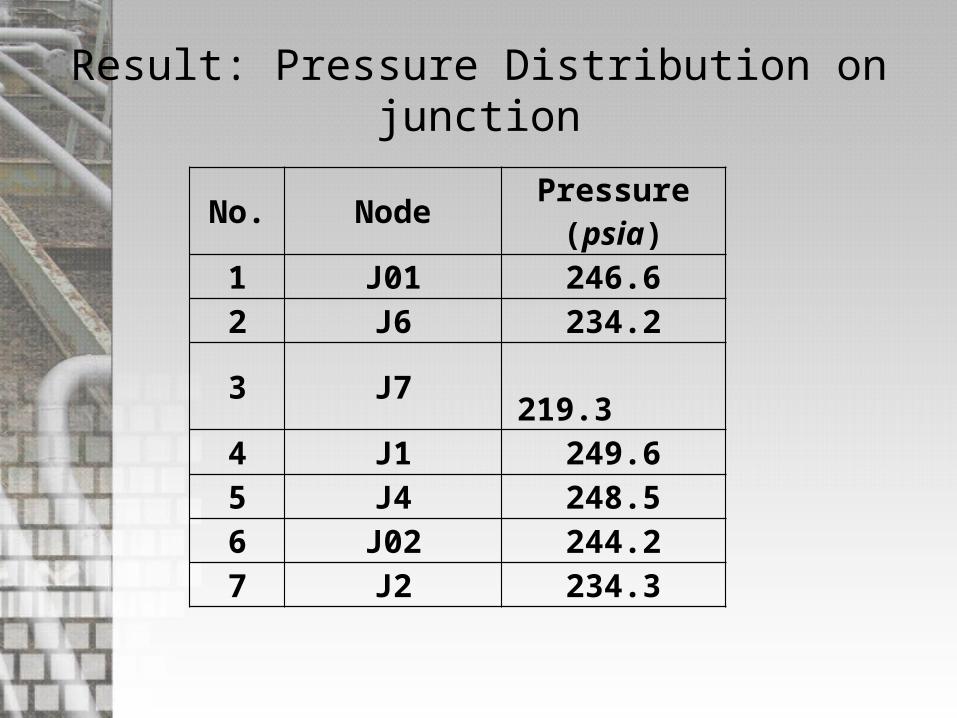
Result: Pressure Distribution on junction
No. Node Pressure (psia)
1 J01 246.6
2 J6 234.2
3 J7 219.3
4 J1 249.6
5 J4 248.5
6 J02 244.2
7 J2 234.3
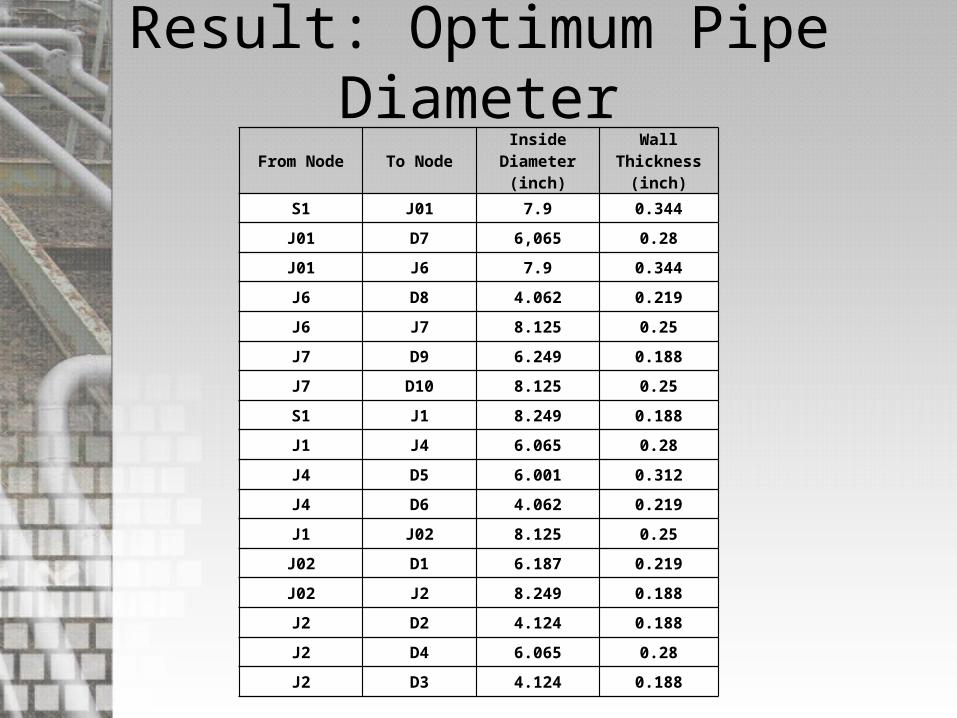
Result: Optimum Pipe DiameterFrom Node To Node
Inside Diameter
(inch)
Wall Thickness
(inch)
S1 J01 7.9 0.344
J01 D7 6,065 0.28
J01 J6 7.9 0.344
J6 D8 4.062 0.219
J6 J7 8.125 0.25
J7 D9 6.249 0.188
J7 D10 8.125 0.25
S1 J1 8.249 0.188
J1 J4 6.065 0.28
J4 D5 6.001 0.312
J4 D6 4.062 0.219
J1 J02 8.125 0.25
J02 D1 6.187 0.219
J02 J2 8.249 0.188
J2 D2 4.124 0.188
J2 D4 6.065 0.28
J2 D3 4.124 0.188
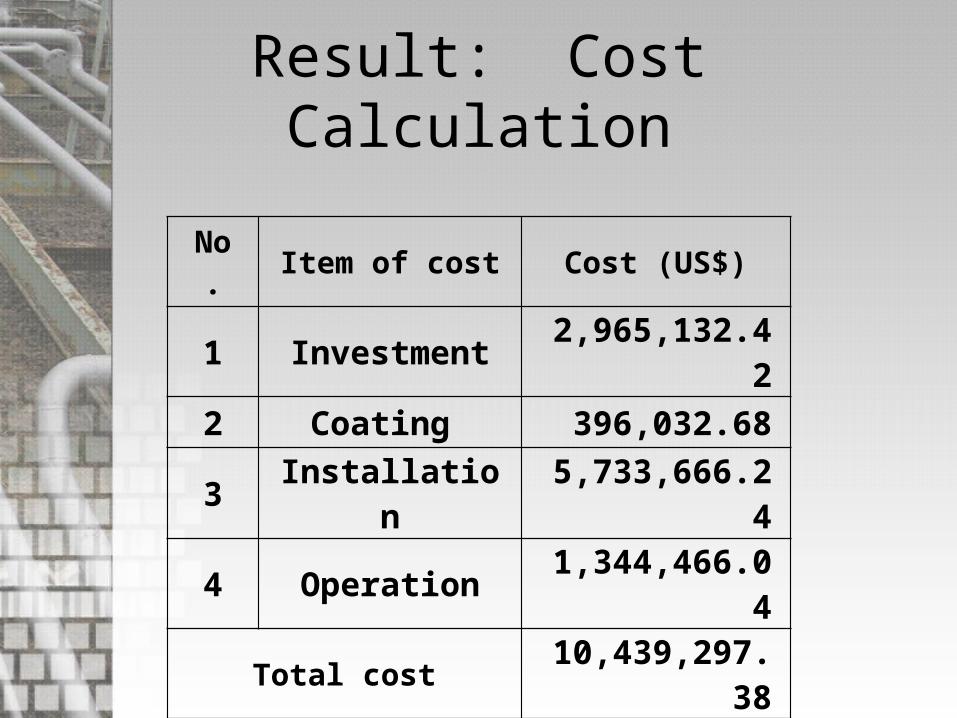
Result: Cost Calculation
No. Item of cost Cost (US$)
1 Investment 2,965,132.42
2 Coating 396,032.68
3 Installation 5,733,666.24
4 Operation 1,344,466.04
Total cost 10,439,297.38
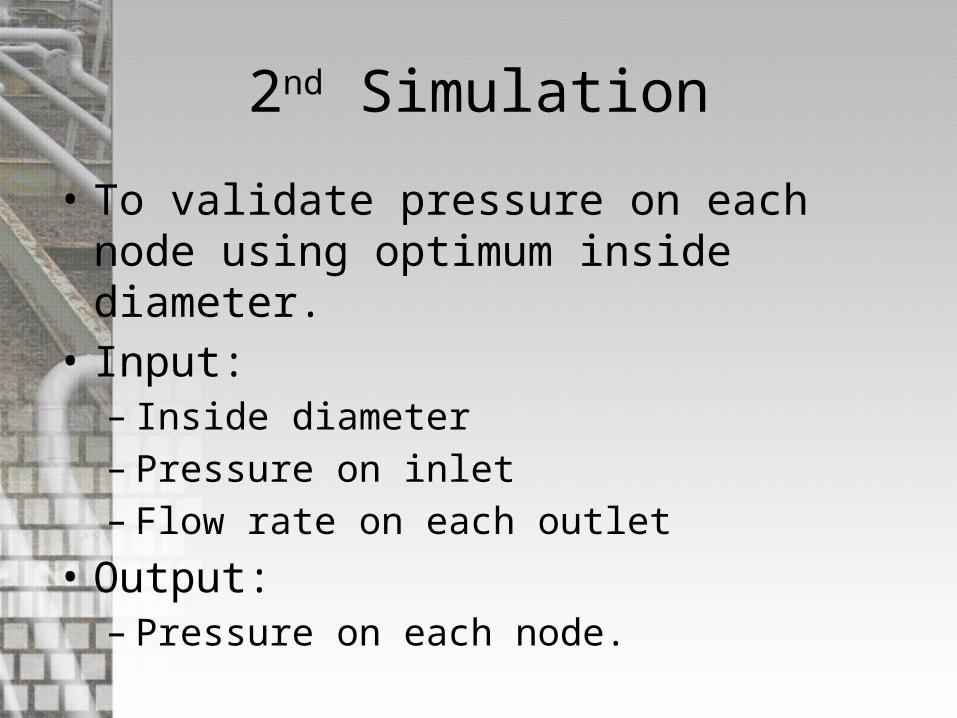
2nd Simulation
• To validate pressure on each node using optimum inside diameter.
• Input: – Inside diameter– Pressure on inlet– Flow rate on each outlet
• Output:– Pressure on each node.
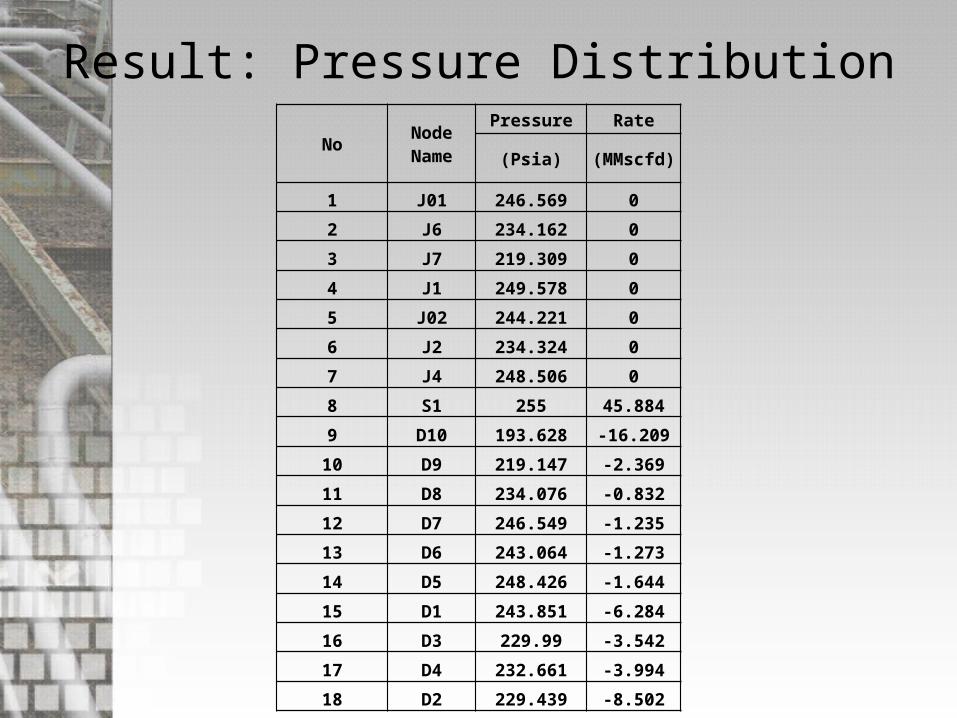
Result: Pressure DistributionNo Node Name
Pressure Rate
(Psia) (MMscfd)
1 J01 246.569 0
2 J6 234.162 0
3 J7 219.309 0
4 J1 249.578 0
5 J02 244.221 0
6 J2 234.324 0
7 J4 248.506 0
8 S1 255 45.884
9 D10 193.628 -16.209
10 D9 219.147 -2.369
11 D8 234.076 -0.832
12 D7 246.549 -1.235
13 D6 243.064 -1.273
14 D5 248.426 -1.644
15 D1 243.851 -6.284
16 D3 229.99 -3.542
17 D4 232.661 -3.994
18 D2 229.439 -8.502

Conclusions
• The simple Genetic Algorithm can be helpful in finding an optimal inside diameter.

Thank You


