ILASS Americas, 19 th Annual Conference on Liquid Atomization and Spray Systems, Toronto, Canada, May 2006 Detailed Understanding of Drop Atomization by Gas Crossflow Using the Volume of Fluid Method Sachin Khosla* and Clifford E. Smith CFD Research Corporation 215 Wynn Drive, Suite 501 Huntsville, AL 35805 USA Ryan P. Throckmorton Virginia Polytechnic Institute and State University Blacksburg, VA 24601 USA Abstract Two popular yet conflicting theories exist in the atomization community to describe the breakup of a liquid drop by gas crossflow: 1) the ‘shear’ or ‘boundary-layer stripping’ theory and 2) the surface waves driven, sheet atomization theory. Various compelling arguments have been put forth in support of both theories, but there has been no authori- tative conclusion on the validity of either one. In this paper, we present detailed understanding of liquid drop breakup by gas crossflow using the Volume Of Fluid (VOF) approach, a computational method that tracks the liq- uid-gas interface. The VOF approach is first compared and validated against existing experimental data for liquid drop breakup. Then, detailed insights are provided for the drop breakup process using VOF. Substantial evidence is presented to help resolve the debate on drop breakup phenomenological theories. * Sachin Khosla, Corresponding author
Transcript
ILASS Americas, 19th Annual Conference on Liquid Atomization and Spray Systems, Toronto, Canada, May 2006
Detailed Understanding of Drop Atomization by Gas Crossflow Using the Volume of Fluid Method
Sachin Khosla* and Clifford E. Smith
CFD Research Corporation 215 Wynn Drive, Suite 501 Huntsville, AL 35805 USA
Ryan P. Throckmorton
Virginia Polytechnic Institute and State University Blacksburg, VA 24601 USA
Abstract
Two popular yet conflicting theories exist in the atomization community to describe the breakup of a liquid drop by gas crossflow: 1) the ‘shear’ or ‘boundary-layer stripping’ theory and 2) the surface waves driven, sheet atomization theory. Various compelling arguments have been put forth in support of both theories, but there has been no authori-tative conclusion on the validity of either one. In this paper, we present detailed understanding of liquid drop breakup by gas crossflow using the Volume Of Fluid (VOF) approach, a computational method that tracks the liq-uid-gas interface. The VOF approach is first compared and validated against existing experimental data for liquid drop breakup. Then, detailed insights are provided for the drop breakup process using VOF. Substantial evidence is presented to help resolve the debate on drop breakup phenomenological theories.
* Sachin Khosla, Corresponding author
Introduction The breakup of a single liquid drop by gas cross-
flow is of fundamental importance in many combustion systems. The rate of atomization and evaporation of liquid drops significantly affects the combustion effi-ciency in gas turbine engines, augmentors, diesel en-gines and many practical applications. The mechanisms leading to liquid drop breakup have been extensively studied experimentally and theoretically for many years. Multiple and often conflicting phenomenological models have often been proposed to describe the drop breakup process. Unfortunately, definitive understand-ing on the processes leading to the breakup of a liquid drop by gas crossflow has been elusive to date.
There exist at least two different, popular theories that explain the breakup of a liquid drop in the shear breakup regime: 1) The boundary-layer stripping theory originally proposed by Ranger and Nicholls [1] and 2) the surface waves driven, sheet breakup theory origi-nally proposed by Liu and Reitz [2].
The boundary-layer stripping theory has had quite a backing from the academic and industrial community since Ranger and Nicholls [1] first published it. Ranger and Nicholls [1] proposed that a drop breaks into smaller drops when the shearing action of air strips of some mass from the boundary layer on the liquid drop. Figure 1 shows a schematic of the boundary layer strip-ping proposition and an example experimental picture that is used to justify the same. The theory proposes that liquid material is continuously stripped off from the surface of the drop till the drop is reduced to a fine mi-cro-mist.
Many researchers have used a boundary layer analyses to develop correlations for the rate of disinte-gration of the parent drop, SMD and velocities of child drops etc. A significant amount of experimental and theoretical research has been carried out by Professor Faeth’s group supporting the theory of boundary layer stripping as the main cause of drop atomization. Hsiang and Faeth [3] studied the breakup of a liquid drop to determine the various regimes of drop breakup (bag, multimode, shear etc.) as a function of Weber number and Ohnesorge number. Drag coefficient as a function of drop deformation and shearing were noted, and drop size correlations of child drops resulting from the parent drop’s breakup were developed based on the boundary layer stripping theory. Chou et al. [4] developed corre-lations for rate of liquid removal and child drop SMD and velocities as a function of the parent drop’s lifetime based on the boundary layer stripping theory in the shear breakup regime. Various prominent research groups have also supported the boundary layer stripping theory as the mechanism responsible for liquid drop breakup, Delplanque and Sirignano [5], Wierzba and Takayama [6] and Chryssakis and Assanis [7] to name a few.
The surface waves driven, sheet atomization the-ory originally proposed by Liu and Reitz [2] attributes the breakup of liquid drops to be caused by unstable waves growing on the surface of the drops. Liu and Reitz [2] analyzed the distortion and breakup mecha-nisms of high-speed liquid drop and showed experi-mental evidence in support of a dominant sheet based breakup mechanism. It was observed that the drop flat-tens and deforms into a convex sheet in the shear breakup regime due to aerodynamic forces. The breakup of the convex sheet then occurs by a mecha-nism similar to the ‘stretched streamwise ligament’ breakup mechanism described by Stapper and Samuel-sen [14]. Lee and Reitz [8] studied the effect of liquid properties on the breakup mechanism of high-speed liquid drops supporting sheet based atomization and casting more doubt on the existence of the boundary layer stripping mechanism. Various research groups have also endorsed “waves driven” atomization as the primary cause of drop breakup, with different ap-proaches such as TAB (O’Rourke and Amsden, [9]) and ETAB (Tanner [10], [11]).
The primary points to be taken from several of the studies on liquid drop atomization are that (a) the mechanisms leading to drop breakup are still unclear and (b) considerable difference of opinion exists within prominent research groups across the world on the processes leading to drop breakup. The objective of the present work was to investigate the breakup mecha-nisms of liquid drops by gas crossflow by employing a high fidelity numerical approach – Volume Of Fluid (VOF). The benefits of a high fidelity numerical ap-proach become very evident in this situation as no de-finitive conclusion can be arrived at by experimental observations alone. To our knowledge, the VOF ap-proach has not been validated and used so far to provide detailed insights into the drop breakup process by gas crossflow. This paper describes the computational ap-proach used to employ VOF to study drop atomization, and presents detailed insights into the drop breakup processes in the bag and shear breakup regime.
Volume Of Fluid Method
The Volume Of Fluid (VOF) technique proposed by Nichols and Hert [12] is typically used for tracking the motion of free surfaces. In VOF, a scalar quantity f is defined that represents the fraction of the volume of a mesh cell occupied by one phase, say the liquid. Thus for f = 1, the mesh cell is entirely filled with liquid, while for f = 0 the mesh cell is entirely filled with gas. In a mesh cell that instantaneously contains a part of the interface both phases coexist and 0 < f < 1. The strength of the VOF approach lies in the fact that highly irregu-lar liquid gas interfaces can be represented accurately.
Since liquid volume is conserved, the liquid vol-ume fraction, f in each cell can be computed numeri-
cally in much the same manner as other conserved sca-lar quantities such as species concentration, energy, mass etc. Given an estimate of the net flow of liquid in and out of each mesh cell over a given time step, the VOF algorithm determines the new volume of liquid in every cell based on conservation of liquid. The new liquid distribution must satisfy not only conservation of liquid, but also conservation of mass and momentum. Thus, VOF typically requires an iterative approach to determine the final velocity and fluid distribution that simultaneously satisfy the problem boundary conditions and the overall conservation of mass, liquid and mo-mentum.
The VOF capability of CFD-ACE+ v.2004 was used for the analysis presented in this paper. The sec-ond order accurate PLIC formulation was used to track the liquid-gas interface. Second order pressure interpo-lation was used in conjunction with first order accurate explicit, auto-time stepping for time marching and up-wind differencing for the spatial integration. Since sur-face tension effects are important to resolve liquid breakup and atomization characteristics, the surface tension model of CFD-ACE+ was also used. The fol-lowing section describes the setup and validation of the VOF method to simulate liquid drop breakup by gas crossflow.
CFD Problem Specification
The breakup of a single liquid drop by gas cross-flow is usually studied with the help of a shock tube experiment (Nicholls and Ranger [1], Hsiang and Faeth, [3], Chou et al. [4]). The shock tube setup consists of a single liquid drop placed in the low-pressure side of the tube. When the diaphragm is broken, a shock passes through the low-pressure side and sets up a uniform flow field almost instantaneously. The drop then de-forms and breaks based on the flow field and observa-tions are made regarding the breakup processes by em-ploying various visual aids (Figure 2).
Simulating the entire shock tube experiment to study the liquid drop breakup using the VOF method in 3D will result in hundreds of millions of cells and make the computation completely impractical. An engineer-ing approach is needed with VOF to analyze liquid drop breakup that allows accurate and reliable analyses while still remaining computationally practical.
The first element in cost reduction that we investi-gated was the suitability of a “reduced 3D” or 2D axis-symmetric computation as compared to the full 3D simulation. Since, as of now, we are primarily inter-ested in just the processes leading to drop breakup and not the characteristics of the resulting drops, we can justify using 2D axis-symmetric or simplified 3D simu-lations. Figure 3 shows a close-up on the three cases that were analyzed to reduce the computational expense as compared to a full 3D case. Figure 3(a) shows the
full 3D case, Figure 3(b) shows the reduced 3D case where we analyzed only a quarter of the drop by em-ploying symmetry boundary conditions at the quarters, Figure 3(c) shows the 2D axis-symmetric case. The full 3D case had approximately 7 million cells, the reduced 3D case had approximately 2 million cells and the 2D axis-symmetric case had less than 100,000 cells. Figure 4 shows the time history of the breakup process in all the three cases by showing the volume fraction of the liquid at the center plane of the drop. The breakup process is very similar in all the three cases, thus dem-onstrating that the mechanisms responsible for liquid drop breakup can be computed numerically in a 2D axis-symmetric sense. The 2D axis-symmetric feature of the drop breakup process makes the numerical analy-sis using VOF highly feasible. A similar analysis as above (3D versus reduced 3D and 2D axis-symmetric) was carried out at various Weber number conditions to ensure the suitability of 2D axis-symmetric assumption in the bag and shear breakup regimes.
Although doing 2D axis-symmetric simulations are economical as compared to full 3D simulations, an ex-tensive parametric study of the 2D axis-symmetric full shock tube experiment is still not very efficient. Simu-lating the entire shock tube experiment is rather time consuming for a parametric study because of (a) the increase in the cell count that comes from simulating the entire shock tube and (b) the decrease in time step size that is needed to resolve the shock motion through the computational domain. Thus to further reduce the cost from our CFD setup while still preserving accept-able accuracy levels, we decided to build even simpler cases. The goal was to simulate the shock tube condi-tions in a smaller 2D axis-symmetric case with bound-ary conditions that allow us to “simulate” the shock rather than actually resolve it.
First we performed an entire shock tube CFD cal-culation to build a benchmark for the flow field features in the shock tube environment. Such a benchmark would help build low cost CFD cases that mimic the important characteristics that we are interested in simu-lating. Figure 5 shows a part of the computational grid used to simulate the shock tube experiment of Chou et al. [4]. The driver section was 3.1 m long and the driven section was 6.7 m long with the drop location 4 m from the downstream end. The grid was refined near the re-gion where the drop existed and the atomization proc-esses would be dominant. The total cells in the shock-tube grid were roughly 370,000 (2D axis-symmetric analysis). Figure 6 shows a time sequence of the breakup processes observed in the shock tube case. The shock passes by the drop and a flow field is setup in-stantaneously. There are no observable, significant pressure fluctuations, and the flow field is practically uniform throughout the drop breakup process. A recir-culation zone forms behind the drop and expands trans-
versely as the drop starts to distort. The drop does not deform due to the shock wave at all. It’s the flow field behind the shock that causes the deformation and disin-tegration (which is consistent with experimental obser-vations (Figure 2)). Now the goal was to setup a CFD case that would replicate such flow field characteristics as closely as possible.
Two different choices exist to simulate the shock tube experiment in a reduced grid without actually re-solving the shock: 1) the drop can be placed in a quies-cent environment and a fixed velocity boundary condi-tion can be specified at the inlet according to the de-sired Weber number, or 2) the drop can be placed in a quiescent environment by creating a special grid just around the drop and the rest of the flow field can be initialized by the inlet velocity according to the desired Weber number. Because of limitations in the VOF problem specification in CFD-ACE+, we could not directly specify the drop to be at zero velocity and the rest of the domain to the inlet velocity. Thus, the second option was an attempt to as closely achieve the effect of zero velocity drop and rest of the domain at inlet veloc-ity. Our approach here was to simulate the shock tube experiment most closely by setting appropriate bound-ary conditions and initial conditions on a much smaller grid than the one used for the shock tube simulation. Figure 7 shows these two options for setting up the CFD case to simulate the drop breakup. Both these op-tions have less than 100,000 cells. Figure 8 shows how the flow develops in time in the computational domain for each of the cases. The case where the whole domain was initialized to zero velocity shows significant pres-sure pulsations in the beginning and takes approxi-mately 100 times more computational time for the flow to settle down to a state which is representative of the shock tube experiment. The case where only the do-main close to the drop was initialized to zero and the remaining domain was initialized to the inlet velocity, settles down very quickly and matches the shock tube flow profiles much more closely. Based on this analy-sis, we decided to use the latter option for further liquid drop breakup CFD cases. Sufficient testing was also done for the drop placement in the computational do-main to ensure that there is no artificial interaction be-tween the drop and the boundaries. It was found that the inlet boundary had to be at least five drop diameters upstream of the drop to avoid interference by the inlet boundary.
A grid dependence check was also done to ensure that the important breakup mechanisms are well re-solved. Figure 9 shows the comparison between grids of resolutions going from a uniform 30 micron cell size to 5 micron cell size for a parent drop of the size of 600 microns. The 5 to 12.7 micron grids produced nearly identical breakup times and spread, and provided fine enough resolution to capture the breakup processes. The
30 micron cell size produced different results and was considered unsuitable for the VOF calculations. At the Reynolds numbers considered in this work, the grid with 10 micron cell size provided at least 6 cells in the liquid boundary layer on the drop. Thus we ensured that the boundary layer effects are well captured for the CFD.
Based on the analysis presented in this section, it was decided to perform a CFD analysis with the follow-ing properties:
a) 2D axis-symmetric, compressible flow b) Zero initial velocity domain around the drop c) Uniform velocity at inlet and around the drop d) 10 micron cell size resolution
The following section discusses the validation of the VOF approach for liquid drop breakup by gas cross-flow. The drop considered in the work presented in this paper is a 600 micron ethanol drop unless specified otherwise. Validation of VOF for Liquid Drop Breakup
Experiments have noted two very distinct breakup mechanisms at low and high Weber number conditions viz. the bag breakup and shear breakup respectively. In the bag type breakup mode, the drop deforms to form a bag type structure at its core before it disintegrates into smaller drops (Figure 10a). In the shear breakup mode, the drop starts breaking from its edges and slowly disin-tegrates into a micromist (Figure 10b). Regardless of the “phenomenological theory” that describes the breakup process, the bag breakup is observed in low Weber number conditions, usually between 10-30 and the shear breakup mode is observed at high Weber number conditions, which are typically above 60. Fig-ure 11 and 12 show that VOF correctly predicts the bag and shear breakup regimes in the experimentally ob-served Weber number conditions of 15 and 81 respec-tively. A parametric set of cases was run to vary the Weber number from 10 to 150 by changing the initial conditions and the inlet flow conditions while keeping the drop size constant at 600 microns. Dai and Faeth [13] performed a similar parametric study to analyze the characteristics of drop breakup as a function of We-ber number experimentally. Figure 13 shows a com-parison of the onset of breakup as calculated by VOF and observed in experiments of Dai and Faeth [13]. The qualitative trend of the onset of breakup is very well captured by the VOF calculations. However, there ex-ists a constant difference in the predictions of normal-ized time. The difference in CFD predictions and ex-perimental results can be attributed to the hazy defini-tion of t = 0s. In the CFD calculations, time was initial-ized to zero at the beginning of the calculations where the shock is already assumed to exist. While in experi-ments, the time could have been initialized when the diaphragm was broken or based on some other metric.
Figure 2 shows experimental snapshots of a shock go-ing over a liquid drop by Rachner and Nicholls [1]. It can be clearly seen that the time when the shock goes over the drop is non-zero. Such could have easily been the case in the study of Dai and Faeth [13] also. Thus the initialization of time to zero could explain the dis-crepancy that we see in the onset of drop breakup.
Table 1 compares CFD results with experimental observations on the occurrence of various regimes and onset of breakup in the different regimes. The VOF calculations correctly capture the various trends ob-served in experiments. Figure 14 shows the drop behav-ior at an instant of time as the Weber number is in-creased. In all the breakup regimes, the drop first de-forms to form a thin disk like structure. In the bag breakup regimes the central portion of the drop moves faster than the edges to form a bag like structure, while in the shear regimes, the edges move faster than the central portion creating an appearance of shearing. Technically however, we did not observe any “bound-ary-layer” shearing. The refinement was fine enough to capture the boundary layer at the Reynolds numbers considered, but it was not the boundary layer that got sheared, but the entire edge itself. Development of sur-face waves on the edges of the flattened drop were clearly observed which resulted in the shear-ing/stripping away of the entire edge.
As shown above through Figures 11-14 and Table 1, the VOF calculations matched very well with the qualitative and quantitative trends of experiments. To build more insight and reliability on the breakup proc-ess, the effect of Reynolds number, different drop sizes and different liquids was considered with VOF calcula-tions. Figure 15 shows a case where the Reynolds num-ber was varied by changing the size of the drop. The Weber number was maintained at a constant value of 45. Both the drops underwent a similar breakup proc-ess, indicating that the liquid drop breakup is not a function of Reynolds number in the regime considered, but only the Weber number. To further verify this fact, the liquid of the drop was changed from water to etha-nol while preserving the Weber number in a different regime (We=15, bag breakup regime). The drops un-derwent almost identical breakup processes again con-curring to the experimental observations that the liquid breakup is a function of the Weber number rather than the Reynolds number (Dai and Faeth [13])
The validity of VOF was further analyzed by com-paring the ratio of maximum drop diameter and original drop diameter with the change in Weber number. Fig-ure 16 shows the comparison of the VOF calculations and the experimental data of Dai and Faeth [13]. Simi-lar trends were observed in the computational and ex-perimental observations. The ratio of the maximum drop diameter and the original drop diameter practically remains constant throughout the breakup regime for We
> 20. The CFD calculations predicted the ratio to be constant at ~ 3.5 while the experiments noted the ratio to be ~ 2. The discrepancy in this observation was at-tributed to the unclear definition of the maximum drop size. The drop deforms into a disk like shape and fur-ther bends into a conical sheet before the breakup of smaller drops is actually observed. In CFD we defined the maximum drop diameter to be the size from the center to the edge when the child drops are stripped from the edges in the shear breakup regime. However, the maximum drop diameter measurement metric could have been different in the experiments. Nonetheless VOF does predict the experimentally observed trends correctly.
The time history of the parent drop trajectories from VOF calculations was compared with the theoreti-cal-experimental observations of Chou et al. [4]. The VOF calculations could accurately predict the qualita-tive trends in the drop trajectories. The path and rate of change of the drop path from the CFD results were co-pasetic with the experimental observations.
Overall, the validity of using VOF for liquid drop breakup is well established by the comparisons pre-sented above. VOF is demonstrated to be a reliable, predictive tool to understand the breakup of a liquid drops by gas crossflow and holds the promise of pro-viding insights into the drop breakup process that are hard to obtain from experiments alone. Using VOF to Understand Drop Breakup
Figures 9, 12, 14 and 15 show different instances of the shear breakup process observed in VOF simula-tions and Figures 4 and 11 show different instances of the bag breakup process. In both breakup modes, the drop first deforms to form a disk like structure (Figure 18). Experimentalists have also observed that the drop deforms to form a disk like structure before the liquid mass removal starts (Pilch and Erdman [15], Wierzba and Takayama [6], Liu and Reitz [2]). The interpreta-tion of the breakup process after the disk-shaped drop has been formed is the most controversial in the history of drop atomization understanding and has lead to bi-furcation of the phenomenological theories.
The boundary-layer-stripping sect of our commu-nity believes that the boundary layer around the drop is what will strip off and remove mass from the parent drop. On the other hand, the surface wave driven, sheet atomization sect believes that the drop further deforms into a conical sheet and the edges break off due to wave growth on the windward side of the sheet.
It can be clearly seen in the VOF numerical ex-periments that the drop deforms to form a conical sheet and the sheet breaks up to remove mass from the parent drop. It is emphasized here that sufficient effort was made to resolve the boundary layer on the liquid drop. At times the grid resolutions was more than 10 times
finer than the boundary layer thickness at the Reynolds numbers considered.
At low velocities, the pressure in front of the drop at the stagnation point is more than the pressure at the back side of the drop. This pressure differential drives the drop to form a disk and then continues to form a bag before the drop disintegrates into smaller drops. At suf-ficiently higher velocities however, the drag/shear stress from the flow field causes the liquid in the drop to move faster from the center of the drop to its edges. As the round drop deforms to form a disk shape, the liquid at the edges is traveling faster than its central core. Although the pressure differential across the drop is trying to deform the drop to a bag shape, the veloci-ties on the edges of the liquid drop are high enough to form a convex, conical shaped drop. Once the conical shape is formed, the edges strip off. This breakup could potentially be modeled using conical sheet breakup theories.
Thus the two competing effects in the liquid drop breakup by gas crossflow are: 1) the pressure differen-tial across the drop trying to cause the drop to form a concave (bag-like) breakup and 2) the drag from the air flow field that accelerates the windward side liquid surface to go to the edges and continue on to form a convex shape. The pressure differential will cause the drop to form a disk like structure. If the speed of the windward side liquid on the drop surface is fast enough, the drop will deform into a convex shape, else it will break via the concave (bag-like) process. When the strength of these opposing forces is nearly equal, the “multi-mode” breakup can happen.
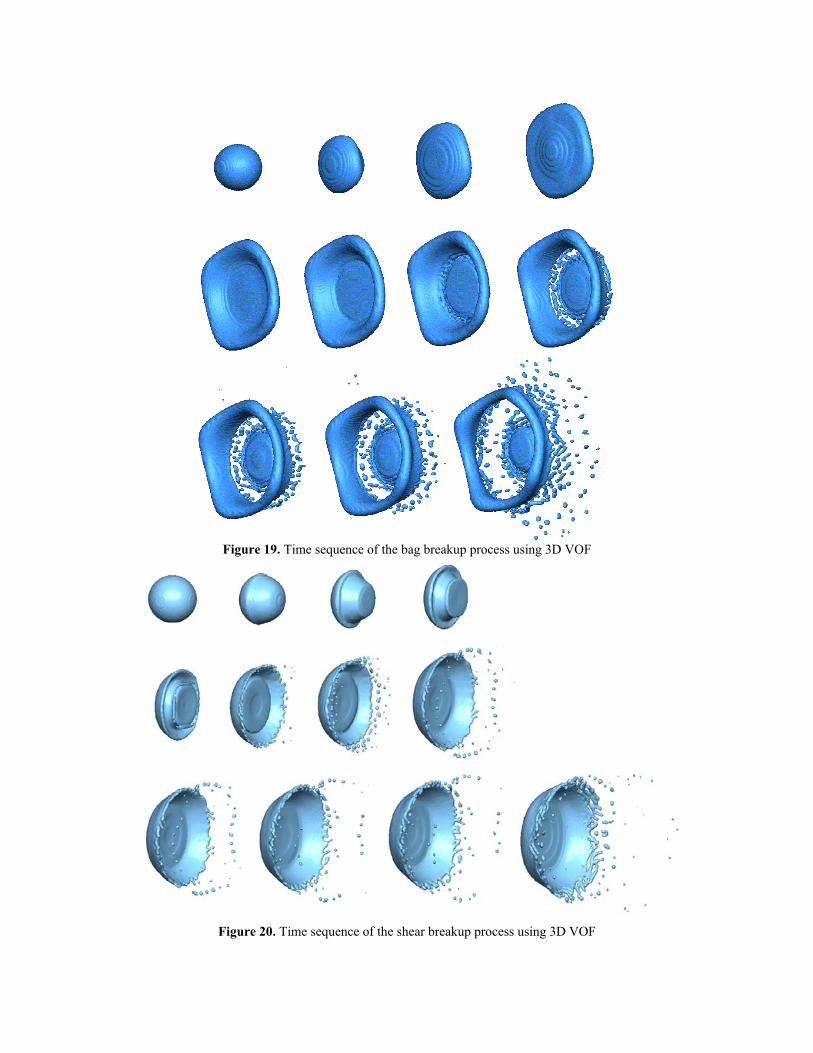
We performed 3D VOF calculations of the drop breakup process to further understand the breakup de-velopment. Figures 19 and 20 show the 3D VOF simu-lation time sequences of the bag and the shear breakup modes. It can be clearly seen that the drop deforms into a flat disk like shape and enters the bag breakup mode for low speed flows where the pressure effects domi-nate, and the shear breakup mode where the windward liquid surface velocity dominates. Figure 21 shows some experimental pictures against CFD snapshots to indicate how CFD reflects what is seen in experiments, but can provide much more detailed insights so that the experimental pictures are better interpreted. Thus we can see how viscosity of the liquid, speed of the air, surface tension of the liquid and density of the liquid will combine to play an important role in the breakup process. Traditionally, these effects have been lumped together in non-dimensional numbers of Weber num-ber, Reynolds number and Ohnesorge number. Correla-tions between these numbers can be developed using VOF to come up with simplistic models for liquid drop breakup. While simultaneously, VOF can help build and validate sophisticated sheet breakup theories for detailed drop breakup models.
Conclusion
A VOF based computational approach was vali-dated and used to provide detailed insights into the breakup of a liquid drop by gas crossflow. The breakup of a liquid drop by gas crossflow was found to follow the surface wave driven, sheet breakup mechanism in-stead of the boundary-layer stripping mechanism. It was demonstrated that VOF can be successfully used to obtained detailed information on the atomization behav-ior of a liquid drop breakup by gas crossflow. VOF provides a detailed and more controlled environment to study fundamental processes and can help further our understanding in the liquid atomization process like dense spray regions and jet in crossflow atomization applications. Although not demonstrated in this paper, VOF can provide enough information on the breakup process to build reduced models and design rules for practical applications. With the confidence gained in the VOF capability to predict liquid atomization, we are focusing future efforts on understanding near-field liq-uid jet breakup by gas crossflow. Figure 22 shows a 12.5 million cell VOF calculation of a liquid jet in cross-flow. Such simulations take 2-3 weeks to run on 15 processors, but provide detailed insights into the jet breakup mechanism and near-field dense spray region. Acknowledgements
Dr. Sam Lowry from CFDRC provided valuable guidance on the use of VOF throughout our research activity. CFDRC Internal R&D support funded this research effort and the authors would like to thank CFDRC for their support. Nomenclature d diameter of the liquid jet/column Re Reynolds number � �ggjg ud PU SMD Sauter Mean Diameter We Weber number � �"VUgj
2gdu
P dynamic viscosity U density V� surface tension References 1. A.A. Rangers and J.A. Nicholls, Aerodynamic
2. Z. Liu and R.D. Reitz, An Analysis of the Distor-tion and Breakup Mechanisms of High Speed Liq-uid Drops. Int. J. Multiphase Flow, vol. 23, no. 4, pp. 631-650, 1997
3. L.-P. Hsiang, G.M. Faeth, Near-Limit Drop De-formation and Secondary Breakup, Int. J. Multi-phase Flow, vol. 18, no. 5, pp. 635–652. 1992.
4. W-H. Chou, L.-P. Hsiang, and G.M. Faeth, Tempo-ral Properties of Drop Breakup in the Shear Breakup Regime, Int. J. Multiphase Flow, vol. 23, no. 4, pp. 651–669, 1997.
5. J.-P. Delplanque and W.A. Sirignano, Boundary-Layer Stripping Effects on Droplet Transcritical Convective Vaporization, Atomization and Sprays, vol. 4, pp. 325–349, 1994.
6. A. Wierzba and K. Takayama, Experimental Inves-tigation of the Aerodynamic Breakup of Liquid Drops. AIAA Journal, vol. 26, 1329, 1988
7. C. A. Chryssakis and D. N. Assanis, A Secondary Atomization Model for Liquid Droplet Deforma-tion and Breakup under High Weber Number Con-ditions, ILASS Americas, 18th Annual Conference on Liquid Atomization and Spray Systems, Irvine, CA, May 2005
8. C.S. Lee, R.D. Reitz, Effect of Liquid Properties on the Breakup Mechanisms of High Speed Liquid Drops. Atomization and Sprays 2001
9. P.J. O’Rourke and A.A. Amsden, The TAB Method for Numerical Calculation of Spray Drop-let Breakup, SAE Technical Paper 872089, 1987.
10. F.X. Tanner, Liquid Jet Atomization and Droplet Breakup Modeling of Non-Evaporating Diesel Fuel Sprays, SAE 1997 Transactions: J. of Engines, vol. 106, sec. 3, pp.127-140, 1998.
11. F.X. Tanner, A Cascade Atomization and Drop Breakup Model for the Simulation of High-Pressure Liquid Jets, SAE paper 2003-01-1044, 2003.
12. B.D. Nicholls, C.W. Hirt, Methods for Calculating Multidimensional, Transient Free Surface Flows Past Bodies. Proc. First Int. Conf. Num. Ship Hy-drodynamics, Gaithersburg, ML. Oct. 20-23, 1975.
13. Z. Dai, G.M. Faeth, Temporal Properties of Secon-dary Drop Breakup in the Multimode Breakup Re-gime. Int. J. Multiphsae Flow. Vol. 27, pp. 217-236,2001.
14. B.E. Stapper, G.S. Samuelsen, An experimental study of the breakup of a two-dimensional liquid sheet in the presence of co-flow air shear. AIAA-90-0461, 28th Aerospace Sciences Meeting, 8-11 January, Reno, NV, 1990
15. M. Pilch and C.A. Erdman, Use of Breakup Time Data and Velocity History Data to Predict the Maximum Size of Stable Fragments for Accelera-tion-Induced Breakup of a Liquid Drop, Int. J. Multiphase Flow, vol. 13, no. 6, pp. 741–757, 1987
Table 1. VOF versus Experimental Observations
Weber Number t/t* at Onset Breakup Present Dai & Present Dai & Regimes: results Faeth [13] results Faeth [13] Bag breakup 12 13 2.0 3.0 Multimode breakup 17 17 1.8 2.3 Shear breakup 75 80 1.5 1.75
Figure 1. Boundary Layer Stripping phenomenological models theorize the stripping of the boundary layer of the drop as the primary reason for the drop breakup a) Left: Schematic of Boundary Layer Stripping model from Chou
et al. [4], (b) Right: Typical experimental observations (From “Experimental Investigation of the Aerodynamic Breakup of Liquid Drops” by Wierzba and Takayama [6]; reprinted by permission of the American Institute of
Aeronautics and Astronautics, Inc.)
Figure 2. Experimental shadowgraph sequence of shock tube experiment from Ranger and Nicholls [1]
Figure 3. Grid close-ups for (a) full 3D grid (b) 3D grid with symmetry boundary conditions at each quarter cut and
(c) 2D axisymmetric grid
Figure 4. Time history of the breakup processes in (a) Top: full 3D grid, (b) Middle: 3D grid with symmetry bound-
ary conditions at each quarter cut and (c) Bottom: 2D axis-symmetric grid
Figure 5. Close up on the computational grid for the shock tube CFD case
Figure 6. Time sequence of the breakup processes in the shock tube CFD case
Figure 7. Two options for setting up the CFD case to represent the shock tube experiment, (a) Top: Single domain with quiescent initial conditions for the drop and the remaining flow field and (b) Bottom: Separate quiescent do-
main around the drop and the remaining domain initialized by the inlet conditions
Figure 8. CFD snapshots for axial velocity showing the development of flow field in time (a) Top: Single domain
option, (b) Separate domain option
Figure 9. Grid independence check for the 2D axis-symmetric case
Flow Direction
Flow
Dir
ectio
n
Figure 10. (a) Left: Typical observation of drop breakup in (a) Left: bag breakup mode (Reprinted from Interna-tional Journal of Multiphase Flows, 27, Dai and Faeth, Temporal Properties of Secondary Drop Breakup in the Mul-timode Breakup Regime, 217-236 Copyright (2001), with permission from Elsevier) (b) Right: shear breakup mode (From “Experimental Investigation of the Aerodynamic Breakup of Liquid Drops” by Wierzba and Takayama [6];
reprinted by permission of the American Institute of Aeronautics and Astronautics, Inc.)
Figure 11. Bag breakup time sequence from VOF compared with experimental pictures (Reprinted from Interna-
tional Journal of Multiphase Flows, 27, Dai and Faeth, Temporal Properties of Secondary Drop Breakup in the Mul-timode Breakup Regime, 217-236 Copyright (2001), with permission from Elsevier). Please note that the simula-
tions are a 2D slice through drop, while photographs are not.
Figure 12. Shear breakup time sequence from VOF compared with experimental pictures (Reprinted from Interna-
tional Journal of Multiphase Flows, 27, Dai and Faeth, Temporal Properties of Secondary Drop Breakup in the Mul-timode Breakup Regime, 217-236 Copyright (2001), with permission from Elsevier)
Figure 13. Comparison of onset of breakup over a range of Weber numbers between VOF and experiments
Figure 14. Liquid drop breakup as a function of Weber number, Ohnesorge number = 0.0149
Figure 15. Effect of variation in Reynolds number by changing the drop size at We = 45 for ethanol (a) Top: 600
micron drop diameter, Re = 15, (b) Bottom: 60 micron drop diameter, Re = 4.7
Figure 16. Comparison of the ratio of drop maximum diameter and initial diameter over a range of Weber numbers
between VOF and experimental observations of Dai and Faeth [13]
Figure 17. The drop deformation and breakup process (a) Left: Bag breakup mode, (b) Right: Shear breakup mode
Figure 18. Transverse velocity field when the drop deforms to a disk shape (a) Left: Bag breakup mode, (b) Right:
Shear breakup mode
Figure 19. Time sequence of the bag breakup process using 3D VOF
Figure 20. Time sequence of the shear breakup process using 3D VOF
Figure 21. Experimental observations against VOF predictions in the shear breakup mode (a) Top: Images from “Experimental Investigation of the Aerodynamic Breakup of Liquid Drops” by Wierzba and Takayama [6]; re-
printed by permission of the American Institute of Aeronautics and Astronautics, Inc., (b) Bottom: CFD-VOF snap-shots of the drop breakup process
Figure 22. 3D VOF of jet in crossflow study to understand jet breakup and near jet, dense spray characteristics