DEVELOPING MARKETS FOR FRESH-ON-ICE FARMED FISH PRODUCTS IN THE NORTH CENTRAL REGION FY 2009 Small- and medium- scale producers of farmed food fish are exploring ways to be competitive in the highly competitive low-margin seafood market. Most producers in the North Central (NC) region have focused on tilapia and hybrid striped bass because of competition from imported fish products, and from the larger US catfish and rainbow trout industries. Ethnic markets that cater to Asian, African and Latin American fish consumers are traditional sales outlets for live, as well as fresh-on-ice, fish. The major problem with live markets is that they are niche markets with very limited capacity. This study focused on developing the fresh-on-ice fish markets at ethnic markets, traditional meat/fish shops, and grocery stores, which represent potential expanded market outlets for fish farmers in the NC region. Specific objectives were to: 1. Examine the reasons fish retailers offer fresh fish on ice, specifically focusing on demographic factors including retailer locations; 2. Assess retailers’ demand/preferences for fresh-on-ice farmed (aquaculture) fish; 3. Assess retailers’ willingness to pay more for regionally grown fresh fish on ice; 4. Identify fish processing facilities in the region, and gather information on their fish purchase patterns, species handled, prices, size preferences, and other fresh fish preferences; and 5. Connect fresh-on-ice fish market operators with aquaculture producers in the region. FINAL REPORT Contact: Dr. Kwamena K. Quagrainie Department of Agricultural Economics Purdue University 765-494-4200 / 494-4761 [email protected]
Transcript
DEVELOPING MARKETS FOR FRESH-ON-ICE FARMED FISH PRODUCTS IN THE NORTH CENTRAL REGION
FY 2009
Small- and medium- scale producers of farmed food fish are exploring ways to be competitive in the highly competitive low-margin seafood market. Most producers in the North Central (NC) region have focused on tilapia and hybrid striped bass because of competition from imported fish products, and from the larger US catfish and rainbow trout industries. Ethnic markets that cater to Asian, African and Latin American fish consumers are traditional sales outlets for live, as well as fresh-on-ice, fish. The major problem with live markets is that they are niche markets with very limited capacity. This study focused on developing the fresh-on-ice fish markets at ethnic markets, traditional meat/fish shops, and grocery stores, which represent potential expanded market outlets for fish farmers in the NC region. Specific objectives were to:
1. Examine the reasons fish retailers offer fresh fish on ice, specifically focusing on
demographic factors including retailer locations; 2. Assess retailers’ demand/preferences for fresh-on-ice farmed (aquaculture) fish; 3. Assess retailers’ willingness to pay more for regionally grown fresh fish on ice; 4. Identify fish processing facilities in the region, and gather information on their fish
purchase patterns, species handled, prices, size preferences, and other fresh fish preferences; and
5. Connect fresh-on-ice fish market operators with aquaculture producers in the region. FINAL REPORT Contact: Dr. Kwamena K. Quagrainie Department of Agricultural Economics Purdue University 765-494-4200 / 494-4761 [email protected]
DEVELOPING MARKETS FOR FRESH-ON-ICE FARMED FISH
PRODUCTS IN THE NORTH CENTRAL REGION
USDA/AMS - FEDERAL-STATE MARKETING IMPROVEMENT PROGRAM
Small- and medium- scale producers of farmed food fish are exploring ways to be competitive in the highly competitive low-margin seafood market. One of the focus areas of market development for small- and medium-scale aquaculture farmers has been the live ethnic markets (Puduri et al., 2010; Myers et al., 2007; Zimet and Zajicek, 2000), and to some extent, processed fish products such as smoked fish (Caporelli and Mims, 2008). Myers et al (2007) examined the live fish market in the Northeast and suggests that live ethnic markets are viable outlets for producers of tilapia and hybrid striped bass. This is true for tilapia and hybrid striped bass producers in the North Central (NC) region as well. The two species have been the focus of most producers in the NC region because of competition from imported fish products, and from the larger US catfish and rainbow trout industries. The ethnic markets are traditional outlets for the sale of live as well as fresh-on-ice fish that caters to Asian, African and Latin American fish consumers. The major problem with live markets is that they are niche markets with very limited capacity, because few grocers have the capacity to handle live fish, and such grocers are located in large urban centers and specific ethnic communities. This presents opportunities for small- and medium-scale aquaculture producers to explore realistic value-added activities for species produced in the NC region in the fish market. Caporelli and Mims (2008) explored markets for value-added fish products, i.e., smoked Kentucky farm-raised fish, and found that smoked fish fillets were the preferred product, and were mostly sourced from wholesalers. The authors also reported that buyers rated smoked catfish and hybrid striped bass poorly compared to other fish products such as smoked salmon and trout. Our study focused on developing the fresh-on-ice fish markets at ethnic markets, traditional meat/fish shops, and grocery stores, which represent potential expanded market outlets for fish farmers in the NC region. They are a broader market outlet to aquaculture producers than the limited live fish market that producers currently service. Ethnic markets, traditional meat/fish markets, and grocery stores sell fresh-on-ice processed fish from various sources, including fish from marine and natural rivers. Fresh-on-ice fish are usually whole dressed fish or cut into portion sizes. This is a market that has not been explored for the species produced in the NC region including yellow perch, largemouth bass, hybrid striped bass and tilapia. These are popular species in the region. One area of interest is the role local and regional demographic factors play in a retailer’s decision to supply fresh fish on ice. Previous studies found that race, urbanization, seasonality, and region were important factors affecting fish and seafood consumption (Hanson, Dunn, and Rauniyar, 1996; Nayga and Capps, 1995; Cheng and Capps, 1988). As ethnic populations in the US continue to increase, consumption patterns and lifestyles of American consumers will continue to change. Powell et al. (2007) found that neighborhoods with larger Asian populations had greater numbers of non-chain supermarkets and grocery retailers compared to Caucasian neighborhoods; neighborhoods with higher proportions of African Americans had fewer chain
2
retailers as well. Caucasian areas generally have fewer numbers of retailers per population, which reflects larger sizes of retailer establishments in such areas (Moore and Roux, 2006). Chen, Florax, and Snyder (2009) and Alwitt and Donley (1997) also reported that national chain grocers have left inner city areas in favor of fringe and suburban locations because of the difficulty of acquiring enough space in inner city [poor] neighborhoods as well as restrictive urban governmental regulations concerning zoning and permitting. The out-migration of large retail outlets from inner city locations has left a retail base of smaller retailers; these smaller retailers need an exclusive, unique advantage with which to compete providing opportunities for offering regionally sourced fresh fish products. An increase in aquaculture production and sales by fish retailers in the NC region would require the willingness of these retailers to purchase regionally grown fish. The key question is how much more are retailers willing to pay for NC fresh fish than fish from other sources outside the NC region? Besides being locally or regionally grown, fish products have other attributes which consumers may prefer. For example, previous studies have reported the importance of freshness to consumers in their purchase decisions of seafood (Myers et al., 2010; Kumar, Quagrainie, and Engle, 2008; Quagrainie, 2006). Kumar, Quagrainie, and Engle (2008) reported that customers who bought fresh catfish had a significantly higher probability of purchasing it more often than frozen catfish. The authors also reported that origin of catfish has a significantly greater influence on frequency of catfish purchase. Other characteristics that are relevant to a consumer’s decision to purchase a fish product may include supply consistency, seasonality, species, cuts, product condition (fresh, frozen, value added), and packaging. Unlike marine fish products, farm produced fish products can be available year round, suggesting potential for supply consistency. Puduri et al. (2010) found that about 46% of live-seafood customers felt that year round supply of fish was very important. Likewise, Kumar, Quagrainie, and Engle (2008) noted that a year round supply of fresh catfish products in retail outlets was essential. Zimet and Zajicek (2000) suggested that winter supplies of live-fish are limited due to weather conditions, resulting in higher prices for fresh fish in the winter months compared to the summer months.
GOAL AND OBJECTIVES
The overall goal of this study was to study the fresh-on-ice (never frozen) fish markets in the NC region of the US. Questions that needed to be answered were what kinds of fresh fish do the fish markets handle? What factors determine their choices of fresh fish to sell? How much more are retailers willing to pay for NC fresh fish? What are the trends in fresh fish markets in the region? How can the aquaculture industry in the region service the needs of this sector efficiently? The results from this study provide information on expanding the market opportunities for aquaculture farmers in the NC region. This is particularly significant because, with some primary
3
processing of fish products, aquaculture producers can access a wider market that can potentially provide returns enough to offset any investments in processing or value adding. The study assumed that fish sales outlets use their knowledge of their clientele to select fresh fish products desired by their customers. Thus, the selected fresh fish sales outlets in the study could become excellent avenues for introducing fresh-on-ice (never frozen) aquaculture products to consumers. The objectives of this project were as follows: 1. Examine the reasons fish retailers offer fresh fish on ice, specifically focusing on the
demographic factors including retailer locations. 2. Assess retailers’ demand / preferences for fresh-on-ice farmed (aquaculture) fish. 3. Assess retailers’ willingness to pay (WTP) more for regionally grown fresh fish on ice. 4. Identify fish processing facilities in the region, and gather information on their fish purchase
patterns, species handled, prices, size preferences, and other fresh fish preferences. 5. Connect fresh-on-ice fish market operators with aquaculture producers in the region.
WORK PLAN
• Objective 1
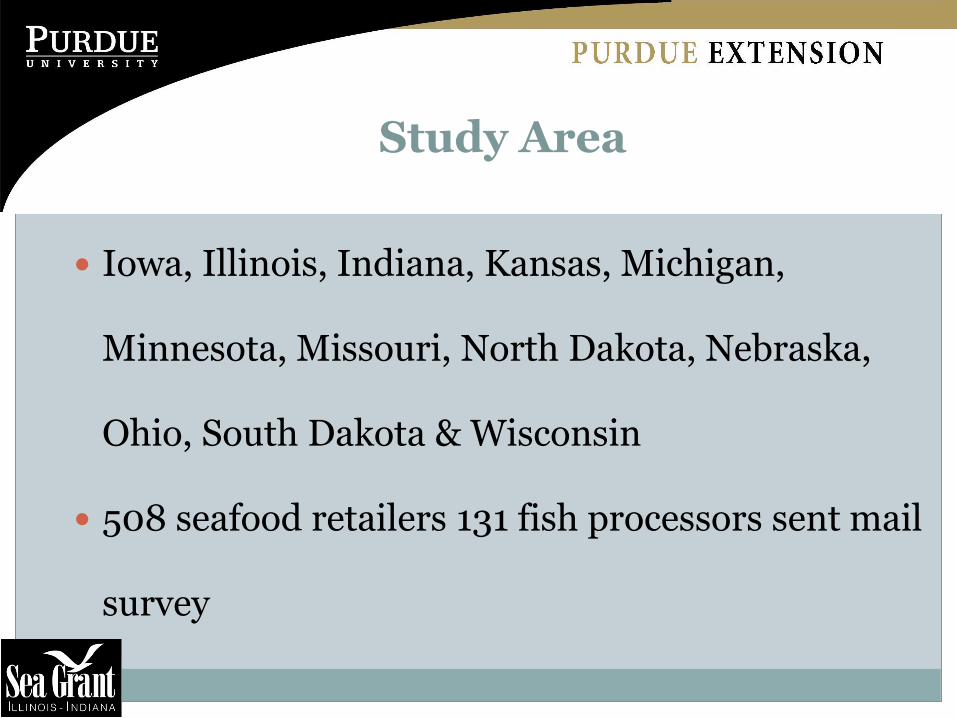
The information gathered to determine demographic factors which affect a retailer’s decision to supply fresh fish were obtained from four sources: (1) responses to a survey of managers of seafood retailers, (2) United States Census Bureau (USCB, 2000) population data which corresponded to the zip codes of the retailers surveyed, (3) data gathered from various academic and state institutions, and (4) restaurant data gathered from the National Restaurant Association (2010). Survey data was collected from the 12 states in the NC region including Iowa, Illinois, Indiana, Kansas, Michigan, Minnesota, Missouri, North Dakota, Nebraska, Ohio, South Dakota, and Wisconsin (see Appendix I). The Chain Store Guide (2009) database provided a list of retailers that sold fish (fresh or frozen) in the selected states. Population data from the United States Census Bureau for ethnic populations were also collected. The demographic data collected included total population per zip code, Asian population per zip code, African American population per zip code, and White population per zip code. The sample size obtained to accomplish this objective was 115. A Probit model was used to estimate the probability of a retailer supplying fresh fish on ice. The model specified the probability of the retailer currently supplying fresh fish on ice (=1, 0 otherwise) as a function of the retailer being affiliated with a chain (=1, 0 otherwise), the weighted per capita income for the population in the corresponding zip code, the weighted population in the corresponding zip code, the weighted White population in the corresponding zip code, the weighted Black population in the corresponding zip code, the weighted Asian population in the corresponding zip code, the number of processors per county corresponding to the zip codes, and the number of restaurants in the corresponding retailer’s district in the state.
4
• Objective 2 & 3
A survey was administered to gather information on retailers’ preferences and willingness to pay for NC regionally grown fresh fish (see Appendix I). Surveys were administered throughout the 12 states in the NC region including Iowa, Illinois, Indiana, Kansas, Michigan, Minnesota, Missouri, North Dakota, Nebraska, Ohio, South Dakota, and Wisconsin. Three methods of survey administration were used including (1) mailing (2) telephone contact and (3) in person. The Chain Store Guide (2009) database provided a list of retailers and specialty markets that sold fish (fresh or frozen) in the selected states; a total of 564 samples were identified. Three weeks after the initial mailing, a follow-up survey was mailed to the non-respondents. Cities or towns with a high number of retailers were visited in-person for a follow-up survey including Cincinnati, Columbus, and Cleveland in Ohio, Detroit, Ann Arbor, and Troy in Michigan, Indianapolis and Fort Wayne in Indiana, Chicago in Illinois, and Milwaukee and Madison in Wisconsin. Eight fish species grown in the NC region were the focus of the survey, i.e., bluegill, carp, catfish, hybrid striped bass, largemouth bass, tilapia, trout, and yellow perch. Both tilapia and catfish are in the top ten of domestically consumed seafood species and are ranked 5th and 6th, respectively (NOAA, 2009). The total completed usable responses from the surveys were 66, representing a 12.31% response rate. The data used to accomplish these objectives came from 10 of the 12 states as Iowa and North Dakota had no usable data points. An Ordered Probit model was used to estimate fish retailers’ willingness to pay more for a NC region produced fish where WTP values were WTP=$0.00, WTP=up to $0.50 and WTP=more than $0.50 per pound for the species. Willingness to pay was expressed as a function of the average percentage of freshwater finfish sales, retailer sales of more than 400 pounds of fillets per week (=1, 0 otherwise), the number of deliveries of fresh fish per week, the retailer’s clientele preferences for fresh fish over frozen fish and value added (=1, 0 otherwise), retailers’ fish suppliers are from out of state only (=1, 0 otherwise), and retailers’ fish suppliers are from in the state only (=1, 0 otherwise). The Ordered Probit model was estimated for eight species, i.e., tilapia, catfish, trout, yellow perch, hybrid striped bass, bluegill, largemouth bass, and carp.
• Objectives 4 & 5
There is no published listing of fish processors in the NC region therefore data was collected from different sources, most through personal communication via phone calls and emails. Research and Extension personnel associated with land grant universities in the NC region and the Internet provided information on fish processors in the respective states. A survey was administered to fish processors identified in the NC region (see Appendix II). All 12 states in the region had fish processors except Kansas and South Dakota. The survey instrument included questions on the fish processing business, which species were processed,
5
processors’ interest in processing other fish species, and how much they were willing to pay for the selected species, i.e., bluegill, carp, catfish, hybrid striped bass, largemouth bass, tilapia, trout, and yellow perch (The list of fish processors in the NC region is available from the authors upon request).
COOPERATORS AND PARTNERS
The Illinois-Indiana Sea Grant (IISG) Program contributed to the management of the project through salary support for the Principal Investigator and with outreach / dissemination of project findings.
SUMMARY OF RESULTS AND CONCLUSIONS
• Objective 1: Retailer Sale of Fresh Fish on Ice and the Role of Demographic Factors
The summary statistics of the information gathered are provided in Table 1. Of the 115 responses, a total of 64 retailers sold fresh fish on ice; 26 were chain retailers. The average population per zip code was 32,582 people with 335 and 108,144 being the minimum and maximum, respectively. The average Asian population per zip code was 1,407; average Black or African American population per zip code was 3,940, and average White population per zip code was 22,973. The maximum number of fish processors per county was 6 and the minimum was 0, with the average being 1. The average number of restaurants per district was 1,213, with 891 and 1,833 being the maximum and minimum number, respectively.
Table 1: Variables and Summary Statistics
Mean Std. Dev. Minimum Maximum
Retailer Sells Fresh Fish 0.56 0.50 0.00 1.00 Chain Retailers 0.23 0.42 0.00 1.00 Population 32,582.00 24,051.60 335.00 108,144.00 Per Capita Income 24,473.50 10,341.20 9,522.00 76,157.00 Asian Population 1,407.09 2,247.19 1.00 13,769.00 Black Population 3,940.44 7,362.62 0.00 40,511.00 White Population 22,973.89 14,707.55 257.00 62,085.00 Number of Processors 1.00 1.62 0.00 6.00 Restaurants/District 1212.82 204.61 891.00 1833.00
The results from the Probit model estimation suggested that a retailer is more likely to supply fresh fish on ice if it is a chain versus a non-chain retailer. Chain retailers have an approximately two times higher probability of supplying fresh fish on ice than non-chain retailers. The population variable had a negative and significant effect suggesting that as overall population increases, the probability of a retailer supplying fresh fish on ice decreases. This could be explained by the fact that where there are higher populations, such as the inner cities, there is less
6
space for retailers to have seafood sections to display fresh fish on ice (Alwitt and Donley, 1997). Nayga and Capps (1995) also found that individuals residing in central cities were more likely to eat fish and shellfish away from home than those residing in non-metro areas suggesting that perhaps fish consumption in central cities occurs at restaurants more so than at home. The total population variable had a significant, negative effect on the probability of selling fresh fish on ice, but specific ethnic groups had positive effects. For example, coefficients for White and African American were positive and significant, which partly agrees with Nayga and Capp’s (1995). The coefficient on the Asian population was not significant. Asian populations are reported to be major buyers of live fish (Puduri et al., 2010; Myers et al., 2007; Zimet and Zajicek, 2000), possibly explaining why the Asian population variable was not significant. The number of fish processors per county was positive and significant suggesting that the probability of a retailer supplying fresh fish on ice increases if there is a fish processor in the county. The proximity of processors to grocery stores and fish retailers is important for getting fresh fish products to the markets. The Probit model was then simulated to see the effect of slight increases in population (+4.3%), the number of processors per county (+1), and a slight decrease (increase) in per capita income (-2.4%, +2.4%). A 4.3% increase in population growth per zip code decreased the number of retailers that will offer fresh fish on ice by five. By adding one more fish processor per county, 19 more retailers provided fresh fish on ice. This increase is quite large and could be a good predictor of how producers may be able to get their products into local retailers. The per capita income increase had no effect on the model. The decrease, however, did. With a per capita income decrease of 4%, 38 more retailers provided fresh fish on ice. It is interesting that the income decrease had such drastic effects on the model while the same percentage increase had none. Perhaps during difficult economic times, consumers are prompted to cook at home more, increasing their at-home consumption.
• Objectives 2 & 3: Retailer Willingness to Pay for Regionally Produced Fresh Fish on Ice
There were 66 returned surveys. The summary statistics indicate that 35% of retailers’ sales were freshwater finfish, 38% of retailers sold more than 400 pounds of fillets a week, and retailers had an average of 4.30 fresh fish deliveries per week. Retailers indicated that fresh fish was the most customer preferred product compared to frozen and value added. Thirty-eight retailers had fish suppliers located only in-state or only out-of-state. More than 50% of respondents were not willing to pay extra for regionally grown fresh fish (see Table 2). However, all eight species had a positive mean willingness to pay. The average willingness to pay values were: $0.38 more for tilapia, $0.34 more for yellow perch, $0.30 more for catfish, $0.29 more for trout, $0.19 more for hybrid striped bass, $0.15 more for bluegill, $0.12 more for largemouth bass, and $0.07 more for carp.
7
Table 2: Percentage of Retailers Willing to Pay More for NC Region Fish
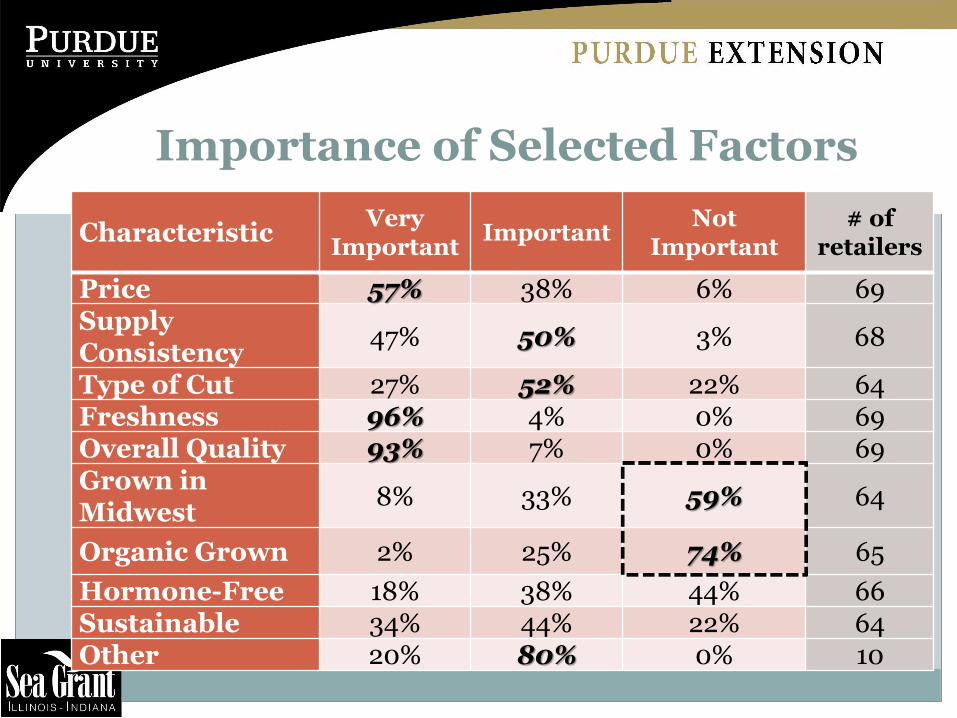
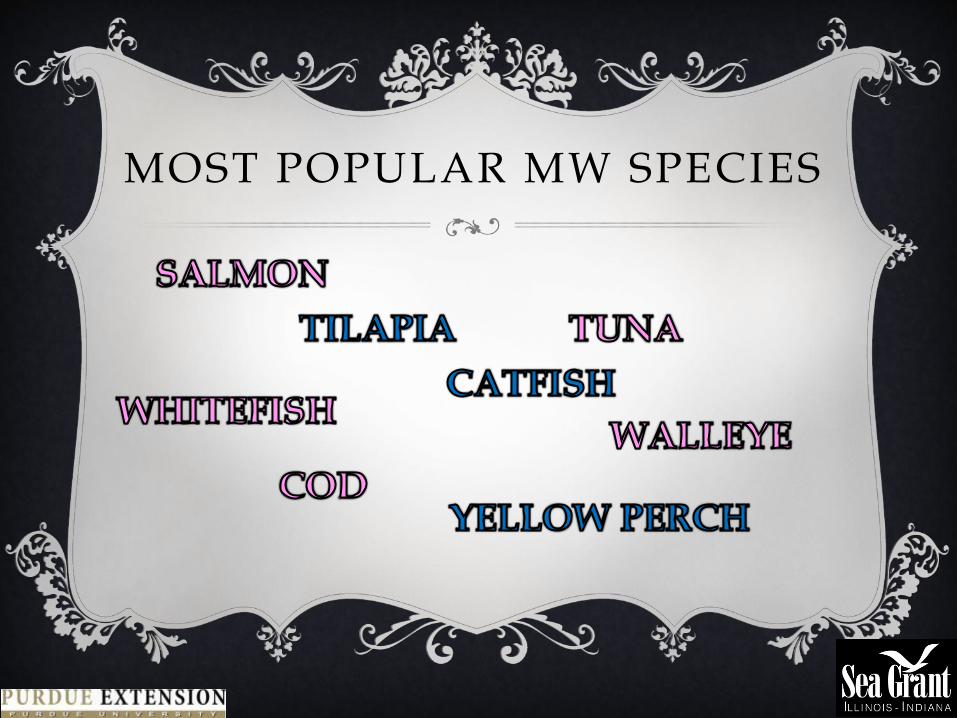
Respondents were also asked a series of questions regarding selected characteristics and their importance to their purchase decisions (see Table 3). The majority of respondents indicated “very important characteristics” being freshness (96%), overall appearance (93%), and price (57%). The following characteristics were regarded as important by respondents: supply consistency (50%), type of cut (52%) and sustainability (44%). Characteristics that respondents indicated as not important included grown in the NC region (59%), organically grown (74%), and hormone-free (44%). Forty retailers indicated they would purchase tilapia if it was raised in the NC region, 26 would purchase catfish, 25 would purchase yellow perch, and 22 would purchase trout. The top fish species sold by retailers were salmon, tilapia, catfish, and cod, respectively. These species are among the top ten species consumed in the US as reported by NOAA (2009).
Table 3: Importance of Selected Factors to Fish Retailers
Characteristic Very
Important Important Not Important
# of Retailers
Price 57% 38% 6% 69
Supply Consistency 47% 50% 3% 68
Type of Cut 27% 52% 22% 64
Freshness 96% 4% 0% 69
Overall Quality 93% 7% 0% 69
Grown in Midwest 8% 33% 59% 64
Organically Grown 2% 25% 74% 65
Hormone-Free 18% 38% 44% 66
Sustainable 34% 44% 22% 64
Other 20% 80% 0% 10
A summary of the results from the Ordered Probit analyses for the eight species are as follows: Tilapia: Tilapia is the most preferred species indicated by respondents. The model had 3
statistically significant variables. The number of deliveries per week was positive, suggesting that as the number of deliveries increases, retailers are willing to pay more for fresh tilapia grown in the NC region. Clientele preference for fresh was negative
8
implying that if a retailer’s customers prefer fresh tilapia (over frozen and value added), the retailer is not willing to pay more. The negative sign appears counterintuitive. Perhaps the retailer is reluctant to pass on any increase in the price of freshness to avoid any decrease in demand. Sourcing from out-of-state was positive which suggests that if a retailer’s supply of fresh fish comes from outside the state, the retailer is willing to pay more for fresh tilapia. Perhaps some retailers cannot get the supply of fresh tilapia they want from within the state. Most tilapia though comes from outside the region as the NC region’s aquaculture industry is yet to produce enough quantities to meet demand.
Catfish: It was the second most popular species indicated by respondents. There were 2 statistically significant variables, including the number of deliveries per week, which was positive and clientele preference for fresh, which was negative. Like tilapia, it appears that the negative effect of freshness is probably because retailers are reluctant to increase prices of what their customers prefer. Another interpretation could be that because fresh catfish is abundant, particularly from the south, retailers do not want to pay more for fresh catfish from the NC region; they are already able to get the fresh quantities needed.
Trout, Yellow Perch, and Hybrid Striped Bass: Trout, yellow perch, and hybrid striped bass were the 3rd, 4th, and 5th most popular species, respectively. Each had 3 significant variables. The number of deliveries per week was positive, and if fish deliveries came from out-of-state was positive. The constant was negative. Regarding the effect of supplies from out-of-state, perhaps because the NC region does not produce much of these species, retailers have to source their products from outside the region, especially trout and hybrid striped bass.
Bluegill, Carp and Largemouth Bass: Carp had 1 significant variable. Out of state supplies was positive even though this species has one of the lowest mean willingness to pay values. Bluegill and largemouth bass had no significant variables even though both species has positive mean willingness to pay values.
Marginal Effects For tilapia, catfish, trout, and yellow perch, the marginal effect of deliveries changed from negative to positive as willingness to pay amounts increased. For all four species, the absolute magnitude of the marginal effect was larger for willingness to pay $0.00 when compared to the effects on willingness to pay up to $0.50 and willingness to pay more than $0.50. The effect of deliveries on willingness to pay $0.00 was relatively stronger than the effect on positive willingness to pay. For example, in the tilapia model, the marginal effect of -9% on willingness to pay $0.00 is greater than the 4% effect on willingness to pay up to $0.50, and 6% effect on willingness to pay more than $0.50. In other words, with more deliveries per week, the probability of retailers’ willingness to pay $0.00 is significantly reduced while the probability of paying more increases
9
The clientele preference for freshness in the models for tilapia, catfish, trout, and hybrid striped bass, bluegill, and largemouth bass all had positive marginal effects for the willingness to pay $0.00, but a negative effect on the other two categories. The marginal effect was stronger (in absolute terms) on willingness to pay $0.00 than the other two options. This suggests that the probability of retailers’ willingness to pay more for fresh fish that is grown in the NC region is significantly low. The variables fillets, out-of-state and in-state had similar marginal effects for tilapia, catfish, trout, yellow perch, and carp. The willingness to pay $0.00 had negative effects but the other two categories had positive willingness to pay effects suggesting that retailers are more likely to pay more for NC regionally grown fish as fillet sales increase and if fresh fish supply is limited to only in-state.
• Objectives 4 & 5: Fish Processors’ Preferences for Regionally Produced Fish
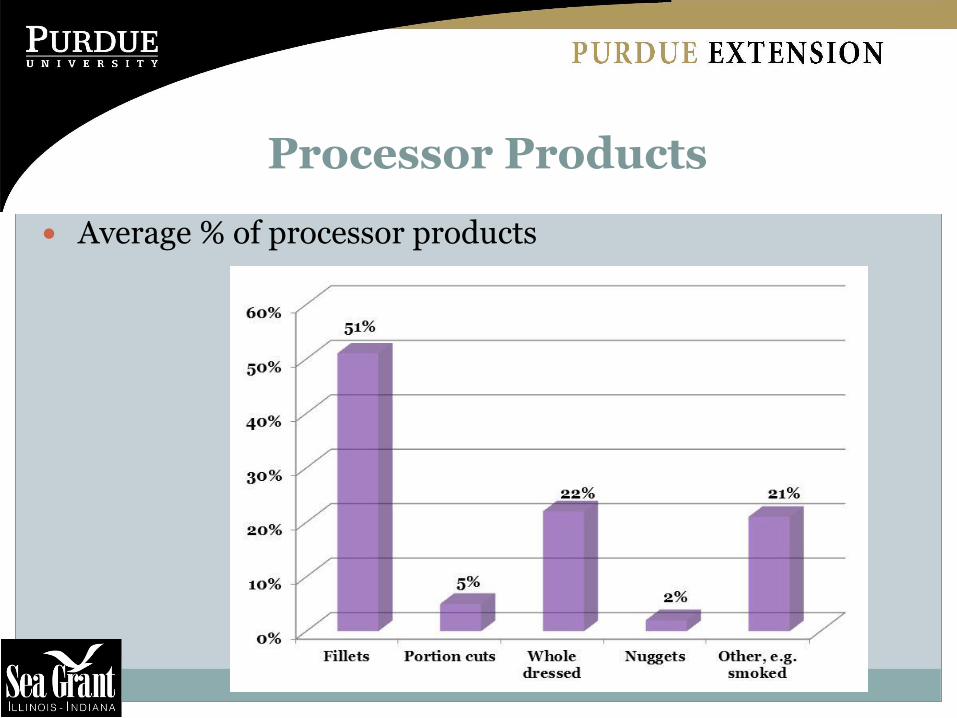
The list of fish processors compiled included processors that handled both commercial fisheries products and farmed fish. A total of 144 surveys were identified, but 137 were found to be actual fish processing facilities. Of the 137 surveys, 23 fish processors returned completed surveys. Because of the low response rate, no quantitative analysis was conducted. Future studies would consider visiting all of the processors in person to increase response rate. None of the respondents belonged to a cooperative. They were all individual private establishments. Up to 87% of respondents were not processing at full capacity, while 13% did process at full capacity. Processing capacity ranged from 20 tons/year to 1,440 with an average of 252.35 tons/year. The major reasons provided for not processing at full capacity included not having enough fish (indicated by 38% of respondents), inconsistency of fish supplies (28%), lack of demand for their final products (7%), non-uniformity of fish size (4%), and other (10%). Half of respondents indicated plans for future expansion in processing capacity. The major products from the fish processors included fillets, whole dressed fish, value-added fish products, portion cuts and nuggets. Majority of respondents (51%) indicated having fillets as their major fish product. Fresh (never frozen) was the main form of product sold, indicated by 63% of respondents. Other product forms included Individually Quick Frozen (IQF), frozen and others. In terms of sources of raw fish products, 58% of all raw products were sourced from the wild while 41% came from aquaculture or fish farming. Only 1% was imported and it is suspected that this is wild white fish from Canada. Processors also responded to questions relating to transactions with both input suppliers (raw fish suppliers) and their customers or buyers of the final processed products. Transactions relating to purchasing of raw fish were mainly outright purchase, indicated by 73% of respondents. Only 27% of respondents indicated any form of contract processing with fishermen or fish farmers. However, payment arrangement with farmers and fishermen varied. About 33% of processors make outright payment upon delivery, 24% pay fishermen and farmers after the
10
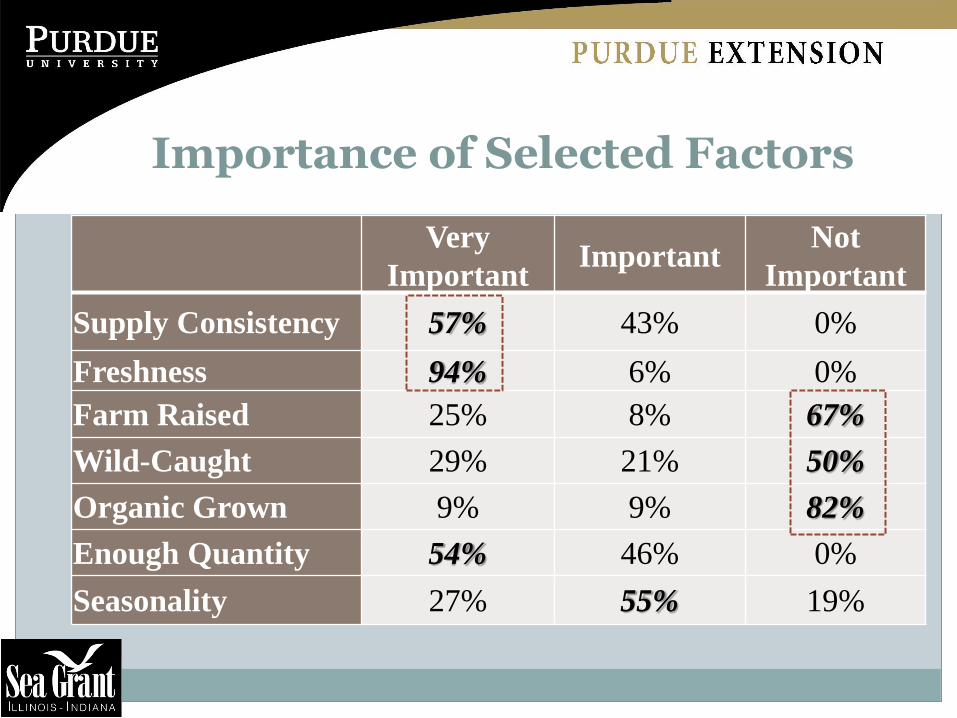
fish is processed and sold, 19% after the fish is processed but before sales and 24% indicated other forms of payment arrangements. Asked if they had any sales contracts with fishermen and farmers, 65% indicated ‘No’ while 35% indicated ‘Yes.’ Table 4 presents some results of the importance fish processors attach to selected factors. The selected factors included supply consistency, freshness, farm-raised, wild-caught, organically grown, sufficient quantity of supply, and seasonality. Freshness and sufficient quantities were considered very important by majority of respondents (over 50%). Table 5, presents the results of the level of interest of fish processors for the 8 major species produced in the NC region.
Table 4: Importance of Selected factors to Fish Processors Very Important Important Not Important Supply Consistency 57% 43% 0% Freshness 94% 6% 0% Farm Raised 25% 8% 67% Wild-Caught 29% 21% 50% Organically Grown 9% 9% 82% Enough Quantity 54% 46% 0% Seasonality 27% 55% 19%
Table 5: Level of Interest in Processing Selected 8 Species from the NC Region
The willingness of processors to pay for regionally grown fresh fish is presented in Table 6. Majority of processors were not willing to pay for fish from the NC region however those who indicated positive WTP showed an average value of $2.81 for yellow perch, $2.75 for hybrid striped bass, $2.50 for largemouth bass, $2.40 for bluegill, $2.15 for trout, $2.06 for tilapia, 2.00 for catfish, and $0.63 for carp (Table 6).
11
Table 6: Willingness to Pay for Selected Species from the NC Region No WTP Yes WTP AVG. WTP
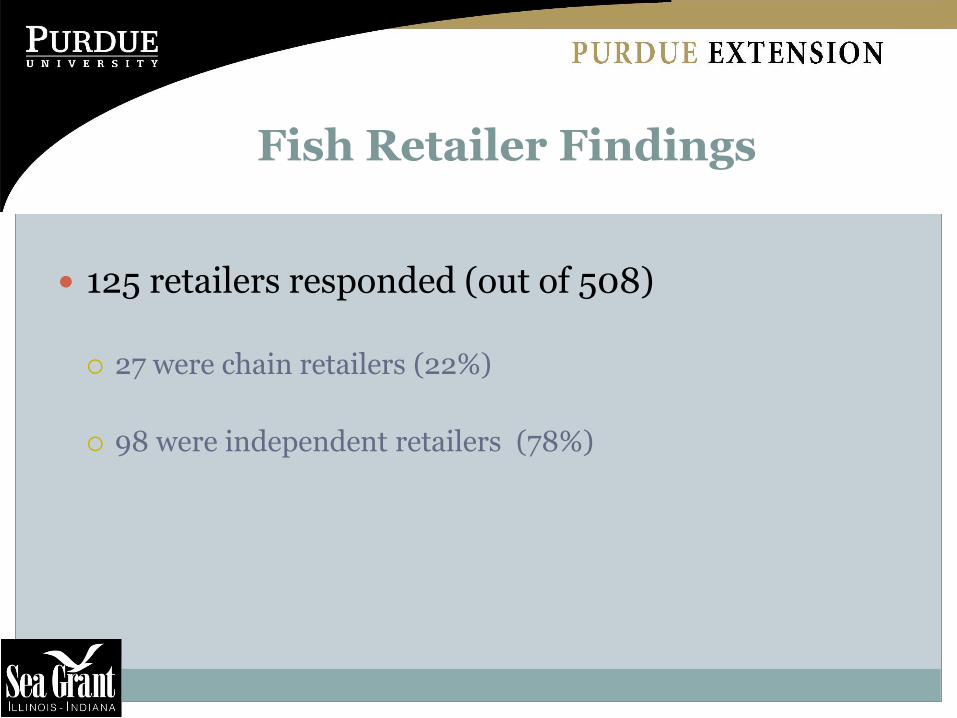
Getting respondents to complete the survey is perhaps the most frustrating aspect of the project. A few of the respondents felt some of the information being asked was too intrusive on their business, though majority of the survey questions were completed. Over 500 fish retailers were sent the survey, and with additional face-to-face visits and phone calls, only 125 surveys were returned. Perhaps offering some incentives may have increased the response rate. However, working with store managers and not consumers, some form of incentive structure probably would have been necessary. Visiting some fish retailers in person helped to increase the response rate. It was also observed that there are some communication gaps between the processors and retailers. Both are looking for competitive prices that they are willing to pay/accept in exchange for fish products. Such communication gaps may be narrowed as fish producers in the NC region pursue opportunities for processing fish produced in the region. Processors also need to be aware of what types of factors are most important to fish retailers and consumers. With other areas of meat production receiving heavy media attention and sometimes criticism, the aquaculture industry needs to prepare and be ready to handle consumer concerns and demands, retailer demands, and governmental regulations. Though one survey was administered, two issues were examined. The first objective was a latter addition because from the face-to-face visits, it became clear that location and demographics were very important to selling seafood. Consequently, one question/answer from the survey was supplemented with secondary data, mainly demographics to accomplish objective #1. Overall, the project did provide useful information to fish producers, processors, marketers, and retailers in the NC region. Although this study did not survey the consumer, information gathered from the managers provides some understanding of customers’ fish preferences from the seller’s perspective.
12
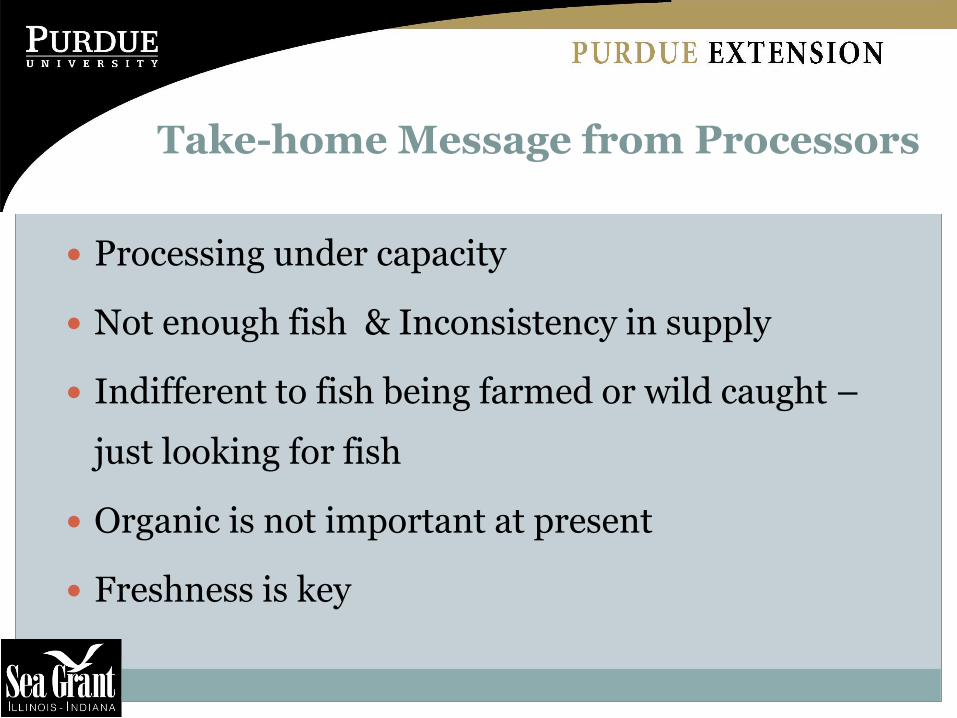
DISCUSSION OF CURRENT AND FUTURE BENEFITS OF RESULTS Accessing fish retailer markets that are chain-affiliated may be an outlet for fish producers because these retailers are more likely to sell fresh fish on ice. However, the lack of enough fresh fish supply from aquaculture in the NC region makes this outlet not feasible in the short run. Perhaps group marketing where producers pool their products together could provide opportunities for enough supplies to chain retailers. Other alternatives could be cooperative fish processing or some sort of processing agreement with existing fish processing plants. The main issues identified from the processors perspective were processing under capacity, not having enough fish to process, inconsistency in the supply of raw fish products, the indifference to fish being farmed or wild caught and freshness. This suggests that viable opportunities exist for fish farmers in the NC region to tap into the processed seafood market, looking beyond the traditional live fish market. Organic produced fish does not seem to be important at present to fish processors. More research is needed in the domestic seafood industry, both on the supply and demand areas, focusing on restaurants and seafood retailer sectors.
PROJECT BENEFICIARIES
The major beneficiaries include aquaculture producers, fish processors, fish wholesalers / distributors, and fish retailers. Results from the study were presented at various forums. An oral and poster presentations were made at the Aquaculture America conference held in New Orleans, LA from February 28 – March 3, 2011. Over 550 conference participants were exposed to the results from the study. The presentation attracted about 50 participants while the poster session attracted about 500 visitors. A second workshop targeting fish producers in the NC region was held at the College of Technology, Anderson, IN from September 29-30, 2011. A total of 30 participants attended the workshop.
REFERENCES CITED
Alwitt, Linda F. and T.D. Donley. 1997. Retail Stores in Poor Urban Neighborhoods. The Journal of Consumer Affairs 31(1):139-164.
Caporelli, A. and S.D. Mims. 2008 Processing Smoked Freshwater Fish Products and Market Development of these Value- Added Products in the Great Lakes and Northeast Regions of the United States. FY 2006 FSMIP – Final Report.
Chain Store Guide. 2009. Database. https://www.chainstoreguide.com/t-about.aspx Chen, Susan, R. J. G. M. Florax, and S. Snyder. 2009. “Does Where You Live Make You Fat?
Obesity and Access to Chain Grocers.” Working Paper, Dept. of Agricultural Economics, Purdue University.
13
Cheng, Hsiang-Tai and O. Capps, Jr. 1988. Demand Analysis of Fresh and Frozen Finfish and Shellfish in the United States. American Journal of Agricultural Economics 70(3):533-542.
Hanson, Gregory D., J.W. Dunn, and G.P. Rauniyar. 1996. Marketing Characteristics Associated With Seafood Counters in Grocery Stores. Marine Resource Economics 11: 11-22.
Kumar, Ganesh, K.K. Quagrainie, and C.R. Engle. 2008. Factors that Influence Frequency of Purchase of Catfish by U.S. Households in Selected Cities. Aquaculture Economics and Management 12:252-267.
Moore, Lateria V., and A.V.D. Roux. 2006. Associations of Neighborhood Characteristics with the Location and Type of Food Stores. American Journal of Public Health 96(2):325-331.
Myers, J.J., R. Govindasamy, J.W. Ewart, B. Liu, Y. You, V.S. Puduri, and L.J. O’Dierno. 2007. “Consumer Analysis of and Business Network Development for Ethnic Live Seafood Markets of in the Northeast Region.” FY 2005 FSMIP – Final Report - 12-25-G-0460 and New Jersey Department of Agriculture Project 12-25-G-0460 Report.
National Restaurant Association. 2010. State Statistics. Retrieved: October 2010. http://www.restaurant.org/research/state/.
Nayga, Rodolfo and O. Capps, Jr. 1995. Factors Affecting the Probability of Consuming Fish and Shellfish in the Away from Home and at Home Markets. Journal of Agricultural and Applied Economics 27(1):161-171.
Powell, Lisa M, S. Slater, D. Mirtcheva, Y. Bao, and F. J. Chaloupka. 2007. Food Store Availability and Neighborhood Characteristics in the United States. Preventive Medicine 44:189-195.
Puduri, Venkata, R. Govindasamy, J.J. Myers, and L.J. O’Dierno. 2010. Demand for Live Aquatic Products in the Mid-Atlantic States: An Ordered Probit Analysis towards Consumers’ Preferences. Aquaculture Economics and Management 14:30-42.
Quagrainie, Kwamena K. 2006. IQF Catfish Retail Pack: A Study of Consumers’ Willingness to Pay. International Food and Agribusiness Management Review 9(2):75-87.
United States Census Bureau (USCB). 2000. Census 2000 Demographic Profile Highlights; Retrieved: 08/31/2010. http://www.census.gov/
U.S. Department of Commerce, National Oceanic Atmospheric Association (NOAA). 2009. Fisheries of the United States. Retrieved: 10/20/2010. http://www.st.nmfs.noaa.gov/st1/fus/fus09/ index.html
Zimet, D. and P. Zajicek. 2000. The Market Potential for Live Florida Food Fish in the Northeastern United States. East Coast Live! 2000. Annapolis, Maryland, USA. November 1-4, 2000.