Page 1
DEVELOPMENT AND EVALUATION OF DOUBLE
GENES TARGETED MULTIPLEX PCR ASSAYS FOR
THE DETERMINATION OF BOVINE, BUFFALO AND
PORCINE MATERIALS IN FOOD PRODUCTS
M. A. MOTALIB HOSSAIN
INSTITUTE OF GRADUATE STUDIES
UNIVERSITY OF MALAYA
KUALA LUMPUR
2017
Page 2
DEVELOPMENT AND EVALUATION OF DOUBLE GENES
TARGETED MULTIPLEX PCR ASSAYS FOR THE
DETERMINATION OF BOVINE, BUFFALO AND PORCINE
MATERIALS IN FOOD PRODUCTS
M. A. MOTALIB HOSSAIN
THESIS SUBMITTED IN FULFILMENT OF THE
REQUIREMENTS FOR THE DEGREE OF DOCTOR OF
PHILOSOPHY
INSTITUTE OF GRADUATE STUDIES
UNIVERSITY OF MALAYA
KUALA LUMPUR
2017
Page 3
ii
UNIVERSITY OF MALAYA
ORIGINAL LITERARY WORK DECLARATION
Name of Candidate: M. A. Motalib Hossain
Registration/Matric No: HHC130001
Name of Degree: Doctor of Philosophy
Title of Project Paper/Research Report/Dissertation/Thesis (“this Work”):
DEVELOPMENT AND EVALUATION OF DOUBLE GENES TARGETED
MULTIPLEX PCR ASSAYS FOR THE DETERMINATION OF BOVINE,
BUFFALO AND PORCINE MATERIALS IN FOOD PRODUCTS
Field of Study: Biochemistry and Biology
I do solemnly and sincerely declare that:
(1) I am the sole author/writer of this Work;
(2) This Work is original;
(3) Any use of any work in which copyright exists was done by way of fair dealing
and for permitted purposes and any excerpt or extract from, or reference to or
reproduction of any copyright work has been disclosed expressly and
sufficiently and the title of the Work and its authorship have been
acknowledged in this Work;
(4) I do not have any actual knowledge nor do I ought reasonably to know that the
making of this work constitutes an infringement of any copyright work;
(5) I hereby assign all and every rights in the copyright to this Work to the
University of Malaya (“UM”), who henceforth shall be owner of the copyright
in this Work and that any reproduction or use in any form or by any means
whatsoever is prohibited without the written consent of UM having been first
had and obtained;
(6) I am fully aware that if in the course of making this Work I have infringed any
copyright whether intentionally or otherwise, I may be subject to legal action
or any other action as may be determined by UM.
Candidate’s Signature Date: August 29, 2017
Subscribed and solemnly declared before,
Witness’s Signature Date: August 29, 2017
Name:
Designation:
Page 4
iii
ABSTRACT
Bovine, buffalo and porcine materials in food products are sensitive to religions and a
big threat to health and fair economic practices. Current methods to authenticate these
animal materials in food chain are based on mainly single gene target which are generally
longer in length and thus breakdown during food processing treatments. For the first time,
here I targeted double gene sites in short-amplicon length multiplex polymerase chain
reaction (mPCR) assays for the detection and differentiation of bovine, buffalo and
porcine materials in food chain. Multiple targets detection in single assay saves analytical
cost and time. Both the conventional and real-time PCR platforms were developed and
authentic target detection was confirmed through sequencing and Restriction Fragment
Length Polymorphism analysis. Mitochondrial cytochrome b (cytb) and NADH
dehydrogenase subunit 5 (ND5) genes were targeted and six different targets (length: 73-
146 bp), two for each of cow (121 and 106 bp), buffalo (90 and 138 bp) and pig (73 and
146 bp), were amplified from raw, boiled, autoclaved and microwaved cooked meat under
pure and mixed matrices. The specificity of the PCR assays were checked against three
targets and 25 non-target species. Specific PCR products were found only from beef,
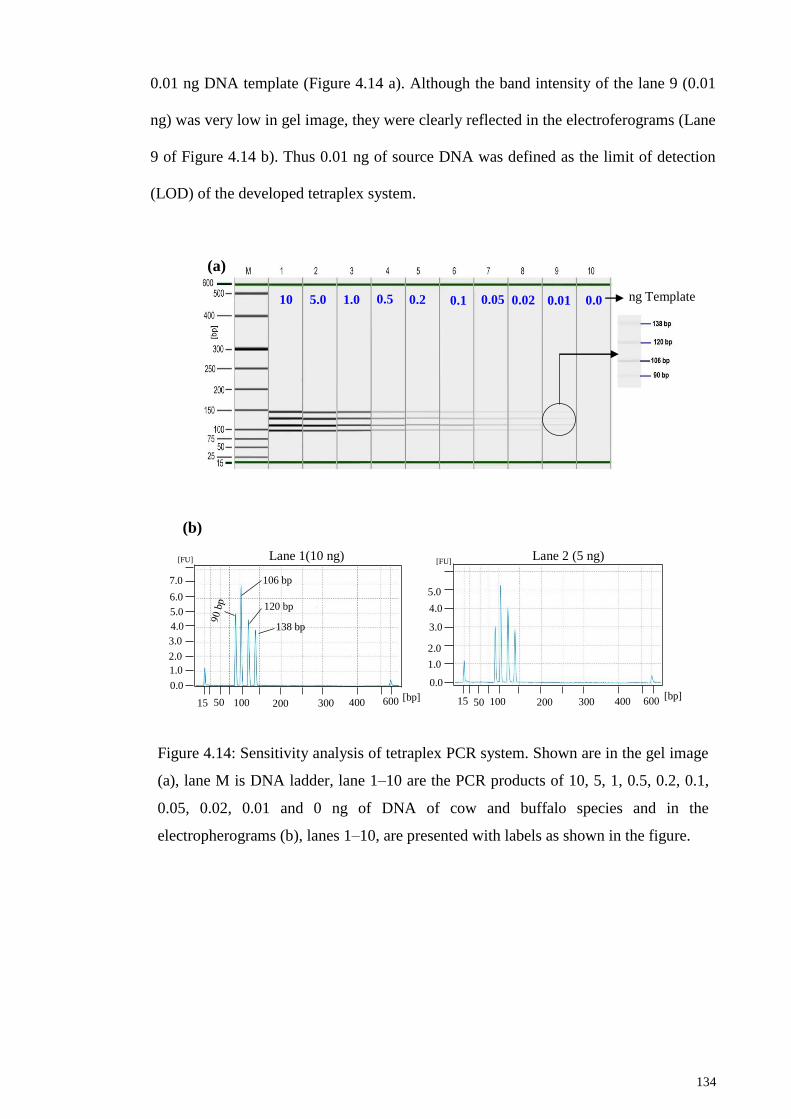
buffalo, and pork that were targeted in this assay. To eliminate the possibility of any false-
negative detection, eukaryotic endogenous control was used for specificity testing. The
detection limit was 0.01 ng DNA for tetraplex and 0.02 ng DNA for hexaplex under pure
states and 0.1% target meat in mixed and commercial matrices. Complete sequence
matching was found for five the PCR products but 98.5% for buffalo ND5 gene. The PCR
products were digested by four restriction enzymes, namely AluI, EciI, FatI and CviKI-1
and clear restriction fingerprints were obtained. The developed methods were used for the
screening of bovine, buffalo and porcine materials in various commercial meat curries
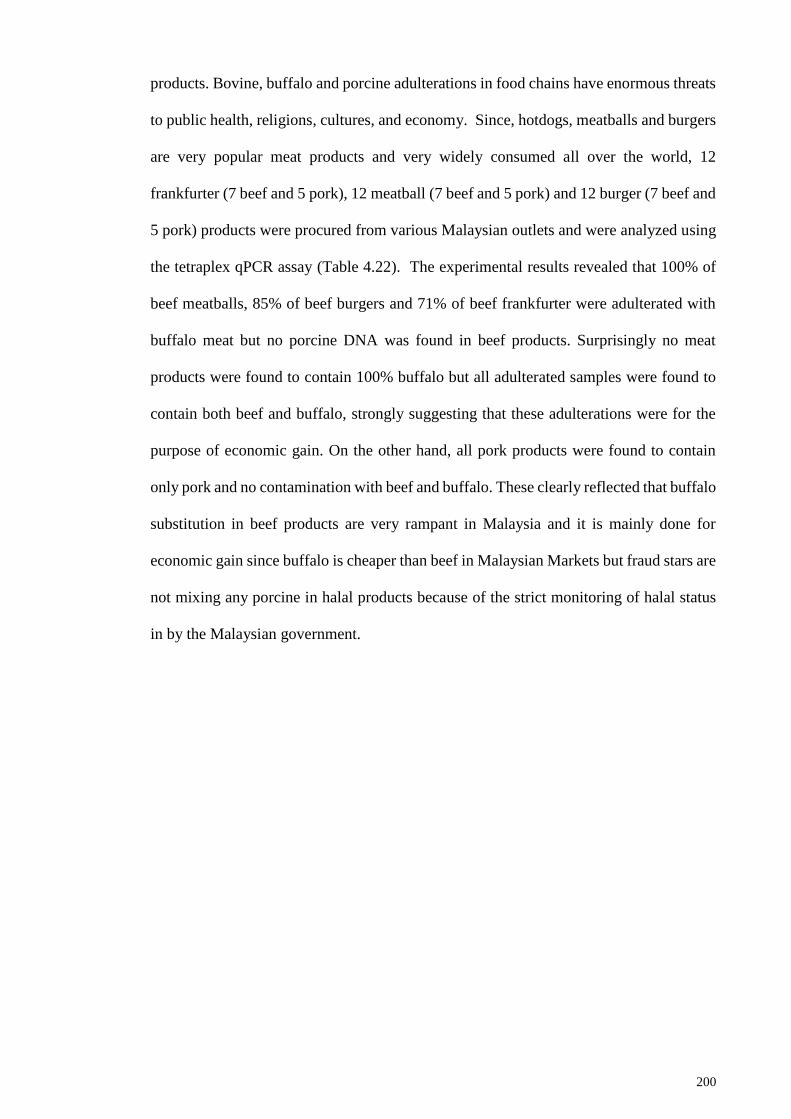
and processed foods, namely, meatballs and frankfurters. Survey results revealed about
80% of beef meatballs were adulterated with buffalo and about 20% of beef products were
Page 5
iv
totally replaced with buffalo. Moreover, the analysis of 20 beef frankfurters revealed the
presence of both beef and buffalo in all specimens. This demonstrated that all beef
frankfurter products are adulterated with buffalo in Malaysia. However, the analysis of 7
beef curries reflected only 2 them were beef and 5 were buffalo. In contrast, porcine
meatball and frankfurter were found 100% authentic and also no pork was detected in
halal branded beef curries, meatballs and frankfurters and chicken frankfurters. Finally,
the developed TaqMan probe multiplex real-time PCR (mqPCR) assay successfully
detected 0.003 ng DNA in a pure state and 0.1% target meat in mixed and commercial
matrices. Analysis of commercial products under mqPCR assay revealed 71% and 100%
of beef frankfurters, meatballs and 85% burgers contained buffalo adulteration but no
pork in Malaysian markets. The advantage of the method was evidenced in terms of
fidelity, cost and time since all the three species were detected and the option of
alternative targets could complement missing targets even in decomposed specimens.
Page 6
v
ABSTRAK
Daging lembu, kerbau dan babi di dalam produk makanan menyentuh sensitiviti
agama dan merupakan ancaman yang besar terhadap kesihatan dan ekonomi yang
saksama. Kaedah semasa untuk mengesahkan bahan-bahan haiwan dalam rantaian
makanan adalah berfokus kepada sasaran gen tunggal yang lazimnya lebih panjang, maka
kerosakan pada gen kerap berlaku semasa pemprosesan makanan. Buat julung kalinya,
saya menyasarkan dua lokasi gen dengan amplikon berjarak pendek dalam penilaian
rantaian tindak balas polimeras (PCR) multipleks untuk mengesahkan pengesanan dan
pembezaan daging lembu, kerbau dan babi dalam rantai makanan. Pengesanan pelbagai
sasaran dalam penilaian tunggal dapat menjimatkan kos analisis dan masa. Kedua-dua
platform PCR konvensional dan masa-nyata telah digunakan dan pengesanan sasaran
dipastikan melalui penjujukan dan analisis Polimorfisma Panjang Fragmen Terbatas. Gen
mitokondria Cytochrome b (cytb) dan NADH dehydrogenase sub unit 5 (ND5) telah
disasarkan, dan enam sasaran yang berbeza (panjang: 73-146 bp), dua untuk lembu (121
dan 106 bp), kerbau (90 dan 138 bp) dan babi (73 dan 146 bp), telah diamplifikasikan
daripada daging mentah, direbus, diautoklaf dan dimasak melalui gelombang mikro,
sebagai daging semata ataupun campuran pelbagai matriks. Spesifikasi asai PCR
ditentukan ke atas tiga sasaran dan 25 spesis bukan sasaran.Ujian spesifik produk PCR
hanya dijumpai pada daging lembu, daging kerbau dan daging babi yang menjadi sasaran
di dalam asai ini. Untuk menyingkirkan pengesanan salah-negatif, kawalan endogenous
eukaryotik telah digunakan dalam ujian spesifik. Had pengesanan adalah 0.01 ng DNA
untuk tetrapleks dan 0.02 ng DNA ng untuk heksapleks dalam keadaan tulen dan 0.1%
daging sasaran dalam matriks bercampur dan matriks komersil. Penjujukan sempurna
dikesan untuk lima produk PCR namun hanya 98.5% untuk gen ND5 bagi daging kerbau.
Produk PCR telah dicerna oleh empat enzim terbatas, iaitu AluI, EciI, FatI dan CviKI-1
dan cap jari terbatas jelas diperolehi. Pembangunan kaedah ini telah digunakan untuk
Page 7
vi
menganalisis lembu, kerbau dan babi dalam pelbagai kari daging komersial dan makanan
yang diproses, termasuk bebola daging dan frankfurter. Keputusan kaji selidik
mendedahkan kira-kira 80% daripada bebola daging lembu telah dicemari dengan kerbau
dan kira-kira 20% produk daging lembu telah sama sekali digantikan dengan kerbau.
Selain itu, analisis 20 frankfurter daging lembu mendedahkan kewujudan kedua-dua
daging lembu dan kerbau dalam semua spesimen. Ini menunjukkan bahawa semua produk
frankfurter daging lembu dicemari kerbau di Malaysia. Walau bagaimanapun, analisis 7
kari daging lembu menunjukkan hanya 2 daripada sampel adalah daging lembu manakala
5 adalah kerbau. Sebaliknya, bebola dan frankfurter babi didapati 100% asli dan tiada
daging babi dikesan dalam kari daging lembu berlabel halal, bebola daging dan
frankfurter serta frankfurter ayam. Akhirnya, prob Taqman multipleks asai PCR masa-
nyata yang telah dibangunkan berjaya mengesan 0.003 ng DNA dalam keadaan tulen dan
0.1% daging sasaran di dalam matriks campuran dan komersial. Analisis produk
komersial menggunakan asai mqPCR mendedahkan 71% dan 100% frankfurter daging
lembu, bebola daging dan 85% burger mengandungi penambahan daging kerbau tetapi
tiada pengubahsuaian menggunakan daging babi di dalam pasaran Malaysia. Kelebihan
kaedah ini dibuktikan melalui ketepatan, kos dan masa kerana ketiga-tiga spesis berjaya
dikesan dan sasaran alternatif dapat melengkapkan sasaran yang hilang walaupun di
dalam spesimen terurai.
Page 8
vii
ACKNOWLEDGEMENTS
All praises to Allah SWT, The Most Merciful, The Gracious and The Supreme
powerful, who has given me ability and strength to complete my study. May Allah (SWT)
gives His peace and mercy to Prophet Mohammad (peace be upon him), all prophets and
all Muslim.
At first, I would like to express my deepest respect and gratitude to my supervisors,
Associate Professor Dr. Md. Eaqub Ali and the Late Prof. Dr. Sharifa Bee Abd Hamid
for their intellectual support, extraordinary guidance, wisdom and encouragement though
my research. Sacrifice of their precious time and effort to guide, monitor as well as advice
to success of my work. It is so sad that Prof. Sharifa Bee no more with us, she passed
away before some days. Today I deeply feel her and also pray for peace of her departure
soul. I would like to extend my deepest gratitude to Prof. Jennifer Ann Harikrishna from
CEBAR for her help to use the instrumental facilities in CEBAR, IPPP, Universiti
Malaya. I also thankful to INFRA Lab, IPPP, Universiti Malaya for giving opportunity to
use their instrument.
My regards also go to my fellow lab-members, Md. Abdur Razzak, Md. Al Amin,
Asing, Md. Nasir Ahmad, Nina Naquiah Ahmad Nizar, Sharmin Sultana, Sharmin Quazi
Bonny and Ismat Hazim Zainal, who are all shared their experiences to make easier my
work and made enjoy full lab environment. Thanks are also extended to all NANOCAT
staff and members for their cooperation and input according to requirement.
Finally, I sincerely thank to my wife for her unlimited sacrifice, consolation and love
which inspired me to hard effort in research. Last but not least, I would like to thank my
parents, children and other family members for their encouragement, support and love.
Page 9
viii
TABLE OF CONTENTS
1.1 Background of the Study ......................................................................................... 1
1.2 Project Rationale ...................................................................................................... 6
1.3 Problem Statements ................................................................................................. 7
1.4 Research Objectives ................................................................................................. 8
1.4.1 General Objective .................................................................................... 8
1.4.2 Specific Objectives .................................................................................. 8
1.5 Scopes of Research .................................................................................................. 9
1.5.1 Development of Biomarkers ................................................................... 9
1.5.2 Evaluation of the Biomarker-specificity using PCR-based Technique . 10
1.5.3 Assay Validation and Food Analysis .................................................... 11
1.6 Thesis Organization ............................................................................................... 12
2.1 Influence of Animal Materials in Food Chains and Needs of Authentication....... 14
2.1.1 What We Mean by Adulteration ........................................................... 15
2.1.2 Mislabeled Food .................................................................................... 19
2.1.3 Prevalence of Meat Food Fraud ............................................................ 21
2.1.4 Impact of Food Fraud ............................................................................ 22
2.2 Importance of Cow, Buffalo and Pig Species Detection ....................................... 24
Page 10
ix
2.2.1 Meat Sources ......................................................................................... 24
2.2.2 Domesticated Animals as a Source of Meat.......................................... 30
2.2.2.1 Cow (Bos taurus) ................................................................ 30
2.2.2.2 Water Buffalo (Bubalus bubalis) ........................................ 31
2.2.2.3 Pig (Sus scrofa) ................................................................... 33
2.2.3 Religious Belief ..................................................................................... 37
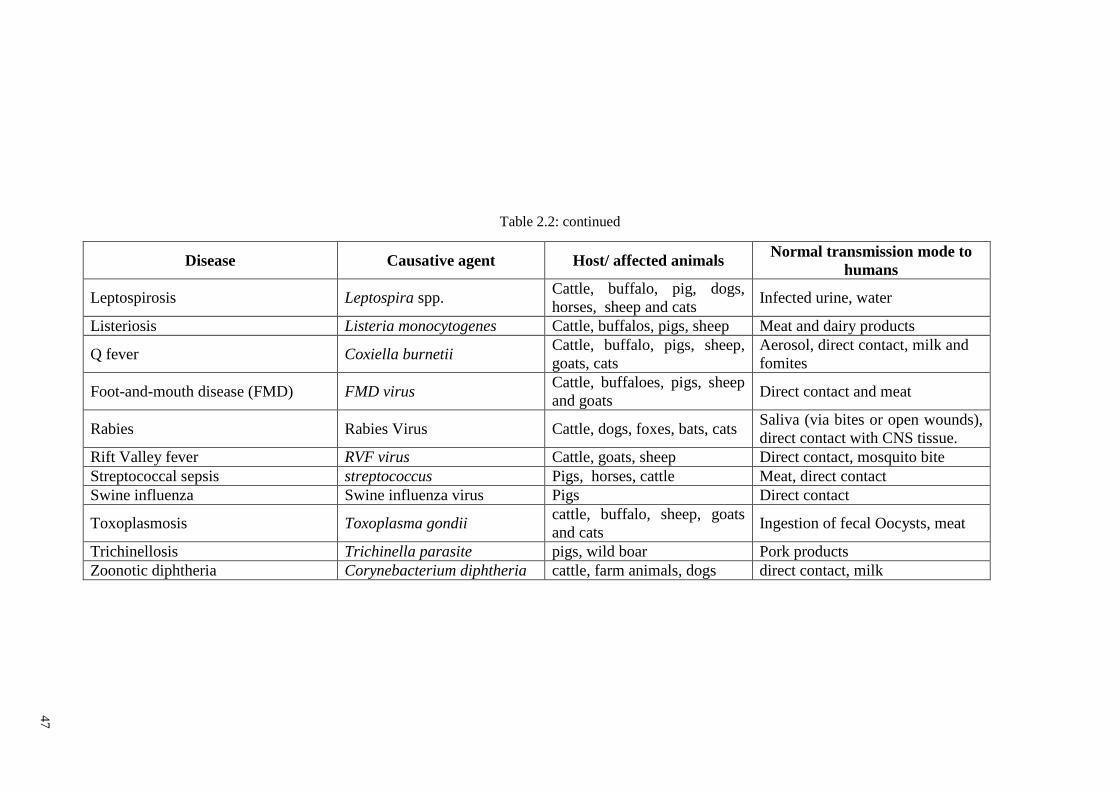
2.2.4 Zoonosis ................................................................................................ 43
2.3 Current Species Detection Technique.................................................................... 48
2.3.1 Lipid Based Assay ................................................................................. 49
2.3.2 Protein Based Assay .............................................................................. 50
2.3.2.1 Histidine Dipeptides Based Assay ...................................... 50
2.3.2.2 Analysis of Muscle Protein ................................................. 51
2.3.2.3 Analysis of Species-specific Osteocalcin ........................... 52
2.3.2.4 Detection of Species Specific Proteins by ELISA .............. 54
(a) Indirect ELISA ...................................................................... 54
(b) Sandwich ELISA ................................................................... 55
2.3.3 DNA-based Method .............................................................................. 57
2.3.3.1 Polymerase Chain Reaction (PCR) Based Assay ............... 59
(a) PCR Sequencing ................................................................... 62
(b) Species Specific PCR ............................................................ 63
i ) Singleplex PCR ...................................................................... 64
ii ) Multiplex PCR ....................................................................... 65
iii) PCR- Randomly Amplified Polymorphic DNA (PCR-
RAPD) .................................................................................... 67
iv) PCR-restriction fragment length polymorphism (PCR-
RFLP) ..................................................................................... 68
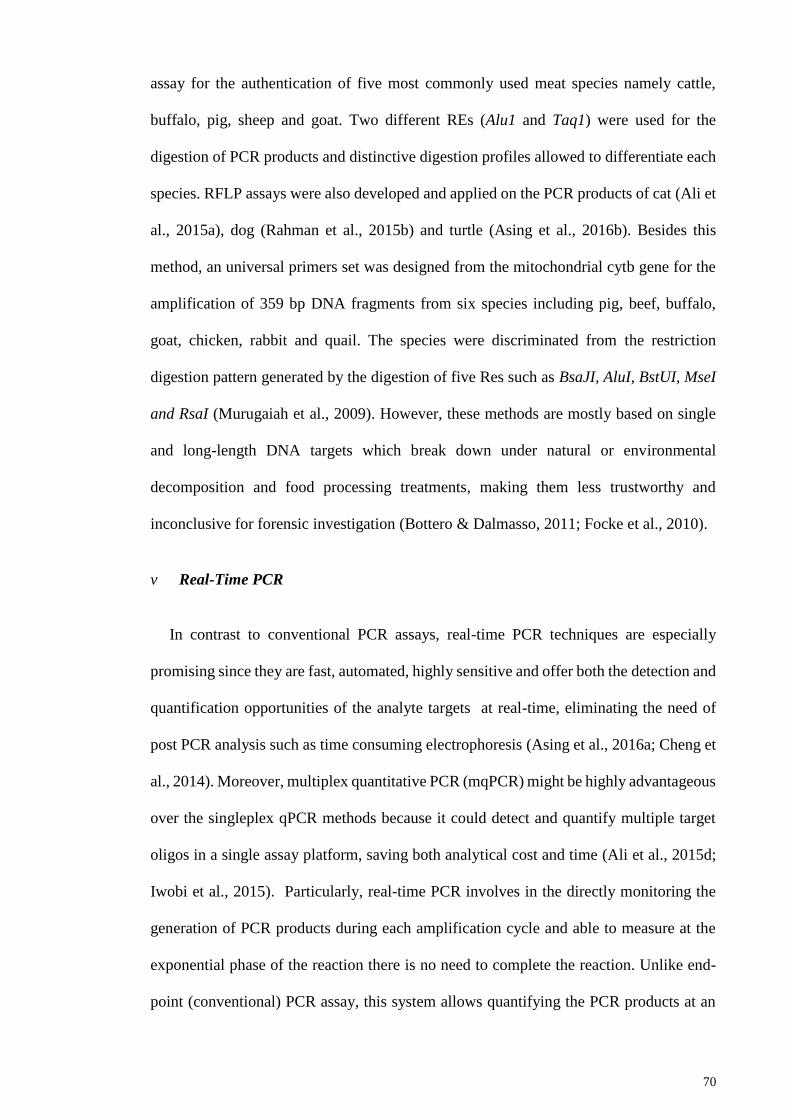
v ) Real-Time PCR ...................................................................... 70
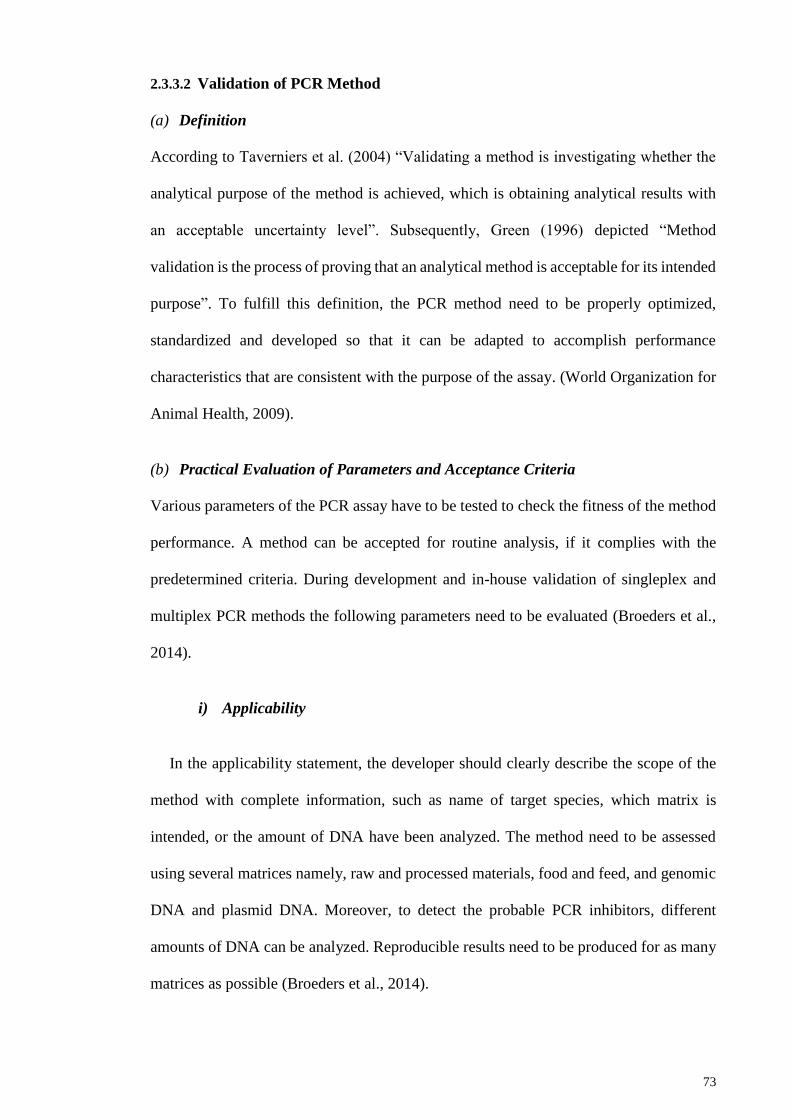
2.3.3.2 Validation of PCR Method ................................................. 73
(a) Definition .............................................................................. 73
(b) Practical Evaluation of Parameters and Acceptance
Criteria ................................................................................. 73
i) Applicability ........................................................................... 73
ii) Practicability .......................................................................... 74
iii) Optimization and Standardization of Reagents and
Determination of Critical Control Parameters ....................... 74
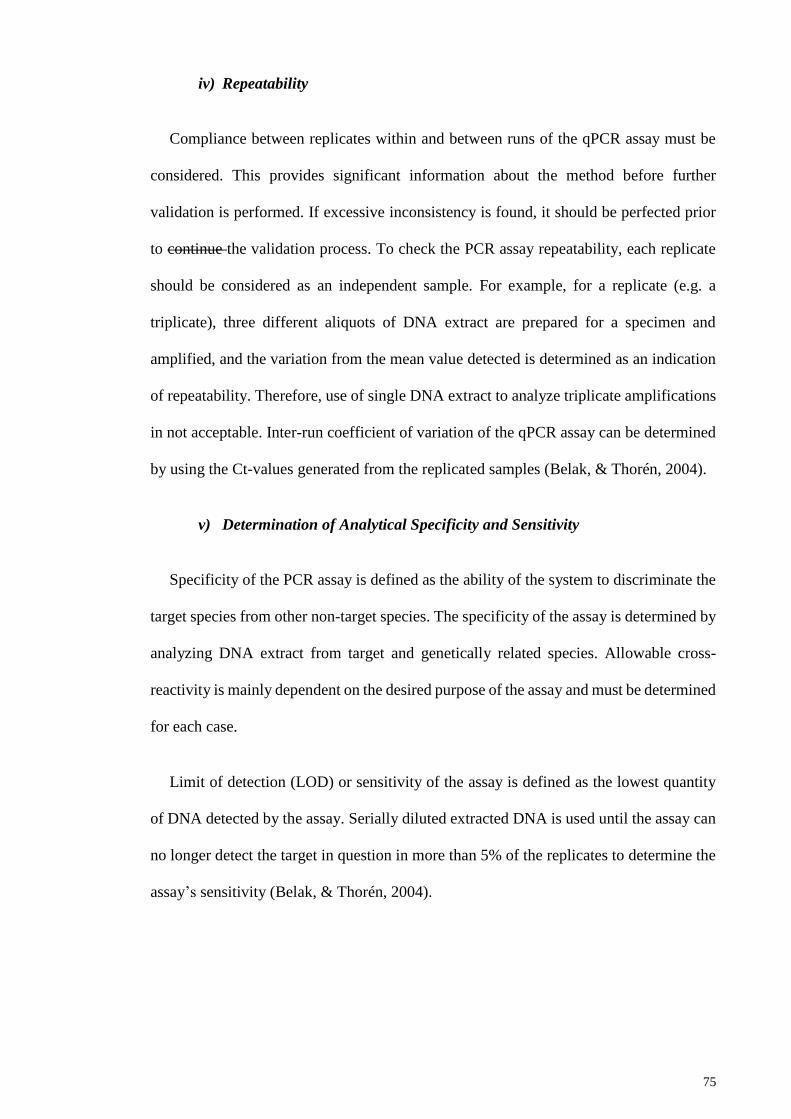
iv) Repeatability .......................................................................... 75
v) Determination of Analytical Specificity and Sensitivity ....... 75
Page 11
x
vi) Establishing Reproducibility of the Assay ............................. 76
3.1 Collection of Sample ............................................................................................. 78
3.2 Extraction of DNA ................................................................................................. 79
3.3 Development of Biomarkers for Multiplex PCR ................................................... 79
3.3.1 Primer Length ........................................................................................ 80
3.3.2 GC Content ............................................................................................ 80
3.3.3 Melting and Annealing Temperature .................................................... 81
3.3.4 3'-end Specificity ................................................................................... 82
3.3.5 Primer-Primer Interactions .................................................................... 82
3.3.6 Specificity.............................................................................................. 83
3.3.7 Design of Species-Specific Primers and Probes ................................... 83
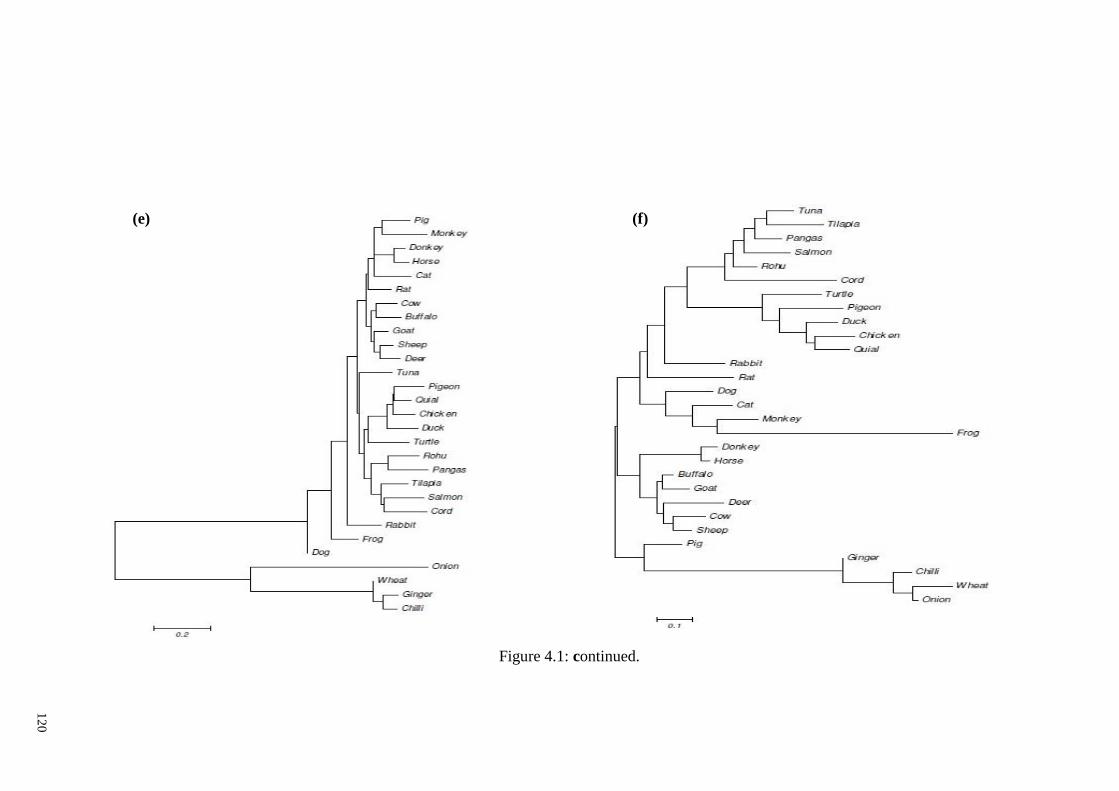
3.3.8 Construction of Pairwise Distance and Phylogenetic Tree ................... 86
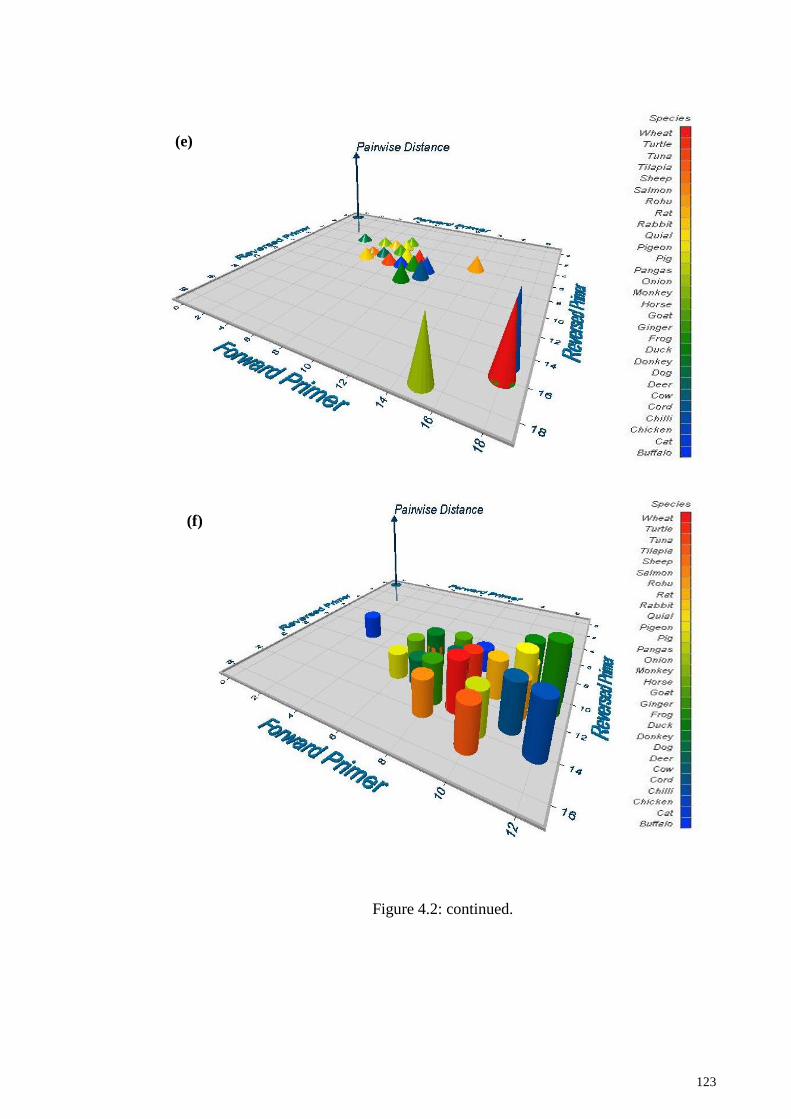
3.3.9 Construction of 3D Plots ....................................................................... 86
3.4 Development of Simplex PCR Assay .................................................................... 86
3.4.1 Optimization of Simplex PCR Assay .................................................... 86
3.4.2 Gel Electrophoresis ............................................................................... 87
3.4.2.1 Conventional Gel Electrophoresis ...................................... 88
3.4.2.2 QIAxcel Advanced Capillary Electrophoresis System ....... 88
3.4.3 Specificity Test of Simplex PCR Assay ................................................ 89
3.4.4 PCR Product Sequencing ...................................................................... 89
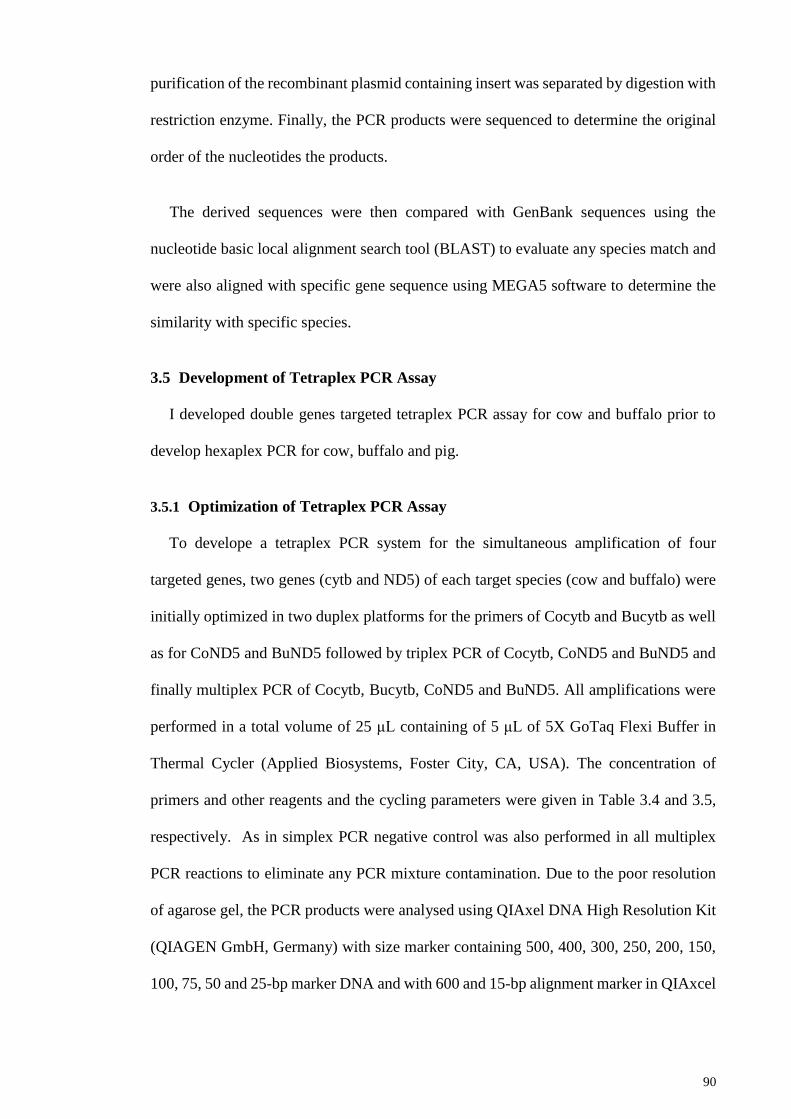
3.5 Development of Tetraplex PCR Assay .................................................................. 90
3.5.1 Optimization of Tetraplex PCR Assay .................................................. 90
3.5.2 Specificity Test of Tetraplex PCR Assay .............................................. 91
3.5.3 Limit of detection (LOD) of Tetraplex PCR Assay under Raw State ... 92
3.5.4 Sensitivity test of Tetraplex PCR Assay under Binary Meat
Admixture ......................................................................................... 92
3.5.5 Sensitivity test of Tetraplex PCR Assay under Commercial Product
(Burger) ............................................................................................. 92
3.5.6 Target DNA Stability Test under Tetraplex PCR Assay....................... 93
3.6 Development of Hexaplex (Multiplex) PCR of Cow, Buffalo and Pig ................. 93
3.6.1 Optimization of Multiplex (Hexaplex) PCR (mPCR) Assay ................ 93
Page 12
xi
3.6.2 Specificity Test of Multiplex PCR Assay ............................................. 94
3.6.3 Limit of Detection (LOD) of Multiplex PCR Assay under Raw State . 94
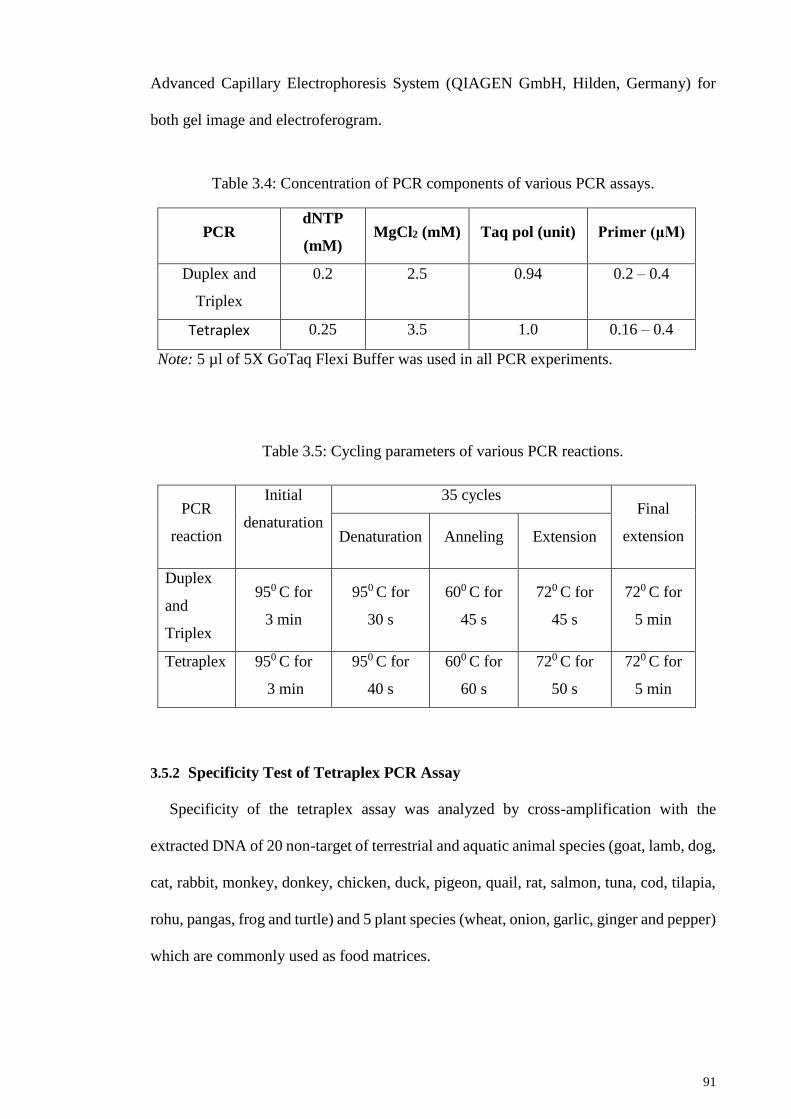
3.6.4 Sensitivity Test of Multiplex PCR Assay under Commercial Products
(Frankfurters and Meatballs) ............................................................. 95
3.6.5 Target DNA Stability Test under Multiplex PCR Assay ...................... 96
3.7 Enzymatic Digestion and RFLP Analysis ............................................................. 96
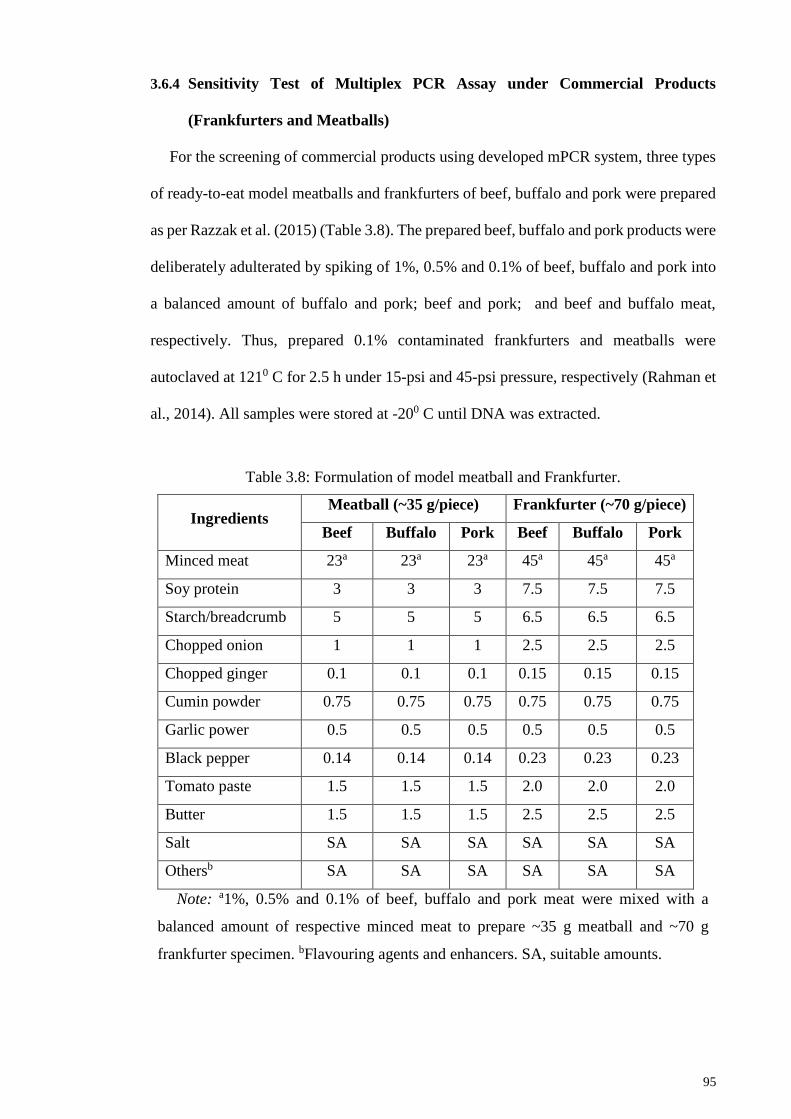
3.7.1 Analysis of Beef and Buffalo PCR Products ........................................ 97
3.7.1.1 Digestion of Beef and Buffalo Simplex PCR Products ...... 97
3.7.1.2 Digestion of Beef and Buffalo Tetraplex PCR Products .... 98
3.7.2 RFLP Analysis of Simplex Pork PCR Products.................................... 98
3.7.3 Authentication of PCR Products of frankfurters by RFLP Analysis .... 99
3.8 Real-time PCR Assay ............................................................................................ 99
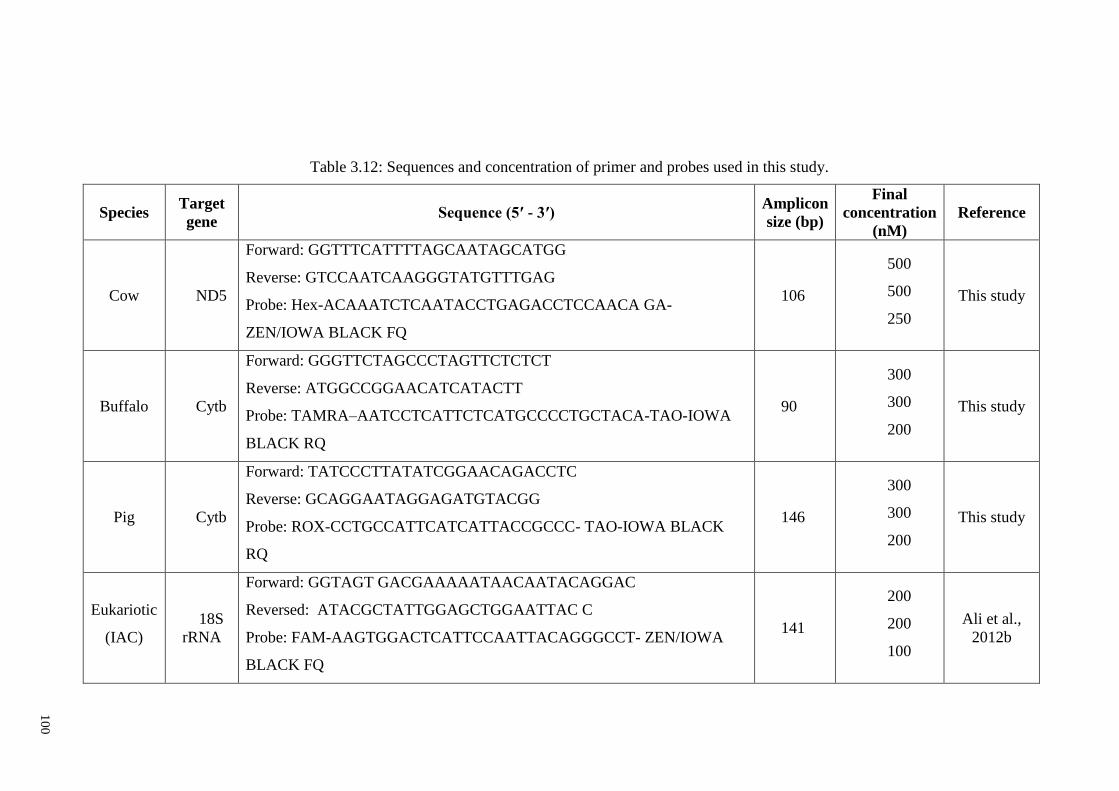
3.8.1 Design of Primers and Probes ............................................................... 99
3.8.2 Multiplex (Tetraplex) Real-time PCR Conditions .............................. 101
3.8.3 Specificity Test of mqPCR Assay ....................................................... 101
3.8.4 Limit of Detection (LOD) ................................................................... 101
3.8.5 Generation of Standard Curves and Quantification of Target DNA and
PCR Efficiency ............................................................................... 102
3.8.6 Multiplex Real-time PCR Sensitivity and Validity ............................. 103
4.1 Quality and Quantity of Extracted DNA ............................................................. 104
4.2 Development of Biomarker ................................................................................. 105
4.2.1 In-silico Analysis of Biomarkers using Bioinformatics Tools ............ 105
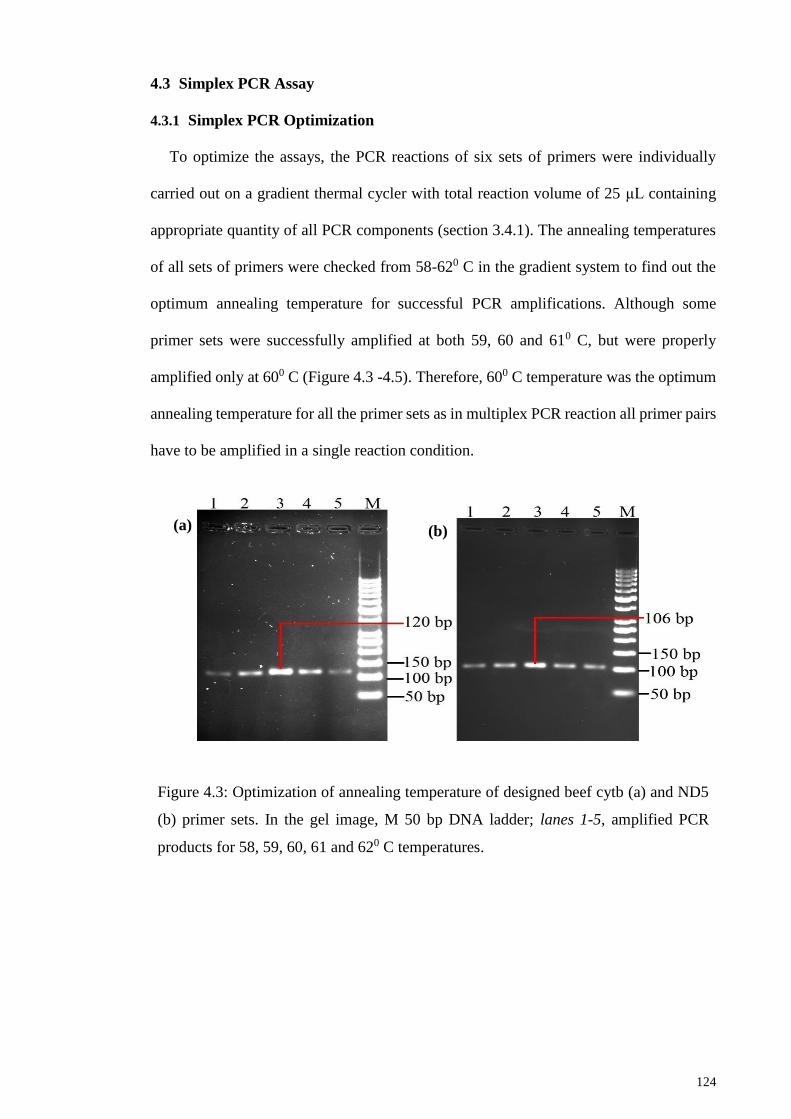
4.3 Simplex PCR Assay ............................................................................................. 124
4.3.1 Simplex PCR Optimization ................................................................. 124
4.3.2 Simplex PCR Assay Specificity .......................................................... 125
4.3.3 PCR product sequencing ..................................................................... 130
4.4 Tetraplex PCR Assay ........................................................................................... 131
4.4.1 Optimization of Tetraplex PCR Assay ................................................ 131
4.4.2 Tetraplex PCR Assay Specificity ........................................................ 132
4.4.3 Limit of detection (LOD) of Tetraplex PCR Assay under Raw State . 133
4.4.4 Sensitivity test of Tetraplex PCR Assay ............................................. 136
Page 13
xii
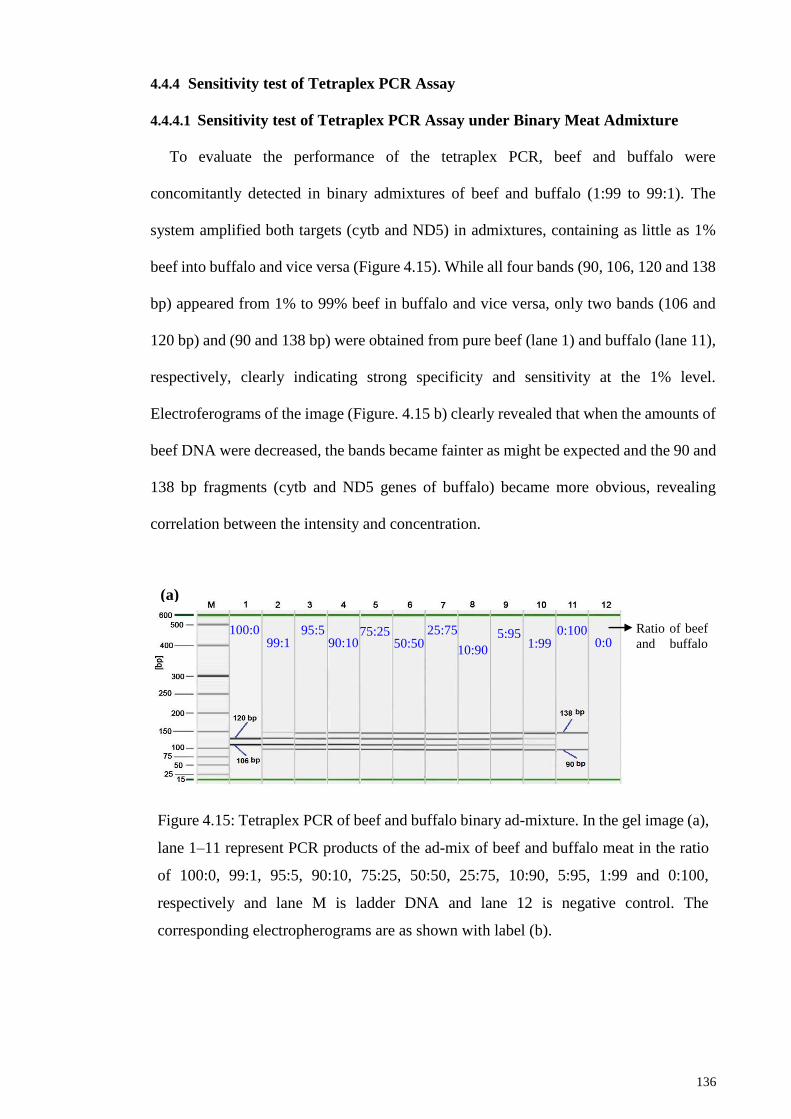
4.4.4.1 Sensitivity test of Tetraplex PCR Assay under Binary
Meat Admixture ................................................................ 136
4.4.4.2 Sensitivity Test of Tetraplex PCR Assay under
Commercial Product (Burger and Meat Curry) ................ 138
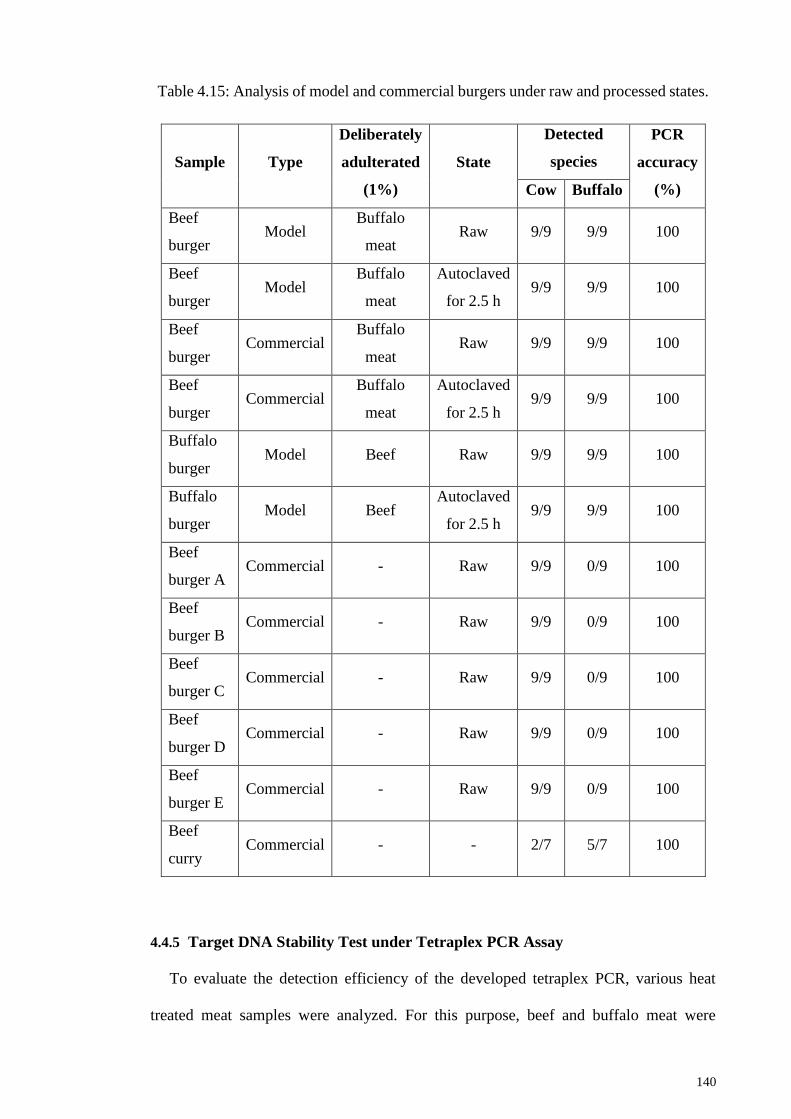
4.4.5 Target DNA Stability Test under Tetraplex PCR Assay..................... 140
4.5 Multiplex (Hexaplex) PCR (mPCR) Assay ......................................................... 141
4.5.1 Optimization of Multiplex (Hexaplex) PCR (mPCR) Assay .............. 141
4.5.2 Multiplex PCR Assay Specificity ....................................................... 143
4.5.3 Limit of Detection (LOD) of Multiplex PCR Assay under Raw State145
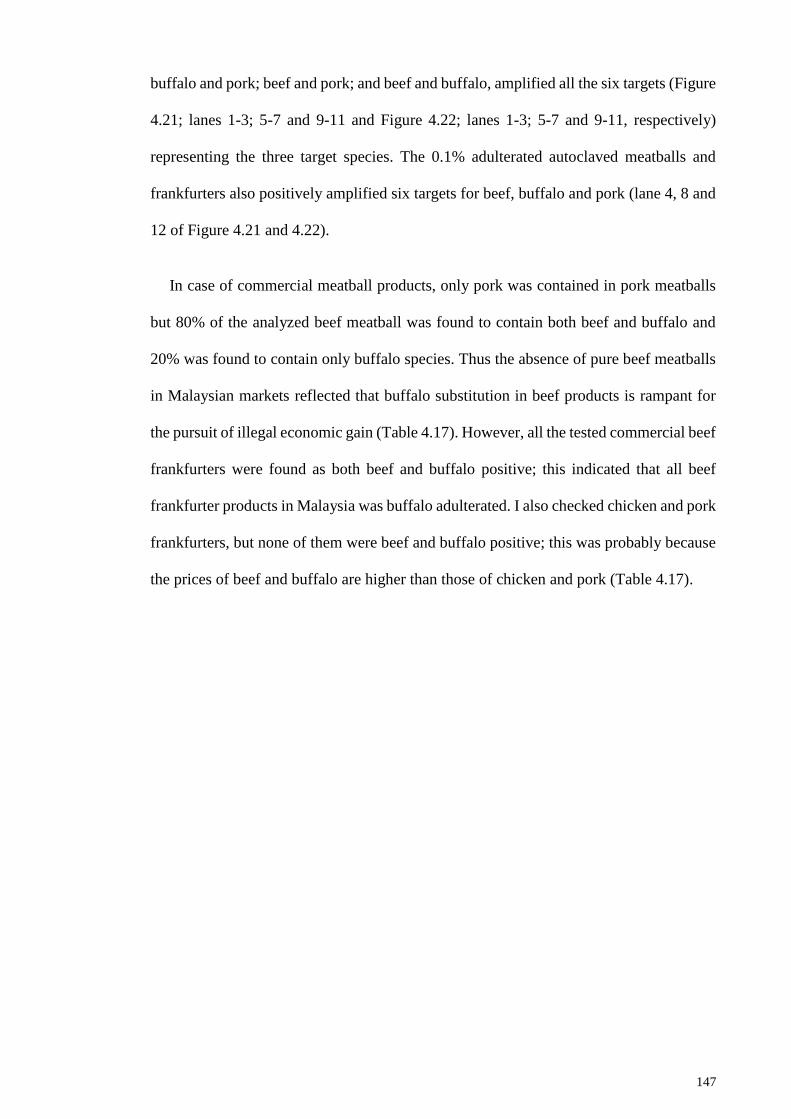
4.5.4 Sensitivity test of Multiplex PCR Assay under Commercial Meat
Products (Meatballs and Frankfurters) ............................................ 146
4.5.5 Target DNA Stability Test under Multiplex PCR Assay .................... 152
4.6 PCR Products Authentication by RFLP Analysis................................................ 154
4.6.1 RFLP Analysis of Beef and Buffalo PCR Products ............................ 154
4.6.1.1 Authentication of Beef and Buffalo PCR Products of raw
meat by RFLP Analysis .................................................... 154
4.6.1.2 Authentication of Tetraplex PCR Products of frankfurters
by RFLP Analysis ............................................................. 156
4.6.2 Authentication of Pork PCR Products of Raw Meat and Frankfurter
by RFLP Analysis ........................................................................... 157
4.7 Real-time PCR Assay .......................................................................................... 159
4.7.1 Multiplex Real-time PCR System ....................................................... 159
4.7.2 Specificity of the Multiplex Real-time PCR System .......................... 160
4.7.3 Limit of Detection (LOD) ................................................................... 162
4.7.4 Quantification and Efficiency of the Tetraplex Quantitative PCR
System ............................................................................................. 163
4.7.5 Sensitivity and Validity of the Tetraplex qPCR Assay under Ternary
and Commercial Matrixes ............................................................... 167
4.7.5.1 Residual Analysis ............................................................. 173
4.7.6 Analysis of Commercial Meat Products by mqPCR ........................... 174
5.1 DNA Extraction ................................................................................................... 176
5.2 Development of Biomarker ................................................................................. 177
5.3 PCR Assay Optimization ..................................................................................... 180
Page 14
xiii
5.4 PCR Assay Specificity ......................................................................................... 182
5.5 PCR product sequence analysis ........................................................................... 183
5.6 Tetraplex PCR Assay ........................................................................................... 184
5.6.1 LOD of Tetraplex PCR Assay ............................................................. 184
5.6.2 Sensitivity test of Tetraplex PCR Assay under Binary Meat
Admixture ....................................................................................... 185
5.6.3 Stability of Tetraplex PCR Assay ....................................................... 186
5.7 Multiplex PCR Assay .......................................................................................... 187
5.7.1 Limit of Detection of Multiplex PCR Assay ....................................... 187
5.7.2 Sensitivity and Stability Test of Multiplex PCR Assay ...................... 188
5.7.3 Commercial Product Analysis under mPCR Assay ............................ 190
5.8 Authentication of PCR products by RFLP Analysis ........................................... 191
5.9 Real-time PCR Assay .......................................................................................... 194
5.9.1 Multiplex Real-time PCR System ....................................................... 194
5.9.2 Specificity of the Multiplex Real-time PCR System .......................... 195
5.9.3 Limit of Detection and Efficiency of the Multiplex Quantitative PCR
System ............................................................................................. 196
5.9.4 Sensitivity and Validity of the tetraplex qPCR Assay under Ternary
and Commercial Matrices ............................................................... 198
5.9.4.1 Residual Analysis ............................................................. 199
5.9.5 Analysis of Commercial Meat Products by mqPCR ........................... 199
6.1 Conclusion ........................................................................................................... 201
6.2 Recommendation for Future Work ...................................................................... 207
6.3 Limitation of this study ...................................................................................... 208
LIST OF PUBLICATIONS .......................................................................................... 237
Page 15
xiv
LIST OF FIGURES
Figure 2.1: Consumption of meat (beef and veal, pork, lamb and poultry) by different
countries in 2015 as projected by OECD. ....................................................................... 26
Figure 2.2: List of top meat (beef and veal, pork, sheep and poultry) consuming countries
in 2015 (Kg per capita, per year)..................................................................................... 27
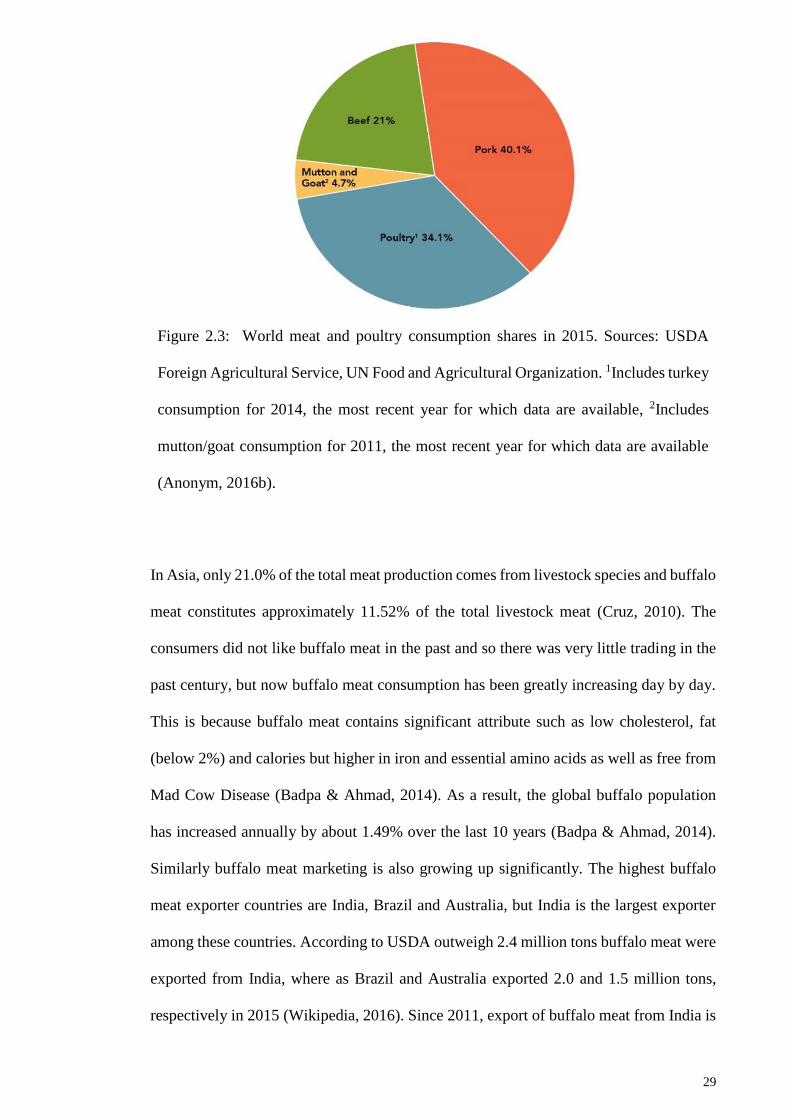
Figure 2.3: World meat and poultry consumption shares in 2015. Sources: USDA Foreign
Agricultural Service, UN Food and Agricultural Organization. ..................................... 29
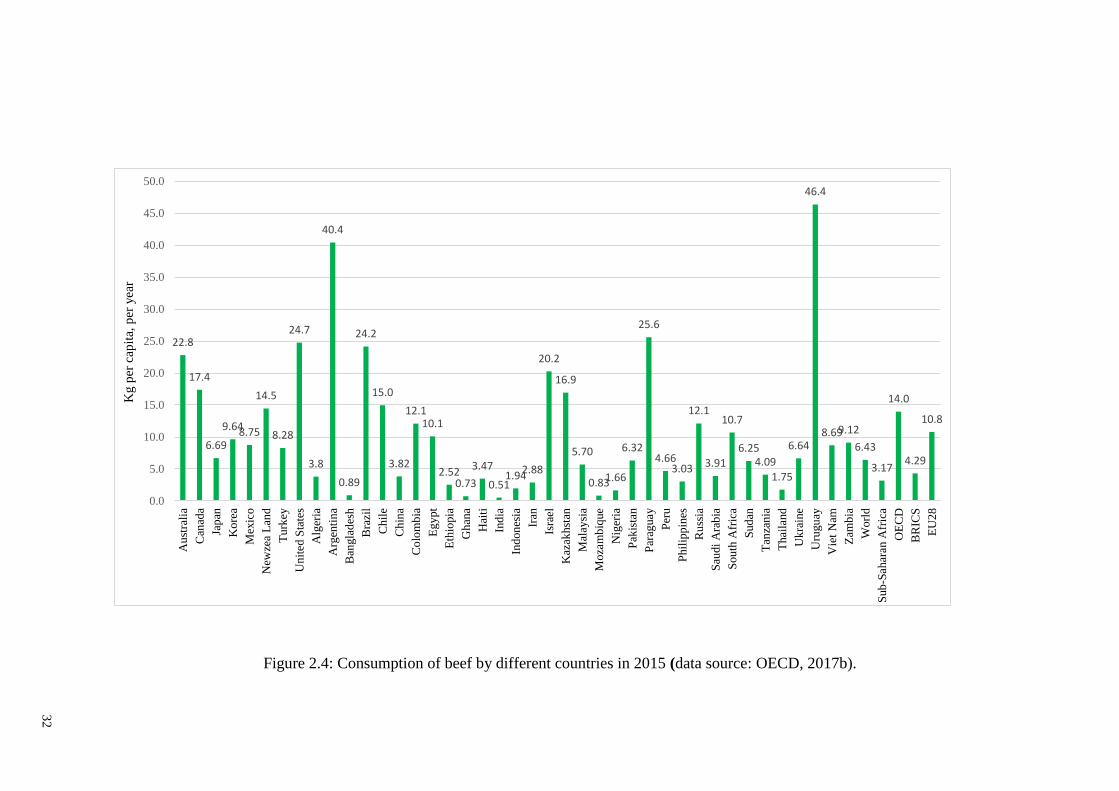
Figure 2.4: Consumption of beef by different countries in 2015 .................................... 32
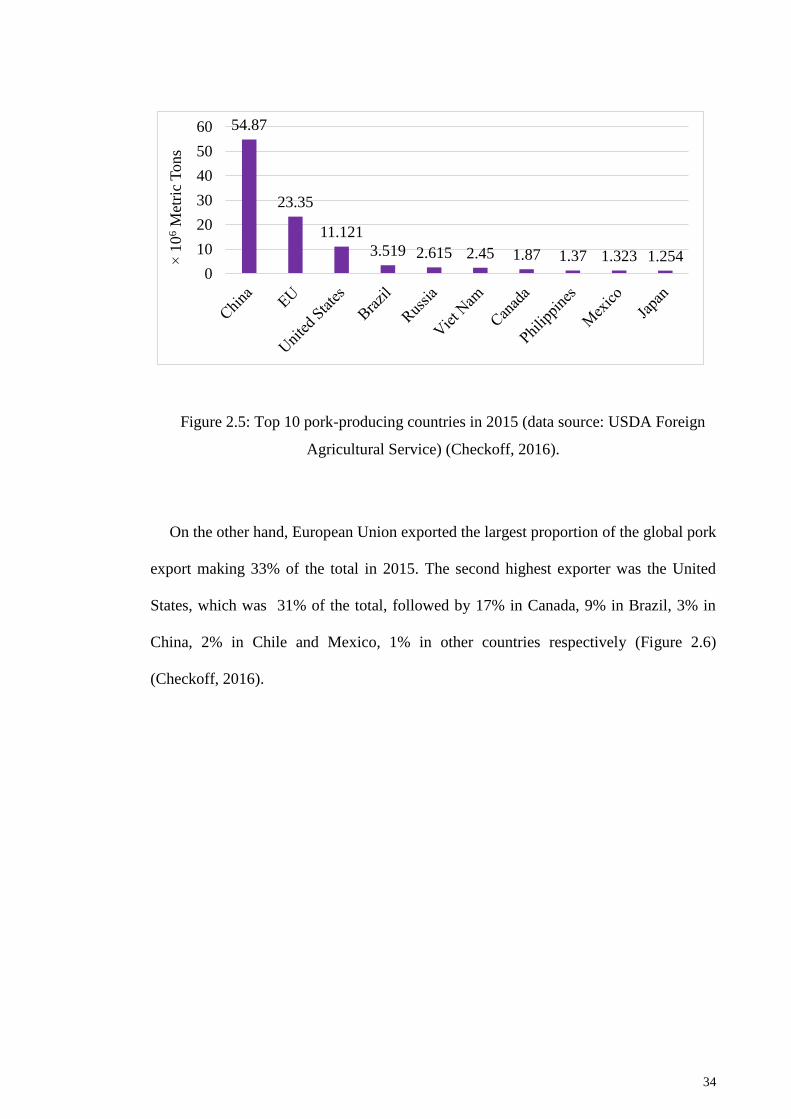
Figure 2.5: Top 10 pork-producing countries in 2015 .................................................... 34
Figure 2.6: Global pork export in 2015 .......................................................................... 35
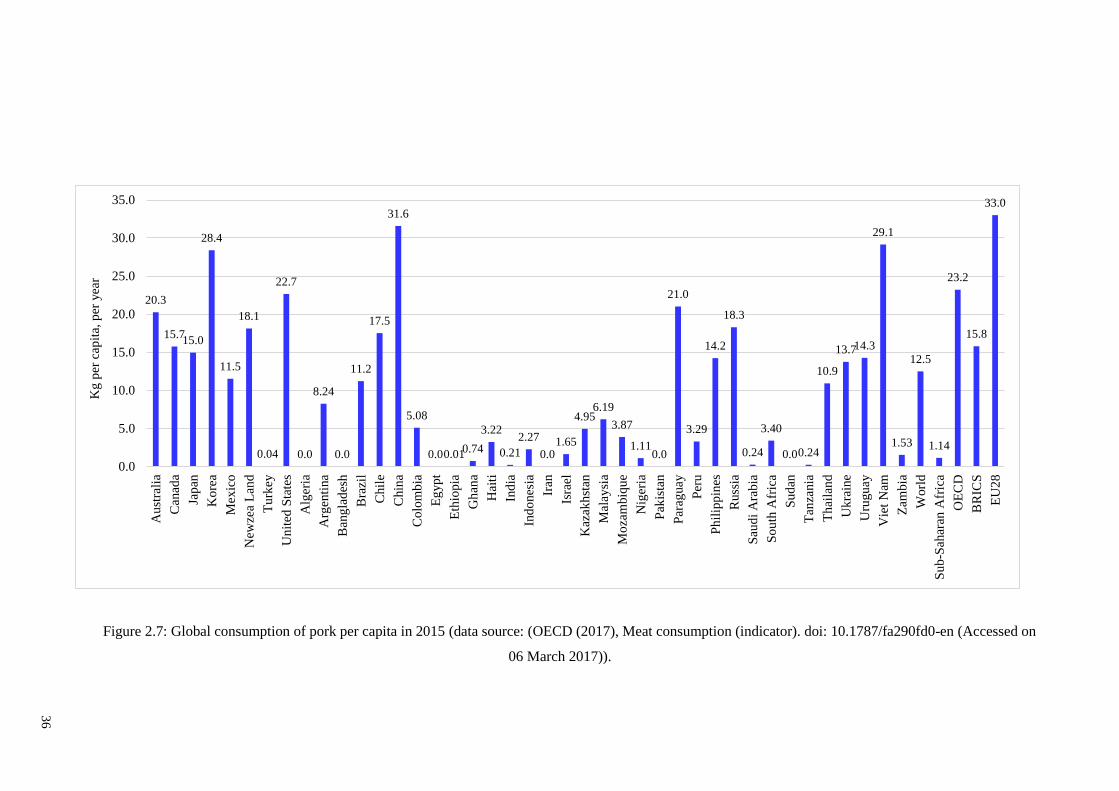
Figure 2.7: Global consumption of pork per capita in 2015 ……………………………36
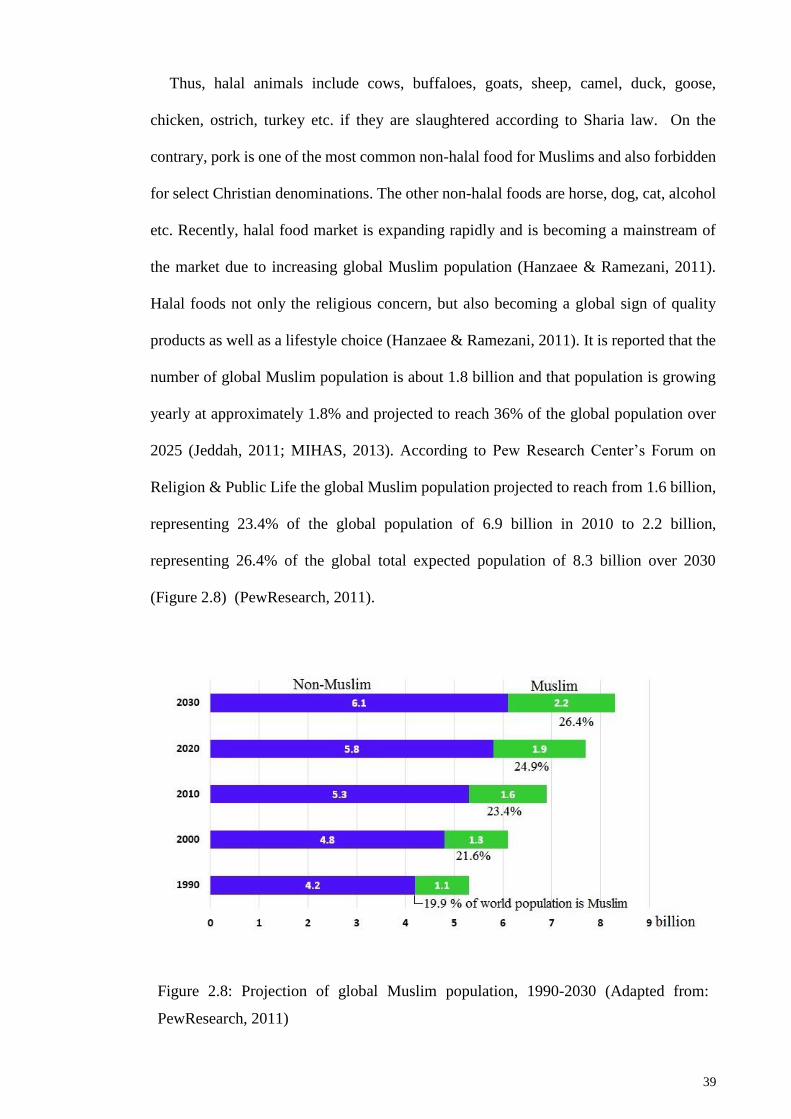
Figure 2.8: Projection of global Muslim population, 1990-2030 .................................... 39
Figure 2.9: Cattle zoonotic bacterial pathogens .............................................................. 44
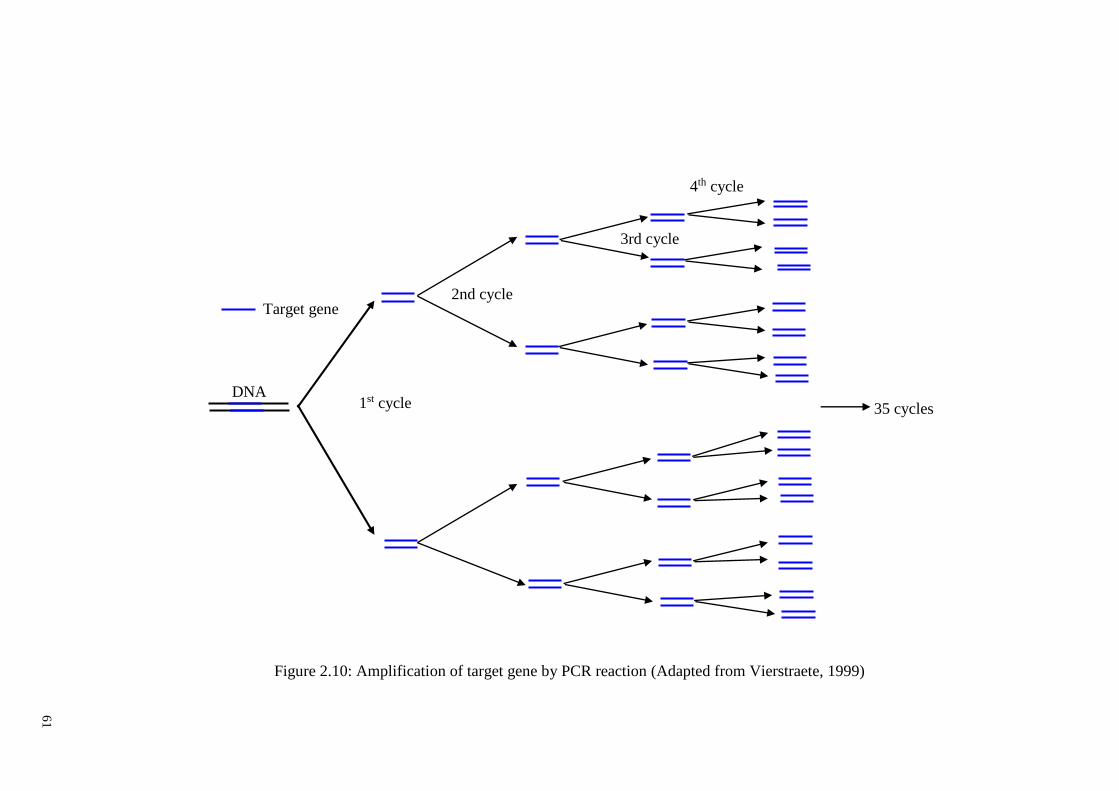
Figure 2.10: Amplification of target gene by PCR reaction ........................................... 61
Figure 3.1: Primer-Primer interactions............................................................................ 82
Figure 4.1: Phylogenetic tree generated from the amplicon sequences of each target gene
and same gene sequences of other 28 non-target animal, aquatic and plant species using
the neighbourhood-joining method. .............................................................................. 118
Figure 4.2: 3D plot showing mismatch and pairwise distance between targets and non-
targets species.. .............................................................................................................. 121
Figure 4.3: Optimization of annealing temperature of designed beef cytb (a) and ND5 (b)
primer sets.. ................................................................................................................... 124
Figure 4.4: Optimization of annealing temperature of designed buffalo cytb (a) and ND5
(b) primer sets................................................................................................................ 125
Figure 4.5: Optimization of annealing temperature of designed pork cytb (a) and ND5 (b)
primer sets. .................................................................................................................... 125
Figure 4.6: The specificity of the simplex PCR of beef cytb (120 bp)-specific primer pair
with DNA of different species. . .................................................................................. 127
Page 16
xv
Figure 4.7: The specificity of the simplex PCR of beef ND5 (106 bp)-specific primer pair
with DNA of different species… .................................................................................. 127
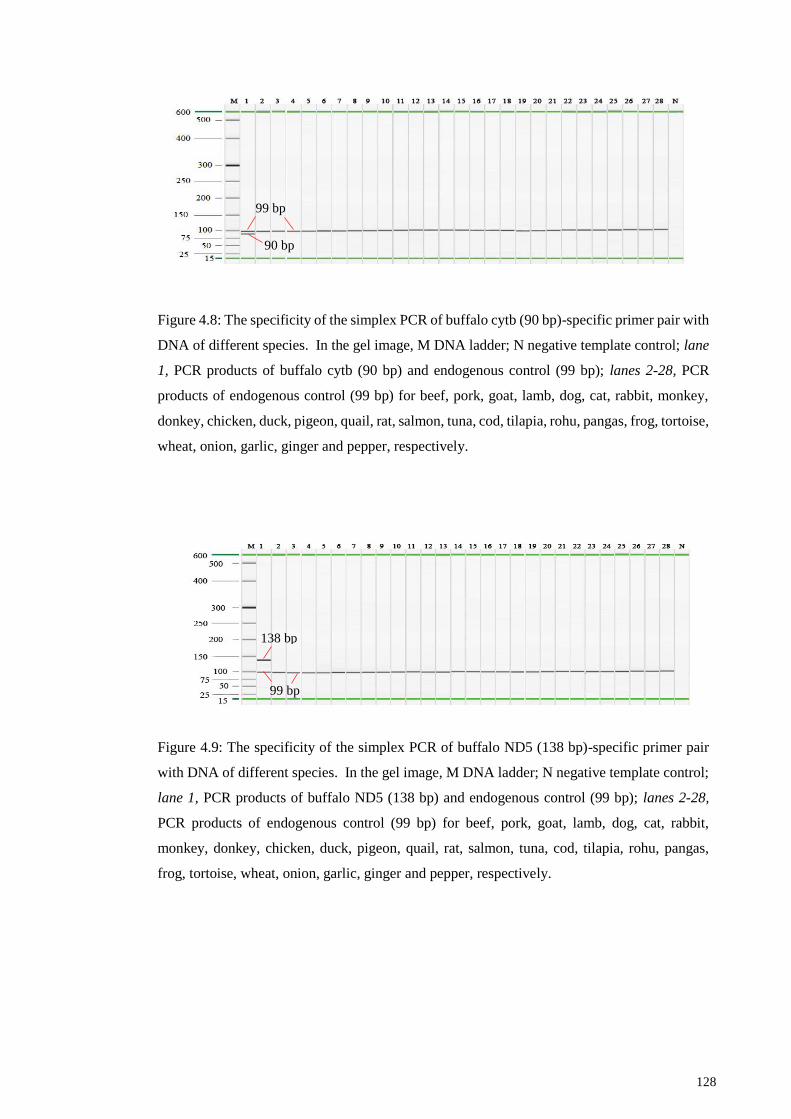
Figure 4.8: The specificity of the simplex PCR of buffalo cytb (90 bp)-specific primer
pair with DNA of different species. .............................................................................. 128
Figure 4.9: The specificity of the simplex PCR of buffalo ND5 (138 bp)-specific primer
pair with DNA of different species. .............................................................................. 128
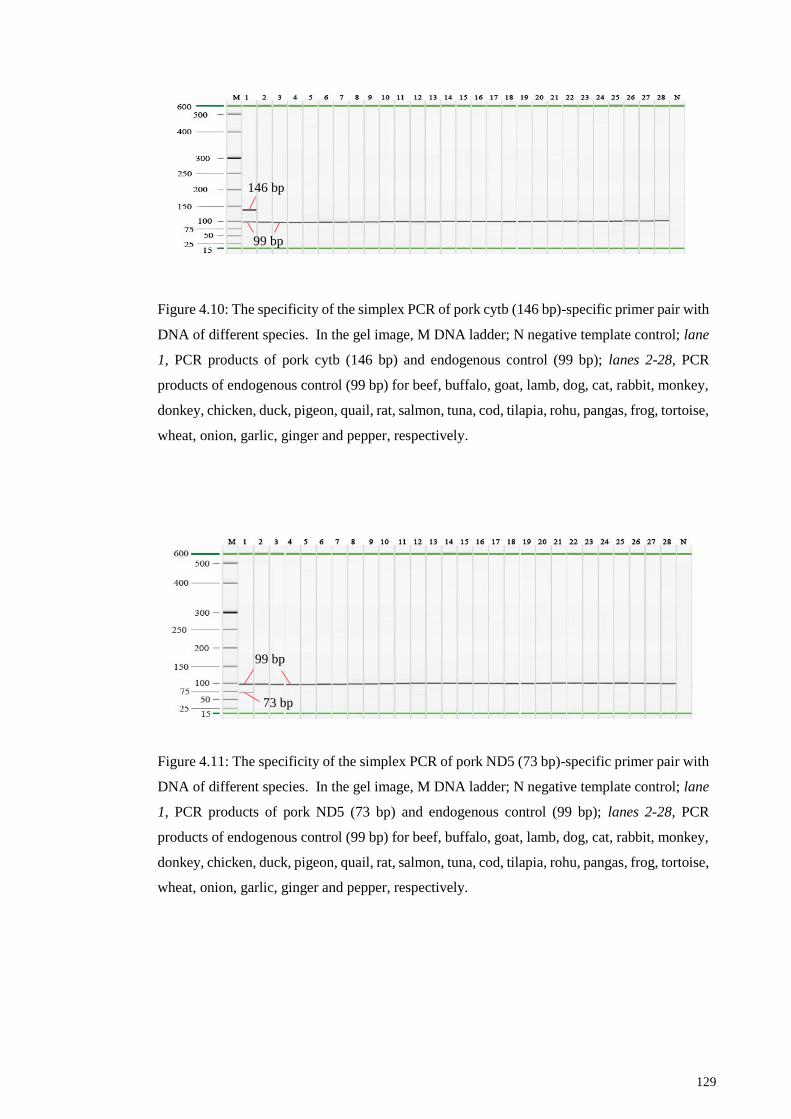
Figure 4.10: The specificity of the simplex PCR of pork cytb (146 bp)-specific primer
pair with DNA of different species. .............................................................................. 129
Figure 4.11: The specificity of the simplex PCR of pork ND5 (73 bp)-specific primer pair
with DNA of different species. ..................................................................................... 129
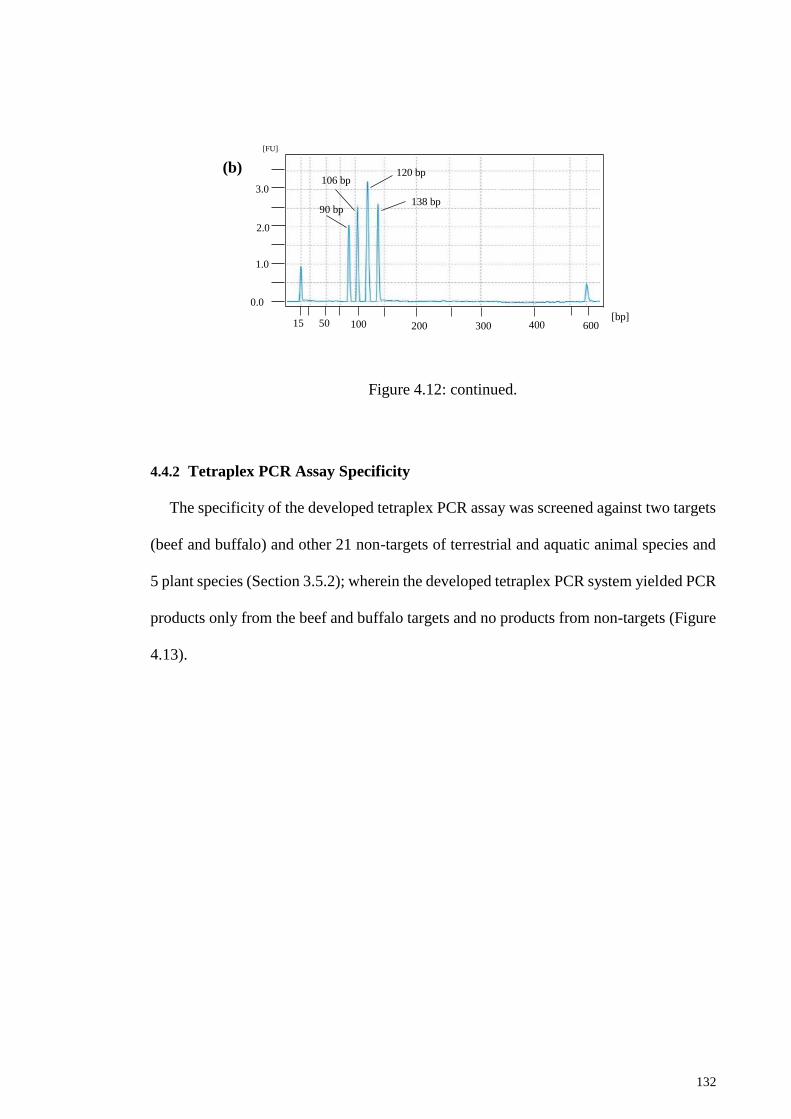
Figure 4.12: The gel image (a) and electroferogram (b) of double gene-site targeted
tetraplex PCR for beef and buffalo authentication. ....................................................... 131
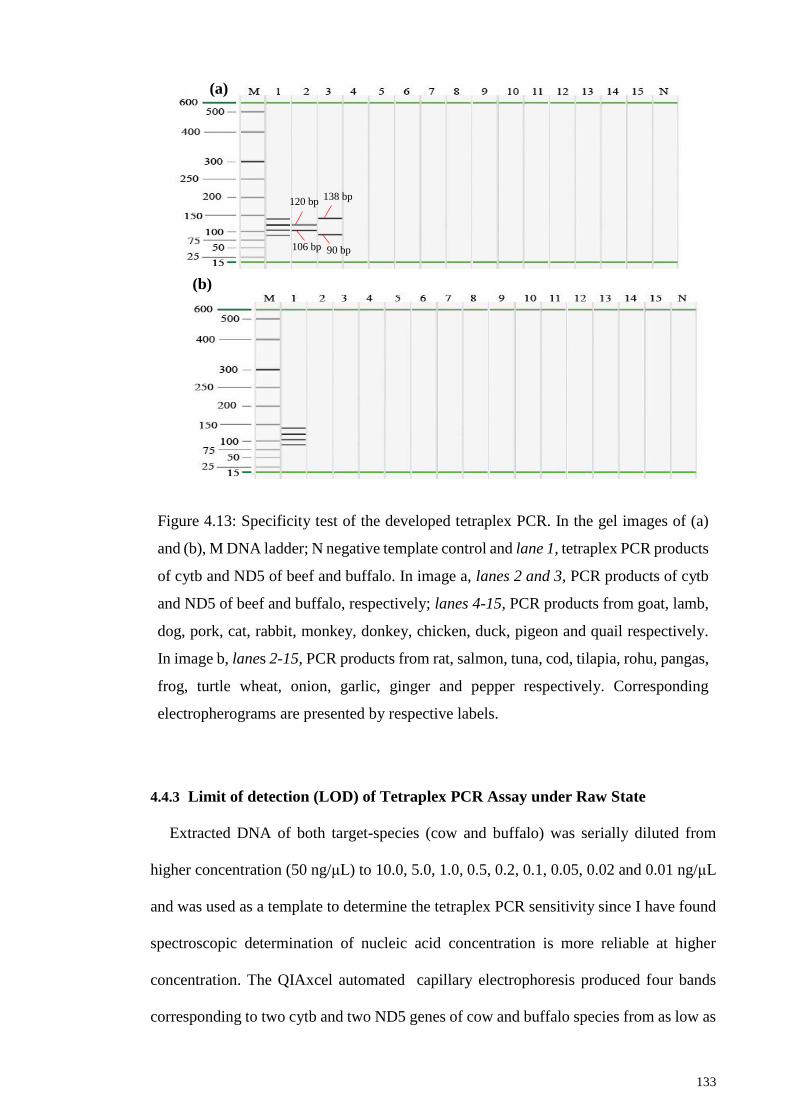
Figure 4.13: Specificity test of the developed tetraplex PCR. ...................................... 133
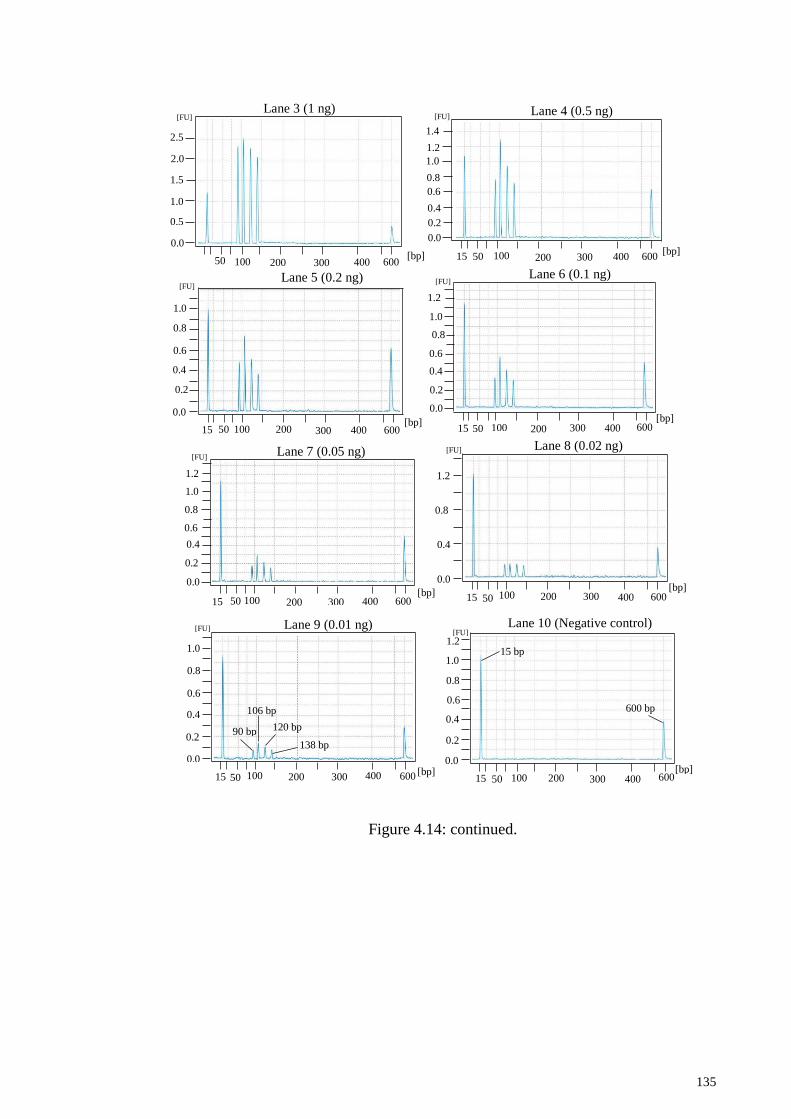
Figure 4.14: Sensitivity analysis of tetraplex PCR system. .......................................... 134
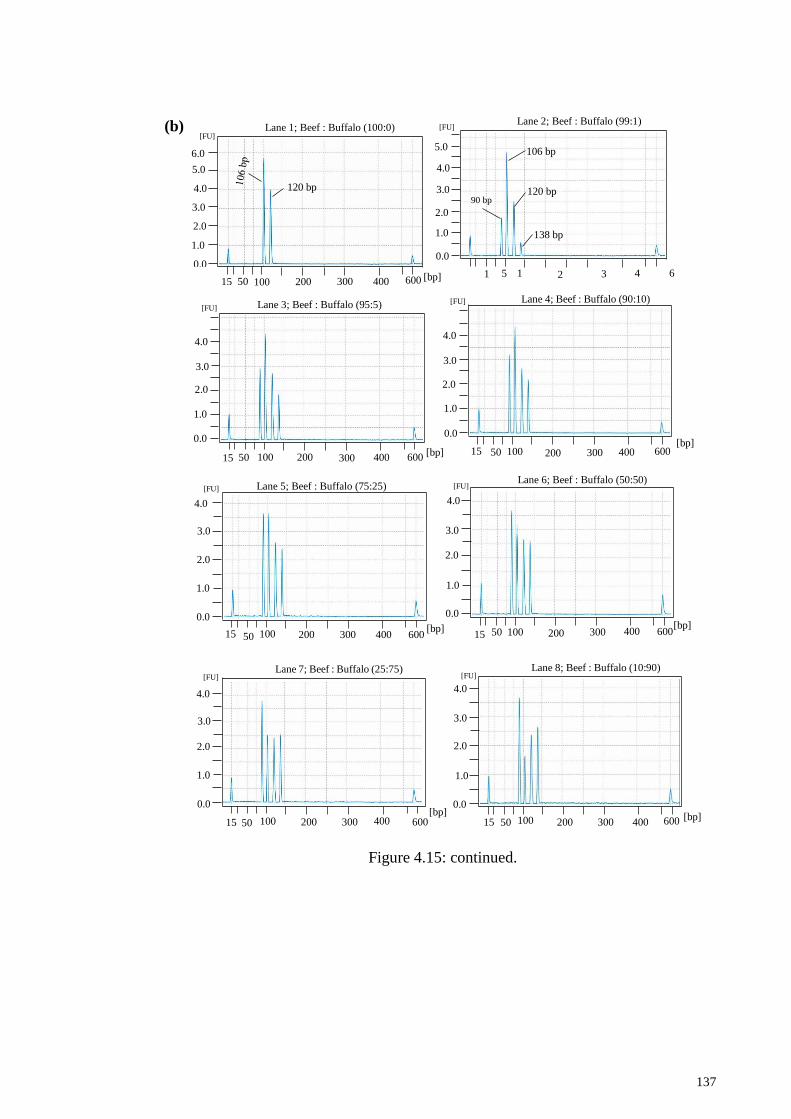
Figure 4.15: Tetraplex PCR of beef and buffalo binary ad-mixture. ............................ 136
Figure 4.16: The gel image (left) and electropherograms (right-insets) of tetraplex PCR
for beef (lanes 1, 2, 4, 5, 7 & 8) and buffalo (lanes 3, 6 & 9)....................................... 139
Figure 4.17: Stability test of tetratiplex PCR of DNA extracted from beef and buffalo
meat (lanes 1 - 5) under boiling (lane 1), autoclaving (lane 2) and microwave (lanes 3 –
5 at 500, 600 & 700 W respectively for 30 min) cooking treatments. .......................... 141
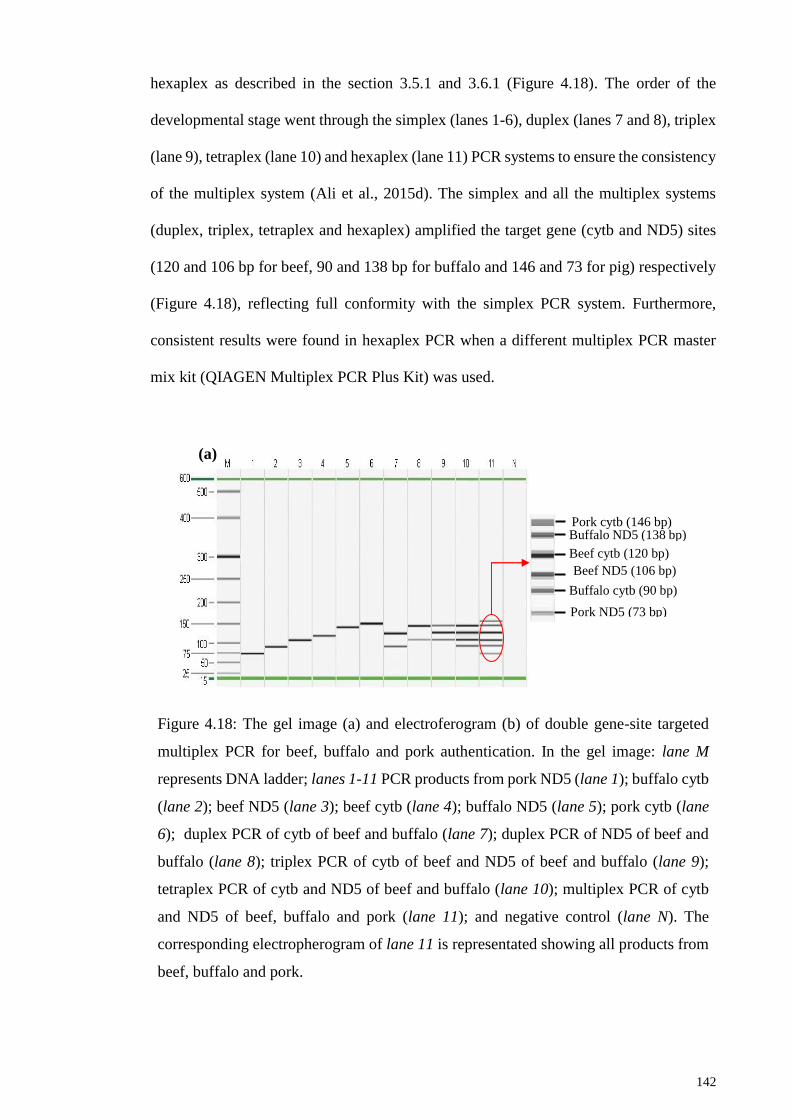
Figure 4.18: The gel image (a) and electroferogram (b) of double gene-site targeted
multiplex PCR for beef, buffalo and pork authentication. ............................................ 142
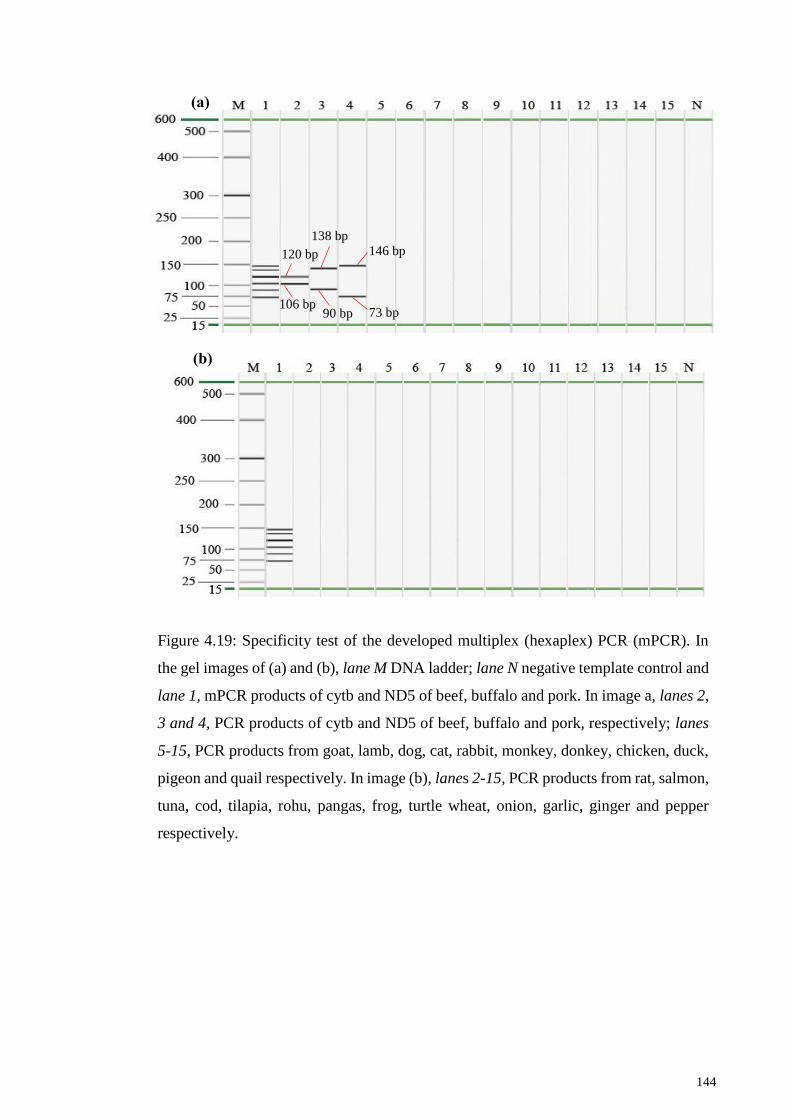
Figure 4.19: Specificity test of the developed multiplex (hexaplex) PCR (mPCR). .... 144
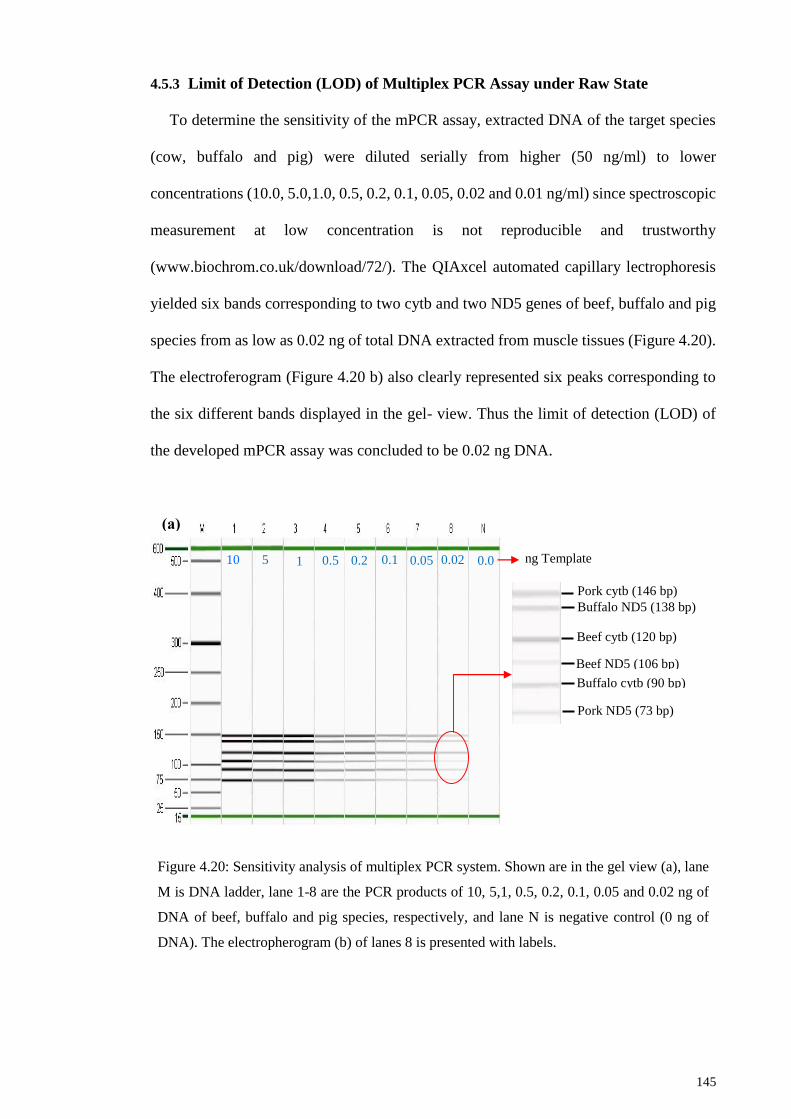
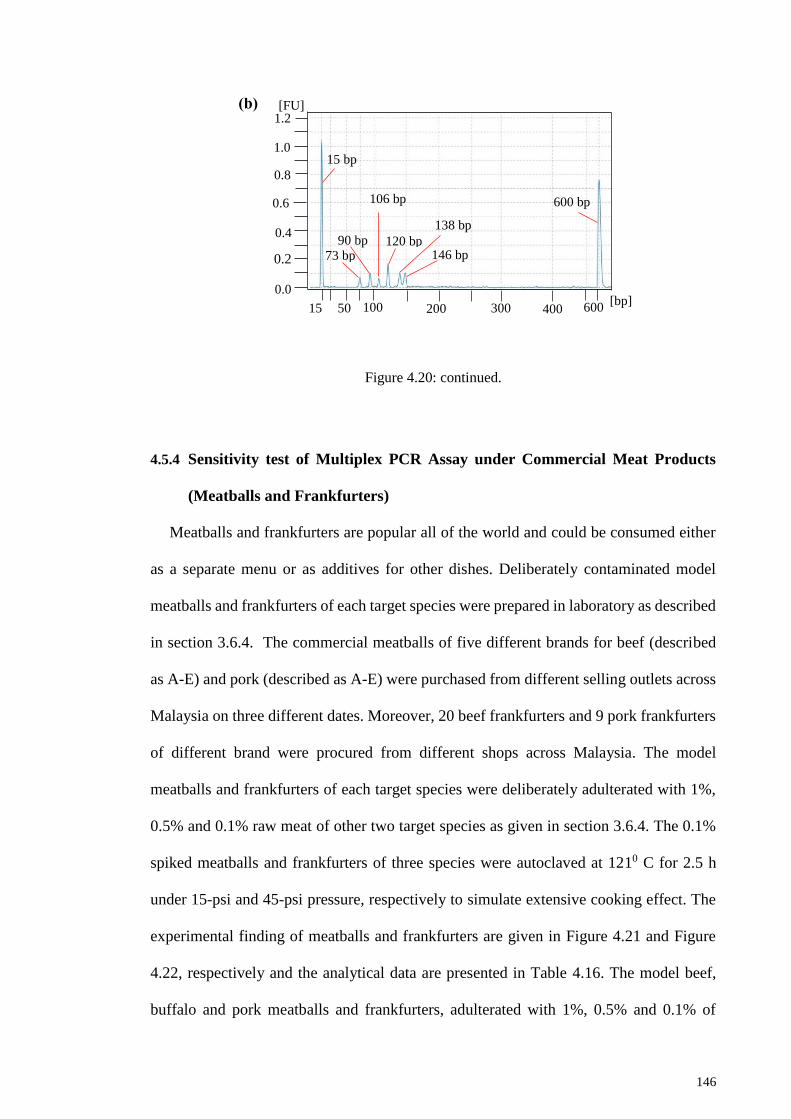
Figure 4.20: Sensitivity analysis of multiplex PCR system.. ........................................ 145
Figure 4.21: The gel image (a) and electropherograms (b-d) of multiplex PCR (mPCR)
for the detection of double gene-targeting cow, buffalo and pig in deliberately adulterated
model beef, buffalo and pork meatball under raw and processed states.. ..................... 148
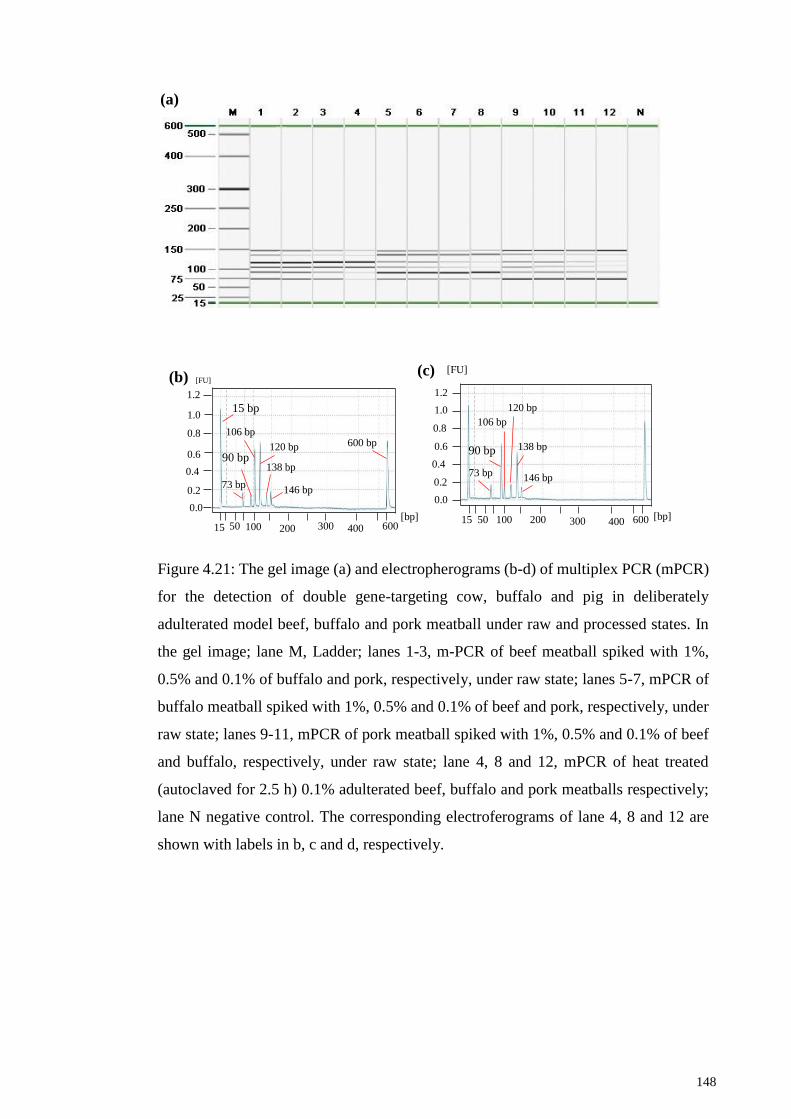
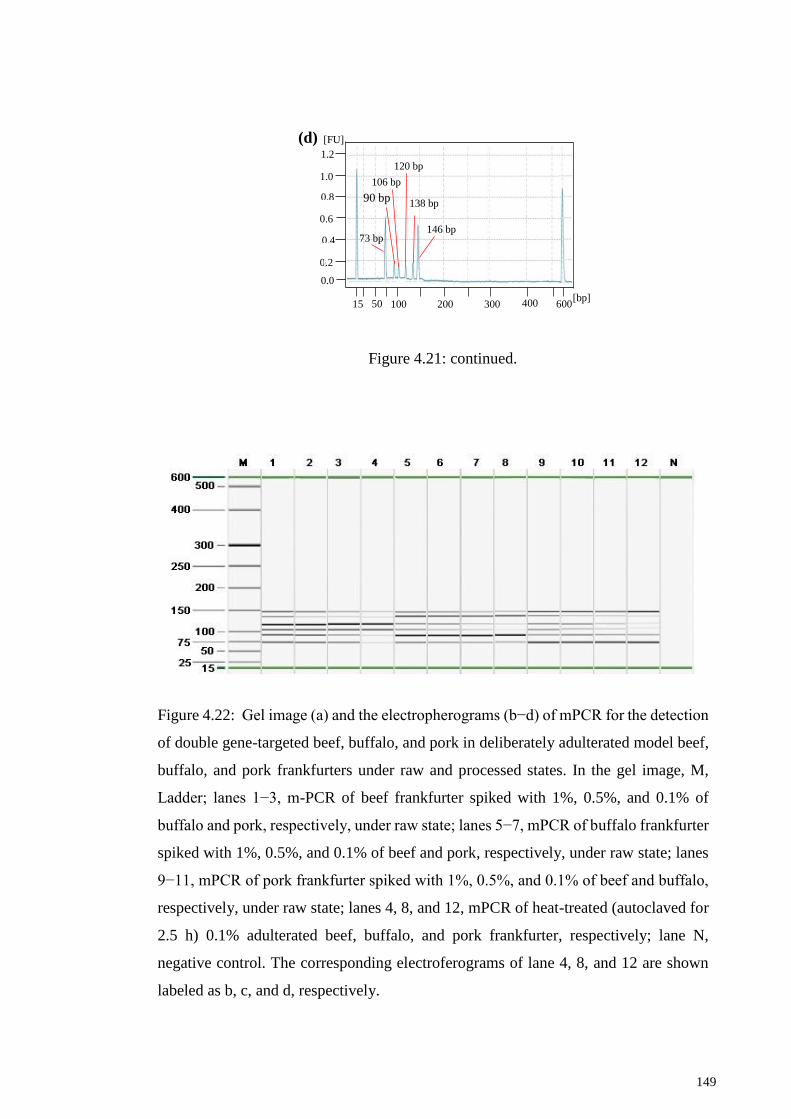
Figure 4.22: Gel image (a) and the electropherograms (b−d) of mPCR for the detection
of double gene-targeted beef, buffalo, and pork in deliberately adulterated model beef,
buffalo, and pork frankfurters under raw and processed states. .................................... 149
Page 17
xvi
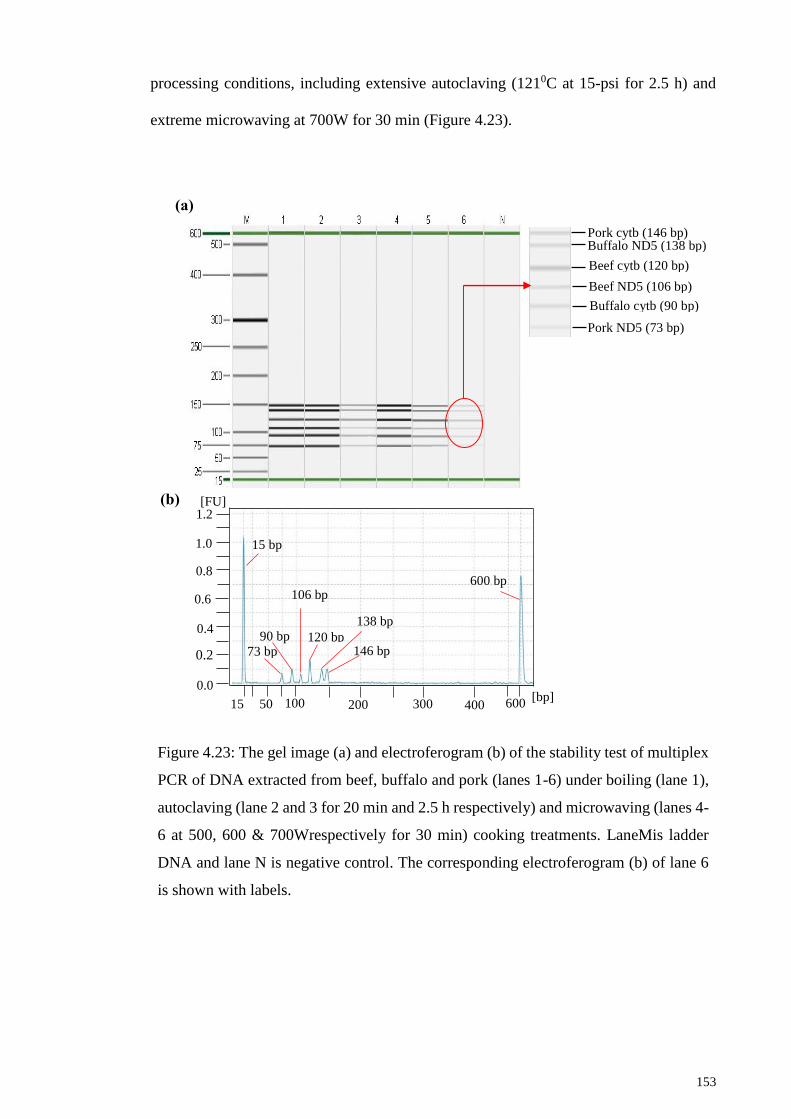
Figure 4.23: The gel image (a) and electroferogram (b) of the stability test of multiplex
PCR of DNA extracted from beef, buffalo and pork (lanes 1-6) under boiling (lane 1),
autoclaving (lane 2 and 3 for 20 min and 2.5 h respectively) and microwaving (lanes 4-6
at 500, 600 & 700Wrespectively for 30 min) cooking treatments.. .............................. 153
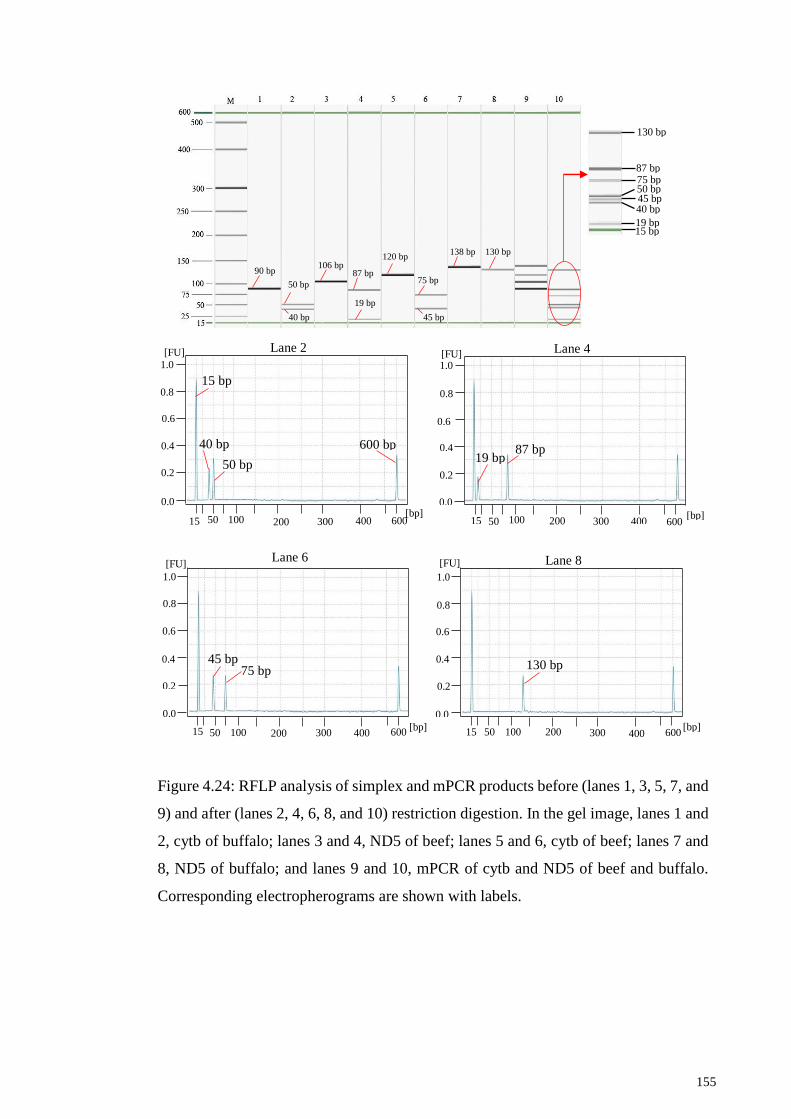
Figure 4.24: RFLP analysis of simplex and mPCR products before (lanes 1, 3, 5, 7, and
9) and after (lanes 2, 4, 6, 8, and 10) restriction digestion. ........................................... 155
Figure 4.25: PCR-RFLP analysis of mPCR products of deliberately adulterated raw and
heat-treated (boiled and autoclaved) beef (lanes 1−6) and buffalo (lanes 7−12)
frankfurters.. .................................................................................................................. 157
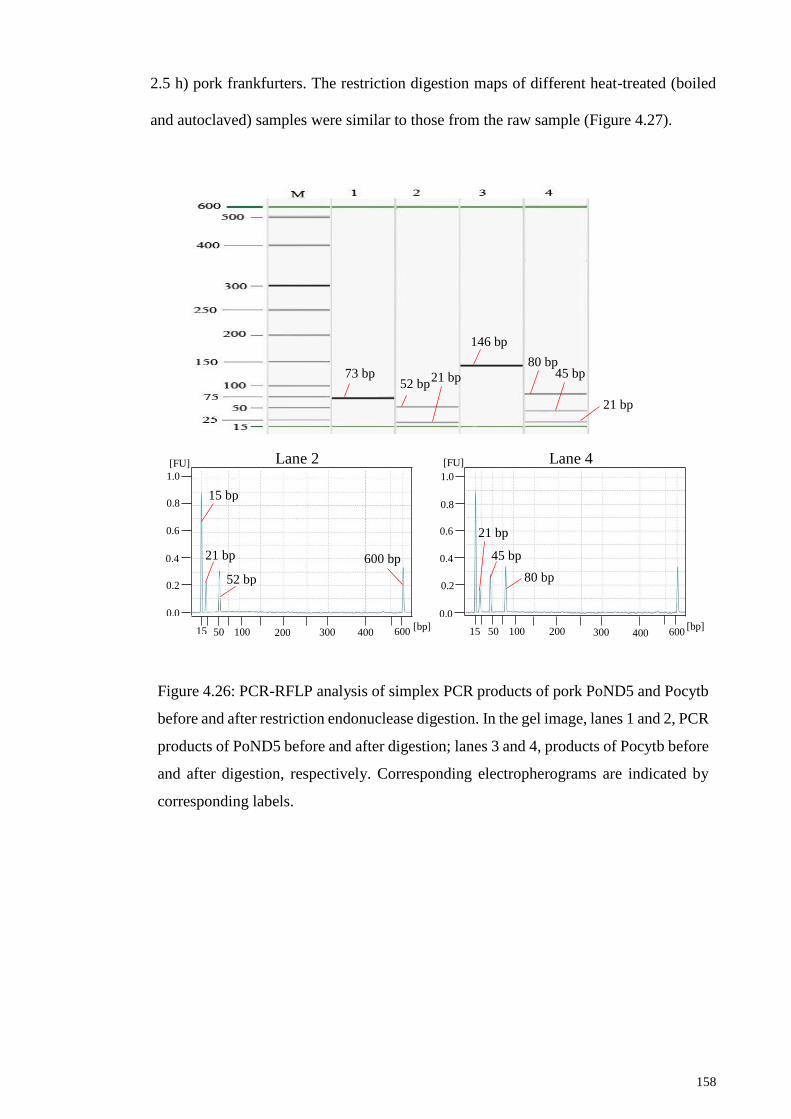
Figure 4.26: PCR-RFLP analysis of simplex PCR products of pork PoND5 and Pocytb
before and after restriction endonuclease digestion. ..................................................... 158
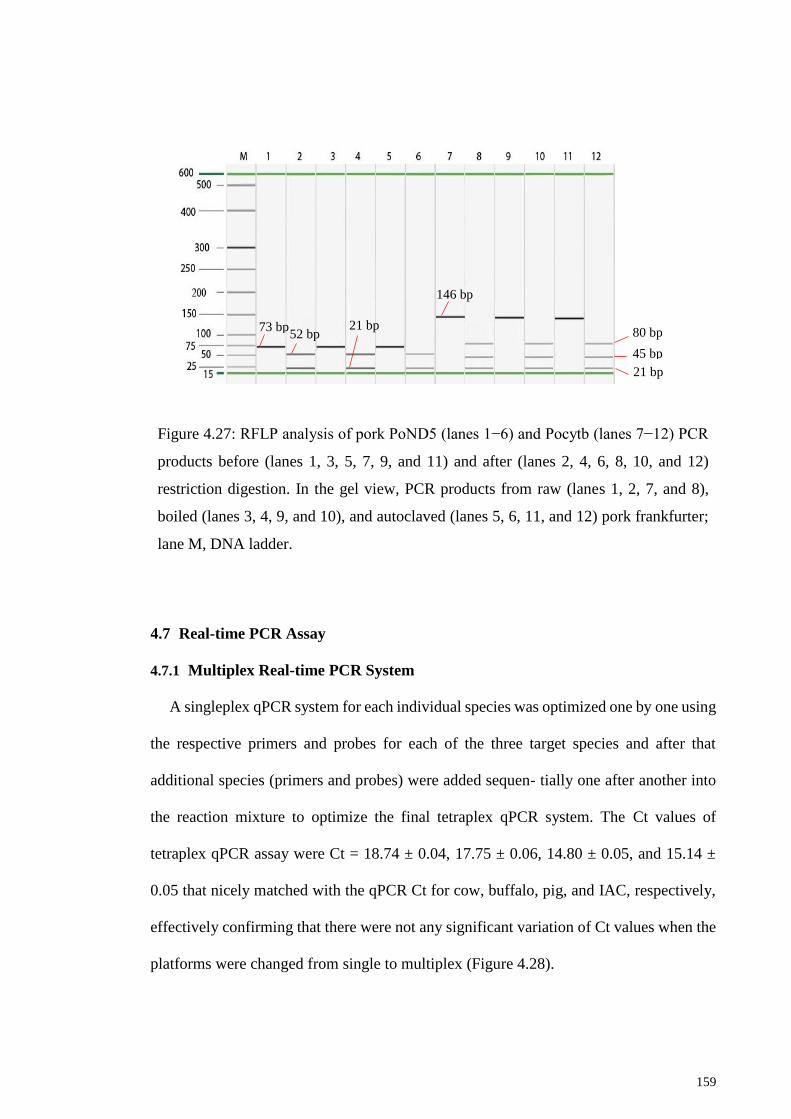
Figure 4.27: RFLP analysis of pork PoND5 (lanes 1−6) and Pocytb (lanes 7−12) PCR
products before (lanes 1, 3, 5, 7, 9, and 11) and after (lanes 2, 4, 6, 8, 10, and 12) restriction
digestion. ....................................................................................................................... 159
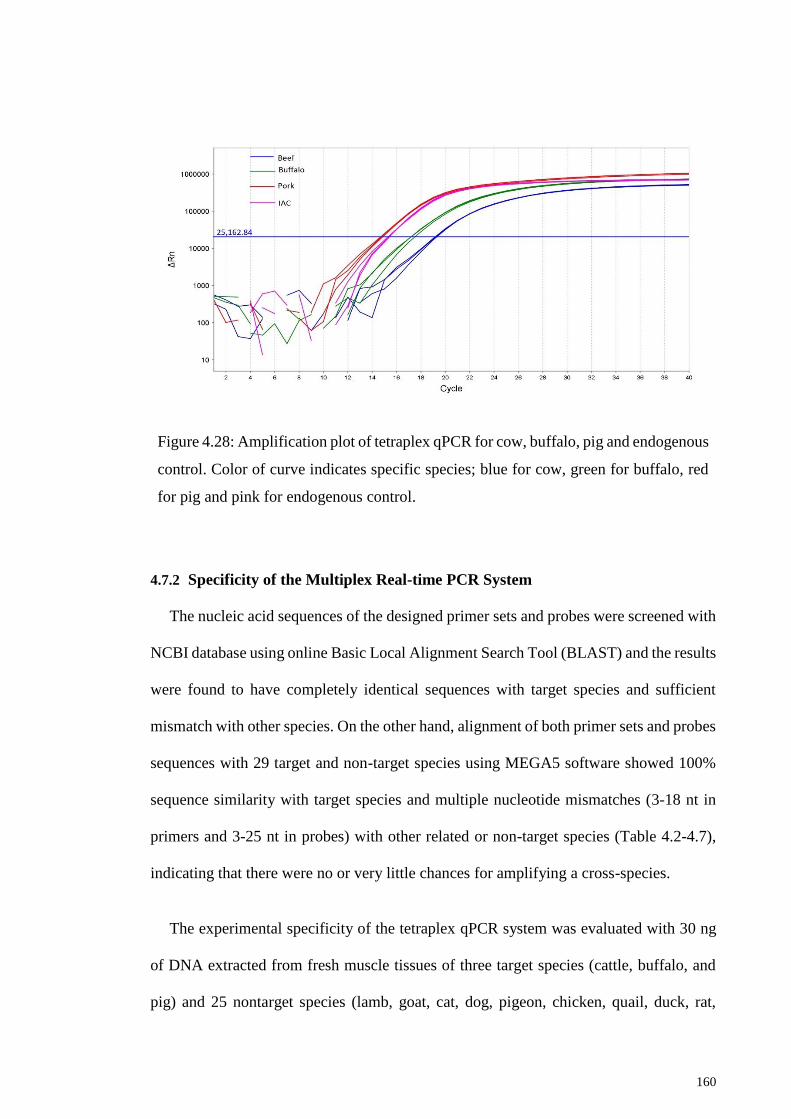
Figure 4.28: Amplification plot of tetraplex qPCR for cow, buffalo, pig and endogenous
control............................................................................................................................ 160
Figure 4.29: Multiplex qPCR amplification plot for porcine (red), cattle (blue), and
buffalo (green) species along with the endogenous control for eukaryotes (sky blue)
against 25 species (below the threshold cycle). ............................................................ 161
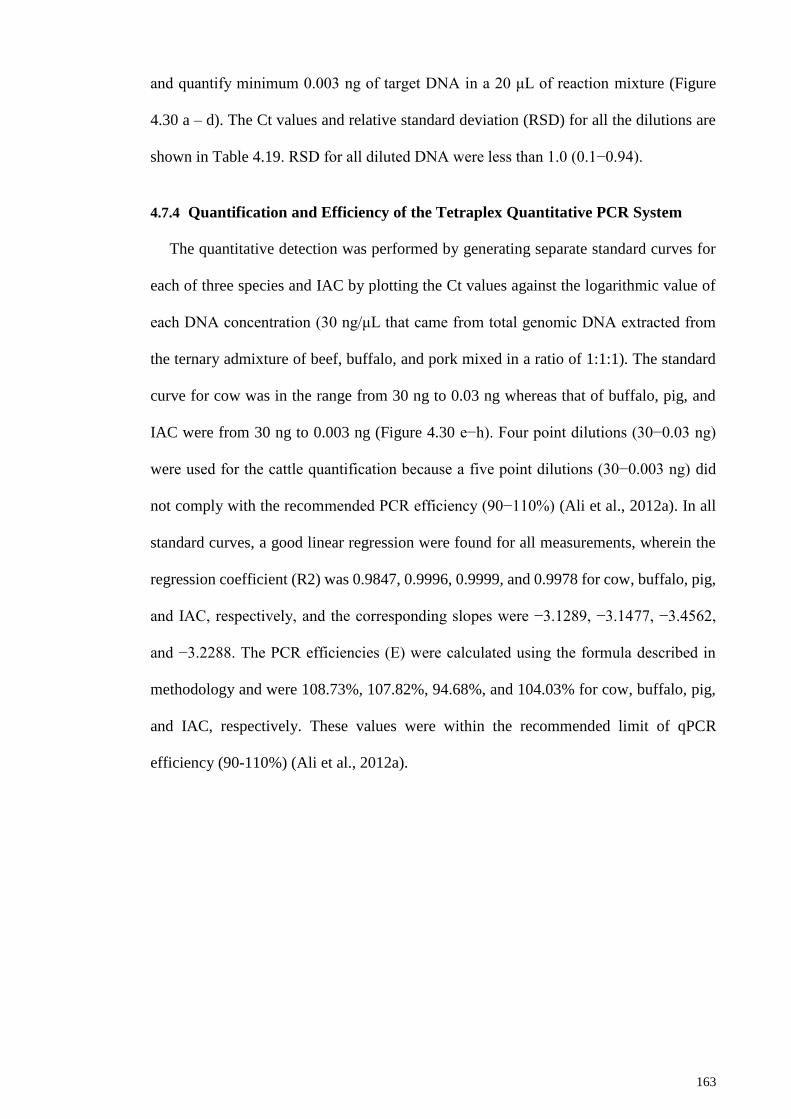
Figure 4.30: Amplification plots (a−d) and standard curves (e−h) of tetraplex qPCR
products obtained from 10-fold serially diluted mixed DNA of three target species. .. 164
Figure 4.31: Relationship between the experimental and reference values of the tetraplex
qPCR system. ................................................................................................................ 168
Figure 4.32: Graph of residual verses fitted recovery values of the tetraplex qPCR assays
the variablely adulterated (0.1, 1 and 10%) frankfurters and meatballs of beef (a and b),
buffalo (c and d) and pork (e and f), respectively. ........................................................ 173
Page 18
xvii
LIST OF TABLES
Table 2.1: Top five livestock production in 2000 and 2013 (data source: FAO, 2015) . 30
Table 2.2: List of zoonosis (GOV.UK, 2013) ................................................................. 46
Table 3.1: Name and sequence of primers and probes used in this study. ...................... 85
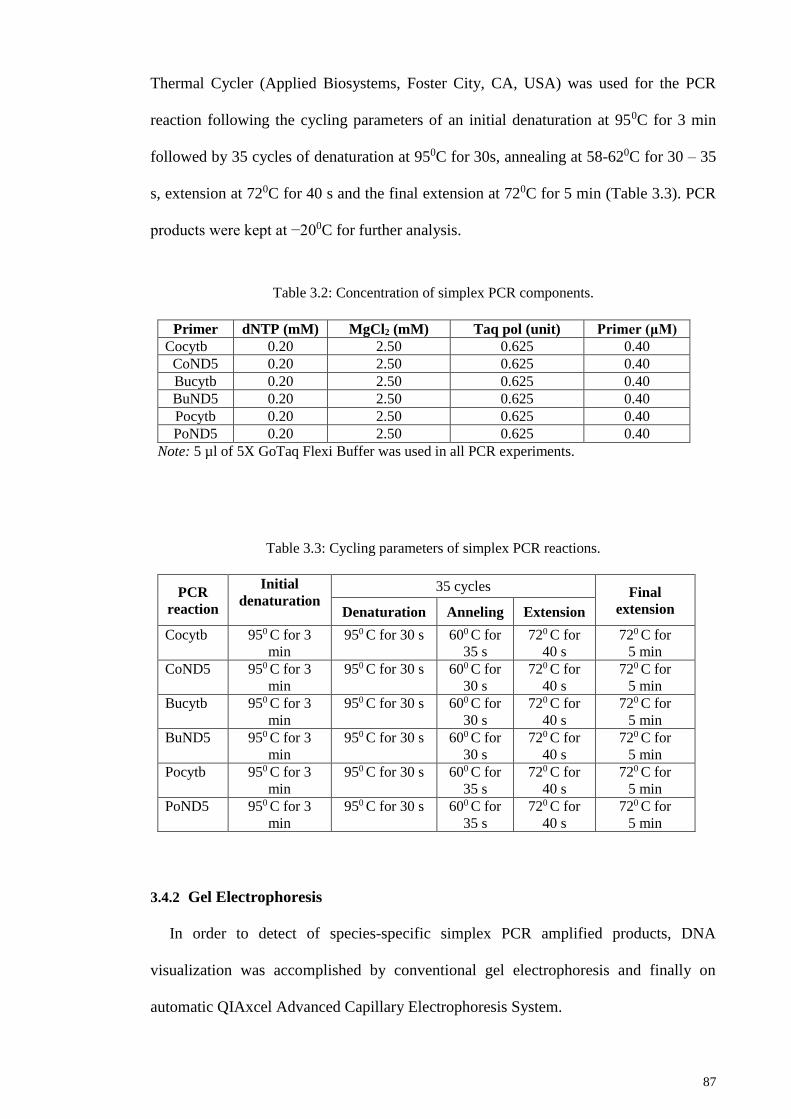
Table 3.2: Concentration of simplex PCR components. ................................................. 87
Table 3.3: Cycling parameters of simplex PCR reactions. ............................................. 87
Table 3.4: Concentration of PCR components of various PCR assays. .......................... 91
Table 3.5: Cycling parameters of various PCR reactions. .............................................. 91
Table 3.6: Different thermal processes applied to target meat samples. ......................... 93
Table 3.7: Concentration of the primers used in mPCR assay. ....................................... 94
Table 3.8: Formulation of model meatball and Frankfurter. ........................................... 95
Table 3.9: Restriction digests of the PCR products. ....................................................... 96
Table 3.10: Restriction enzyme reaction conditions for the digestion of beef and buffalo
simplex PCR products. .................................................................................................... 97
Table 3.11: Restriction enzyme reaction conditions for the digestion of pork simplex PCR
products. .......................................................................................................................... 98
Table 3.12: Sequences and concentration of primer and probes used in this study. ..... 100
Table 4.1: Concentration and purity of the extracted DNA. ......................................... 104
Table 4.2: The mismatch comparison of the beef cytb-specific 120 bp site against other
28 non-target species. .................................................................................................... 106
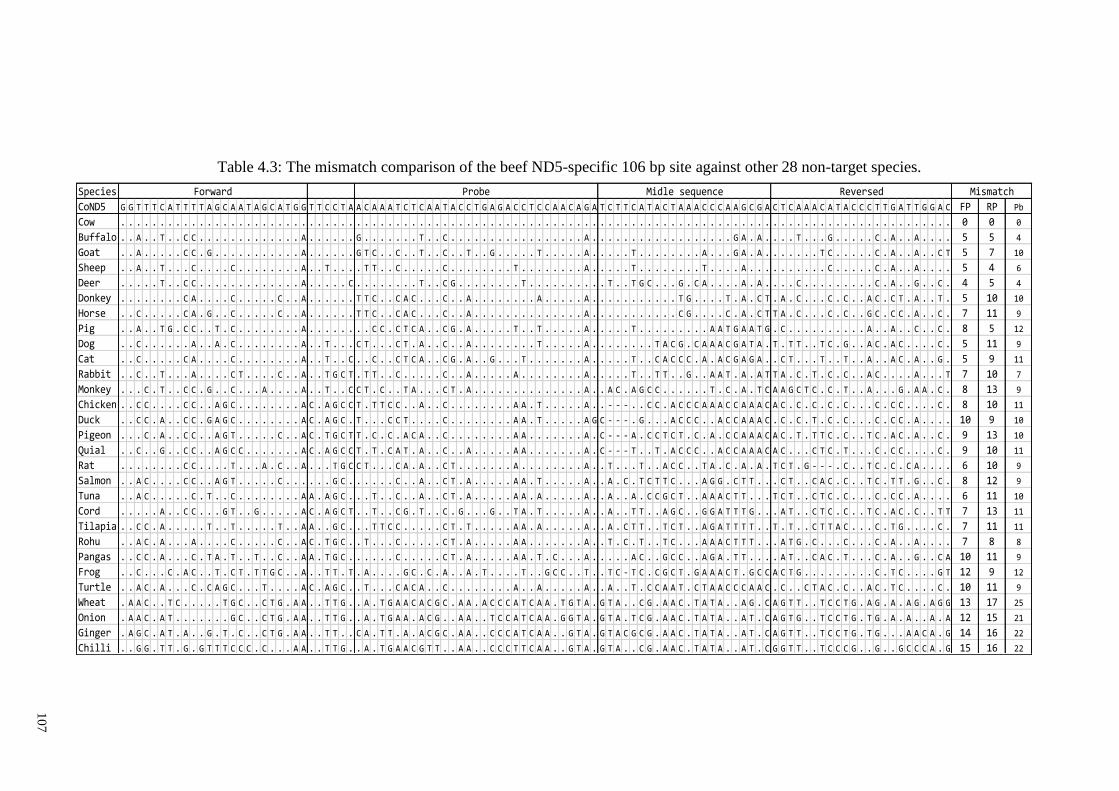
Table 4.3: The mismatch comparison of the beef ND5-specific 106 bp site against other
28 non-target species. .................................................................................................... 107
Table 4.4: The mismatch comparison of the buffalo cytb-specific 90 bp site against other
28 non-target species. .................................................................................................... 108
Table 4.5: The mismatch comparison of the buffalo ND5-specific 138 bp site against
other 28 non-target species. ........................................................................................... 109
Page 19
xviii
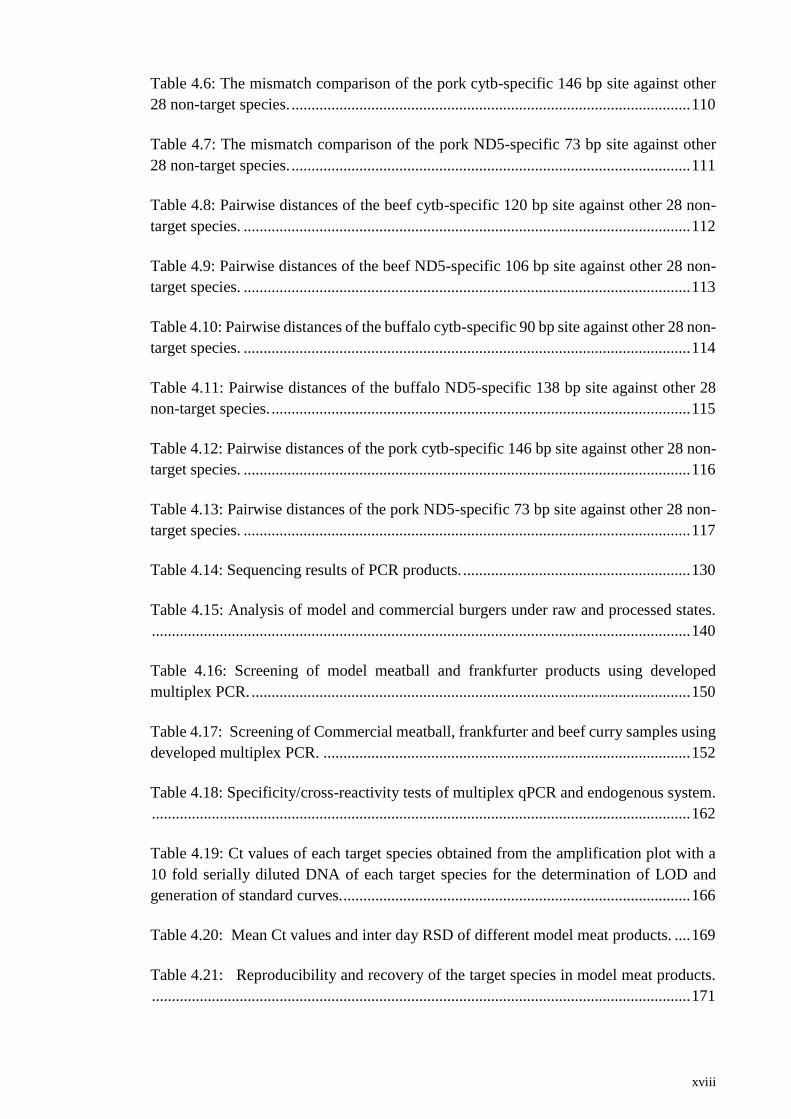
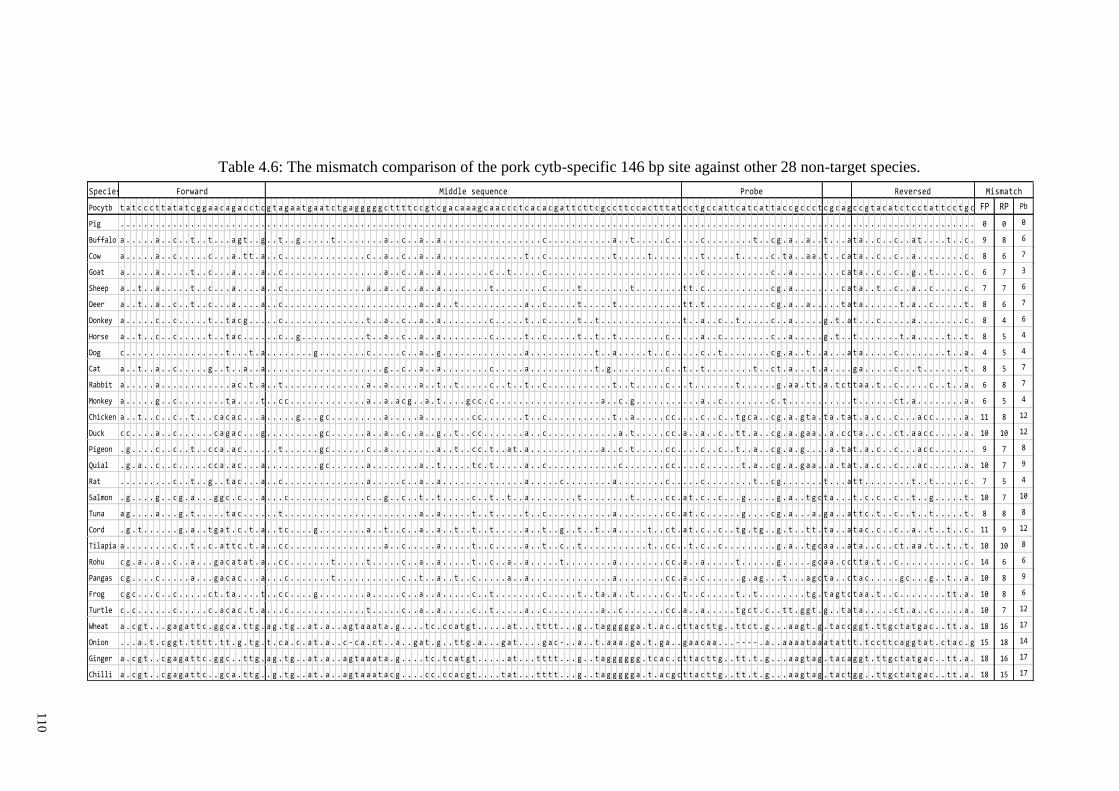
Table 4.6: The mismatch comparison of the pork cytb-specific 146 bp site against other
28 non-target species. .................................................................................................... 110
Table 4.7: The mismatch comparison of the pork ND5-specific 73 bp site against other
28 non-target species. .................................................................................................... 111
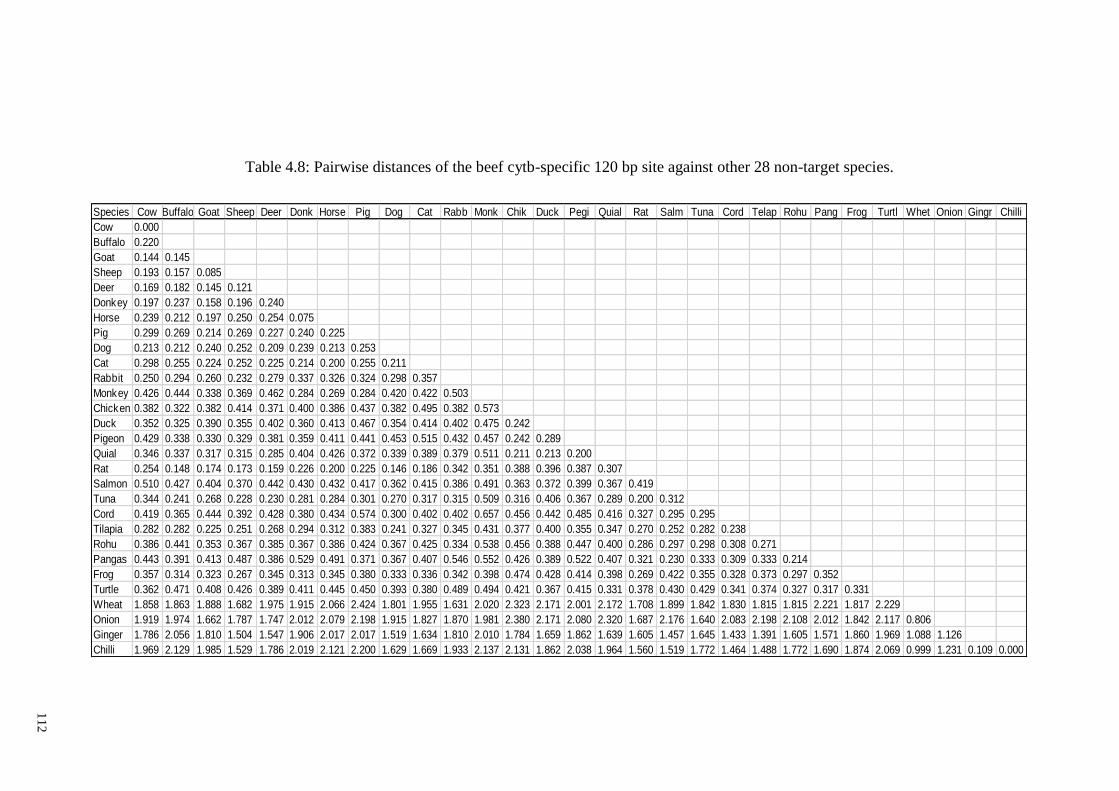
Table 4.8: Pairwise distances of the beef cytb-specific 120 bp site against other 28 non-
target species. ................................................................................................................ 112
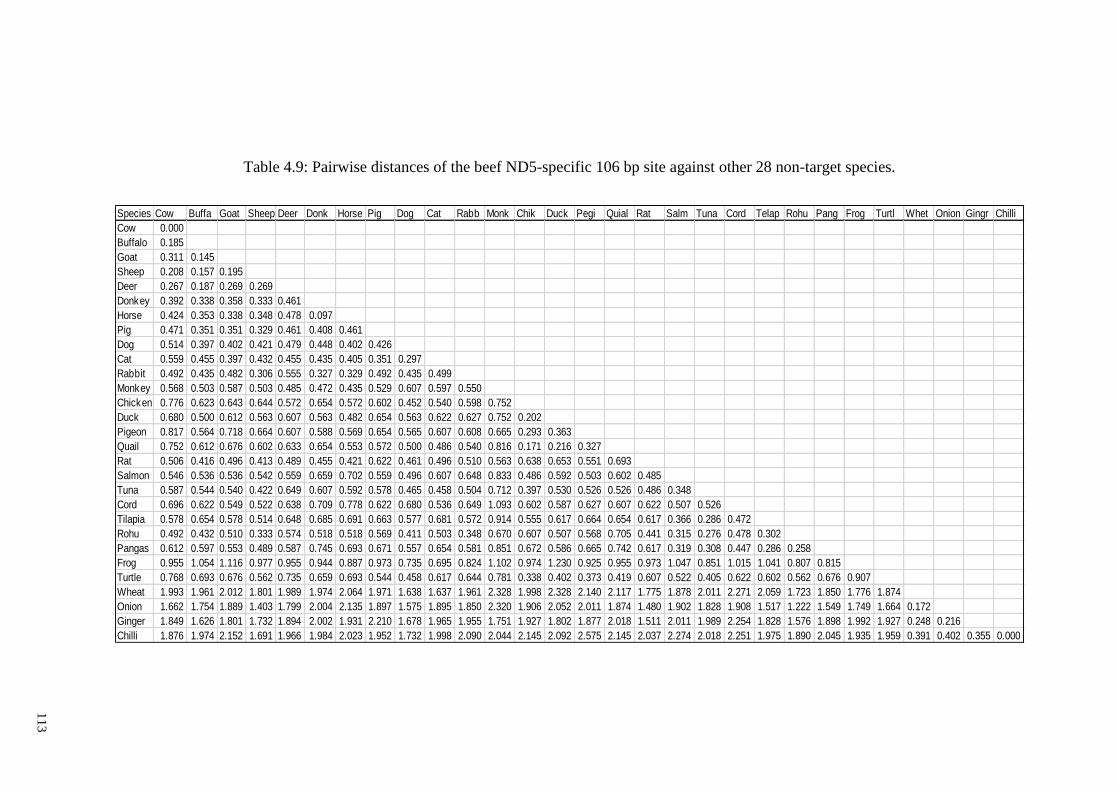
Table 4.9: Pairwise distances of the beef ND5-specific 106 bp site against other 28 non-
target species. ................................................................................................................ 113
Table 4.10: Pairwise distances of the buffalo cytb-specific 90 bp site against other 28 non-
target species. ................................................................................................................ 114
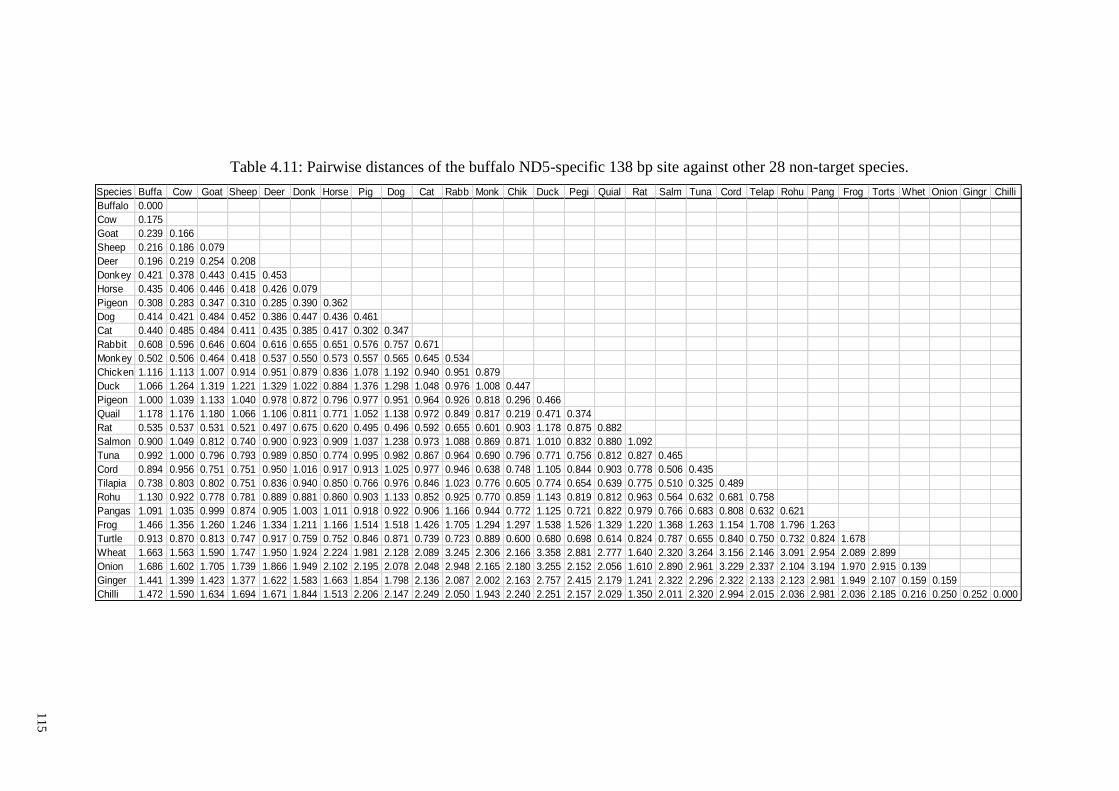
Table 4.11: Pairwise distances of the buffalo ND5-specific 138 bp site against other 28
non-target species. ......................................................................................................... 115
Table 4.12: Pairwise distances of the pork cytb-specific 146 bp site against other 28 non-
target species. ................................................................................................................ 116
Table 4.13: Pairwise distances of the pork ND5-specific 73 bp site against other 28 non-
target species. ................................................................................................................ 117
Table 4.14: Sequencing results of PCR products. ......................................................... 130
Table 4.15: Analysis of model and commercial burgers under raw and processed states.
....................................................................................................................................... 140
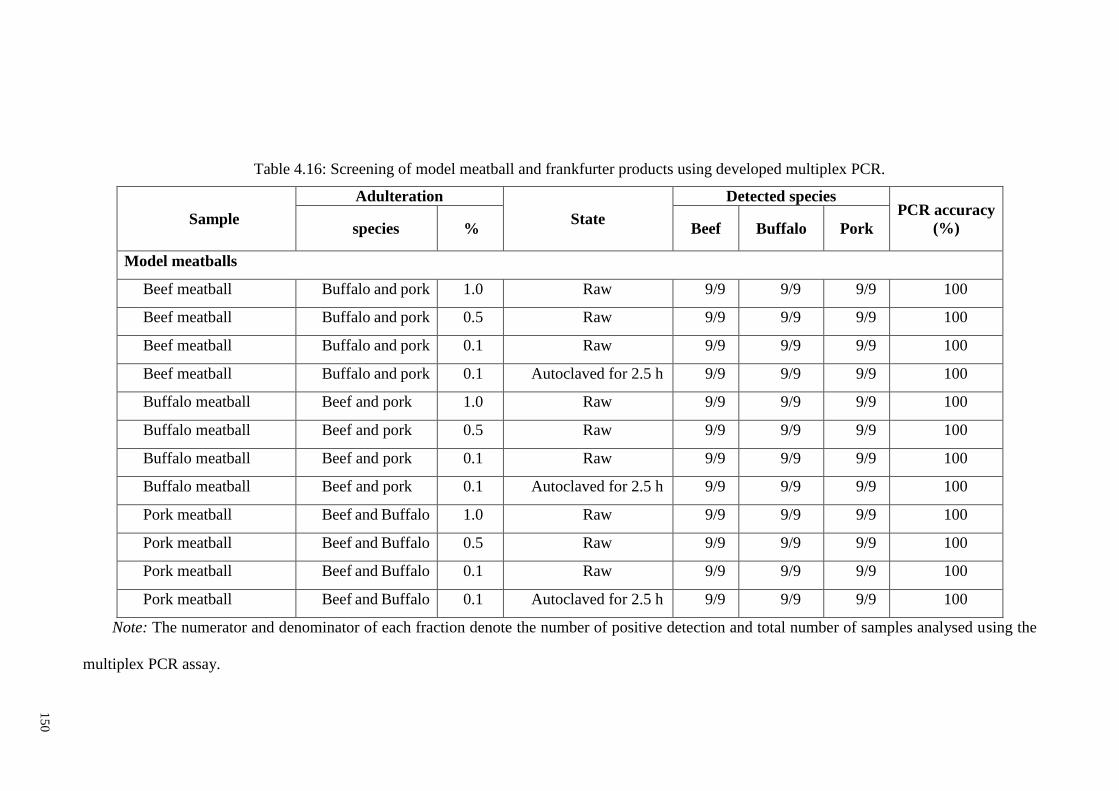
Table 4.16: Screening of model meatball and frankfurter products using developed
multiplex PCR. .............................................................................................................. 150
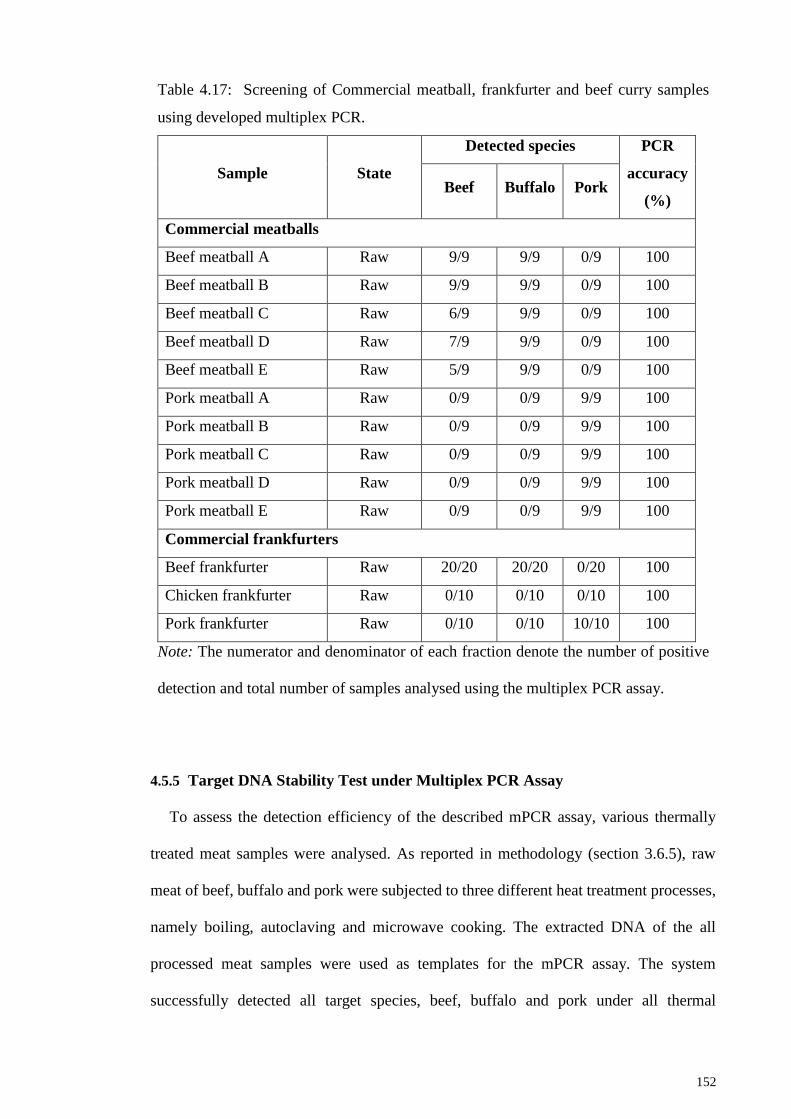
Table 4.17: Screening of Commercial meatball, frankfurter and beef curry samples using
developed multiplex PCR. ............................................................................................ 152
Table 4.18: Specificity/cross-reactivity tests of multiplex qPCR and endogenous system.
....................................................................................................................................... 162
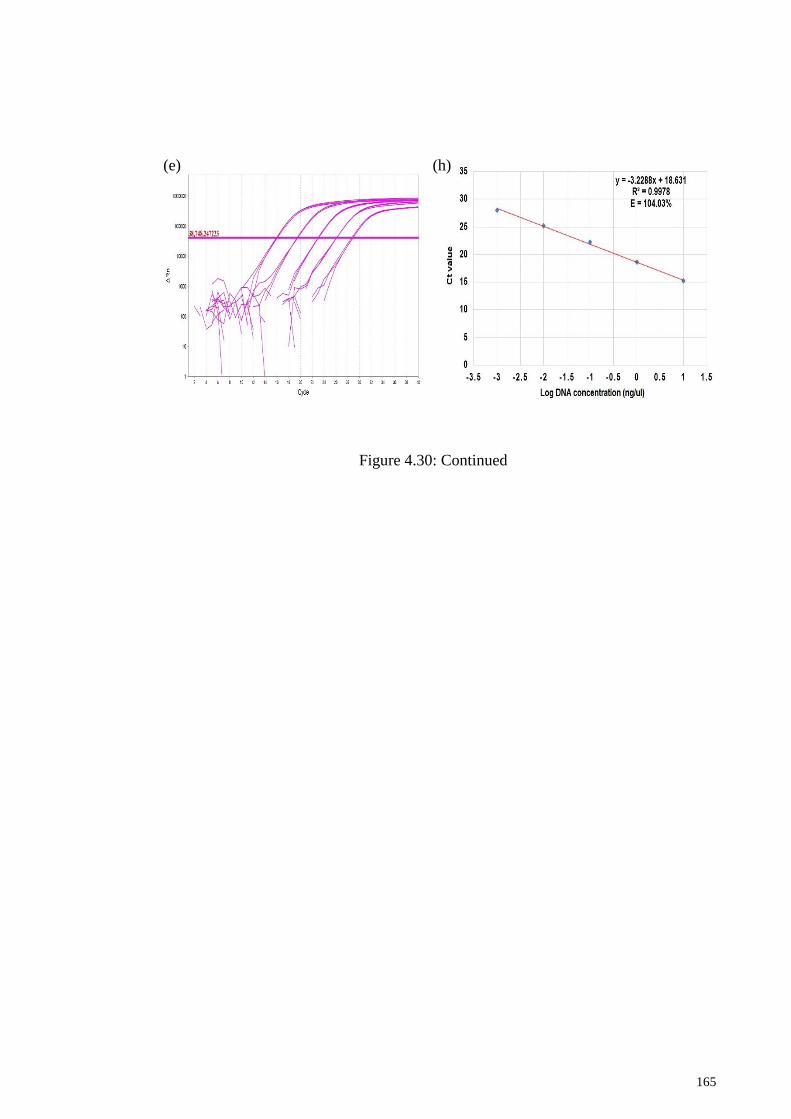
Table 4.19: Ct values of each target species obtained from the amplification plot with a
10 fold serially diluted DNA of each target species for the determination of LOD and
generation of standard curves. ....................................................................................... 166
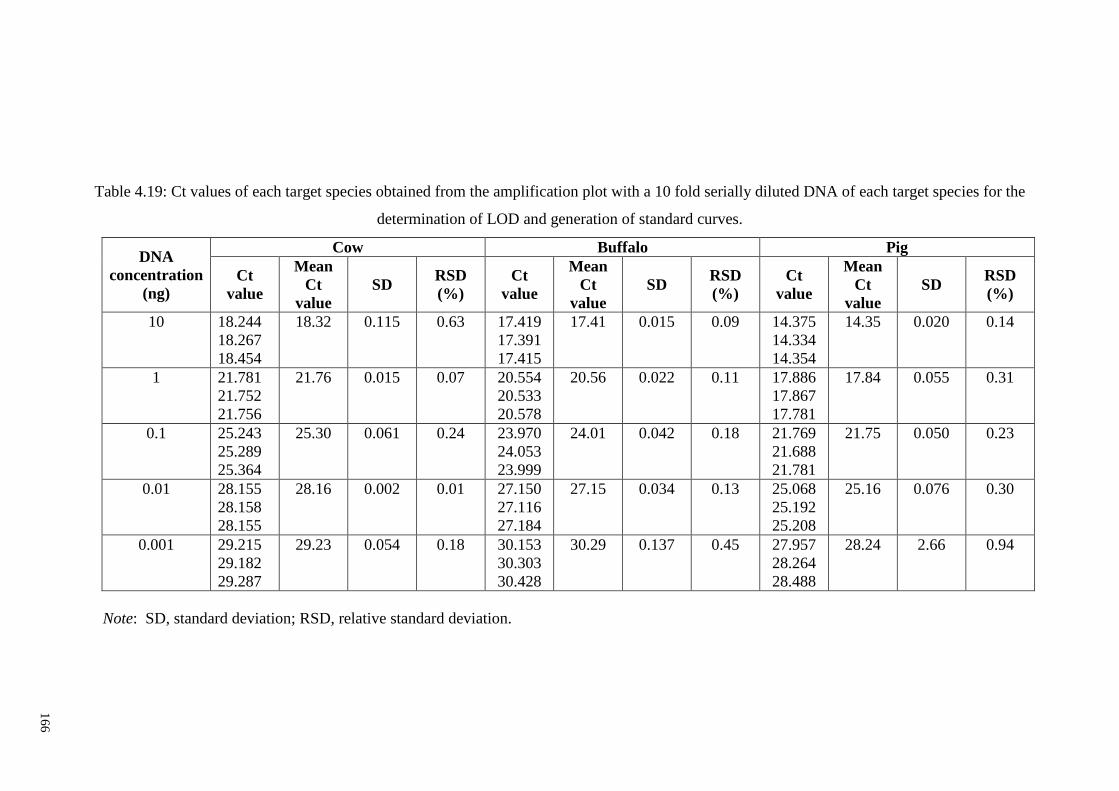
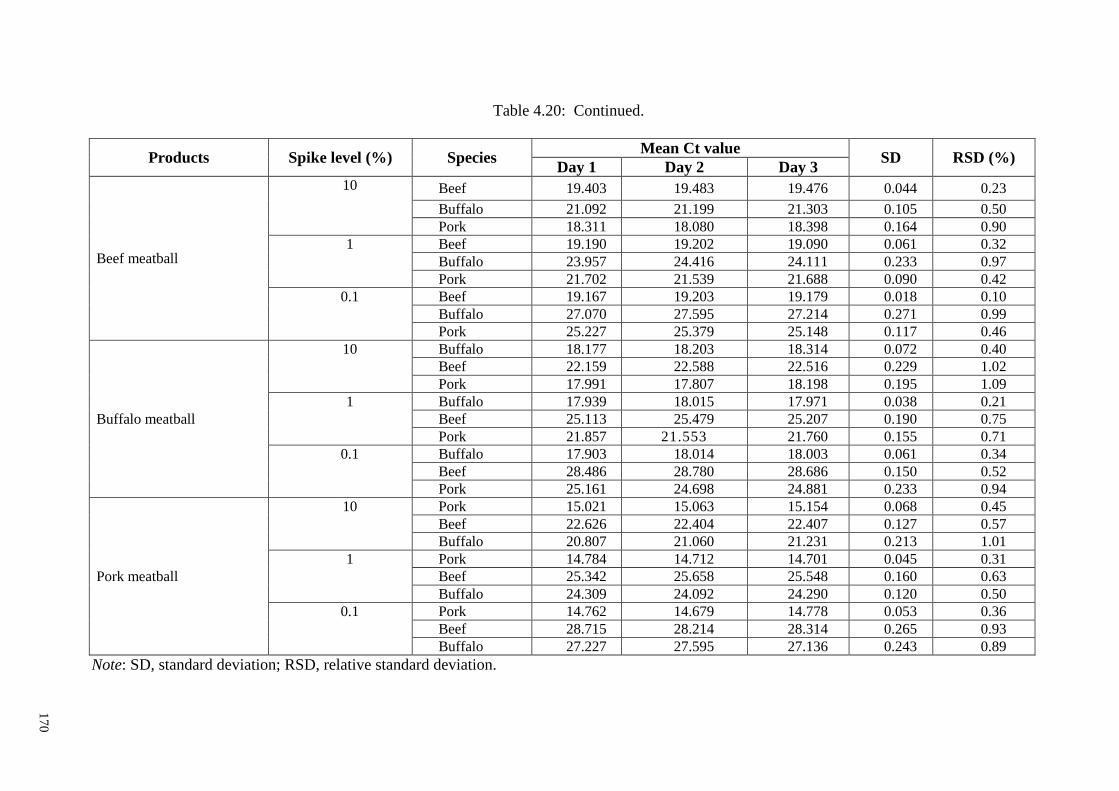
Table 4.20: Mean Ct values and inter day RSD of different model meat products. .... 169
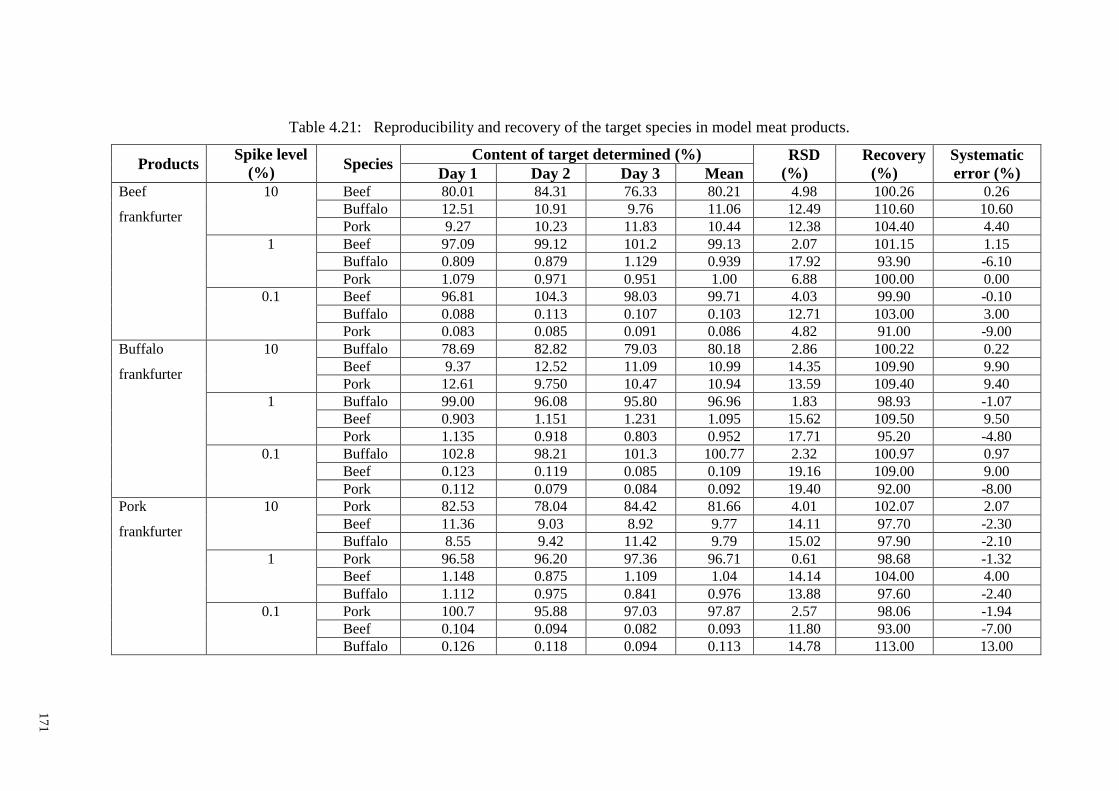
Table 4.21: Reproducibility and recovery of the target species in model meat products.
....................................................................................................................................... 171
Page 20
xix
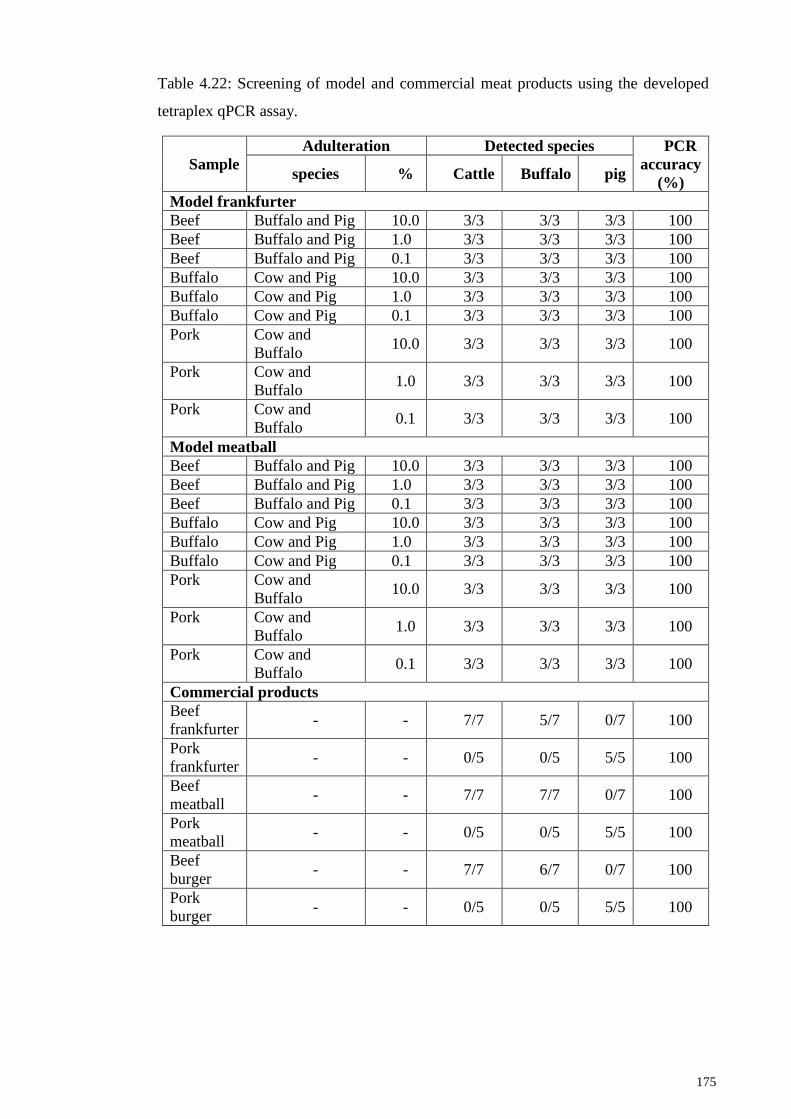
Table 4.22: Screening of model and commercial meat products using the developed
tetraplex qPCR assay. .................................................................................................... 175
Page 21
xx
LIST OF SYMBOLS AND ABBREVIATIONS
$ : dollar
% : percent
0 C : degree celsius
µg : microgram
µL : microliter
µM : micromole
pg : Picograme
≥ : greater than or equal to
3D : three dimensional
A260/A280 : ratio of absorbance at 260 and 280 nm
AIDS : acquired immune deficiency syndrome
BLAST : Basic local alignment search tool
bp : base pair
BSP : bovine spongiform encephalopathy
Bucytb : buffalo cytb
BuND5 : buffalo ND5
COI : cytochrome c oxidase subunit I
Cocytb : cow cytb
CoND5 : Cow ND5
Ct : threshold cycle
cytb : cytochrome b
dH2O : distilled water
D-loop : displacement loop
DNA : deoxyribonucleic acid
Page 22
xxi
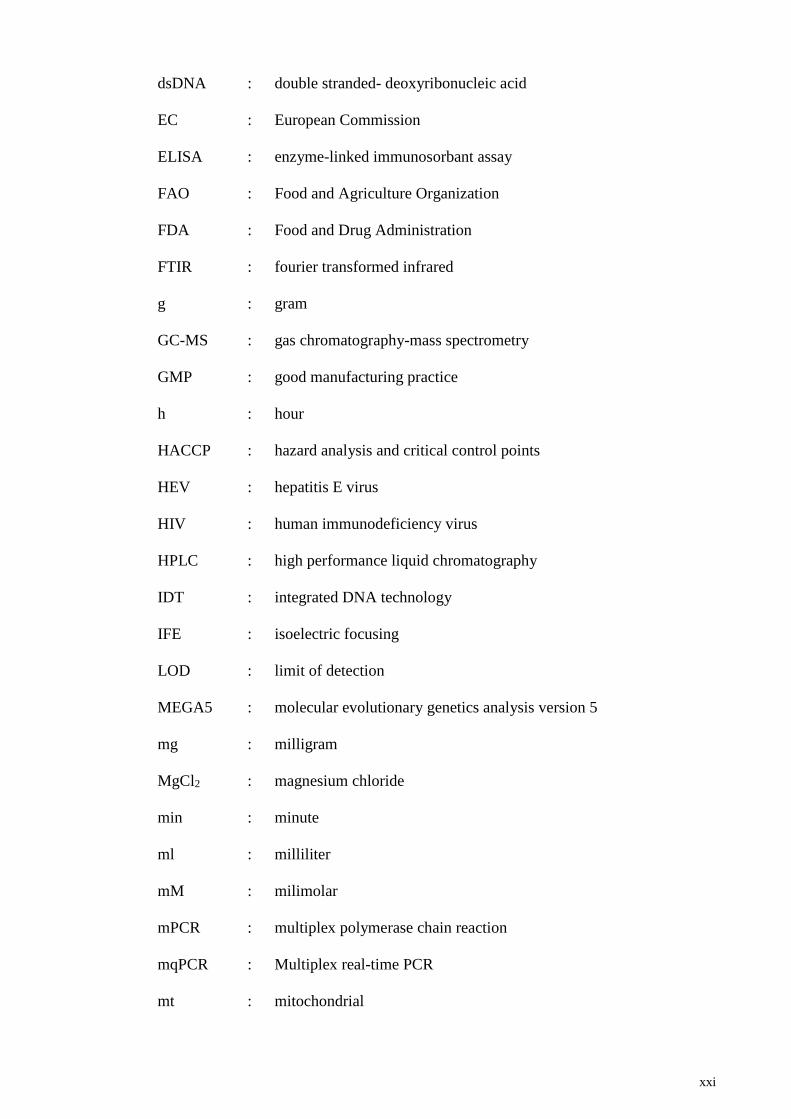
dsDNA : double stranded- deoxyribonucleic acid
EC : European Commission
ELISA : enzyme-linked immunosorbant assay
FAO : Food and Agriculture Organization
FDA : Food and Drug Administration
FTIR : fourier transformed infrared
g : gram
GC-MS : gas chromatography-mass spectrometry
GMP : good manufacturing practice
h : hour
HACCP : hazard analysis and critical control points
HEV : hepatitis E virus
HIV : human immunodeficiency virus
HPLC : high performance liquid chromatography
IDT : integrated DNA technology
IFE : isoelectric focusing
LOD : limit of detection
MEGA5 : molecular evolutionary genetics analysis version 5
mg : milligram
MgCl2 : magnesium chloride
min : minute
ml : milliliter
mM : milimolar
mPCR : multiplex polymerase chain reaction
mqPCR : Multiplex real-time PCR
mt : mitochondrial
Page 23
xxii
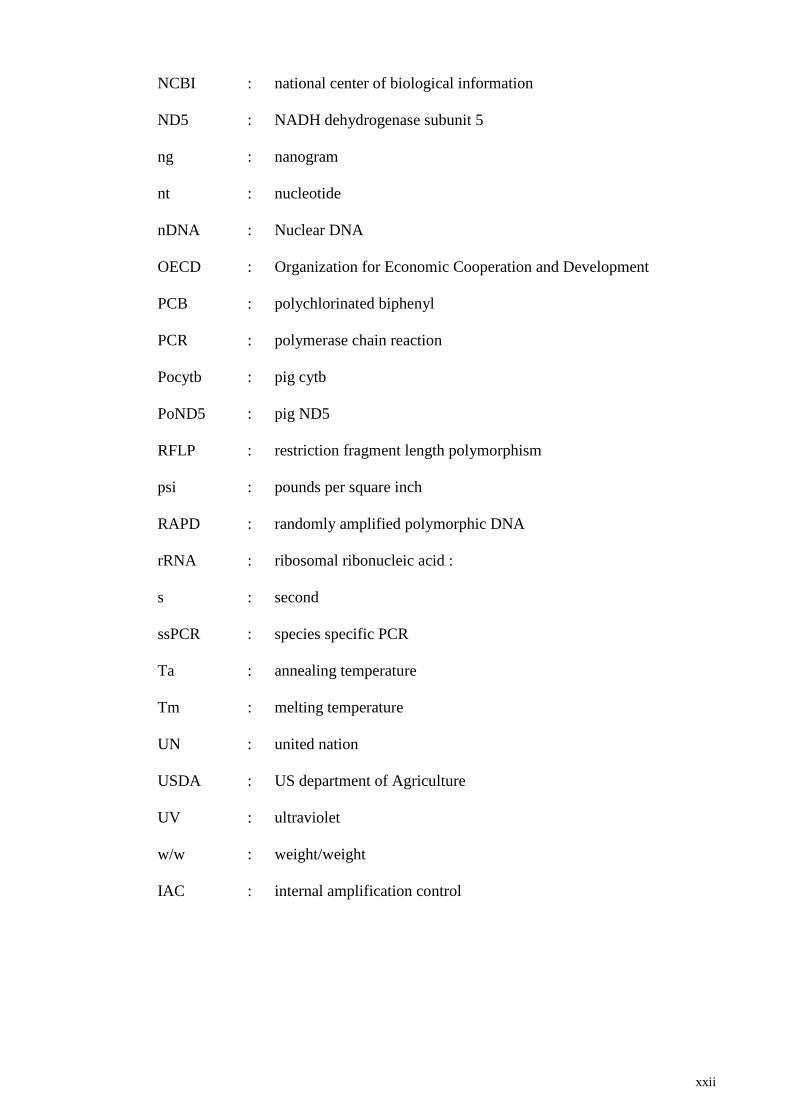
NCBI : national center of biological information
ND5 : NADH dehydrogenase subunit 5
ng : nanogram
nt : nucleotide
nDNA : Nuclear DNA
OECD : Organization for Economic Cooperation and Development
PCB : polychlorinated biphenyl
PCR : polymerase chain reaction
Pocytb : pig cytb
PoND5 : pig ND5
RFLP : restriction fragment length polymorphism
psi : pounds per square inch
RAPD : randomly amplified polymorphic DNA
rRNA : ribosomal ribonucleic acid :
s : second
ssPCR : species specific PCR
Ta : annealing temperature
Tm : melting temperature
UN : united nation
USDA : US department of Agriculture
UV : ultraviolet
w/w : weight/weight
IAC : internal amplification control
Page 24
xxiii
LIST OF APPENDICES
APPENDIX A Front page of Publications………………………………….239
APPENDIX B Conferences ………………………………………………..243
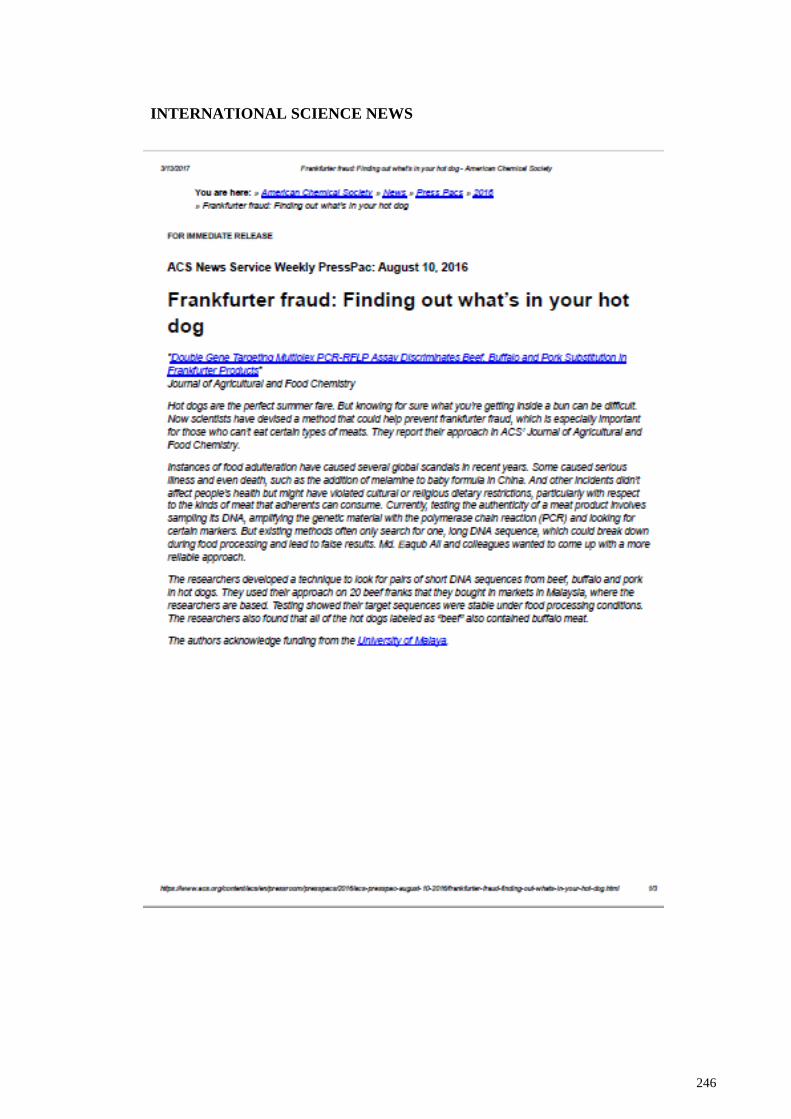
APPENDIX C Patent and International Science News……………………..245
Page 25
1
CHAPTER 1: INTRODUCTION
1.1 Background of the Study
Authentication of the species origins of animal-originated food products is a rapidly
growing field because of its direct relevance to public health, biodiversity perspectives as
well as people’s religious and cultural traditions. Increasing public awareness about the
roles of foodstuffs in maintaining community health and limit the spread of both
communicable and non-communicable diseases along with their roles in balanced
economy and religious understanding has further contributed to the identification of
animal sources in foods and feeds (Bottero & Dalmasso, 2011; Haider, Nabulsi, & Al-
Safadi, 2012). In fact, it is an integral requirement to safeguard community health,
religious faith, fair trade and consumers’ lifestyles. Nowadays, the consumption of ready-
made foods from the nearby food court, restaurant and groceries has dramatically
increased due to the increasing volumes of works and extension of business hours. These
are making people dependent on ready-made foods, such as burgers, frankfurters,
meatballs, pizzas, cookies, soups, creams, candies and restaurant foods (Ali, Razzak, &
Hamid, 2014c). Therefore, the consumers' are paying great attention to the quality and
ingredients of ready-made and packaged foods due to the health concern (e.g. Zoonotic
threats and allergens), lifestyles (vegetarianism and organic food), religious faith (e.g.
Ritually prohibited ingredients) and fair spending of their hard earned fortunes (Ali et al.,
2015d).
However, the unexpected occurrence of certain adulterants in food such as horse meat
in school meals (Richardson, 2013), burger products in Europe (Walker, Burns, & Burns,
2013), rat meat sold as lamb in China (Ali et al., 2014c), monkey meat in soup in
Indonesia (Rashid et al., 2015b) and cat meat in Indian curries in Britain (Ali, Amin,
Hamid, Hossain, & Mustafa, 2015a) has made customers are increasingly worried about
Page 26
2
the religion compliant foods. The recent inclusion of some alien species pork and rat meat
in lamb products (Ali et al., 2014c), monkey and dog meat in soup products (Rahman et
al., 2014; Rashid et al., 2015b), dog and cat meat for chevon (Singh, Pathak, Nayak,
Verma, & Umaraw, 2014) is of grave concern and highly alarming since most of these
species are not only the potential carrier of infectious zoonoses but also they are
prohibited in several religions such as Islam and Judaism. In Europe, the consumption of
beef has fallen drastically due to the bovine spongiform encephalopathy (BSE),
polychlorinated biphenyl (PCB) or toxic dioxin contamination, swine influenza and avian
influenza in 2010 (Goffaux, China, Dams, Clinquart, & Daube, 2005; Bottero &
Dalmasso, 2011). Researchers believe that Simian Immunodeficiency Virus affected
African chimpanzee meat is responsible for the most fatal and infectious human disease,
HIV/AIDS (Fajardo, Gonza´lez, Rojas, Garcıa, & Martı´n, 2010). Furthermore, religious
taboos are also dominant issues to choose and avoidance of food products, particularly
meat products (Ali et al., 2014c).Thus, the proper labeling of constituents in food products
and their subsequent field monitoring has become a need of the time to prevent food
forgery, safeguard consumers trust and sustainable food businesses. Considering the
need, most of the countries have regulatory bodies for the tracing and tracking of
adulterants such as lower grade or lower priced meats in the higher priced meat products
(Al Amin, 2015).
Moreover, protecting the sanctity of halal branded food products has become a global
issue because of the rapid expansion of halal food markets in all corners of the world (Ali
et al., 2015d; Rahman et al., 2014). Currently, the Muslim population has reached to 1.8
billion (HKTDC, 2014) and turnover of the global halal business has crossed to US$ 2.3
trillion in 2012 and it is going to be US$ 2.47 trillion by 2018 (HKTDC, 2014). Customers
pay more value for halal foods because of its special requirements of manufacturing and
supply chain (Ali et al., 2015d) which have made them susceptible to adulteration. Thus
Page 27
3
in order to adapt and grab the huge opportunities of global halal food markets, many
countries such as Malaysia, Singapore, Thailand, Indonesia, India, Turkey, Australia,
China, New Zealand, Brunei and Brazil have established halal certification and regulatory
bodies (Ali et al., 2012d, Salama, 2011). The Malaysian government has developed more
than 10 integrated Halal hubs to monitor and export halal goods to other countries. In
2013, Malaysia was the global largest exporter of halal products and the total turnover
was US$ 10 billion (HKTDC, 2014). Thus halal food industry has been evolved as an
important contributor to Malaysian economy and Malaysia must protect the sanctity of
this industry. Modern food products such as meatballs, frankfurters and burgers are made
from minced meats and detection of the animal origin of those samples are extremely
difficult due to the complexity of the matrices. Therefore, the development and validation
of the developed methods need the screening of real-world samples to be sure that they
are working in the field.
Up-to-this-date, various analytical approaches have been documented to detect
fraudulent mixing of food products. Numerous lipids (Rohman, Erwanto, & Man, 2011),
proteins (Ayaz, Ayaz, & Erol, 2006) and DNA-based assays have been proposed for meat
speciation (Matsunaga et al., 1999, Ali et al., 2015b). However, the lipid and protein based
methods are often unsuitable because they are laborious, target-biomarkers are often
modified and thus cannot distinguish closely related species in highly processed food such
as heated or chemically treated products, and are less sensitive than DNA-based
approaches (Ali et al., 2012b; Lago, Herrero, Madriñán, Vieites, & Espiñeira, 2011).
Moreover, these methods are unable to differentiate closely related species, such as cow
and buffalo. In contrast, the DNA-based techniques, especially the short-length DNA
biomarkers are thermodynamically more stable, more sensitive and more reliable over the
longer ones even under extreme states such as degraded or naturally decomposed samples
(Ali et al., 2015b; Rashid et al., 2015b). Among the DNA-based methods, PCR
Page 28
4
approaches are highly appreciated since they can amplify target biomarkers from single
copy to easily detectable quantities, offering a highly sensitive, robust and low-cost
platform for the identification of biological ingredients (Rashid et al., 2015b). Several
PCR-platforms such as conventional includes species-specific singleplex PCR
(Karabasanavar et al., 2011; Rashid et al., 2015b), multiplex PCR (Ali et al., 2015d;
Bottero et al., 2003), PCR-restriction fragment length polymorphism (PCR-RFLP) (Ali,
Hashim, Mustafa, & Man, 2011b; Dooley et al., 2005), randomly amplified polymorphic
DNA (RAPD) (Arslan, İlhak, Calicioglu, & Karahan, 2005), PCR product sequencing
(La Neve, Civera, Mucci, & Bottero, 2008), and real-time PCR includes TaqMan probe
(Ali et al., 2012a; Drummond et al., 2013), SYBER green (Asing et al., 2016a), Eva green
and molecular beacon, sensor based includes nucleic acid based biosensor and
nanoparticle based biosensor have already been documented for the authentication of
meat species.
However, these methods are mostly based on a single and a long DNA marker which
often breaks down under food processing treatments as well as natural and environmental
decomposition, making them less trustworthy but more expensive (Ali et al., 2015c). The
evolution of multiplex polymerase chain reaction (mPCR) assays are especially
promising since they offer the opportunity of identifying multiple target oligos in a single
assay platform, saving both analytical cost and time (Ali et al., 2014c). Instead of
targeting a single gene, double gene targeting short-amplicon length mPCR assays would
be more reliable and trustworthy because of the complementation opportunities in which
the detection of an alternative target can compensate the missing target, in case it is lost
under the states of decomposition. Moreover, the species-specific PCR restriction
fragment length polymorphism (PCR-RFLP) assays are especially interesting because
they offer the opportunity to authenticate a product by restrictive digestion of the
amplified PCR products using one or more restriction enzymes (REs) (Rashid et al.,
Page 29
5
2015b). Using the sequence variation that exists within a defined region of DNA, the
differentiation of even closely related species is possible using a PCR-RFLP assay. In
contrast to conventional PCR assays, real-time PCR techniques are especially promising
since they offer the opportunity of fast, greater resolution, target quantification,
automation, reproducibility, high sensitivity and real-time monitoring (Asing et al.,
2016a; Cheng, He, Huang, Huang, & Zhou, 2014). In addition, TaqMan probe based real-
time PCR method is particularly beneficial since specifically-designed probe and primer
sets significantly enhance the specificity and reliability of the assay (Ali et al., 2012a).
Because fluorescent signal is generated only when hybridize the specific probe due to the
DNA polymerase moves by and cleaves off the probe’s quencher molecule (Arya et al.,
2014). Furthermore, TaqMan probe based techniques significantly facilitate to develop
the multiplex real-time PCR assays because specific probes can be labeled with
distinguishable and different reporter dyes which allows the identification of
amplifications formed by one or multiple primer sets in a single PCR assay tube. The
main drawback of the DNA-intercalating dye systems (SYBER green, Eva green) are that
bind non-specifically to all double-stranded DNAs produced during the PCR reaction
such as primer-dimers or any non-specific products, resulting in increased fluorescent
background or false positive (Arya et al., 2014). Moreover, some dyes are known to
inhibit the PCR reaction (Gudnason, Dufva, Bang, & Wolff, 2007).
Mitochondrial genes were targeted for the design of species-specific primers since they
are maternally inherited, single allele by nature and there is no possibility in sequence
ambiguities and present in multiple copies per cell. These ensure a higher probability of
getting the desired PCR results even in case of serious DNA breakdown under harsh
processing conditions (Mane et al., 2012b). Ad-mixture of closely related animal species
can easily be discriminated by virtue of the larger variety of mitochondrial DNA
(mtDNA) over the nuclear sequence (Gupta, Rank, & Joshi, 2011). Due to the presence
Page 30
6
of variable and conserved regions, cytb gene is also suitable for phylogenetic studies
because of the divergence at the population level, explaining the evolutionary relationship
(Mohamad, El Sheikha, Mustafa, & Mokhtar, 2013). On the other hand, ND5 gene
contains sufficient conserved regions within the same species, but adequate
polymorphism among the closely related species (Ali et al., 2015d).
In this regard, mPCR assay, especially the double gene targeting one with short
amplicon targets, would be especially useful and trustworthy for the simultaneous
detection of beef, buffalo, and pork products in various food products. Hence, all of the
documented PCR assays involving single and longer gene target, are definitely less
reliable than a short-length double gene-target PCR assay where dual targets
complements each other, offering a confirmed and unambiguous detection.
1.2 Project Rationale
Beef, buffalo and pork are economically and culturally important meat having the top
rate of consumption in most parts of the world. Religious, cultural, and geographical
restrictions and preferences over the consumption of beef, buffalo, and pork are huge, and
social outcry over their adulteration and consumption have taken place from time to time
(Girish, Haunshi, Vaithiyanathan, Rajitha, & Ramakrishna, 2013; Karabasanavar et al.,
2011). While Egyptians prefer buffalo because of their cultural preferences, some
Europeans and Indians avoid beef because of the fear of bovine spongiform
encephalopathy (BSE) and religious requirements (Sakaridis, Ganopoulos, Argiriou, &
Tsaftaris, 2013), beef has evolved as the meat of choice and consumed heavily in most
parts of the world (Karabasanavar et al., 2011a; Karabasanavar et al., 2011b). For
instance, while there is a huge turnover of buffalo in India both for domestic consumption
and exports, the slaughtering, consumption and export of beef is totally prohibited there
because of the restriction of Hinduism (Girish et al., 2013). The recent killing of a man
Page 31
7
and beating of his family members in the city of Dadri in India by a group of radical
Hindus based on a false rumor that beef was kept in his refrigerator is a strong piece of
evidence that meat scandal can provoke social unrest and take innocent lives (Matthew,
2015). On the other hand, pork is totally unacceptable to the Muslim, Jewish and select
Christian dominations despite its popularity in Western countries (Ali et al., 2012a; von
Bargen, Dojahn, Waidelich, Humpf, & Brockmeyer, 2013). Therefore, beef, buffalo and
pork adulterated meat products have direct implications to public health, religions,
cultures and economy. Major risks include zoonotic infection, financial loss and social
outburst. Bovine and porcine products are directly linked to the fatal neurodegenerative
disease bovine spongiform encephalopathy (BSE) and dioxin induced developmental,
reproductive and carcinogenic disorders (Bottero & Dalmasso, 2011). Porcine
contamination can further lead to infections caused by swine influenza (Bottero &
Dalmasso, 2011) and Toxoplasma gondii (Robert-Gangneux & Dardé, 2012). Buffalopox
is an important zoonotic infection speed by the Orthopoxvirus infected buffalo and cow
(Gurav et al., 2011). Thus, the social, religious, health, and business interests in beef,
buffalo, and pork are enormous, and there should be a trustworthy but low- cost method
for their discrimination in the food chain.
1.3 Problem Statements
Morphological, protein and lipid based methods for animal material authentication are
not reliable because of the breakdown of the analyte biomarkers during food processing.
Consequently, DNA based PCR methods with short-length target have been evolved as
the method of choice. Currently, three PCR-based analytical tests have been documented
for simultaneous identification of beef and buffalo (Rea, Chikuni, Branciari,
Sangamayya, Ranucci, & Avellini, 2001; Gupta, Rank, & Joshi, 2012; Vaithiyanathan &
Kulkarni, 2016). Rea et al. (2001) and Gupta et al. (2011) developed a duplex PCR assay
wherein they targeted 113- and 152-bp sequences for the beef and buffalo, respectively,
Page 32
8
in the cytb gene and, recently, Vaithiyanathan et al. (2016) targeted 126 and 226-bp sites
in the D-loop gene. However, all the reported assays have just one target region for bovine
and buffalo. Moreover, there is no PCR assay that can detect bovine, buffalo and porcine
materials in a single assay platform. Furthermore, they are not validated for process food
analyses. Compared with a single target assay, two target assay involving two different
regions for each species would be especially advantageous, since it would provide greater
certainty since it is unlikely that both targets would be lost during processing. Therefore,
development of mPCR assay involving two different gene sequences involving short-
length amplicons for the identification of bovine, buffalo and porcine materials in foods
would be greatly advantageous.
1.4 Research Objectives
1.4.1 General Objective
The overall aim of the study was to develop and validate a multiplex PCR assay
targeting two different genes for each of bovine, buffalo and porcine species for the
authentication of their ingredients in processed food.
1.4.2 Specific Objectives
i) To develop primers and probes targeting double genes sites for the each
of bovine, buffalo and porcine species.
ii) To develop and validate a multiplex conventional and real-time PCR
systems for the sensitive and reliable detection of bovine, buffalo and
porcine species under various food processing treatments and complex
matrices.
iii) To assess the assay performance for the screening of bovine, buffalo and
porcine in processed meat products available in markets.
Page 33
9
1.5 Scopes of Research
1.5.1 Development of Biomarkers
Nowadays, in addition to food authentication, DNA based techniques are applied for
the molecular identification of pathogens in agriculture, environmental monitoring, bio
diagnostics, bio terrorism and forensic analysis (Rahman, 2015a). Recently, researchers
have paid more attention to the short amplicon length biomarkers due to their extra-
ordinary stability against severe food processing treatments since they still can traceable
in the specimen which has been treated with high pressure and temperature (Ali et al.,
2012a). Previous literatures recorded that longer target DNA is susceptible to break down
under harsh processing treatment causing there is a chance of false negative results (Ali
et al., 2016). Although, longer amplicons are detectable but it has been proved that the
shorter amplicons (≥150 bp) are more sensitive than longer ones (Ali et al., 2015c; Rojas
& Isabel Gonza´ lez, 2010). Due to the extensive sensitivity and stability of the shorter
amplicon DNA target, it has vast application in forensic analysis, biochip and biosensor
development.
Multiplex polymerase chain reaction (mPCR) is a greatly useful molecular biology
technique by which multiple targets can amplify simultaneously from a single reaction
mixture. They also reduce both analytical time and cost. In this regard, multiplex mPCR
assay, especially the double gene targeting one with short amplicon targets, would be
especially useful and trustworthy for the simultaneous detection of species in various food
products. Because of the presence of more than one target for the same species, the
detection of the missing target would be complemented by a second target because it is
highly unlikely that both targets would be broken down under the state of decomposition.
To address this issue, I have designed a total of six sets primers with amplicon sizes of
73-146 bp, one set from mitochondrial cytochrome b (cytb) and one set from NADH
dehydrogenase subunit 5 (ND5) gene of each (cow, buffalo and pig) species i.e. two sets
Page 34
10
from cow, two sets from buffalo and two sets from pigs. The mitochondrial DNAs (mt-
DNA) are more focused over the nuclear ones (n-DNA) for authentication studies because
of its maternal origins, extra protection by mt-membrane and abundance in multiple
copies. Hence, cytb and ND5 genes were targeted because of their higher degree of
divergence and availability of sufficient conserved regions within the species but
adequate polymorphism among the closely related species (Mohamad et al., 2013). Thus,
the proposed activities will develop a double gene and short amplicon targeting mPCR
assay for the discriminatory authentication of bovine, buffalo, and porcine materials in
the food chain.
1.5.2 Evaluation of the Biomarker-specificity using PCR-based Technique
It is very important to evaluate the specificity of the developed biomarkers by using a
well-known system to avoid ambiguity. The performance of the developed biomarkers of
three target species (cow, buffalo and pig) were analyzed using PCR techniques. PCR is
a powerful and authentic biochemical tool for the species identification in food products
(Ali et al., 2011). It is an in vitro amplification processes in which specific oligonucleotide
primers hybridize to the complementary target region of the DNA template followed by
the enzymatic reactions of Taq DNA polymerase were occurred to complete the process
(Rahman, 2015a). The amplified specific products are separated and visualized by using
agarose gel under a gel image documentation system or automated capillary
electrophoresis system to get better resolution. Endpoint PCR systems are not provided
enough information to verify and authenticate the PCR products. Thus, sequencing of the
PCR products coupled with restriction fragment length polymorphism (RFLP) was used
to authenticate the amplified products if the amplicon contains appropriate restriction site
(Rashid, 2015a). However, end point PCR assay is only qualitative detection scheme and
unable to provide quantitative information such as amount of adulterant present in the
specimen. In contrast, real-time multiplex PCR assay is a suitable tool for the
Page 35
11
identification, differentiation and quantification of many different target species using
TaqMan probe containing fluorescent reporter dye (Molenkamp, van der Ham, Schinkel,
& Beld, 2007). Therefore, this research proposed the performance of the developed
oligonucleotide biomarkers with simplex and multiplex conventional PCR, PCR-RFLP
and TaqMan probe real-time PCR assay for detection, differentiation and quantification
analysis of bovine, buffalo and porcine DNA in the food chain.
1.5.3 Assay Validation and Food Analysis
To check the validity of the developed authentication tool is a vital step because the
reliability of the assay depends on the validity performance. For example, protein based
methods are not suitable for the analysis of extensive processing, food due to their lack
of stability and specificity (Lago et al., 2011). Hence, initial performance of the developed
multiplex system was tested using the extracted DNA under raw state of target species
and some other non-target species which were commonly used in meat products.
Secondly, the assay was validated under different cooking conditions, namely, boiling,
autoclaving and microwave cooking to realize the stability of the developed multiplex
system. Subsequently, the assay sensitivity and specificity were evaluated by testing
under binary and ternary admixture of target meats analysis. Adulteration as well as
fraudulent labeling in the meat products is an emerging and sensitive issue. However, to
identify the origin of meat in the food chain has been a concern for the protection of
consumer right, public health, religious believe etc. (Arslan, Ilhak, & Calicioglu, 2006).
Therefore, it is a universal desire that does not substitute the high valued declared species,
entirely or partially with other lower value ones (Mafra, Ferreira, & Oliveira, 2007). Beef,
buffalo and pork are the major meat of economic, religious and health concern. Although,
a vast majority of the world’s populations prefers beef to buffalo, but beef is totally
forbidden for Hindus. Beef is also avoided in some places because of the scary of bovine
spongiform encephalopathy or mad cow disease (Dalmasso et al., 2004). On the other
Page 36
12
hand, pork is a popular meat in most of the western countries in spite of its total
unacceptability to the Muslims and Jewish consumers (Ali et al., 2012a). Furthermore,
the sensitivity and efficiency of the PCR assay often reduce in case of food and meat
products due to the presence of various spices and additives which act as inhibitor for the
binding of primers at specific site (Bottero, Civera, Anastasio, Turi, & Rosati, 2002;
Calvo, Zaragoza, & Osta, 2001b; Di Pinto, Forte, Conversano, & Tantillo, 2005).
Therefore, finally, the developed assay was validated under various laboratory made
model and commercial food matrices such as burger, meatball and frankfurter which are
popular and available. Thus, the novel assay demonstrated sufficient merits to be used by
regulatory bodies for beef, buffalo, and pork authentication even in degraded specimens.
1.6 Thesis Organization
This thesis comprises of six chapters namely introduction, literature review, materials
and methods, results, discussion and conclusion and future recommendations. The
contents of each chapter are described below:
Chapter 1 (Introduction): This chapter described briefly the background of the
study, project rational, problem statement, objectives and scope of the present research. I
described here, importance of the present research, with a short description of the
drawback of the previous work and also explained the innovation of the present method
to overcome the limitation of the previous reports.
Chapter 2 (Literature Review): This chapter consist of detailed literature review on
importance of food authentication, prevalence and impact of food fraud, importance of
bovine, buffalo and porcine detection, current species identification techniques and
validation of PCR methods.
Page 37
13
Chapter 3 (Materials and Methods): All materials and protocols as well as
bioinformatics tools used in this study were described in this chapter.
Chapter 4 (Results): Outcome of the experiments were illustrated here, these include
extraction of DNA, designed of biomarkers, specificity of biomarkers, sensitivity and
validity of the assay in various matrices and PCR products authentication.
Chapter 5 (Discussion): The experimental findings and outcomes were elaborately
discussed and compared with previous reports.
Chapter 6 (Conclusion and Recommendation): Finally, findings summary of the
present study including remarks and suggestion of future research were presented here.
Page 38
14
LITERATURE REVIEW
2.1 Influence of Animal Materials in Food Chains and Needs of Authentication
Definitive identification and quantification of animal materials have enormous interest
in food, pharmaceutical and personal care products. Authentication of animal materials
limits the spread of zoonotic threats, prevents unfair competition in business settings,
boosts up consumer confidence and product sales, and brings long term benefits in public
health, social harmony, economic growth and biological conservation of endangered
species (Goffaux et al., 2005; Kitpipit, Sittichan, & Thanakiatkrai, 2014). In this regard,
public awareness, regulatory laws and authentication tools work side by side to achieve
these overall objectives.
Meat and meat products are widely consumed worldwide as a source of high quality
protein, essential amino acids, vitamins and necessary minerals (Bai et al., 2009; Bender,
1992). According to Pimentel & Pimentel (2003) approximately two billion people
globally depend primarily on meat-based diet to meet their protein demands. The
Organization for Economic Cooperation and Development (OECD) and Food and
Agriculture Organization (FAO) data sources reflected that in 2015 global livestock and
meat consumption was roughly 198 million kg (OECD/FAO, 2016). Thus the huge
markets and opportunities of meat and meat products have made them especially
susceptible to adulteration and fraud labeling (Ali et al., 2014c). Survey reports of various
markets reflect that the practice is going on in rampant all over the world. For example,
68% of meat products in South Africa (Cawthorn, Steinman, & Hoffman, 2013), 19.4%
in the USA (Hsieh, Woodward, & Ho, 1995), 33% in the Gulf countries (Bourguiba-
Hachemi & Fathallah, 2016), 22% in Turkey (Ayaz et al., 2006) and 8% in the UK (Ali
et al., 2014c) were found to be mislabeled; especially beef and mutton were frequently
substituted by pork, buffalo and horse meat in various instances (Ali et al., 2015c;
Page 39
15
Cawthorn et al., 2013). It has been posing a great threats to public health because some
animal species are the potential careers of multiple infecting agents that can infect humans
and bring a regional emergency (Ali et al., 2014c). The US department of Agriculture
(USDA) alerted that approximately 75% of human infections may come from animal
products either by direct or indirect contact in different routes (USDA, 2015).
Animal materials and meat scandals can also provoke social unrest and take innocent
lives. For example, beef is prohibited for the Hindus and pork is forbidden for the
Muslims, Jewish and selective denominations Christians. Therefore, the indiscriminate
uses of these materials are very sensitive religious and social issues and might destroy
social harmony. For example, a man was killed and his family members were seriously
beaten in the city of Dadri in India by a group of radical Hindus based on a false rumor
that beef was kept in his refrigerator is a strong piece of evidence that meat scandal can
provoke social unrest and take innocent lives (Matthew, 2015). Therefore, it is a vital
need to assure that meat and meat products are not adulterated and properly packaged,
labeled and marketed for the safeguard of public health, religious faiths and of course
fair-trade economic practices in food businesses (Kitpipit et al., 2014).
2.1.1 What We Mean by Adulteration
According to Food and Drug Administration (FDA), adulteration is the replacement
of higher valued ingredients by cheaper ones for the purpose of economic gain. Thus food
adulteration is defined as a deliberate act of degrading the quality of food products by
fraudulent admixing or substituting lower-grade ingredients for its highest valued
counterparts for financial gain or additional profit (Rahman, 2015a).
According to Federal Food, Drug, and Cosmetic (FD & C) Act (2002, Sec. 402) of the
United States (Adulterated Food, 2002; Rahman, 2015a), a food shall be deemed to be
adulterated:
Page 40
16
a) “If it bears or contains any poisonous or deleterious substance which may render it
injurious to health.
b) If it bears or contains a pesticide chemical residue, food additive, or a new animal drug
(or conversion product thereof) that is unsafe for public health.
c) If it consists in whole or in part of any filthy, putrid, or decomposed substance, or if it
is otherwise unfit for food.
d) If it has been prepared, packed, or held under insanitary conditions whereby it may
have become contaminated with filth, or whereby it may have been rendered injurious
to health.
e) If it is, in whole or in part, the product of a diseased animal or of an animal which has
died otherwise than by slaughter.
f) If its container is composed, in whole or in part, of any poisonous or deleterious
substance which may render the contents injurious to health.
g) If it has been intentionally subjected to radiation, unless the use of the radiation was
in conformity with a regulation or exemption in effect.
h) If any valuable constituent has been in whole or in part omitted or abstracted therefrom.
i) If any substance has been substituted wholly or in part therefore.
j) If damage or inferiority has been concealed in any manner.
k) If any substance has been added thereto or mixed or packed therewith so as to increase
its bulk or weight, or reduce its quality or strength, or make it appear better or of greater
value than it is”.
On the other hand, the European Union (EU) has not clearly defined the term of food
fraud or food adulteration, but the term was recognized as an intentional action that
occurred for the purpose of monetary profit. The aim of the EU food law include to
prevent (i) deceptive or fraudulent practices; (ii) food adulteration and (iii) any other
activities which may cheat the consumers (Avery, 2014; Rahman, 2015a). The EU
Page 41
17
introduced the food law regarding food safety to protect consumers’ health. The EU
requirements of the food safety are as follows:
“i) Food shall not be placed on the market if it is unsafe.
ii) Food shall be deemed to be unsafe if it is considered to be: (a) injurious to health;
(b) unfit for human consumption.
iii) In determining whether any food is unsafe, the following criteria should be
addressed: (a) if the normal conditions of the food consumed by people and the safety is
controlled at each stage of production, processing and distribution, and (b) if necessary
information is provided to the consumer, including the general information on the label,
or other information concerning the avoidance of specific adverse health effects from a
particular food or category of foods.
iv) In defining whether any food is injurious to health, regard shall be had: (a) not only
to the probable immediate and/or short-term and/or long- term effects of that food on the
health of a person consuming it, but also on subsequent generations; (b) to the probable
cumulative toxic effects; (c) to the particular health sensitivities of a specific category of
consumers where the food is intended for that category of consumers.
v) In determining whether any food is unfit for human consumption, regard shall be
had to whether the food is unacceptable for human consumption according to its intended
use, for reasons of contamination, whether by extraneous matter or otherwise, or through
putrefaction, deterioration or decay.
vi) Where any food which is unsafe is part of a batch, lot or consignment of food of
the same class or description, it shall be presumed that all the food in that batch, lot or
consignment is also unsafe, unless following a detailed assessment there is no evidence
that the rest of the batch, lot or consignment is unsafe.
Page 42
18
vii) Food that complies with specific Community provisions governing food safety
shall be deemed to be safe insofar as the aspects covered by the specific Community
provisions are concerned”.
The government of Malaysia established the Department of Standards Malaysia whose
aims include the protection of consumers’ health and safety by assuring the standard of
the manufacturing and trade of halal food (MS, 2009; Rahman, 2015b). According to the
Department of Standards Malaysia food and drink and/or their ingredients permitted
under the Shariah law must fulfill the following criteria:
“a) It does not contain any parts or products of animals that are non-halal by Shariah
law or any parts or products of animals which are not slaughtered according to Shariah
law;
b) It does not contain najs (dogs and pigs and their descendents/non-halal
contaminants) according to Shariah law;
c) Food should be safe for consumption, non-poisonous, non-intoxicating or non-
hazardous to health;
d) Food not prepared, processed or manufactured using equipment contaminated with
najs according to Shariah law;
e) Food does not contain any human parts or its derivatives that are not permitted by
Shariah law;
f) During its preparation, processing, handling, packaging, storage and distribution,
the food items a), b), c), d) or e) or any other things that have been decreed as najs by
Shariah law”.
Page 43
19
2.1.2 Mislabeled Food
Food fraud practice is not a new innovation but it has been started since the Roman
and Greek Empires, there were rules concerning the adulteration of wines with colors and
flavors (Charlebois, Schwab, Henn, & Huck, 2016; Shears, 2010).
A food control regulation was established in Germany and France in 13th century. At
the same time, King John prepared a circulation of penalties for bread adulteration in
England (Shears, 2010). However, deceptive mislabeling of food products, especially
meat and meat products, particularly the expensive one, has recently becomes a
widespread issue (Rojas, González, García, Hernández, & Martín, 2012). For example,
according to Agriculture’s Food Safety and Inspection Service (FSIS) about 12,566
pounds of pork, beef, and poultry products were recalled due to mislabeled in 2015 (FSW,
2015). In 2015, another mislabeled scandal, imported and farm raised about 25,000
pounds of shrimp was sold as wild caught product (FSN, 2015). Moreover, Chuah et al.,
(2016) found 78.3% of tested samples were mislabeled in Malaysia.
These have increased consumer’s concern about the composition and origin of food
products, particularly in meat and meat products (Rojas et al., 2011). Appropriate product
labeling with proper description is very conclusive for consumers because it respects
personal food choice, safeguards the public health, assures fair trade and religious belief
(Ali et al., 2015d). The authenticity of the finished food product's depends on their
compliance with labeling rules and regulations, mainly in terms of the composition of
ingredients, manufacturing methods and practices, genetic identity and technology
(Charlebois et al., 2016).
Under the Federal Food, Drug, and Cosmetic Act of United State section 403 (MBF,
2002) stated that a food considered as misbranded or mislabeled-
Page 44
20
“ a) If its labeling is false or misleading in any particular, or its advertising is false
or misleading in a material.
b) If it is offered for sale under the name of another food.
c) If it is an imitation of another food, unless its label bears, in type of uniform size
and prominence, the word ‘‘imitation’’ and, immediately thereafter, the name of the
food imitated.
d) If its container is so made, formed, or filled as to be misleading.
e) If in package form unless it a label containing (1) the name and place of business
of the manufacturer, packaging provider, or distributor; and (2) an accurate statement
of the quantity of the contents in terms of weight, measure, or numerical count, except
that under clause (2) of this paragraph reasonable variations shall be permitted, and
exemptions as to small packages shall be established, by regulations prescribed by the
Secretary.
f) If any word, statement, or other information required by or under authority of this
Act to appear on the label or labeling is not prominently placed thereon with such
conspicuousness (as compared with other words, statements, designs, or devices, in
the labeling) and in such terms as to render it likely to be read and understood by the
ordinary individual under customary conditions of purchase and use.
g) If it purports to be or is represented as a food for which a definition and standard of
identity has been prescribed by regulations as provided by section 401, unless (1) it
conforms to such definition and standard, and (2) its label bears the name of the food
specified in the definition and standard, and, insofar as may be required by such
regulations, the common names of optional ingredients (other than spices, flavoring,
and coloring) present in such food”.
Page 45
21
2.1.3 Prevalence of Meat Food Fraud
The demand for meat and meat products are rapidly increasing with the increasing
world’s population. Unfortunately, despite having national and international rules and
regulation in most of the countries (Kitpipit et al., 2014), adulteration of meat and meat
products is going on in rampant; this is just to make extra profit and outweigh the honest
companies in the competitive markets (Ali et al., 2012a; Hou et al., 2015). The recently
made grouper (Epinephelus marginatus) meals authentication studies in Madrid
restaurant reflect that only 9 out of 37 samples contained authentic species (Asensio,
2008) and 22% meat products 22% in Turkey were mislabeled (Ayaz et al., 2006), 19.4%
in the USA (Hsieh, Woodward, & Ho, 1995). Similarly, false or wrong labeling were
found in about 8% meat products in the United Kingdom and 15% in Switzerland (Ali et
al., 2014c). Fraud labelling was also found in the deer products, particularly blood, heart
and antler products as elucidated by Zha, Xing, & Yang (2010). Ulca, Balta, Çağın, &
Senyuva, (2013) demonstrated that chicken and turkey were found instead of beef in
100% beef labeled meatballs and no bovine DNA was found in sausages labeled as 5%
beef in Turkey. Verification of beef and pasta products in the UK showed that 29 out of
2501 samples contained 1% horse DNA (Castle, 2013). The Food Safety Authority of
Ireland also detected horse DNA in 37% of the tested beef burgers and 85% of them also
contained pig DNA (Walker, Burns, & Burns, 2013). Cawthorn et al. (2013) found that
68% (95 of 139) samples of burger patties, sausages and deli meats contained species
which were not indicated on the product labeling. Pig DNA was detected in 30% of burger
and patties, 52% of sausages, 32% of deli meats and 38% of minced meat products as
undeclared species. Al-Nassir et al. (2014) identified undeclared species in 24% of beef
burgers and minced meat samples. A total of 105 imported beef products were analyzed
by Bourguiba-Hachemi et al. (2016) in the Arabian Gulf regions, and they found positive
results for pig and horse species in 26% and 7% of the tested samples. Recently, police
Page 46
22
seized over 20 tons of fake beef which was made up from chemically treated pork in
Shaanxi province of China (Tan, 2013). In another incident, Chinese police arrested 904
suspects who were involved in the selling of processed rat meat as lamb (Buckley, 2013).
In the recent years, Malaysia also faced some challenges such as porcine DNA in Cadbury
chocolate (Rahman et al., 2015b), lard in bread and pig intestine casings in sausages
(Man, Aida, Raha, & Son, 2007). Surprisingly, Clear Labs identified human and rat DNA
in burger samples in northern California (Kowitt, 2016). The Clear Labs also found
porcine DNA in beef burgers and beef DNA was found in ground lamb and pathogens
DNA was found in 4.3% of tested food products (Kowitt, 2016; Labs, 2016). The above
incidents are just some of the many phenomena of animal product adulterations that are
taking place all over the world but sufficient to demonstrate that food products should be
authenticated for their animal origins to promote fair-trade economic practices and
prevent fraudsters from harming our public health, religious faith and personal budgets.
2.1.4 Impact of Food Fraud
Deceiving consumers by selling fraud foods is not a current issue. It not only causes
an economic loss but also may put consumer on serious health risk because some people
are allergic to certain food ingredients. In the 18th and early 19th centuries, numerous
poisonous substances were used as food additives, for examples, chalk and alum were
added as an whitening agent in bread; and sawdust, pipe clay or calcium sulfate was used
to increase the volume or the weight of the bread (Tähkäpää, Maijala, Korkeala, & Nevas,
2015). During that time, lead was mixed with beer and wine; and sand, dirt and other
leaves were regularly added to tea, coffee and spices (Schumm, 2014). In 1902, Dr.
Harvey W. Wiley and co-workers who are known as the Poison Squad showed that food
preservatives which were used at that time such as copper sulfate, sulfuric acid, borax and
formaldehyde have the adverse effect in the body (Schumm, 2014). A remarkable
incidence involving toxic oil syndrome that took 300 initial deaths and finally a total of
Page 47
23
1663 deaths out of 20,000 affected people in Spain in 1981 due to the consumption of
industrial oil as olive oil (Borda et al., 1998; Gelpí et al., 2002). Another thunder like
fiasco was the Chinese milk and baby formula adulteration with melamine in 2008 (Guan
et al., 2009). After ingesting the melamine contaminated infant formula and milk,
approximately 300,000 infants and children were affected with urinary tract stones and at
least six were killed (Reshanov, 2008). In 1986, 23 persons were died due to methanol
contamination with wine in Italy (Tähkäpää et al., 2015).
Although meat and meat products forgery is not so much detrimental to health, it is a
very sensitive religious and cultural issues that might provoke social unrest and extirpate
certain endangered species from the world’s natural habitats. Meat wholesaler of Japan
mislabeled imported beef as domestic beef during the government buyback program after
the bovine spongiform encephalopathy (BSE) crisis (Yeboah & Maynard, 2004). In 2005,
Sudan (non-permitted color) was found in some meat products in China (Jia & Jukes,
2013). In 2003, inedible poultry meat of pet food plant got entry into the food chain in
the UK (FSA, 2004). A severe food crisis was exposed in Belgium due to contamination
of cancer-causing dioxin and polychlorinated biphenyls (PCBs) in 1999 (Covaci et al.,
2008). The crisis happened due to the contamination of fat used for the production of
animal feed with 1 gm dioxins and 50 kg PCBs; this resulted in adverse effect on domestic
and export market of poultry and pork because about 2500 poultry and pig farms were
affected (Buzby & Chandran, 2003; Covaci et al., 2008) and the USA cancelled the import
of certain types of food products from the entire European Union (Kennedy, Delaney,
McGloin, & Wall, 2009). In Ireland, the Irish pork dioxin crisis in 2008 affected pork
market because approximately 10% pig was affected due to the feeding of dioxin
contaminated feed. Consequently, all pork products which were manufactured during this
time were recalled, causing huge loses to the manufacturing industries (Kennedy et al.,
2009). Poultry and beef of unknown sources were repackaged and marketed illegally as
Page 48
24
human food in Northern Ireland (Tähkäpää et al., 2015); in 2007 poultry were diseased
and blanched, was marketed for human consumption in the UK (North, 2013; Rahman,
2015a) and in 2006, approximately 150 tons of spoilt meat was distributed Germany
(Anonym, 2007). These incidences reflect that adulteration and/or mislabeling of food
was a common issue worldwide for many years ago to till date and conceivably a never-
ending event. Consumers are not only the victim of food forgery, but also the government
and even some time businessmen are greatly affected (Rahman, 2015a). Regarding the
social and cultural issues, Mr. Mohammad Akhlakh was killed and his family members
were beaten severely by a radical Hindu mob in Dadri in India because rumor was spread
that the family had consumed beef and also stored in the refrigerator for future uses
(Matthew, 2015). Thus, authentication of food ingredients bear huge influences to
safeguard our public health, food choice and preferences and of course religion
compliances (Ali et al., 2014a).
2.2 Importance of Cow, Buffalo and Pig Species Detection
2.2.1 Meat Sources
Meat and meat products are an important part of the human diet because they contain
proteins and essential amino acids as well as minerals, vitamins and micronutrients which
are very essential for the development, growth and good activities of the body organisms
(FAO, 2014; Pimentel & Pimentel, 2003). Especially, high nutrient containing foods such
as meat and meat products are essential for children and women as well as the
communities infected with HIV or AIDS (FAO, 2014). Consequently, many countries
consider the meat-based diet as one of the basic and significant nutritional food and
establishing an important part of the food manufacturing industry. Thus, approximately 2
billion populations depend primarily on meat-based food worldwide (Pimentel &
Pimentel, 2003). The common meat source is livestock species such as cow, pig, buffalo,
goat, sheep and poultry (Herrero, Royo, Lago, Vieites, & Espiñeira, 2013). Among the
Page 49
25
livestock species, cow, buffalo and pig are the popular and a major source of meat and
meat products regarding the cultural, lifestyle, religious and geographical preferences.
Global production and consumption of meat increasing dramatically day by day
commensurating the linear rising in the global human population (Wanapat &
Chanthakhoun, 2015). According to Worldwatch Institute, production of meat has
increased 3 times during the last four decades and it has been risen 20% in the last decade
(Rousseau, 2016; WWI, 2017). Moreover, Todd Reubold assumed that consumption of
global meat will be increased more than 4% per capita over the next 10 years (Reubold,
2015). FAO reported that annual meat consumption increased from 10 kg to 26 kg
between 1960 and 2000 and it has been projected that it will increase further to 37 kg over
the year 2030 (Wanapat & Chanthakhoun, 2015). The figure of meat consumption per
capita per year in different countries as projected by the Organization for Economic
Cooperation and Development (OECD) is given in Figure 2.1 (OECD, 2017b).
A list of highest meat consuming countries with the total amount (Kg) of meat (beef
and veal, pork, sheep and poultry) consumed per capita in 2015 was calculated and
illustrated in Figure 2.2 from the OECD data (OECD, 2017b).
The Figure 2.2 clearly shows that the United States is the highest meat consuming country
wherein each person eats about 95.4 kg of meat per year or nearly 260 gm per day.
Whereas each resident in South Africa consume 47.8 kg of meat per year or about 130
gm a day as the lowest meat eating country. The global average meat consumption of an
adult in 2014 was 34 Kg and it will increase to 35.5 kg by 2024. Therefore, global
consumption of meat will increase more than 4% per capita over the next decade
(Reubold, 2015). To fulfil the global annual meat demand, the huge numbers of livestocks
and poultry are required, such as 1.5 billion cows, 1 billion sheep, 1 billion pigs and 19
billion chickens, it is more than three times the number of the world population (Reubold,
Page 50
26
Figure 2.1: Consumption of meat (beef and veal, pork, lamb and poultry) by different countries in 2015 as projected by OECD.
(data source: OECD, 2017b)
Page 51
27
Figure 2.2: List of top meat (beef and veal, pork, sheep and poultry) consuming countries in 2015 (Kg per capita, per year)
(data source: OECD, 2017b)
95.492.5
86.381.3 80
75.2 74.868.3 68.1
63.857.9
54.1 52.4 51.9 50.8 50 47.8
0
20
40
60
80
100
120
Kg
per
cap
ita,
per
year
Page 52
28
2015). According to the FAO, 25 million of cows, buffalo, goats and sheep are increasing
annually (Reubold, 2015) and to meet the yearly meat consumption demand, about 9
billion livestock are required only in the United States and it is about 5 times more than
the US people (Pimentel & Pimentel, 2003).
Livestock animals also have a major impact on the environment as said by the
prominent ecologist, Brain Machovina that “The livestock sector is responsible for
approximately 15 percent of all human greenhouse gas emissions which is equivalent to
all the direct emissions from transportation” (Reubold, 2015). In 2014, the five highest
beef consumed per capita were Argentina, Uruguay, Brazil, the United States and
Australia. It has been predicted that five more countries such as Vietnam, Indonesia,
Mozambique, Turkey and Tanzania will be included in the list of top beef consumption
countries between 2014 and 2024 (Reubold, 2015). According to an EU livestock survey,
cows represent 18.8% of total animal output and 8.1% of agricultural yield. Production
of beef in the EU has increased by 7% for young cattle and calves and 3% for adult cows
from 2009 and 2014 (Marquer, Rabade, & Forti, 2015). Whereas pork denoted 9.0% of
the total EU agricultural output .
The scenario of the total consumption of livestock meat and poultry in 2015 was
represented by Pork checkoff from the USDA Foreign Agricultural Service and UN Food
and Agricultural organization data source (Figure 2.3). According to the pie chart, the
highest proportion of consuming meat was pork with 40.1% of the total and the second
largest consumption was a poultry accounted for 34.1%, followed by beef with 21% in
2015 (Anonym, 2016b).
From the report of FAO 2008, the estimated global buffalo population is
approximately 177 million and 97% (171 million) of that are found in Asia, while the rest
of the buffaloes (3%) are found in other countries (Wanapat & Chanthakhoun, 2015).
Page 53
29
In Asia, only 21.0% of the total meat production comes from livestock species and buffalo
meat constitutes approximately 11.52% of the total livestock meat (Cruz, 2010). The
consumers did not like buffalo meat in the past and so there was very little trading in the
past century, but now buffalo meat consumption has been greatly increasing day by day.
This is because buffalo meat contains significant attribute such as low cholesterol, fat
(below 2%) and calories but higher in iron and essential amino acids as well as free from
Mad Cow Disease (Badpa & Ahmad, 2014). As a result, the global buffalo population
has increased annually by about 1.49% over the last 10 years (Badpa & Ahmad, 2014).
Similarly buffalo meat marketing is also growing up significantly. The highest buffalo
meat exporter countries are India, Brazil and Australia, but India is the largest exporter
among these countries. According to USDA outweigh 2.4 million tons buffalo meat were
exported from India, where as Brazil and Australia exported 2.0 and 1.5 million tons,
respectively in 2015 (Wikipedia, 2016). Since 2011, export of buffalo meat from India is
Figure 2.3: World meat and poultry consumption shares in 2015. Sources: USDA
Foreign Agricultural Service, UN Food and Agricultural Organization. 1Includes turkey
consumption for 2014, the most recent year for which data are available, 2Includes
mutton/goat consumption for 2011, the most recent year for which data are available
(Anonym, 2016b).
Page 54
30
increasing yearly on average approximately 14% and India earned more than 4.8 million
US dollars in 2014 (Cruz, 2010).
2.2.2 Domesticated Animals as a Source of Meat
Cow, buffalo and pig are among the five major domestic livestock animals and their
production rate are increasing greatly day by day. Table 2.1 shows the comparative
production of five top animal species between 2000 and 2013 (FAO, 2015).
Table 2.1: Top five livestock production in 2000 and 2013 (data source: FAO, 2015)
Species 2000
(thousand heads)
2013
(thousand heads)
Rate of Increase
(%)
Cattle 1,302,895 1,494 349 14.69
Buffaloes 164,114 199,784 21.73
Pigs 856,241 977,021 14.10
Sheep 1,059,082 1,172,833 10.74
Goats 751,632 1,005,603 33.78
2.2.2.1 Cow (Bos taurus)
Among the domesticated animals, cows are the largest and most common. They were
domesticated approximately 10,500 years ago and they belong to Bovidae family and Bos
genus (Bollongino et al., 2012). Cows are basically identified as three different species,
according to region:
i) Bos taurus, which are called "taurine" cattle or European cattle and they also include
identical species from Africa and Asia.
ii) Bos indicus, which are called zebu and
iii) Bos primigenius which are known as the aurochs and currently become extinct.
However, the ancestor of both zebu and taurine cattle is the aurochs. Thus, these three
groups were classified again as one species: Bos taurus, but divided into three subspecies
such as
Page 55
31
i) Bos taurus taurus
ii) Bos taurus primigenius and
iii) Bos taurus indicus (Wilson, & Reeder, 2005).
Domesticated cows are very important for human beings because they fulfill a major
part of the human food chain by providing meat and milk and it is assumed that about
half proportion of the global meat comes from cow (Rickard, & Book, 1999). Cow milk
is further used for the production of many dairy products such as butter, cheese, yogurt
etc. They are also used in medicine, leather, soap and glues (Dewey, 2017). According to
the OECD report Uruguay is the highest beef consuming country in 2015, the amount of
meat consumed per capita 46.4 kg (Figure 2.4) (OECD, 2017b). About 40.4 kg beef was
consumed by an adult of Argentina since this country is the second highest in beef
consumption. One person of US consumed 24.7 kg in 2015 whereas Brazil and Australia
consumed 24.2 and 22.8 kg respectively.
2.2.2.2 Water Buffalo (Bubalus bubalis)
There are two types of water buffaloes are recognized, based on behavioural and
morphological characteristic such as
i) River buffalo in Indian subcontinent and domesticated about 5,000 years ago and
ii) Swamp buffalo found in China and domesticated approximately 4,000 years ago
(Yang et al., 2008).
Water buffalo belong to genus Bubalus, species bubalis and is the member of the
Bovidae family. The ancestor of wild water buffalo (Bubalus arnee) is found to be same
of the domestic water buffalo (Lau et al., 1998). The International Commission on
Zoological Nomenclature concluded about naming of domestic and wild buffalo by ruling
the valid in the scientific name of wild species as Bubalus arnee, whereas domestic
buffalo is Bubalus bubalis in 2003 (Gentry, Clutton-Brock, & Groves, 2003).
Page 56
32
Figure 2.4: Consumption of beef by different countries in 2015 (data source: OECD, 2017b).
22.8
17.4
6.69
9.648.75
14.5
8.28
24.7
3.8
40.4
0.89
24.2
15.0
3.82
12.110.1
2.520.73
3.47
0.511.94
2.88
20.2
16.9
5.70
0.831.66
6.32
25.6
4.663.03
12.1
3.91
10.7
6.254.09
1.75
6.64
46.4
8.699.12
6.43
3.17
14.0
4.29
10.8
0.0
5.0
10.0
15.0
20.0
25.0
30.0
35.0
40.0
45.0
50.0A
ust
rali
a
Can
ada
Jap
an
Ko
rea
Mex
ico
New
zea
Lan
d
Turk
ey
Un
ited
Sta
tes
Alg
eria
Arg
enti
na
Ban
gla
des
h
Bra
zil
Ch
ile
Ch
ina
Co
lom
bia
Egy
pt
Eth
iopia
Gh
ana
Hai
ti
Ind
ia
Ind
on
esia
Iran
Isra
el
Kaz
akhst
an
Mal
aysi
a
Moza
mb
ique
Nig
eria
Pak
ista
n
Par
aguay
Per
u
Phil
ipp
ines
Ru
ssia
Sau
di
Ara
bia
Sou
th A
fric
a
Sud
an
Tan
zan
ia
Thai
land
Uk
rain
e
Uru
gu
ay
Vie
t N
am
Zam
bia
Worl
d
Sub
-Sah
aran
Afr
ica
OE
CD
BR
ICS
EU
28
Kg p
er c
apit
a, p
er y
ear
Page 57
33
Demand of meat-based foods are increasing due to the growth of world human
population, particularly in developing countries (Wanapat & Chanthakhoun, 2015). Thus,
the world meat production will increase 16% in 2025 than the period 2013-15 (OECD,
2017a). Buffalo meat is considered to be a strong source for fulfilling of this increasing
meat requirement (Borghese, 2005). Moreover, buffalo meat is realized as important for
its local usage and potential export material in recent years. In addition, buffalo meat is
known as healthful for human diet among red meats since it contains lower calories,
cholesterol and intramuscular fat, higher amount of essential amino acids, mineral and
biological value (Badpa & Ahmad, 2014). It is assumed that more than 150 million water
buffaloes are farmed commercially worldwide today, which are farmed for meat, milk
and leather production (Anonym, 2017c). India is the largest buffalo meat producing and
exporting countries worldwide. Global population of buffalo is 180.7 million, among
these buffalo populations in India is about 98.6 million (54.5% of total population)
(Wanapat & Chanthakhoun, 2015). However, India exported 1,475,526 tons of buffalo
meat in 2014-15 (Krishnakumar & Bureau, 2015).
2.2.2.3 Pig (Sus scrofa)
It is believed that pigs (Sus scrofa) were domesticated about 9,000 years ago from wild
boar. They are native in Europe and parts of Asia and gradually spread to many areas of
the world (Compassion, 2017). The scientific name of domestic pig is usually given as
Sus scrofa, although some scientists call as Sus scrofa domesticus. Pork checkoff listed
10 countries which were produced the highest amount of pork in 2015 (Figure 2.5). In
2015, the largest pork producing country was china with the values of 54.87×10⁶ metric
tons, followed by European Union accounted for 23.35×10⁶ and the third highest was
Brazil with the amount of 11.121×10⁶ metric tons. Whereas Japan was the lowest pork
producing country among the top 10 countries by producing 1.254×10⁶ metric tons in
2015 (Checkoff, 2016).
Page 58
34
Figure 2.5: Top 10 pork-producing countries in 2015 (data source: USDA Foreign
Agricultural Service) (Checkoff, 2016).
On the other hand, European Union exported the largest proportion of the global pork
export making 33% of the total in 2015. The second highest exporter was the United
States, which was 31% of the total, followed by 17% in Canada, 9% in Brazil, 3% in
China, 2% in Chile and Mexico, 1% in other countries respectively (Figure 2.6)
(Checkoff, 2016).
54.87
23.35
11.121
3.519 2.615 2.45 1.87 1.37 1.323 1.2540
10
20
30
40
50
60
×10
6M
etri
c T
ons
Page 59
35
In case of pork consumption, OECD represented the data for the per capita
consumption in 2015 (Figure 2.7). The EU was the highest pork consuming country
comprised 33.0 kg per capita and the second largest pork consuming country was China
accounted for 31.6 kg per capita, followed by 29.1 kg in Viet Nam, 28.4 kg in Korea, 23.2
kg in OECD countries, 22.7 kg United States, 20 kg in Australia, 18.3 kg in Russia, 18.1
kg in New Zealand and 17.5 kg in Cheli. Very little amount of pork consuming countries
includes Algeria, Bangladesh, Egypt, Iran, Pakistan and Sudan as there are Islamic
countries (OECD, 2017b).
Figure 2.6: Global pork export in 2015 (Checkoff, 2016)
Page 60
36
Figure 2.7: Global consumption of pork per capita in 2015 (data source: (OECD (2017), Meat consumption (indicator). doi: 10.1787/fa290fd0-en (Accessed on
06 March 2017)).
20.3
15.715.0
28.4
11.5
18.1
0.04
22.7
0.0
8.24
0.0
11.2
17.5
31.6
5.08
0.00.010.74
3.22
0.21
2.27
0.01.65
4.956.19
3.87
1.110.0
21.0
3.29
14.2
18.3
0.24
3.40
0.00.24
10.9
13.714.3
29.1
1.53
12.5
1.14
23.2
15.8
33.0
0.0
5.0
10.0
15.0
20.0
25.0
30.0
35.0
Au
stra
lia
Can
ada
Jap
an
Ko
rea
Mex
ico
New
zea
Lan
d
Tu
rkey
Un
ited
Sta
tes
Alg
eria
Arg
enti
na
Ban
gla
des
h
Bra
zil
Chil
e
Chin
a
Colo
mb
ia
Eg
yp
t
Eth
iopia
Gh
ana
Hai
ti
Ind
ia
Ind
ones
ia
Iran
Isra
el
Kaz
akh
stan
Mal
aysi
a
Mo
zam
biq
ue
Nig
eria
Pak
ista
n
Par
aguay
Per
u
Ph
ilip
pin
es
Russ
ia
Sau
di
Ara
bia
So
uth
Afr
ica
Su
dan
Tan
zania
Th
aila
nd
Uk
rain
e
Uru
gu
ay
Vie
t N
am
Zam
bia
Worl
d
Su
b-S
ahar
an A
fric
a
OE
CD
BR
ICS
EU
28
Kg p
er c
apit
a, p
er y
ear
Page 61
37
2.2.3 Religious Belief
Religious faith is also an important factor for the choice of food, particularly meat and
meat products. Most religions have their own assertion for the human food consumption,
specific food items are allowed to intake and others are prohibited (Meyer-Rochow,
2009). Any taboo can act as a protector and safeguard of the believers if it is considered
as the supreme instruction of God for religious and cultural activities. However, beef is
strictly restricted for Hindus since the cow is considered as a holy mother and very sacred
animal, but there is no prohibition in consumption of milk and milk products (Meyer-
Rochow, 2009). The recent incidence of killing a man and beating his family members
in the city of Dadri, India by a group of radical Hindus based on a false rumor of keeping
beef in his refrigerator indicates that beef is a very sensitive issue of Hinduism which can
provoke social unrest and take innocent lives (Matthew, 2015). While kashrut (food law
of Jewish) permits the ruminant animal species containing two criteria such as clove
hooves and chew the cud. Thus, cow, goat, deer, bison and sheep are allowed, but pig,
camel and rock Hyrax are forbidden for the Jews. They are prohibited to consume both
the meat and the milk together (Judaism, 2016; Regenstein, Chaudry, & Regenstein,
2003). Over the past decade, the demand of kosher (food permitted to the Jews) food
products has been increased drastically and currently it has been the new trend for food
products (Solanki, 2016). However, kosher market is expanding, particularly in the
United States and Europe as well as increasing availability of the kosher products (Jayalal,
2015; Lever, Bellacasa, Miele, & Higgin, 2010). It is calculated that approximately 40%
of the shelves products in the supermarkets of the USA are kosher and 125,000 kosher
products are available in US supermarkets and about 3,000 more are included in each year
and the number of kosher consumers more than 45 million worldwide (Buckenhüskes,
2015; KLBD, 2017). It has been reported that over 10,000 American companies
manufacture kosher products, followed by the Europe is the second highest contributor in
Page 62
38
world kosher food market (Solanki, 2016). According to annual food sales report kosher
products comprised of about 200 billion US dollars (40%) among the total food sales of
500 billion US dollars (Buckenhüskes, 2015). Mintel reported that 62% consumers buy
kosher for the reason of quality food followed by 51% people for general healthfulness
and 34% for food safety. Whereas only 14% consumers purchase kosher due to follower
of Jewish religion (Mintel, 2009). Report on supermarket represented that growth of
kosher certified products are 6%, whereas only 2% growth of non-kosher products and
kosher products captured about 80% of the Israel and 21% of the US retail market
(Anonym, 2017a).
The food, permitted to consume for the Muslim is defined as Halal food. The word
“Halal” is an Arabic word that is referred to as what is permitted and lawful by the Shariah
(Islamic Law) (Mohamed, Rahim, Ma’ram, & Ghazli, 2016). However, any food which
Muslim is allowed to consume as per the description of the Quran and Hadith (the saying
and practice of Prophet Muhammad (peace be upon him)) and the fiqah (interpreted by
Muslim scholars) are known as Halal (Regenstein et al., 2003). The Muslim believes that
Islamic Shariah allowed only the food which are beneficial for health and restricted that
are harmful for the body as described in the holy book Quran (Anonym, 2017b; Halalce,
2017).
“O mankind! Eat of that which is lawful and good on the earth, and follow not the
footsteps of Shaitan (Satan). Verily, he is to you an open enemy”. (Quran 2.168)
“O you who believe (in the Oneness of Allah Islamic Monotheism)! Eat of the lawful
things that We have provided you with, and be grateful to Allah, if it is indeed He Whom
you worship”. (Quran 2.172)
“He has forbidden you what dies of itself (carrion), and blood, and the flesh of swine
and that over which any name other than (that of) Allah has been invoked”. (Quran 2.
173)
Page 63
39
Thus, halal animals include cows, buffaloes, goats, sheep, camel, duck, goose,
chicken, ostrich, turkey etc. if they are slaughtered according to Sharia law. On the
contrary, pork is one of the most common non-halal food for Muslims and also forbidden
for select Christian denominations. The other non-halal foods are horse, dog, cat, alcohol
etc. Recently, halal food market is expanding rapidly and is becoming a mainstream of
the market due to increasing global Muslim population (Hanzaee & Ramezani, 2011).
Halal foods not only the religious concern, but also becoming a global sign of quality
products as well as a lifestyle choice (Hanzaee & Ramezani, 2011). It is reported that the
number of global Muslim population is about 1.8 billion and that population is growing
yearly at approximately 1.8% and projected to reach 36% of the global population over
2025 (Jeddah, 2011; MIHAS, 2013). According to Pew Research Center’s Forum on
Religion & Public Life the global Muslim population projected to reach from 1.6 billion,
representing 23.4% of the global population of 6.9 billion in 2010 to 2.2 billion,
representing 26.4% of the global total expected population of 8.3 billion over 2030
(Figure 2.8) (PewResearch, 2011).
Figure 2.8: Projection of global Muslim population, 1990-2030 (Adapted from:
PewResearch, 2011)
Page 64
40
However, it is considered that halal food is one of the rapidly growing food item all
over the world at present. Because halal foods comply not only halal standard, but also
comply the GMP, HACCP and other recognized quality or safety standards (HAC, 2017).
Thomson Reuters stated that according to Global Islamic Economy Report the growth of
global Muslim consumer expenditure on food and lifestyle products increased about 9.5%
from the past years and accounted for 2 trillion US dollar in 2013 and projected to reach
about 3.7 trillion US dollars by 2019 with the yearly growth rate of 10.8% (Newshalal,
2016; Rasid, 2016). It was estimated that world halal food trade growth about 4.44% over
2012 to 2016 (TIBDA, 2016). In 2015, the total expenditure of halal food and beverages
was 1.17 trillion U.S. dollars, representing about 17% of the total global expenditure of
7 trillion US dollars according to the report of Global Islamic Economy. Halal market
growth of this year was 3.4% from the year 2014, the value was slightly higher than the
global trade growth of 3.3% (GIE, 2016). Global Islamic Economy also estimated that
expenditure on the global food and beverage market projected to increase 1.9 trillion US
dollars over 2021 (GIE, 2016). They also reported that China was the highest expenditure
country on halal food accounted for US$ 854 billion, the second largest was United States
with the figure of US$770 billion, followed by Japan with the value of US$380 billion
and India with US$341 billion in 2015. On the other hand, expenditure on only halal food
products was about 795 billion US dollars in 2014, but this expected to rise by 2.537
trillion over 2019 (Newshalal, 2016).
The US halal food trade is also rapidly growing, it was reported that halal foods were
sold in about 200 shops in 1998 but the number rose to 7,600 at present (Green &
Giammona, 2016). In 2015, the number of total Muslim was 3.3 million in the US, but
the population projected to increase about 8.1 million over 2050 (Green & Giammona,
2016). Islamic Food and Nutrition Council of America (Halal certification authority)
reported that halal sales from supermarkets and restaurants are projected to $US 20 billion
Page 65
41
in 2016, increase to one-third from 2010 (Green & Giammona, 2016). US halal food sales
have risen approximately 70% from 1995 (Nikfarjam, 2016).
Furthermore, according to Global Agricultural Information Network (GAIN) report in
2013 the estimated Muslim population in EU was 20 million and the expenditure on halal
products was 30 billion, with the growth rate of about 15% and EU halal business
expected to grow by about 100 million US dollar in the next year (Journo & Salmon,
2013). France is considered as a highest Muslim population county in Europe and
accounted for approximately 4.7 million and its expenditure on halal products is about 8
billion US dollar. Moreover, the annual consumption of halal meat in French accounts for
about 400,000 tons, representing 10-15% of the total meat of the country (Journo &
Salmon, 2013). UK is another fast growing halal food market due to increasing Muslim
population. According to the national census, the number of UK Muslim population
increased from 1.55 million in 2001 to 2.71 million in 2011 (Evans, 2015). The estimated
total expenditure of UK Muslims on food and beverages was 6.3 billion US dollars in
2014 and this is projected to increase at 5% per year over 2020 (Evans, 2015). In the UK
more than 3,000 places are involved to supply the halal foods, for example, Subway offers
halal foods at about 202 outlets in the UK, KFC has about 100 outlets for sale halal menu
and Nandos also has 66 halal outlets (Evans, 2015; HexaResearch, 2016). Halal certified
food products market also rapidly expanded in the Middle East. The United Arab
Emirates established a Global center for Halal food accreditation to open in Dubai to
ensure the standard of Islamic Sharia and certification of all the halal goods opening the
UAE market and yearly imports of halal food will reach around 8.4 US dollars over the
decade (Anonym, 2016a; KhaleejTimes, 2014). Total population is Muslim in Saudi
Arabia and annual halal food trade is estimated at 5 billion US dollars (Jeddah, 2005).
Page 66
42
Department of Islamic Development of Malaysia (JAKIM) has been playing an
important role to implement the halal certification as well as monitor the halal food
products and enforces the halal laws and regulations among the manufacturers, importers,
distributors and restaurants since 1997. Malaysia has been well known globally as the
international halal hub because the government established the Halal Development
Corporation (HDC) for the control and support of halal the products in 2008 (GVR, 2017;
Nikfarjam, 2016). Moreover, Malaysian government also developed Standards Malaysia
(MS 1500:2004) to precisely describe particular guidelines for the preparation,
production, storage and handling of halal food in 2004 and then revised in 2009 (MS
1500:2009) (Samori, Ishak, & Kassan, 2014). In 2015, the total halal export of Malaysia
was 19.5 billion Malaysian Ringgit in the first half of the year with the growth of 3.6%
from the first six months of 2014, reported by Malaysia External Trade Development
Corporation Halal Unit (Rasid, 2016a).
Although Muslim, Christian and Jews are not strongly recommended vegetarianism
from the religious aspect, but the religion of ancient India such as Hinduism, Buddhism
and Jainism prefers the vegetarian lifestyle due to their religious obligation as well as
their worshipful, respectful and compassionate to all other animal life (Davidson, 2003;
Dudek, 2013). The impression on vegetarianism was strongest in Hindu religious people
due to originated revering of the cow is a sacred animal. The vegetarianism in the
Buddhism has arisen since the order of the Buddha to his followers for not killing the
lives (Davidson, 2003). On the other hand, Jains adhere vegetarian diet because they
belief that numerous nigodas are present in meat as well as in wine and honey and if they
intake these items means involve in violent death which impede their rectification of the
soul as they are comoletly ascetic (Davidson, 2003). It was estimated that the consumer
of plant-based food about 4 billion worldwide (Pimentel & Pimentel, 2003).
Page 67
43
2.2.4 Zoonosis
Zoonosis is the infection or disease that is naturally transmissible from animals to
humans. According to Department of Agriculture and Fisheries (2016) of the Queensland
Government over 200 zoonosis have been recognized these are caused by pathogenic
agents such as viruses, bacteria, fungi, parasites and prions. Among these 13 zoonosis are
more fatal because about 2.2 million people are died due to the infection of these
pathogens (Bryner, 2021). Nowaday, endemic zoonoses cause an extra pressure of
numerous diseases, specifically over the tropical zones and that also affect the livelihoods
and food supply chain due to loss of livestock production (Halliday et al., 2015). Despite
their detrimental affect, till date endemic zoonoses do not have proper recognition as well
as understanding (Halliday et al., 2015). United States Department of Agriculture stated
that about 60% of human pathogenic diseases are zoonosis and about 75% of infectious
diseases are caused by animal origin (USDA, 2015). The livestock animals responsible
for the maximum human zoonotic infections include cows, buffalos, pigs, goats, chicken,
camels and sheep (Bryner, 2021). McDaniel et al., 2014 reported that until now about 45
pathogens responsible for bovine zoonosis have been identified and that are uniformly
dispersed over the world. Among these the height percentages group is bacterial
pathogens accounted for 42%, followed by 29% of parasitic organisms, 22% of viruses,
55 of fungi and 2% of prions (Figure 2.9).
Page 68
44
Figure 2.9: Cattle zoonotic bacterial pathogens (Adapted from McDaniel et al., 2014
with permission).
Among the zoonosis “mad cow disease” or bovine spongiform encephalopathy (BSE)
is a fatal neurodegenerative disease, the origin of which is scrapie (spongiform
encephalopathy) of goats and sheep that has been identified in Europe in the 18th century
(Brown, Will, Bradley, Asher, & Detwiler, 2001). The BSE was first recognized in the
UK in 1986 where it produced a serious outbreak, resulting about 170,000 cattle were
infected, 4.4 million cattle were killed and a total of 164 people were died (Cleeland,
2009). As a result the national beef sale was fallen by 40% and international market sale
was also decreased drastically as well as the significantly fell the cost of beef in UK
(Buchanan, 2015). In 2003, consumption and export of beef were dramatically fallen in
Belgium due to BSE (Goffaux et al., 2005). In 2003, BSE was also found in Canadian
cattle, resulting the drastically fallen the beef export market and the Canadian beef
manufacturers lost of about 5.3 billion dollars by 2004 (Sylvain Charlebois & Haratifar,
2015). There is no doubt about the human’s susceptibility to the foot-and-mouth disease
(FMD) virus because until now the FMD virus has been recognized in over 40 people
cases. The symptoms in man are most likely that occurred in affected animals such as
Page 69
45
developing vesicle on the feet and hands, particularly on the fingers, sometime it also
appears on the palate and tongue of the mouth associated with fever (Bauer, 1997). The
main host of the FMD virus is livestock animals, including cattle, water buffaloes, pigs,
goats, yaks and sheep (Aftosa, 2014). Caron et al., 2016 (Caron, Cornelis, Foggin,
Hofmeyr, & de Garine-Wichatitsky, 2016) shown that buffalo is another spreading factor
of bovine tuberculosis and other zoonotic diseases. Buffalo is also a carrier of brucellosis
pathogen, which is a serious disease causes infertility and affect both human and animals
(Kats-korner, 2017; QLD.GOV, 2016). To stop the spread of brucellosis more than 3,000
buffaloes were killed in 1984 and about 1,000 buffaloes were killed between 1996 and
1997 in the Greater Yellowstone Area (Kats-korner, 2017). In addition, Buffalopox is
another significant zoonotic disease of domestic buffaloes which caused reduced
productivity as well as increased morbidity (Singh et al., 2006) and infect both cattle and
human. In 2003, an epidemic of buffalopox occurred in Aurangabad, India associated
with simultaneously infected to domestic buffaloes, cows and human (Gurav et al., 2011).
Approximately 400 buffaloes were owned and total morbidity reached 45% of the
affected buffaloes (Singh et al., 2006). Like cattle and buffaloes, pigs can also transmit
several zoonosis to human being including swine influenza, Q fever, leptospirosis,
Cryptosporidiosis, brucellosis, Rabies, Ringworm, Anthrax and Campylobacteriosis
(KingCounty, 2016; Morrow & Langley, 2017). Huang et al., (2002) discovered swine
Hepatitis E virus (HEV) in pigs of the United States and found that it has genetically
closely similarity to the HEV of human. As a result, hepatitis E is now conceivable to be
zoonosis. HEV is an outbreak in some countries, including the United States and made
an important issues regarding public health (Huang et al., 2002). Some common zoonotic
diseases associated with their carrier and route of transmissions is presented in Table 2.2.
Page 70
46
Table 2.2: List of zoonosis (GOV.UK, 2013)
Disease Causative agent Host/ affected animals Normal transmission mode
to humans
Anthrax Bacillus anthracis Cattle, pigs, buffalo, sheep, horses,
goats, dogs, Direct contact, ingestion
Animal influenza Influenza viruses A, B and C Pigs, ducks, chickens, whales, horses,
seals, and cats May be reverse zoonosis
Bovine spongiform encephalopathy
(BSE) Prion protein Cattle Meat
Bovine tuberculosis Bacterium Mycobacterium
bovis Cattle Milk
Brucellosis
Brucella melitensis
Brucella suis
Brucella abortus
Brucella canis
Cattle, buffalos, pigs, goats, sheep and
dogs Goats, sheep, pigs
Buffalo pox Buffalopox virus Buffalo and cattle Direct contact
Campylobacteriosis Campylobacter jejuni Pigs and cattle Direct contact and meat
Cysticercosis Taenia solium Cattle, buffalo, pigs Meat
Cryptosporidiosis Cryptosporidium parvum Cattle, buffalos, sheep, pigs Water, direct contact
Erysipeloid Erysipelothrix rhusiopathiae Pigs, fish, environment Direct contact
Salmonella Salmonella enterica Cattle, buffalos, pigs, sheep, poultry Foodborne
Haemorrhagic colitis Escherichia coli Ruminants Direct contact and
Foodborne
Page 71
47
Table 2.2: continued
Disease Causative agent Host/ affected animals Normal transmission mode to
humans
Leptospirosis Leptospira spp. Cattle, buffalo, pig, dogs,
horses, sheep and cats Infected urine, water
Listeriosis Listeria monocytogenes Cattle, buffalos, pigs, sheep Meat and dairy products
Q fever Coxiella burnetii Cattle, buffalo, pigs, sheep,
goats, cats
Aerosol, direct contact, milk and
fomites
Foot-and-mouth disease (FMD) FMD virus Cattle, buffaloes, pigs, sheep
and goats Direct contact and meat
Rabies Rabies Virus Cattle, dogs, foxes, bats, cats Saliva (via bites or open wounds),
direct contact with CNS tissue.
Rift Valley fever RVF virus Cattle, goats, sheep Direct contact, mosquito bite
Streptococcal sepsis streptococcus Pigs, horses, cattle Meat, direct contact
Swine influenza Swine influenza virus Pigs Direct contact
Toxoplasmosis Toxoplasma gondii cattle, buffalo, sheep, goats
and cats Ingestion of fecal Oocysts, meat
Trichinellosis Trichinella parasite pigs, wild boar Pork products
Zoonotic diphtheria Corynebacterium diphtheria cattle, farm animals, dogs direct contact, milk
Page 72
48
2.3 Current Species Detection Technique
Researchers have paid more attention to the development of ideal and precise
technique for the detection of several animal species due to ever-increasing meat and meat
products fraudulent issues worldwide (Ali et al., 2014c). Although morphological test is
used for the identification of some food like honey, but it is not appropriate for the
detection of meat species particularly in processed meat products (Cammà, Di Domenico,
& Monaco, 2012). Moreover, microscopic technique also unsuitable for the meat product
identification because it is unable to determine the accurate animal species in food staff
(Ali et al., 2012d). However, numerous analytical approaches have been documented to
detect the species origin in meat and meat products based on lipid, protein and DNA
biomarkers. However, the lipid and protein based methods are often unsuitable because
they are laborious, target-biomarker are often modified and thus cannot distinguish
closely related species in highly processed food such as heated or chemically treated
products, and are of less sensitive than DNA-based approaches (Ali et al., 2012a; Lago et
al., 2011). Moreover, these methods are unable to differentiate closely related species,
such as cow and buffalo. In contrast, the DNA-based techniques, especially the short-
length DNA biomarkers are thermodynamically more stable, more sensitive and more
reliable over the longer ones even under extreme states such as degraded or naturally
decomposed samples (Ali et al., 2015b; Rashid et al., 2015a). The field of use and
limitation of these methods are briefly presented here.
Page 73
49
2.3.1 Lipid Based Assay
Lipid based techniques for analysis of meat species involves in the analysis of fatty
acids positional distribution in triacylglycerol (TAG) and 2-monoacylglycerol (2-MAG)
as all species stored n-6 polyenoic and monoenoic fatty acids in TAGs with unsaturation
(except pigs) at the sn-2 position and larger chain length (SzabO, FEBel, SugAR, &
RomvARi, 2007). SzabO et al., (2007) reported that rabbit and ruminants contain high
amount of odd-chain-length fatty acids in their native TAGs which are the detectable
markers of these two species. On the other hand, pigs can be detected by the analysis of
2-MAGs because they contain lower unsaturation in 2-MAGs. However, measurement
of the fatty acid positional distribution provides information for the identification of the
species but the content and varieties of the TAGs and 2-MAGs usually modified due to
the processing and cooking treatments. Thus, these methods have very limited used for
the identification of species in food and foodstuff due to its less reliability.
The Fourier transform infrared spectroscopy (FTIR) together with partial least square
(PLS) or principal component analysis (PCA) is an important tool for the authentication
of food species based on lipid (Rohman, Sismindari, Erwanto, & Che Man, 2011).
Infrared absorption spectrum of the samples were measured in the FTIR assays and this
method is also able to collect high spectral resolution data (Griffiths & De Haseth, 2007).
Analysis of fatty acids is important for the differentiation of fats from animal and plant
sources. Therefore, analysis of fatty acids plays an important role in identification of
adulteration or replacement of vegetable oils with lower priced lard in Kosher, halal and
vegan food products.
Page 74
50
2.3.2 Protein Based Assay
An overview of protein based assays for the detection of species in meat and meat
products are described below:
2.3.2.1 Histidine Dipeptides Based Assay
Animal tissues, namely muscle, heart, kidney and liver naturally contain some
dipeptides associated with histidine such as balenine (β-alanyl-L-3-methylhistidine,
ophidine), anserine (β-alanyl-L-1-methylhistidine) and carnosine (β-alanyl-L-histidine).
These dipeptides play an important physiological role in the tissue, such as antioxidant,
buffering, vasodilatory activity, neurotransmitter action and enzyme modulator (Aristoy,
Soler, & Toldrá, 2004; Carnegie, Hee, & Bell, 1982). Histidine dipeptides are present
only in animal tissues, but not in plant sources and these dipeptides are also animal
specific (Aristoy et al., 2004). Thus, the species origin can be detected in the processed
meat products by determining the ratio of these dipeptides particularly the ratio of
carnosine and anserine or vice versa, because histidine dipeptides remain unaffected by
heat treatment (Aristoy & Toldrá, 2004; Tinbergen & Slump, 1976). For example, Aristoy
and Toldra (2004) shown that the height ratio of carnosine and anserine was in pork with
17.88±3.74, followed by beef with 8.08±1.91, lamb with 0.95±0.26 and poultry with
0.20±0.08. On the other hand, Tinbergen and Slump (1976) determined the ratio of
anserine and carnosine for beef, pork and chicken and the results were found to be
between 0.06-0.2, 0.02-0.1 and 2.2-5.5, respectively. Therefore, by measuring of these
dipeptides can easily identify the existence of animal protein in feedstuff, as plant
sources do not contain these dipeptides. This method was particularly developed for the
detection of animal proteins in the animal feeds. Because bone meat meal, meat meal,
fish meal etc. are the main source of calcium, amino acids and phosphorus, which play
a role in the rapid growth of farmed animals (Aristoy & Toldrá, 2004). But due to the
Prevalence of mad cow disease (BSE), the use of animal proteins was forbidden in the
Page 75
51
feed of ruminants in worldwide (Aristoy et al., 2004; Aristoy & Toldrá, 2004).
Although, this technique can identify the origin of mammalian but is unable to
determine the specific animal species, especially in complex matrices of various species
(Aristoy & Toldrá, 2004), reflecting the requirement of more specific and precise
method for this analysis.
2.3.2.2 Analysis of Muscle Protein
Muscle protein can be originated by using isoelectric focusing (IEF) electrophoresis.
Muscle proteins present in the sarcomeres or sarcoplasm are the target for the
authentication of the species origin. The cytoplasmic part of the muscle cell (myocyte) is
sarcoplasm and the structural unit of the muscle fibers (myofibers) is sarcomere (Hulland,
1993). Parvalbumins are present in high concentration in the fish muscle sarcoplasm,
which are small, calcium-binding, acidic and heat-stable proteins. As these proteins are
species specific and isoelectric PH range is 3.8 to 5.3 in native state, the IEF profile of
these proteins have been effectively introduced to discriminate the fish species (Addis et
al., 2010; Berrini, Tepedino, Borromeo, & Secchi, 2006). Berrini et al. (2006) revealed
that IEF profile is able to differentiate the inter-species polymorphic species but is not
suitable for intra-species polymorphic species. Thus, two-dimensional electrophoresis (2
-DE) can overcome this problem. 2-DE map of myosin light chain (MLC), a sarcomeric
protein, can clearly distinguish the fish species as well as able to provide information of
the preserve condition and freshness of the specimens (Martinez & Jakobsen Friis, 2004).
Moreover, 2-DE method couple with proteomic assay, namely mass spectroscopy and in-
gel digestion, are more suitable tool for discriminating the species specific MLC in
admixed and processed samples of different tissues and muscles of various species
(Martinez & Jakobsen Friis, 2004; Pischetsrieder & Baeuerlein, 2009). Giometti et al.,
(1979) proposed that high-resolution two-dimensional electrophoretic technique can
feasibly be applied for the analysis of biopsy samples of human muscle by resolving the
Page 76
52
major muscle proteins and enzymes. They successfully identified the ten enzyme
components and actin, myosin, troponin and tropomyosin from the two-dimensional
profile using rabbit muscle as a model. By comparing the human and rabbit muscle
patterns found enormous similarities, but not confirm identifiable and additional
modification is required for final results (Giometti et al., 1979). Thus, electrophoretic and
proteomics techniques are expensive, required skilled technicians, laborious and also not
suitable for the investigation of admixed samples of different species (Addis et al., 2010;
Martinez & Friis, 2004; Pischetsrieder & Baeuerlein, 2009).
2.3.2.3 Analysis of Species-specific Osteocalcin
Osteocalcin (γ-carboxyglutamic acid-containing protein) is noncollagenous protein
found in bone and dentin of most animals and play role in the formation of bone.
According to EU Regulation EC No 999/2001 (EC, 2001) feed containing meat and bone
meal (MBM) is restricted for farmed animals. Furthermore, addition of animal proteins
in the feedstuff of same species is also prohibited under the Regulation EC No 1774/2002
(EC, 2002). The permitted MBM source is only fish meal in the feed of fowl, pig and
calves (EC, 2001). Thus, analysis of feedstuff to detect the contaminated animal MBM is
mandatory by the EU Regulation EC No 999/2001 and EC No 1774/2002 (EC, 2001; EC,
2002). The classical optical microscopic technique is the accepted official method for the
identification of MBM in the feedstuff (EC, 2009). This method is reliable for the
detection of animal origin, which are stable under processing treatment (1330 C and at
300 kPa for 20 min) required for MBM manufacturing, such as bone fragments, scales,
gills teeth or hair (Kreuz et al., 2012). But microscopic method cannot apply in the
quantitative approaches and to overcome this limitation spectroscopic (near infrared
spectroscopy—NIRS) method was introduced (Abbas et al., 2010). To increase the
performance of the spectroscopic method for analyzing the animal proteins in feedstuff,
near infrared microscopic (NIRM) method has been developed. The NIRM is more useful
Page 77
53
because it possesses both spectroscopic and microscopic functions in one instrument. The
recent modified form of NIRM is NIR hyperspectral imaging, which allows both spectral
and spatial characterizing information of the specimen simultaneously. The sensitivity of
the NIRM methods is up to 0.5% level of adulteration in feed specimen (Abbas et al.,
2010). In addition, Fourier transform near infrared spectrometer (FT-NIR) couple with
auto image microscope also have significant role for the differentiation of species
contaminated in feedstuff. Haba et al., (2007) developed FT-NIR microscopic method for
the discrimination of land-animal and fish particles in feed samples.
The protein, osteocalcin (OC) is a not suitable target molecule for the differentiation
of species due to its conserved nature as well as very low variability in the sequences. But
there is enough variation at the genus level of OC such as it contains amino acid sequence
variation between the species which help to distinguish the different species (Balizs et al.,
2011). Consequently, Balizs et al., (2011) developed a suitable method for detecting
species-specific OC on the basis of mass differences due to the variation in amino acid
sequences, by using the matrix-assisted laser desorption ionization/time-of-flight
(MALDI/TOF) and high-resolution hybrid mass spectrometry (HR-Q/TOF MS). This
method was successfully applied for the differentiation of bovine and porcine materials
in MBM samples (Balizs et al., 2011). In addition, Kreuz et al., (2012) developed
sandwich ELISA technique to identify the MBM in feed, on the basis of raising antibody
against the bovine osteocalcin. The developed method is stable under the heat treated
samples (1450 C) and is very sensitive (1 ng for pure state and 0.1% for adulterated
sample) and they also proposed that it may apply for the discrimination of bovine and
horse species (Kreuz et al., 2012). However, these methods are highly expensive, required
skilled operator to operate and unable to differentiate specific-species properly,
particularly in the mixed matrices.
Page 78
54
2.3.2.4 Detection of Species Specific Proteins by ELISA
Although above described protein-based methods are suitable for the identification of
feed and food ingredients but these are not applicable for the routine analysis of
commercial feed and food products because they are comparatively expensive, laborious,
complex to handle and time consuming (Asensio, González, García, & Martín, 2008). On
the other hand, the immunological method, namely Enzyme-Linked Immuno Sorbent
Assay (ELISA) has been more suitable and widely used tools for the authentication of
food products due to its low cost, high specificity, sensitivity and simplicity (Asensio et
al., 2008; Carrera et al., 2014).
The principle of ELISA is that either antibody (Ab) or antigen (Ag) is fixed to a surface
followed by the measurement of antigen-antibody interactions by the assistance of the
labeled enzyme (E) which converts specific substrate into a colored product. The
measurement of the produced color is an indicator for the identification and quantification
of the sample (Pokhrel, 2015). The most commonly used ELISA techniques for the
authentication of feed and food products include indirect and sandwich ELISA.
(a) Indirect ELISA
This method comprised of two steps, here additional one set of antibodies is used
compared to direct ELISA. The initial step involves antigen specific antibody (primary
antibody) bind with the fixed antigen and the second step involves binding of enzyme
labeled secondary antibody, which is primary antibody specific, to the primary antibody.
The antibody conjugated enzyme react with the suitable substrate produces color product.
Another form of indirect ELISA is Sandwich ELISA (Asensio et al., 2008).
Ag Ab Substrate
Color product Ab-E + +
Page 79
55
(b) Sandwich ELISA
Here, antigen is bounded by two different antibodies, one is capture antibody which
remain fixed with solid surface and another is detection antibody labeled with enzyme.
The analytical antigen must contain minimum two antigenic epitope able to bind with
antibody as two antibodies participate in Sandwich ELISA. Among the immunosorbent
assays Sandwich ELISA is most useful tool because of its high antigen detecting
efficiency and sensitivity than those where antigen is fixed to the solid surface. In
addition, no sample purification is needed before analysis with Sandwich ELISA
(Asensio et al., 2008).
ELISA assay can be used in both qualitative and quantitative analysis. The
development of antibodies against the target antigens is mandatory for the ELISA
analysis. Two types of antibodies are used in the ELISA technique to authenticate the
food ingredients, namely monoclonal (Chen, Hsieh, & Bridgman, 1998; Hsieh &
Bridgman, 2004; Liu, Chen, Dorsey, & Hsieh, 2006) and polyclonal (Berger, Mageau,
Schwab, & Johnston, 1987; Hsu, Pestka, & Smith, 1999; Smith et al., 1996) antibody.
Polyclonal antibodies (PAbs) are more suitable for the analysis of denatured protein
samples as they are able to recognize the antigens from a mixture of different epitopes
and with little changes in the property of antigen, such as denaturation or polymerization.
However, PAbs have some limitations including limited yield, variable affinity and
extensive purification step is needed to overcome cross-reactivity for the detection of
specific-species. On the contrary, MAbs are produced homogenously by using hybridoma
techniques with high yield, specific biological activity and high specificity (Asensio et
al., 2008).
Ab Ag Substrat
Color product Ab-E + +
Page 80
56
Until now, various reports have been documented for the authentication of food using
both MAbs and MAbs on the basis of structural and soluble proteins of the muscle cell.
To detect the adulterated pork in beef mixture, Sandwich ELISA technique was
introduced by raising PAbs against muscle soluble protein with the detection limit of 1%
adulteration level (Martín, Azcona, Casas, Hernández, & Sanz, 1988). ELISA technique
was also used for the authentication of food products, such as fermented sausage, cooked
salami and frankfurter (Ayaz et al., 2006) and hamburger (Macedo-Silva et al., 2000).
ELISA method was introduced for the quantitative measurement of the raw pork in the
admixture of raw beef with the quantification limit up to 1% (Martin, Chan, & Chiu,
1998). Chen and Hsieh (2000) reported quantitative ELISA technique for the
quantification of pork in heat treated various meat products such as sausage bologna ham,
salami spread franks and luncheon meat using MAbs which was raised against heat-stable
muscle protein of pig. The limit of detection was found 0.5% (w/w) porcine material in
various meat mixture and the accuracy of the developed method was confirmed by
comparative study with commercial PAbs test kit. Similarly, Liu et al., (2006) developed
MAbs based quantitative Sandwich ELISA assay for the evaluation of porcine material
in thermal-treated (1320 C for 2 h) meat samples with the lower detection limit of 0.05%
of pork in adulterated mixture. Currently, the ELISA test kits of specific meat species are
commercially available for the reliable analysis of raw, processed, cooked meat, meat
product and feedstuff (Asensio et al., 2008).
More recently, Perestam et al. (2017) reported a comparative study between ELISA
and DNA-based method (real-time PCR) based on specificity, sensitivity, time, cost and
purpose of use. They found that both methods are suitable for detecting the species origin
in raw meat and meat products but ELISA is not suitable for the identification of species
in highly processed food particularly when a lower detection limit is requisite. Other
Page 81
57
researchers also concluded regarding the lower sensitivity of the ELISA assay and also
not suitable for the differentiation of species in mixed matrices particularly in closely
related species (Martin et al., 1998; Martín et al., 1988). Moreover, immunoassays often
interrupted due to cross-reactions occurrence between closely related species, since these
techniques are based on the raised of antibodies against a specific protein (Di Pinto et al.,
2005; Fajardo et al., 2010).
2.3.3 DNA-based Method
Recently, researchers have paid more attention to the DNA-based methods and these
methods becoming more prominent and widely used for the verification, quantification
and monitoring of adulterated species in meat and meat products because of its specificity,
sensitivity, preciseness, robustness, rapidity and inexpensiveness (Darling & Blum,
2007). The DNA-based methods are considered as highly useful tools in practical fields
due to the exceptional properties of DNA molecule such as codon degeneracy, superior
heat stability, abundant presence in multiple copies in most cells along with intra-species
conserved and inter-species polymorphic fingerprint etc. (Ali et al., 2014c; Mafra et al.,
2007). Stability of biomarkers is a key factor for successful species detection particularly
in processed meat products, as these products are prepared under extreme heat and
processing treatment. Unlike protein biomarkers which readily denature under heat
processing treatment, DNA biomarkers are highly stable under severe processing
condition (Mane, Mendiratta, Tiwari, & Bhilegaokar, 2012). Furthermore, a small amount
of sample is enough for the detection species in DNA-based methods because multiple
copies of DNA are present per cell (Gupta et al., 2011; Mane, Mendiratta, & Tiwari,
2012). In addition, DNA also carry enormous information compared to proteins due to
the genetic code degeneracy and the existence of large non-coding stretche (Pereira,
Carneiro, & Amorim, 2008). Due to the above advantages, DNA-based methods have
become more favorable tool for the detection of species in complex background of heavily
Page 82
58
processed foods. However, among the DNA based assay, PCR has been gained increasing
attention due to accuracy, higher sensitivity, reliable and rapid investigation scheme,
where DNA is used as a detection target and a single DNA copy is amplified into multiple
copies (Aida, Man, Wong, Raha, & Son, 2005; Ali et al., 2014c).
Design of specific biomarkers of the target species is a fundamental step of PCR assay
development. According to the research requirement, both mitochondrial DNA (mtDNA)
and nuclear DNA (nDNA) have been introduced in numerous studies for the design of
biomarkers (Morin, Hedrick, Robertson, & Leduc, 2007). Researchers have gained
particular attention to the mitochondrial DNA (mtDNA) over nuclear DNA (nDNA)
especially, for the identification of meat products due to the following advantages:
(i) the absence of pseudogene or repetitive sequence, complicated intron which result
in simpler in complexity than nDNA,
(ii) rapid evolution of mtDNA due to the higher base substitution rate than nDNA,
allowing the existence of more diversity in sequences and facilitating the differentiation
of phylogenetically closely related species (Fajardo et al., 2010; Zha et al., 2010),
(iii) sequence of mtDNA is more conservative because of its maternal inheritance and
lack of recombination in all vertebrates (Rokas, Ladoukakis, & Zouros, 2003)
(iv) more stable because mtDNA is present in higher number per cell (800-1000) and
surrounded by double membrane (Cooper, 2000; Girish et al., 2004).
Thus, mtDNA can survive under severe processing treatment, offering the target of
biomarker design for the reliable detection of species in compromised samples and in the
admixture of closely related species (Ali et al., 2011b; Karabasanavar et al., 2014; Mane
et al., 2012).
Page 83
59
2.3.3.1 Polymerase Chain Reaction (PCR) Based Assay
PCR is an in vitro process in which a specific target DNA fragment can be amplified
from a single or small number of DNA to a large number of DNA under a simple
enzymatic reaction (Garibyan & Avashia, 2013).
The major components of the PCR reaction include, primers, template DNA, DNA
polymerase and nucleotides (Garibyan & Avashia, 2013). Only simple three-steps cycling
reactions are required for PCR assay, such as
(i) Double stranded DNA denaturation
(ii) Primers annealing
(iii) Primer extension
When amplification target is RNA, a complementary DNA (cDNA) of that RNA must
be generated with the help of reverse transcription prior to PCR is started (Schochetman,
Ou, & Jones, 1988). The key function of the PCR reaction is the association of individual
building blocks nucleotides (adenine, guanine, cytosine and thymine) together by the
enzymatic reaction of DNA polymerase for the synthesis of PCR products. The primers
are short single stranded DNA sequences and complementary to the DNA of target
species either from 5’-end or 3’-end of the desired sequence. Annealing of the primers
with the dissociated DNA stands facilitate the DNA polymerase to start the extension of
new stands. Thus, after completion of each cycle, the copy of DNA is become double,
allowing the synthesis of large number of DNA after 30 to 40 cycles. After mixing the
PCR all PCR reagents in the PCR tube or 96-well plate is placed in the Thermal Cycler
to run the three basic steps of repeated DNA amplification reaction (Figure 2.10)
(Garibyan & Avashia, 2013; Schochetman et al., 1988). For the detection of PCR
amplified products, DNA visualization is accomplished under an electrophoresis system
of agarose gel or polyacrylamide by staining with ethidium bromide or other non-
Page 84
60
carcinogenic DNA stain (eg. Florosafe DNA stain) and an appropriate DNA size marker
under a gel image documentation system for only gel image (Lee, Costumbrado, Hsu, &
Kim, 2012) or on automatic Capillary Electrophoresis System for both gel image and
electroferogram (Dooley et al., 2005; Fajardo et al., 2010). Among the DNA-based
studies, PCR assays have occupied the central place because they can amplify a specific
fragment of DNA from a minute quantity such as single copy to any detectable quatities
(Reid, O'donnell, & Downey, 2006). Because of this feature a large number of PCR
methods have been developed for the authentication of different species such as fish and
meat species. A brief description of the different PCR-based assays is illustrated below
under different subheadings:
Page 85
61
Figure 2.10: Amplification of target gene by PCR reaction (Adapted from Vierstraete, 1999)
DNA 1st cycle
2nd cycle
3rd cycle
4th cycle
35 cycles
Target gene
Page 86
62
(a) PCR Sequencing
DNA barcoding was introduced in 2003 and it has been applied as a reliable, fast and
inexpensive method that can identify species without necessitating taxonomic analyses
(Luo et al., 2011; Vernooy et al., 2010). DNA barcoding often amplifies about 650 bp
fragment of mitochondrial cytochrome oxidase I (COI) gene and assign species based on
sequence variation to make reference sequences that can act as a molecular detection tag
for each of the species profiled by PCR (Fajardo et al., 2010). Identification of species
are usually accomplished by comparing the sequences of target species with DNA
barcodes of known species through alignment searching, distance based tree construction,
decision theory, the characteristic attribute organization system and the back propagation
neutral network (Luo et al., 2011).
A Canadian national research network has developed the Barcode of Life Data
Systems (BOLD) (http://www.boldsystems.org) which currently accommodates barcode
records for over 850,000 samples, representation about 100,000 species (Vernooy et al.,
2010). The invention of DNA barcoding system seems to be promising in various area
like forensic analysis, biosecurity and food authentication as well as protection of wildlife
(Ferri, Alu, Corradini, Licata, & Beduschi, 2009). Most of the studies regarding food
speciation using DNA barcoding system have focused on fishery and seafood products
(Fajardo et al., 2010). For example, Barbuto et al. (2010) applied DNA barcoding method
for the detection of shark slices sold (palombo) using 550 bp barcode sequence from coxI
gene. The developed technique was able to identify adulteration in 80% of the tested
samples of commercial palombo in Italy. Another approach for the authentication of
seafood was introduced by Wong et al. (2008); wherein they used 652 bp sequence from
the COI gene and successfully identified that 25% of the specimens were potentially
mislabeled. Recently, Hajibabaei et al. (2006) developed a short length barcode (~100
bp) for the identification of museum specimens, as higher length barcode like 650 bp
Page 87
63
cannot recover with full length due to DNA degradation in highly decomposed samples.
DNA barcode system was also developed for the detection of domestic animals.
Ramadan, (2011) designed one set of universal primer targeting 422 bp mitochondrial
16S rRNA gene of buffalo. The developed system successfully identified buffalo as well
as cattle, goat and sheep.
Although DNA barcoding system has gained wide spread support in the identification
of species and biodiversity screening, it is not free from limitations. Firstly, DNA
barcoding amplify long DNA fragment, like 650 bp segment of COI gene which often
breakdown in heat and pressure treated foods and feeds samples (Ali et al., 2015c; Fajardo
et al., 2008; Hird et al., 2006). Secondly, the system is applicable for only single species
detection scheme and cannot be applied for the detection of multiple species in a single
assay platform. Thirdly, this technique require two major steps: one is PCR amplification
and second one is the post-PCR sequencing of the amplified products reflecting that make
it quite expensive. Fourthly or finally, the assay cannot generate quantitative data (Ali,
2011a).
(b) Species Specific PCR
Recently, researchers have paid more attention to the species specific PCR (SSP)
targeting mitochondrial genes due to its simplicity, sensitivity, preciseness, cost-
effectiveness and requirement of very lower amount of sample (Rashid et al., 2015b). In
this method, target DNA fragment is amplified using one set of primers (forward and
reversed) by an enzymatic reaction of DNA polymerase followed by separation on
agarose or polyacrylamide gel with ethidium bromide or other non-carcinogenic staining
dye to visualized (Ali, 2011a). Both simplex /singleplex (Barakat, El-Garhy, & Moustafa,
2014; B. G. Mane et al., 2012) and multiplex (Dalmasso et al., 2004; Hou et al., 2015)
SSPCR assays have been documented.
Page 88
64
i Singleplex PCR
The method involves amplification or detection of single species in a reaction. Until
now, enormous simplex PCR assays for the detection of various species with different
target (amplicon) sizes have been documented due to its sensitivity, accuracy and
robustness. For example, Mane et al. (2012) introduced beef specific PCR assay based on
513 bp amplicon sized from mitochondrial D-loop gene for the detection of raw,
processed and autoclaved beef and beef products. Arslan et al. (2006) also reported beef
specific PCR assay for the identification of various heat treated meat including boiling,
pressure cooking, roasting and pan frying by amplifying 271 bp fragment of
mitochondrial DNA. Various reports have also been documented for the authentication
of buffalo species. Girish et al. (2013) developed a rapid detection method of buffalo
species using mitochondrial D-loop gene for amplifying the 482 bp fragment. Another
highly specific PCR assay was developed targeting the same gene for the identification
of buffalo meat which amplified 534 bp PCR product (Karabasanavar et al., 2011). Kumer
et al. (2011) reported buffalo mitochondrial D-loop specific PCR assay targeting 358 bp
amplicon size. To authenticate the processed meat and meat products, a buffalo specific
PCR assay was documented for the amplification of 537 bp amplicon from mitochondrial
D-loop gene. The assay was sensitive up to 1% level of adulteration under autoclaved
condition (Mane et al., 2012). Recently, Vaithiyanathan et al. (2016) developed beef and
buffalo specific PCR methods with a common forward primer for both beef and buffalo
and the species specific reverse primers from the mitochondrial D-loop region. The
developed systems successfully amplified 126 bp and 226 bp PCR products for beef and
buffalo species, respectively with a detection level of 0.47 ng for beef and 0.23 ng for
buffalo DNA in simplex PCR assays. Numerous simplex PCR assays also introduced for
the verification of porcine material in food chain. To developed pork specific PCR
system, different types of mitochondrial genes have been targeted with different amplicon
Page 89
65
sizes including cytb (Aida et al., 2005; Ali et al., 2011b), D-loop (Man, Mustafa,
Mokhtar, Nordin, & Sazili, 2012; Haunshi et al., 2009; Karabasanavar et al., 2014) and
12S rRNA (Man et al., 2007). Other species also detected by using simplex PCR assay
such as goat (Kumar, Singh, Singh, & Karabasanavar et al., 2011a; Rodríguez et al.,
2004), sheep (Rodríguez et al., 2004), cat (Ali et al., 2015b), dog (Rahman et al., 2014),
monkey (Ali et al., 2016) and turtle (Ali et al., 2015c).
ii Multiplex PCR
The multiplex PCR is a highly useful and remarkable technologies, where multiple
target DNA fragments are amplified simultaneously in a single assay mixture, reducing
both time and cost (Hou et al., 2015). Both conventional (end-point) and real-time PCR
assay have been introduced for the authentication of meat and meat products. Nowadays,
these techniques have got great promise since they offer abundant advantages. Matsunaga
et al. (1999) were the first to introduce multiplex PCR technique for the detection of five
meat species such as pig, cattle, goat, horse and sheep. They used a common forward
primer from the mitochondrial cytb gene and reversed primer from species specific DNA
sequences. Rea et al. (2001) developed a duplex platform for the detection of bovine and
water buffalo milk and mozzarella cheese based on 113 bp and 152 bp fragments from
cytb gene of bovine and water buffalo respectively. The sensitivity of the method was
found to be 1 pg for raw and 1% level for adulteration. Gupta et al. (2012) optimized the
same primer pairs which were developed by Rea et al. (2001) for the simultaneously
detection of beef and buffalo meat with the similar sensitivity (1 pg). Duplex PCR was
also introduced for the authentication of cattle and buffalo fat targeting mitochondrial D-
loop gene of both species. 126 bp and 226 bp PCR products were successfully amplified
for cattle and buffalo respectively and the limit of detection was 0.12 ng for buffalo 0.47
ng for cattle ( Vaithiyanathan & Kulkarni, 2016). Bai et al. (2009) developed a multiplex
Page 90
66
PCR assay for the detection of cattle, pig, chicken and horse meats by amplifying 292,
412, 239 and 451 bp fragment, respectively. The sensitivity of the assay was found to be
0.1 ng. Multiplex PCR was also developed for the analysis of feedstuff to detect the
species commonly used in rendering plants namely, ruminant, pork, poultry and fish. To
carry out the authentication 104, 290, 224 and 183 bp PCR products of the mitochondrial
genes (16s rRNA for ruminant and 12S rRNA for others) were amplified with detection
limit of 0.002% for ruminants, pork and poultry and 0.004% for fish (Dalmasso et al.,
2004). Mitochondrial cytb gene was targeted for the amplification of 398 and 439 bp
sequences to identify pig and horse respectively in a single assay platform (Di Pinto et
al., 2005). He et al. (2015) optimized multiplex PCR technique to detect four different
species including pork, beef, duck and mutton. The identification was carried out by
using 212 (pork), 116 (beef), 322 (duck) and 177 (mutton) bp fragments from cytb, cytb,
ND2 and 16S rRNA, respectively. Recently, Ali et al. (2015d) developed a multiplex PCR
method for the simultaneous identification of five species forbidden in Halal (Islamic)
foods, such as pig, dog, monkey, cat and rat. The targeted genes were mitochondrial cytb
for cat, ATPase 6 for rat and dog and ND5 for monkey and pig, for the amplification of
172, 108, 163, 129 and 141 bp DNA fragments respectively. Multiplex PCR also extended
for the verification of genetically modified organisms (GMOs) in food and feed (Germini
et al., 2004).
Thus, multiplex PCR assay is highly promising and useful technique discriminatory
power of identifying several species under complex matrices. Thus it can save both labor
and time. On the other hand, simplex PCR assay needs several different assays since each
set of species specific biomarkers are used separately (Zha, Xing, & Yang, 2011).
However, all of these assays are based on single gene targeted and most of them are long
DNA targeted which are not suitable for the analysis of highly degraded samples due to
the breakdown of the target amplicon.
Page 91
67
iii PCR- Randomly Amplified Polymorphic DNA (PCR-RAPD)
Randomly Amplified Polymorphic DNAs (RAPD) are the fragments of DNA that are
amplified by PCR assay with the help of synthetic short oligonucleotide primers
complementary to random sequence. Therefore, PCR-RAPD method involves in the
simultaneously amplification of many distinct DNA fragments due to the randomly
binding of the single arbitrary short primer (generally 10 bp) at the many different
location on the genomic DNA followed by carry out the gel electrophoresis for the
separation and visualization of the amplified products depending on their sizes (Fajardo
et al., 2010; Hadrys, Balick, & Schierwater, 1992). Samples identification are
accomplished by comparison the DNA bands profile according to the expectation
depending on experimental conditions, primer and DNA used as the produced band
pattern from amplified products are characteristics of the template DNA (Fajardo et al.,
2010; Kumar & Gurusubramanian, 2011b).
Arslan et al., (2005) used PCR-RAPD technique for the identification of various
animal species in raw and processed meat products. The method successfully identified
the cow, pig, sheep, goat, wild swine, camel, dog, cat, donkey and rabbit or bear species
using a short (10 bp) primer. The method is also applicable for the detection of species
origin in the 1:1 mix of raw minced meat from beef-sheep, horse-beef or sheep-pork. This
method was also applied for the detection of ten meat species namely beef, buffalo, pig,
wild boar, horse, cat, dog, venison, kangaroo and rabbit by producing fingerprint patterns
using 10 bp containing 29 primers. Although, some primers of this method can generated
district fingerprints for the differentiation of the species but other cannot distinguish the
species origin (Koh, Lim, Chua, Chew, & Phang, 1998). Martinez et al., (1998) applied
this technique for the authentication of beef, buffalo, pork, goat, elk, mule, ostrich,
donkey, reindeer, kangaroo, horse, and lamb species in the various meat products such as
Page 92
68
frozen red meat, sliced, salmoni and Lammerull. Another approaches of PCR-RAPD for
the identification of four meat species including cattle, buffalo, sheep and goat (Calvo,
Zaragoza, & Osta, 2001a). Single arbitrary primers containing PCR-RAPD technique
have some advantages including simple, rapid, eliminating more complex analytical steps
and no need previous knowledge of the target DNA sequence (Fajardo et al., 2010).
However, the main limitation of this method is reproducibility, in practice it is very
difficult to produce reproducible amplified DNA band pattern (Arif et al., 2010; Koh et
al., 1998). Furthermore, this technique is not applicable for the analysis of extremely
processed meat and meat products, as highly purified DNA is mandatory for the
reproducible RAPD patterns. In addition, PCR-RAPD method is not suitable for the
identification of species in mixed samples containing more than one species (Fajardo et
al., 2010).
iv PCR-restriction fragment length polymorphism (PCR-RFLP)
PCR restriction fragment length polymorphism (PCR-RFLP) is one of the most
important molecular techniques accomplished by numerous researchers. The PCR-RFLP
assays are especially interesting because they offer the opportunity to authenticate a
product by restrictive digestion of the amplified PCR products using one or more
restriction enzymes (REs) (Rashid et al., 2015b). Using the sequence variation that exists
within a defined region of DNA, the differentiation of even closely related species is
possible using a PCR-RFLP assay (Hsieh & Hwang, 2004). However, the PCR-RFLP
technique is very simple and inexpensive and easily applicable in the routine analysis
(Farag, Alagawany, El-Hack, Tiwari, & Dhama, 2015).
Species-specific PCR assay is often conclusive but it has yet to be considered a
definitive analytical method because of certain “hard-to-control” features of the
amplification process (Focke, Haase, & Fischer, 2010; Yang, Kim, Byun, & Park, 2005).
Page 93
69
For example, it sometimes produces artifacts due to contamination by alien DNA at a
minute scale (Doosti, Dehkordi, & Rahimi, 2014; Yang et al., 2005), but these ambiguities
or doubts could be eliminated by the verification of the amplified product through at least
one of three different methods, namely, PCR-RFLP assay, probe hybridization, and target
product sequencing (Maede, 2006). Probe hybridization is an attractive technique because
it can detect multiple species in a single experimental run through the use of multiple
labeled probes, (do Nascimento, de Albuquerque, Monesi, & Candido-Silva, 2010) but
this procedure requires purified DNA and is also laborious, expensive, and time-
consuming (Rashid et al., 2015b). In contrast, DNA sequencing is a more efficient and
reliable tool, but it requires an expensive laboratory setup and is often not suitable for the
analysis of processed food under complex matrices (Girish et al., 2004; Mafra et al., 2007)
because of the coextraction of the food ingredients that often bring errors into the final
results (Times, 2015). On the contrary, the PCR-RFLP assay can overcome all of these
limitations and has been widely used to authenticate the original PCR product amplified
from a particular gene fragment (Park, Shin, Shin, Chung, & Chung, 2007; Sharma,
Thind, Girish, & Sharma, 2008). It comprises the generations of a specific fragment
profile through restriction digestion with one or two endonucleases. A carefully selected
restriction endonuclease cleaves the PCR product at specific recognition sites, producing
a set of DNA fragments of different lengths that could be separated and visualized by gel
electrophoresis (Ballin, Vogensen, & Karlsson, 2009); thus, it distinguishes the artificial
PCR product from the original through the analysis of the restriction fingerprints (Doosti
et al., 2014; Times, 2015).
Such assays have been successfully applied to discriminate closely related species such
as cattle, yak, and buffalo; pig and goat (Chen, Liu, & Yao, 2010); cattle−buffalo and
sheep−goat (Girish et al., 2005); swine and wild boar (Mutalib et al., 2012); and various
fish species (Nebola, Borilova, & Kasalova, 2010). Kumar et al. (2014) developed RFLP
Page 94
70
assay for the authentication of five most commonly used meat species namely cattle,
buffalo, pig, sheep and goat. Two different REs (Alu1 and Taq1) were used for the
digestion of PCR products and distinctive digestion profiles allowed to differentiate each
species. RFLP assays were also developed and applied on the PCR products of cat (Ali et
al., 2015a), dog (Rahman et al., 2015b) and turtle (Asing et al., 2016b). Besides this
method, an universal primers set was designed from the mitochondrial cytb gene for the
amplification of 359 bp DNA fragments from six species including pig, beef, buffalo,
goat, chicken, rabbit and quail. The species were discriminated from the restriction
digestion pattern generated by the digestion of five Res such as BsaJI, AluI, BstUI, MseI
and RsaI (Murugaiah et al., 2009). However, these methods are mostly based on single
and long-length DNA targets which break down under natural or environmental
decomposition and food processing treatments, making them less trustworthy and
inconclusive for forensic investigation (Bottero & Dalmasso, 2011; Focke et al., 2010).
v Real-Time PCR
In contrast to conventional PCR assays, real-time PCR techniques are especially
promising since they are fast, automated, highly sensitive and offer both the detection and
quantification opportunities of the analyte targets at real-time, eliminating the need of
post PCR analysis such as time consuming electrophoresis (Asing et al., 2016a; Cheng et
al., 2014). Moreover, multiplex quantitative PCR (mqPCR) might be highly advantageous
over the singleplex qPCR methods because it could detect and quantify multiple target
oligos in a single assay platform, saving both analytical cost and time (Ali et al., 2015d;
Iwobi et al., 2015). Particularly, real-time PCR involves in the directly monitoring the
generation of PCR products during each amplification cycle and able to measure at the
exponential phase of the reaction there is no need to complete the reaction. Unlike end-
point (conventional) PCR assay, this system allows quantifying the PCR products at an
Page 95
71
initial stage of the reaction that is more precise and accurate. As fluorescent molecules
are used to collect the real-time data, since there is high correlation between intensity of
the fluorescent dye and the quantity of PCR products (Fajardo et al., 2010). Two general
categories of fluorescent chemistries, namely, double-stranded (ds) DNA-intercalating
dyes such as SYBR Green (Asing et al., 2016a) or Eva Green (Safdar & Abasıyanık,
2013) and probe based chemistry such as TaqMan (Ali et al., 2012) or Molecular Beacon
(Hadjinicolaou, Demetriou, Emmanuel, Kakoyiannis, & Kostrikis, 2009) probes are
available for the real-time PCR systems. The main drawback of the DNA-intercalating
dye chemistry is that it non-specifically binds any dsDNA including primer-dimers that
are available in the reaction tube, making the detection false positive and unreliable (Arya
et al., 2014). Moreover, some dyes are known to inhibit the PCR reaction (Gudnason et
al., 2007). In contrast, TaqMan probe based method is greatly promising since both the
probe and primers find their appropriate partners in the template site, offering double
checking opportunity that enhances assay specificity and reliability (Ali et al., 2012a).
Because fluorescent signal is generated only when hybridize the specific probe due to the
DNA polymerase moves by and cleaves off the probe’s quencher molecule. In addition,
TaqMan probe techniques are also suitable for the development of mqPCR systems
because specific probes could be labeled with different reporter dyes that allow the
identification of the amplified targets formed by one or multiple primer sets in a single
PCR assay tube (Arya et al., 2014).
Several simplex and multiplex qPCR reports have been introduced for the
identification and quantification species in food products. For example, a SYBR Green I
oriented qPCR method was developed for the quantification of bovine milk adulteration
in buffalo cheese products. The technique successfully identified the adulterated bovine
milk in most of the marketed buffalo cheese samples (Lopparelli, 2007). SYBR Green
fluorescence also used for the detection and quantification of bovine, porcine, caprine,
Page 96
72
goose, turkey, chicken, and equine (Okuma & Hellberg, 2015); pork (Soares, Amaral,
Oliveira, & Mafra, 2013) and box turtle (Asing et al., 2016a). On the other hand, Safdar
et al. (2014) used the EvaGreen fluorescence dye, to develop a duplex qPCR assay for
the reliable and rapid detection of bovine and caprine species in ruminant feeds. The
method was optimized under heat treated (1330 C and 3 bar for 20 min) bovine and caprine
admixed meat. Safdar et al. (2013) (Safdar & Abasıyanık, 2013) also introduced another
Eva Green approaches for the discrimination of beef and soybean in sausages. Iwobi et
al. (2015) introduced TaqMan based m-qPCR assay for the quantification of beef and
pork in minced meat. The sensitivity of the method was 20 genome equivalents and the
validation of the method was carried out on various marketed minced meat products.
Another TaqMan based mqPCR approach for the differentiation of bovine and buffalo in
dairy samples. The method was validated by the analysis of commercial products with
satisfactory results (Drummond et al., 2013). A TaqMan probe qPCR assay was reported
for the authentication of species and gender origin of beef. This method consist of two
reactions: bovine-specific qPCR and Y-chromosome–specific mqPCR. The technique is
highly powerful tool for the discrimination of beef gender (Herrero et al., 2013). TaqMan
probe based mqPCR also applied for the quantification of pork, beef, sheep and horse
(Köppel, Ruf, & Rentsch, 2011); pork, duck, chicken, goose and turkey (Köppel, Daniels,
Felderer, & Brünen-Nieweler, 2013); red deer, sika deer and fallow deer (Druml,
Grandits, Mayer, Hochegger, & Cichna-Markl, 2015) and pig, chicken and duck (Cheng
et al., 2014).
Although numerous mqPCR have been documented, but to the best of our knowledge,
no mqPCR assays have been documented for the simultaneously detection and
quantification of beef, buffalo and pork in food products.
Page 97
73
2.3.3.2 Validation of PCR Method
(a) Definition
According to Taverniers et al. (2004) “Validating a method is investigating whether the
analytical purpose of the method is achieved, which is obtaining analytical results with
an acceptable uncertainty level”. Subsequently, Green (1996) depicted “Method
validation is the process of proving that an analytical method is acceptable for its intended
purpose”. To fulfill this definition, the PCR method need to be properly optimized,
standardized and developed so that it can be adapted to accomplish performance
characteristics that are consistent with the purpose of the assay. (World Organization for
Animal Health, 2009).
(b) Practical Evaluation of Parameters and Acceptance Criteria
Various parameters of the PCR assay have to be tested to check the fitness of the method
performance. A method can be accepted for routine analysis, if it complies with the
predetermined criteria. During development and in-house validation of singleplex and
multiplex PCR methods the following parameters need to be evaluated (Broeders et al.,
2014).
i) Applicability
In the applicability statement, the developer should clearly describe the scope of the
method with complete information, such as name of target species, which matrix is
intended, or the amount of DNA have been analyzed. The method need to be assessed
using several matrices namely, raw and processed materials, food and feed, and genomic
DNA and plasmid DNA. Moreover, to detect the probable PCR inhibitors, different
amounts of DNA can be analyzed. Reproducible results need to be produced for as many
matrices as possible (Broeders et al., 2014).
Page 98
74
ii) Practicability
To evaluate the practicability of the assay, blind samples need to be tested by the routine
laboratory. Herein, new method can be run in combined combination with existing
methods that had been already applied in the laboratory under the same conditions. To
further evaluate the practicability, the developed method need to be transferred to a
second laboratory to confirm the reproducible results (Broeders et al., 2014).
iii) Optimization and Standardization of Reagents and Determination of
Critical Control Parameters
Collection and preparation of sample as well as DNA extraction procedures are all
critical parameters in assay performance and should be optimized for good results.
Appropriate DNA extraction methods vary depending on sample types. For example,
extraction of DNA from raw meat samples is relatively easy, while that from complex
matrices is more difficult. It is essential to develop an efficient and reproducible
extraction method prior to perform further validation of the PCR assay. All apparatus
used during validation process must be calibrated according proper protocols.
It is also important to determine the ability of the assay to remain unaffected due to
slight variations in the main parameters during the development of the PCR method. To
assess the critical parameters of the method it is essential to achieve an optimized PCR
assay. Examples of such parameters include: concentration of MgCl2, primers, buffer,
dNTP and DNA Taq polymerase as well as annealing time and temperature. To identify
the critical points that must be entirely be controlled in the assay, critical control
parameters characterization is mandatory (Belak, & Thorén, 2004).
Page 99
75
iv) Repeatability
Compliance between replicates within and between runs of the qPCR assay must be
considered. This provides significant information about the method before further
validation is performed. If excessive inconsistency is found, it should be perfected prior
to continue the validation process. To check the PCR assay repeatability, each replicate
should be considered as an independent sample. For example, for a replicate (e.g. a
triplicate), three different aliquots of DNA extract are prepared for a specimen and
amplified, and the variation from the mean value detected is determined as an indication
of repeatability. Therefore, use of single DNA extract to analyze triplicate amplifications
in not acceptable. Inter-run coefficient of variation of the qPCR assay can be determined
by using the Ct-values generated from the replicated samples (Belak, & Thorén, 2004).
v) Determination of Analytical Specificity and Sensitivity
Specificity of the PCR assay is defined as the ability of the system to discriminate the
target species from other non-target species. The specificity of the assay is determined by
analyzing DNA extract from target and genetically related species. Allowable cross-
reactivity is mainly dependent on the desired purpose of the assay and must be determined
for each case.
Limit of detection (LOD) or sensitivity of the assay is defined as the lowest quantity
of DNA detected by the assay. Serially diluted extracted DNA is used until the assay can
no longer detect the target in question in more than 5% of the replicates to determine the
assay’s sensitivity (Belak, & Thorén, 2004).
Page 100
76
vi) Establishing Reproducibility of the Assay
Reproducibility plays an important role to evaluate the assay precision. An identical
method (reagents, protocol and controls) is applied in various laboratories to determine
the assay reproducibility. At least three laboratories test results of the same set of
specimens (minimum of 20 samples) with identical aliquots are required to validate the
assay reproducibility as well as ruggedness of the assay (Belak, & Thorén, 2004).
For DNA-based procedures, the following additional information should be supplied
in particular (Codex Alimentarius Commission, 2010):
Primer pairs
“General methods have to provide the defined primer pairs and the sequence they
target. Recommendations as to the efficiency/use of primer set have to be clearly stated,
including if the primers are suitable for screening and/or quantification”.
Amplicon length
“Food processing will generally lead to a degradation of target DNA. The length of
the amplified product may influence the PCR performance. Therefore the selection of
shorter amplicon sizes (within reason) will increase the possibility to get a positive signal
in the analysis of highly processed foodstuffs. In general the length of the amplified
fragment for the taxon-specific DNA sequence and the target sequence should be in a
similar size range”.
Whether the method is instrument or chemistry specific
“At the moment a number of different types of real-time instruments and chemistries
are available. These instruments and chemistries may have different performance such as
Page 101
77
stability of reagents, heating and cooling characteristics, which affects ramp rates and
affects the time necessary for a whole PCR run”.
“Beside the differences in the heating and cooling system there are differences in the
technique and software used to induce and subsequently to record the fluorescence. The
detection and quantification of the fluorescence could also vary according to the recording
instruments and software used. Qualitative methods generally tend to be less instrument-
specific than quantitative methods”.
“The methods are generally instrument and chemistries dependent and cannot be
transferred to other equipment and chemistries without evaluation and/or modification”.
Page 102
78
MATERIALS AND METHODS
3.1 Collection of Sample
Authentic fresh muscle of the beef (Bos taurus), buffalo (Bubalus bubalis), goat
(Capra hiscus), lamb (Ovis aries), chicken (Gallus gallus), duck (Anas platyrhychos),
pigeon (Columba livia), quail (Coturnix coturnix)) and selected aquatic species such as
cod (Gadus morhua), salmon (Salmo salar), pangas (Pangasius pangasius), tuna
(Thunnus orientalis), tilapia (Oreochromis niloticus) and rohu (Labeo rohita), frog (Rana
kunyuensis) and turtle (Cuora amboinensis)), as well as five plant species such as wheat
(Triticum aestivum), onion (Allium cepa), garlic (Allium sativum), ginger (Zingiber
officinale) and pepper (Capsicum annuum) were purchased in triplicate on three different
days from various wet markets and supermarkets (Pasar Borong Selangor, Serdang, Pudu
Wet Market, Kuala Lumpur and Tesco, Petaling Jaya, Selangor). Pork (Sus scrofa) was
purchased in triplicates from three different vendors from a Chinese wet market in Sri
Kambangan, Selangor, Malaysia. Meat from three different euthanized dogs (Canis lupus
familiaris), cats (Felis catus) and rats (Rattus rattus) were collected from Dewan
Bandaraya Kuala Lumpur (DBKL) as described elsewhere (Ali, et al., 2015d). Monkey
(Macaca fascicularis) meat was obtained from the Department of Wildlife and National
Parks (DWNP) Peninsular Malaysia (Cheras, Kuala Lumpur) as described elsewhere
(Rashid et al., 2015b). Commercial beef and pork frankfurters, meatballs and burger of
different brands were purchased in triplicates from different stores in Kuala Lumpur,
Malaysia. In addition, seven curry samples were purchased from seven different
restaurants. Transportation of all samples and products was carried out under ice-chilled
condition (40C) and were stored at −200C until further use to prevent the natural and
enzymatic degradation of DNA.
Page 103
79
3.2 Extraction of DNA
Yeastern Genomic DNA Mini Kit (Yeastern Biotech Co., Ltd, Taipei, Taiwan) was
used for the extraction of total DNA from meat and fish samples (Rashid et al., 2015b).
Briefly, 20 mg of muscle tissues was ground and homogenized with a micro pestle
followed by the addition of lysis buffer and proteinase K. The mixture was incubated at
600 C for cell lysis and protein degradation. The spin column was used for the binding of
DNA to the glass fibre matrix under centrifugation. Ethanol containing wash buffer was
used to remove any contaminants. The purified DNA was eluted in elution buffer. DNA
of Plant species (wheat, onion, garlic, ginger and pepper) was extracted by using the
DNeasy Plant Mini Kit (QIAGEN GmgH, Hilden, Germany). NucleoSpin Food DNA kit
(MACHEREY-NAGEL GmbH & Co. KG, Duren, Germany) was used for the extraction
of DNA from food products (frankfurters, meatballs and burgers) (Hird, Lloyd, Goodier,
Brown, & Reece, 2003). Concentration and purity of the extracted DNA were checked
using UV–VIS Spectrophotometer (NanoPhotometer Pearl, Implen GmbH, Germany)
based on the absorbance at 260 nm and ratio at A260/A280, respectively (Napolitano et al.,
2014).
3.3 Development of Biomarkers for Multiplex PCR
Proper design of primers is a vital step/factor for an efficient and successful PCR
amplification. Higher efficiency and maximum specificity of PCR depends on the optimal
matching of primer sequences and also adequate primer concentrations (He, Marjamäki,
Soini, Mertsola, & Viljanen, 1994). An inaccurately designed primers may lead to little
product or formation of primer-dimer and/or non-specific products (Abd-Elsalam, 2003).
The development of multiplex PCR primer sets is more complex and complicated because
all primers are annealed to their respective targets under a single set of PCR conditions.
Specificity and Tm are also more important in a multiplex system over the conventional
PCR (Razzak, 2015). In addition, PCR products length (amplicon size) should also be
Page 104
80
taken in account during the design of primers. The size of the amplicons depends on the
resolution capability of the detection system; so that the generated PCR products can
distinguish easily from one another.
In order to design the primers, whole genomic sequences of the target species were
retrieved from NCBI database (http://www.ncbi.nlm.nih.gov/) and were aligned using
Molecular Evolutionary Genetics Analysis version 5 (MEGA5) alignment tool (Tamura
et al., 2011) for identifying the inter-species hyper-variable and intra-species conserved
regions. A publicly available primer designing software, Primer3Plus was used to get the
desired sequences of the primers.
The following criteria and guidelines were considered for the design of species specific
primers for amplifying specific target sequence:
3.3.1 Primer Length
The length of primer plays an important role for the specificity as well as annealing
time and temperature for the target binding; these parameters are vital for a successful
PCR (Wu, Ugozzoli, Pal, Qian, & Wallace, 1991). Too long primers may decrease the
efficiency of template DNA binding at normal annealing temperature due to the chance
of forming secondary structure; whereas, too short primers may result in low specificity
and non-specific amplification (Abd-Elsalam, 2003). The ideal primer length should be
18-28 nucleotides but usually good activity is obtained with primers having 20-24
nucleotides in length (Dieffenbach, Lowe, & Dveksler, 1993).
3.3.2 GC Content
One of the most important characteristics of primer is its GC content which refers to
its annealing strength. To get good PCR product, a reasonable GC content should be
maintained. Tm and annealing temperature (Ta) fully depend on the percentage (%) of
Page 105
81
GC content (Rychlik, Spencer, & Rhoads, 1990). The ideal GC content is 40-60% and 3
or more G’s or C’s at the 3′-end should be avoided because it has adverse effect to the
primer specificity. Primer should not have long polyG or polyC stretches which result in
non-specific annealing (Ali, Razzak, & Hamid, 2014b).
3.3.3 Melting and Annealing Temperature
Melting temperature (Tm) is an important parameter of primer, since it plays a vital
role for primer annealing. Primers with Tm of 55-650 C work best in most of amplification
reactions. Tm of both forward and reverse primers should have similar as they are
annealed simultaneously. Moreover, multiplex PCR efficiency is effected by a little
differences of Tm between the primer sets. Since all targets are amplified in a multiplex
PCR in a single reaction mixture, all primers should have very close Tm. The acceptable
Tm variation is 3-50 C between the primers but to get good result ≤ 2 °C Tm variation is
preferable. Significantly lower Tm of a primer than the PCR annealing temperature (Ta)
may cause failure to anneal and extend, while significant higher Tm may lead to non-
hybridization and can extend at an incorrect location along the DNA sequence (Ali et al.,
2014b). The approximate Tm value of the primer can be calculated by using the formula
(generally valid for oligos in the 18–30 base range) of Wallace et al. (1979) Tm (°C) = 2
x (nA+nT) + 4 x (nG + nC), where, nA, nT, nG and nC are the number of respective
nucleotides in the primer. Mismatching between template DNA and primers is the main
feature for specificity and Tm of the designed primers. Because the presence of 1% of
base mismatch in the double-stranded (ds) DNA would reduce the Tm value by 1-1.50C
(Matsunaga et al., 1999). However, the increasing of percent of mismatching with non-
target species leads to the decrease of Tm value, but higher specificity. On the other hand,
the Tm of the TaqMan probes of the real-time PCR must be 8-100C degree higher than
that of primers to facilitate the preferential binding of the probes prior to the annealing of
the primers to the template (Arya et al., 2005).
Page 106
82
3.3.4 3'-end Specificity
For the design of primer to achieve a successful PCR experiment, 3′-end sequence is
very important because during the extension step, DNA polymerase starts to attach
nucleotides from the 3′-end of a primer. Since, complete annealing of the primer 3′-end
is mandatory and incomplete binding at the 3′-end results in lower PCR or often no PCR
products (Yuryev, 2007). Therefore, primers should have mismatch with non-target
species at 3′-end, as it prohibits the PCR amplification (Ali et al., 2014b). It is well known
that for the control of mis-priming, the 3′-end position of the primer plays an important
role (Kwok et al., 1990).
3.3.5 Primer-Primer Interactions
Primer should have a minimum of intermolecular or intramolecular homology that can
promote to the formation of either primer dimerization or hairpins (Figure 3.1a & b).
Primer with nucleotide sequences that would allow anneal one primer to other primer(s),
results in primer-dimer formation (Figure 3.1a), particularly when 3′-ends of the primers
anneal to each other. Inter primer homology in the middle position of two primers may
also interfere with hybridization. Primer with a self-homology region result in “sanp
back” or able to form partially double stranded structures, hairpin (Figure 3.1b), which
will interfere with annealing to the template. To overcome the formation of hairpin, it is
recommended that intra-primer homologies of 3 bp or more should be avoided (Abd-
Elsalam, 2003).
Figure 3.1: Primer-Primer interactions (a) primer-dimer; (b) hairpin (Adapted
from Ali et al., 2014b).
(a)
(b)
Page 107
83
3.3.6 Specificity
Primer specificity is checked in three different ways. At first, primers were aligned by
using online Basic Local Alignment Tool (BLAST)
(http://blast.ncbi.nlm.nih.gov/Blast.cgi) to screen the identical and distant species.
Secondly, to determine the total number of mismatch between target and non-target
species, the primers are multiple sequence aligned with some common species using an
alignment tool such as ClustalW (http://www.genome.jp/tools/clustalw/) or MEGA5.
Finally, each primer is assayed in PCR experiment with template DNA of non-target
species to confirm the specificity.
3.3.7 Design of Species-Specific Primers and Probes
Six sets of primers were designed targeting mitochondrial cytb and ND5 genes because
of their higher degree of divergence. This results in sufficient conserved regions within
the same species but adequate polymorphism among the closely related species
(Mohamad et al., 2013; Razzak et al., 2015). The Sequences of cytb and ND5 genes of
cow (V00654.1), buffalo (NC_006295.1) and pig (AF034253.1) species were retrieved
from the National Centre of Biotechnology Information (NCBI) database and were
aligned using the MEGA5 alignment tool (http://www.megasoftware.net/ ) to identify the
hyper-variable and conserved regions. Publicly available software Primer3Plus (version:
2.4.1) (http://www.bioinformatics.nl/cgibin/ primer3plus/ primer3plus.cgi) was used to
design the six sets (two sets for each species (one set from cytb and another set from
ND5)) of primers (Table 3.1). The initial specificity of the designed primers was tested
by screening with nucleic acid sequences of similar and distinct species using online Basic
Local Alignment Tool (BLAST) in NCBI database
(http://blast.ncbi.nlm.nih.gov/Blast.cgi) to avoid cross-species amplification. To
determine the total mismatch between the target and non-target species, the primers were
in-silico screened with 17 animal species, namely, cow (Bos taurus), buffalo (Bubalus
Page 108
84
bubalis), pig (Sus scrofa), horse (Equus caballus), goat (Capra hircus), deer (Cervus
nippon), sheep (Ovis aries), donkey (Equus africanus), dog (Canis lupus), rabbit
(Oryctolagus cuniculus), monkey (Macaca fascicularis), cat (Felis catus), chicken
(Gallus gallus), duck (Anas platyrhynchos), pigeon (Columba livia), quail (Coturnix
coturnix) and rat (Rattus norvegicus), 8 aquatic species, namely, cod (Gadus morhua),
salmon (Salmo salar), tuna (Thunnus orientalis), tilapia (Oreochromis niloticus), rohu
(Labeo rohita), Pangas (Pangasius pangasius), frog (Rana kunyuensis) and turtle (Cuora
amboinensis) and four plant species, namely, wheat (Triticum aestivum), onion (Allium
cepa), ginger (Zingiber officinale) and pepper (Capsicum annuum) using a ClustalW
multiple sequence alignment program (http://www.genome.jp/tools/clustalw/) and
MEGA5 alignment tool. The final specificity was confirmed through a PCR assay against
templates of 25 alien species. After conformation of the primer sets, three probes for the
real-time PCR assay also designed based on the primer set of ND5 gene of cow and cytb
gene of buffalo and pig species by using Primer3Plus software and initial specificity were
tested by using BLAST and probe sequences were listed on Table 3.1. The primers and
probes were synthesized by Integrated DNA Technologies (IDT), Singapore and supplied
by First BASE Laboratories Sdn Bhd., Selangor, Malaysia.
Page 109
85
Table 3.1: Name and sequence of primers and probes used in this study.
Name Species Target
gene Sequence (5ʹ - 3ʹ) Tm
Amplicon
size (bp)
Cocytb Cow
(Bos taurus) Cytb
Forward: GGAGTACTAGCCCTAGCCTTCTC
Reverse: CTACTAGGGCTCAGAATAGGCATT
57.8
58.7 120
CoND5 Cow
(Bos taurus) ND5
Forward: GGTTTCATTTTAGCAATAGCATGG
Reverse: GTCCAATCAAGGGTATGTTTGAG
Probe: ACAAATCTCAATACCTGAGACCTCCAACAGA
61
59.8
68.5
106
Bucytb
Buffalo
(Bubalus bubalis) Cytb
Forward: GGGTTCTAGCCCTAGTTCTCTCT
Reverse: ATGGCCGGAACATCATACTT
Probe: AATCCTCATTCTCATGCCCCTGCTACA
58.6
59.3
70.3
90
BuND5 Buffalo
(Bubalus bubalis) ND5
Forward: TCGCCTAGCTTCTTACACAAAC
Reverse: TGGTTTGTGACTGTGATGGAT
58.7
58.8 138
Pocytb Pork
(Sus scrofa) Cytb
Forward: TATCCCTTATATCGGAACAGACCTC
Reverse: GCAGGAATAGGAGATGTACGG
Probe: CCTGCCATTCATCATTACCGCCC
60.9
58.7
70.7
146
PoND5 Pork
(Sus scrofa) ND5
Forward: GATTCCTAACCCACTCAAACG
Reverse: GGTATGTTTGGGCATTCATTG
58.6
60.1 73
Page 110
86
3.3.8 Construction of Pairwise Distance and Phylogenetic Tree
The pairwise distance and phylogenetic tree were constructed by aligning the each
amplicon sequence with the respective gene sequences of target and 28 non-target species
using the neighbour-joining method of MEGA5 version 5.1 software (Tamura et al.,
2011). For example, the sequence of beef cytb amplicon was aligned along with the cytb
gene of beef and other 28 non-target species such as buffalo, goat, sheep, deer, donkey,
horse, pork, dog, cat, rabbit, monkey, chicken, duck, pigeon, quail, rat, salmon, tuna, cord,
tilapia, rohu, pangas, frog, turtle, wheat, onion, ginger, chili. Pairwise distance of other
five amplicons were constructed in the same way.
3.3.9 Construction of 3D Plots
3D plot of each primer set was generated from three variables such as forward and
reversed primer mismatch (Section 3.3.7) and pairwise distance (Section 3.3.8) data of
individual primer sets using XLSTAT2014 version 2014.5 software (Addinsoft, 2013).
3.4 Development of Simplex PCR Assay
3.4.1 Optimization of Simplex PCR Assay
Simplex PCR of individual primer was developed using DNA extracted from muscle
tissue of relevant species (cow, buffalo and pig). Total volume of all amplification assays
were 25 μL comprised of 5 μL of 5X GoTaq Flexi Buffer, 0.2 mM each of dNTP, 2.5
mM MgCl2, 0.625 U GoTaq Flexi DNA Polymerase (Promega, Madison, USA), 0.4 μM
of each primer (Table 3.2) and 2 μL (20 ng/μL) of the total DNA template. Negative
control (PCR amplification without template DNA) was carried out for each PCR reaction
to avoid any contamination with PCR mixture. In the simplex PCR specificity test, I also
used 0.4 μL a universal eukaryotic primer (forward primer: 5' AGGATCCATTGG
AGGGCAAGT 3' and reverse primer: 5' TCCAACTACGAGCTTTTTAACTGCA 3') of
99 bp amplicon sized from 18S rRNA gene (Safdar & Junejo, 2015). ABI 96 Well Verity
Page 111
87
Thermal Cycler (Applied Biosystems, Foster City, CA, USA) was used for the PCR
reaction following the cycling parameters of an initial denaturation at 950C for 3 min
followed by 35 cycles of denaturation at 950C for 30s, annealing at 58-620C for 30 – 35
s, extension at 720C for 40 s and the final extension at 720C for 5 min (Table 3.3). PCR
products were kept at −200C for further analysis.
Table 3.2: Concentration of simplex PCR components.
Note: 5 µl of 5X GoTaq Flexi Buffer was used in all PCR experiments.
Primer dNTP (mM) MgCl2 (mM) Taq pol (unit) Primer (μM)
Cocytb 0.20 2.50 0.625 0.40
CoND5 0.20 2.50 0.625 0.40
Bucytb 0.20 2.50 0.625 0.40
BuND5 0.20 2.50 0.625 0.40
Pocytb 0.20 2.50 0.625 0.40
PoND5 0.20 2.50 0.625 0.40
Table 3.3: Cycling parameters of simplex PCR reactions.
PCR
reaction
Initial
denaturation
35 cycles Final
extension Denaturation Anneling Extension
Cocytb 950 C for 3
min
950 C for 30 s 600 C for
35 s
720 C for
40 s
720 C for
5 min
CoND5 950 C for 3
min
950 C for 30 s 600 C for
30 s
720 C for
40 s
720 C for
5 min
Bucytb 950 C for 3
min
950 C for 30 s 600 C for
30 s
720 C for
40 s
720 C for
5 min
BuND5 950 C for 3
min
950 C for 30 s 600 C for
30 s
720 C for
40 s
720 C for
5 min
Pocytb 950 C for 3
min
950 C for 30 s 600 C for
35 s
720 C for
40 s
720 C for
5 min
PoND5 950 C for 3
min
950 C for 30 s 600 C for
35 s
720 C for
40 s
720 C for
5 min
3.4.2 Gel Electrophoresis
In order to detect of species-specific simplex PCR amplified products, DNA
visualization was accomplished by conventional gel electrophoresis and finally on
automatic QIAxcel Advanced Capillary Electrophoresis System.
Page 112
88
3.4.2.1 Conventional Gel Electrophoresis
To perform the conventional gel electrophoresis, 2% (w/v) agarose gel was prepared
as follows:
Firstly, 150 ml of 1 X Tris-borate-EDTA (TBE) buffer was taken in a 250 ml beaker
subsequently added 3 g of agarose in the buffer and mixed well followed by heating in a
microwave oven to dissolve completely. Once the gel temperature reached 50-600C, 5-6
μL of fluorosafe DNA stain (1st Base Laboratories, Selangor, Malaysia) was added and
mixed gently. Then, the molten gel mixture was poured into a horizontal electrophoresis
tray containing the well comb. The gel then solidified for 20-30 minutes. After placing
the gel tray inside the 1× TBE buffer containing tank, 6 μL PCR products and 100 bp
DNA ladder (Promega, USA) were loaded into the gel wells. After that, the gel
electrophoresis (SUB13, Hoefer, Inc., California, USA) was carried out at 120 volts for
about 70 min resulting the PCR products were separated on the basis of molecular size.
Finally, the PCR products banding profile was visualized under a gel image
documentation system (AlphaImager HP, Alpha Innotech Corp., California, USA).
3.4.2.2 QIAxcel Advanced Capillary Electrophoresis System
The QIAxcel Advanced Capillary Electrophoresis System offer rapid, fully automatic,
very sensitive and high resolution (can separate the products with 3-5 bp differences),
required low amount of sample and convenience due to the use of ready-to-use gel
cartridge. Due to the automatic system, minimum handling interaction is required for
samples analysis resulting in little manual error and excluding the laborious gel
preparation. The system is able to generate both gel images and electropherograms of the
analyzed samples in a single analysis platform by applying the electrical current to a gel-
filled capillary cartridge via individual electrode of each capillary. Unlike conventional
Page 113
89
gel electrophoresis, electropherograms of the PCR products can determine the accurate
sizes of the amplicons.
3.4.3 Specificity Test of Simplex PCR Assay
Specificity of the simplex PCR assays were analyzed by cross-amplification with the
extracted DNA of three targets species (cow, buffalo and pig), 20 non-target of terrestrial
and aquatic animal species (goat, lamb, dog, cat, rabbit, monkey, donkey, chicken, duck,
pigeon, quail, rat, salmon, tuna, cod, tilapia, rohu, pangas, frog and turtle) and 5 plant
species (wheat, onion, garlic, ginger and pepper) which are commonly used in food
products. In the simplex PCR specificity test, I also used 0.4 μL a universal eukaryotic
primer (forward primer: 5' AGGATCCATTGGAGGGCAAGT 3' and reverse primer: 5'
TCCAACTACGAGCTTTTTAACTGCA 3') of 99 bp amplicon sized from 18S rRNA
gene (Safdar & Junejo, 2015).
3.4.4 PCR Product Sequencing
Extracted DNA of three target species (cow, buffalo and pig) were amplified using
specific primer set and were confirmed the successful amplification with DNA
visualization by gel electrophoresis. The amplified products were sequenced after cloning
into the pJet1.2 blunted Vector by Integrated DNA Technologies (IDT), Singapore and
supplied by First BASE Laboratories Sdn Bhd., Selangor, Malaysia. Briefly, the blunt-
end of the purified PCR products constructed by proofreading DNA polymerases ligated
into the cloning site of pJet1.2 blunted Vector followed by introducing the recombinant
plasmid into living E. coli cells. The lethal gene of the vector is disrupted by the insertion
of PCR product facilitating the propagation of only recombinant plasmid containing
bacterial cells since plasmid contains in vitro transcription promoter T7. A single
transformation colony of the recombinant plasmid containing cells is produced due to the
expression of ampicillin-resistance gene which is encoded in the plasmid. After
Page 114
90
purification of the recombinant plasmid containing insert was separated by digestion with
restriction enzyme. Finally, the PCR products were sequenced to determine the original
order of the nucleotides the products.
The derived sequences were then compared with GenBank sequences using the
nucleotide basic local alignment search tool (BLAST) to evaluate any species match and
were also aligned with specific gene sequence using MEGA5 software to determine the
similarity with specific species.
3.5 Development of Tetraplex PCR Assay
I developed double genes targeted tetraplex PCR assay for cow and buffalo prior to
develop hexaplex PCR for cow, buffalo and pig.
3.5.1 Optimization of Tetraplex PCR Assay
To develope a tetraplex PCR system for the simultaneous amplification of four
targeted genes, two genes (cytb and ND5) of each target species (cow and buffalo) were
initially optimized in two duplex platforms for the primers of Cocytb and Bucytb as well
as for CoND5 and BuND5 followed by triplex PCR of Cocytb, CoND5 and BuND5 and
finally multiplex PCR of Cocytb, Bucytb, CoND5 and BuND5. All amplifications were
performed in a total volume of 25 μL containing of 5 μL of 5X GoTaq Flexi Buffer in
Thermal Cycler (Applied Biosystems, Foster City, CA, USA). The concentration of
primers and other reagents and the cycling parameters were given in Table 3.4 and 3.5,
respectively. As in simplex PCR negative control was also performed in all multiplex
PCR reactions to eliminate any PCR mixture contamination. Due to the poor resolution
of agarose gel, the PCR products were analysed using QIAxel DNA High Resolution Kit
(QIAGEN GmbH, Germany) with size marker containing 500, 400, 300, 250, 200, 150,
100, 75, 50 and 25-bp marker DNA and with 600 and 15-bp alignment marker in QIAxcel
Page 115
91
Advanced Capillary Electrophoresis System (QIAGEN GmbH, Hilden, Germany) for
both gel image and electroferogram.
Table 3.4: Concentration of PCR components of various PCR assays.
Note: 5 µl of 5X GoTaq Flexi Buffer was used in all PCR experiments.
PCR dNTP
(mM) MgCl2 (mM) Taq pol (unit) Primer (μM)
Duplex and
Triplex
0.2 2.5 0.94 0.2 – 0.4
Tetraplex 0.25 3.5 1.0 0.16 – 0.4
Table 3.5: Cycling parameters of various PCR reactions.
PCR
reaction
Initial
denaturation
35 cycles Final
extension Denaturation Anneling Extension
Duplex
and
Triplex
950 C for
3 min
950 C for
30 s
600 C for
45 s
720 C for
45 s
720 C for
5 min
Tetraplex 950 C for
3 min
950 C for
40 s
600 C for
60 s
720 C for
50 s
720 C for
5 min
3.5.2 Specificity Test of Tetraplex PCR Assay
Specificity of the tetraplex assay was analyzed by cross-amplification with the
extracted DNA of 20 non-target of terrestrial and aquatic animal species (goat, lamb, dog,
cat, rabbit, monkey, donkey, chicken, duck, pigeon, quail, rat, salmon, tuna, cod, tilapia,
rohu, pangas, frog and turtle) and 5 plant species (wheat, onion, garlic, ginger and pepper)
which are commonly used as food matrices.
Page 116
92
3.5.3 Limit of detection (LOD) of Tetraplex PCR Assay under Raw State
To determine the limit of detection (LOD) of the tetraplex and mPCR assay, extracted
DNA of target-species (cow, buffalo and pig) were diluted serially from higher
concentration (50 ng/μL) to 10.0, 5.0, 1.0, 0.5, 0.2, 0.1, 0.05, 0.02 and 0.01 ng/μL) and
was used as a template.
3.5.4 Sensitivity test of Tetraplex PCR Assay under Binary Meat Admixture
To evaluate the tetraplex PCR assay sensitivity a binary admixture of beef and buffalo
meat was prepared. Firstly, both raw beef and buffalo meat were minced and blended
separately followed by mixing of beef and buffalo meat in the ratios of 99:1, 95:5, 90:10,
75:25, 50:50, 25:75, 10:90, 5:95 and 1:99 in a 100 g specimens (Rea et al., 2002). The
prepared admixtures were homogenized by vigorous blending.
3.5.5 Sensitivity test of Tetraplex PCR Assay under Commercial Product (Burger)
To simulate the adulteration effect on commercial meat products, different types of
burgers were prepared according to Ali et al. (2012b). At first pure beef and buffalo
burgers were prepared separately and then the prepared beef burgers were spiked with
1% buffalo meat and buffalo burgers were spiked with 1% beef. A third category burgers
were prepared by spiking of 1% buffalo meat with commercial beef burgers. Typically,
each type of burger was made by adding the following ingredients: 500 g of minced meat,
1 g of egg, 1 g of chopped onion, one teaspoon of cumin seed, ¼ teaspoon of cayenne
pepper and 6 g of finely chopped sun-dried tomato and mixed well. Finally, the prepared
mixture was equally divided into four parts and each part was pressed into the shape of a
burger. The prepared burger was placed in a fridge for 1 h to firm up. The model and
commercial burgers were treated to adjust the excessive cooking and boiling effects under
autoclaving at 1210 C and 15-psi pressure for 2.5 h. All samples were prepared in triplicate
on three different days and were stored at -200 C until the DNA was extracted.
Page 117
93
3.5.6 Target DNA Stability Test under Tetraplex PCR Assay
To mimic the usual cooking conditions, the raw meat samples were subjected to three
different heat treatments. The first one was boiling, in which the beef and buffalo meat
were boiled in water at 980 C on a hot plate for 45 min (Ali et al., 2015b). To simulate a
conventional canning process and steam cooking practices, the meat samples were
autoclaved at 1210 C under 15-psi pressure for 2.5 h (Ali et al., 2015d). Further, the meat
samples were subjected to microwave cooking which is a quick and modern system of
heating at 500 watt, 600 watt and 700 watt for 30 min (Table 3.6) (Ali et al., 2015c). All
treated samples were kept at -200 C for next uses.
Table 3.6: Different thermal processes applied to target meat samples.
Heat
Treatment
Condition Time
(min)
Pressure
(psi)
References
Boiling 98° C 45 - Ali et al., 2015b
Autoclave 121° C 150 15 Ali et al., 2015d
Microwave 500, 600, 700 W 30 - Ali et al., 2015b
3.6 Development of Hexaplex (Multiplex) PCR of Cow, Buffalo and Pig
After development of tetraplex PCR system, hexaplex (multiplex) PCR assay for the
simultaneous amplification of six targeted genes, two genes (cytb and ND5) of each target
species (cow, buffalo and pig) was optimized with the addition of two pig genes, Pocytb
and PoND5.
3.6.1 Optimization of Multiplex (Hexaplex) PCR (mPCR) Assay
The mPCR assay was optimized in a 25 μL of total reaction volume comprised of 5
μL of 5X GoTaq Flexi Buffer, 0.25 mM each of dNTP, 4.0 mM MgCl2, 1.25 U GoTaq
Flexi DNA Polymerase (Promega, Madison, USA), 0.12-0.60 μM of each primer (Table
3.7) and 1 μL (20 ng/μL) of the total DNA template of each species and required quantity
Page 118
94
of the nuclease free water. ABI 96 Well Verity Thermal Cycler (Applied Biosystems,
Foster City, CA, USA) was used for the PCR reaction following the cycling parameters
of an initial denaturation at 950 C for 5 min followed by 40 cycles of denaturation at 950
C for 50 s, annealing at 600 C for 90 s, extension at 720 C for 50 s and the final extension
at 720 C for 7 min. For the detection of species-specific simplex PCR amplified products,
DNA visualization was accomplished on QIAxcel Advanced Capillary Electrophoresis
System (QIAGEN Hilden, Germany) for both gel image and electroferogram. PCR
products were kept at −200 C for further analysis.
Table 3.7: Concentration of the primers used in mPCR assay.
Primer Cocytb CoND5 Bucytb BuND5 Pocytb PoND5
Concentration
(μM) 0.60 0.40 0.12 0.20 0.20 0.50
3.6.2 Specificity Test of Multiplex PCR Assay
Specificity of the mPCR (hexaplex) assay was also analyzed by cross-amplification
with the extracted DNA of 20 non-target of terrestrial and aquatic animal species and 5
plant species described in section 3.5.2.
3.6.3 Limit of Detection (LOD) of Multiplex PCR Assay under Raw State
To determine the limit of detection (LOD) of the mPCR assay, extracted DNA of
target-species (cow, buffalo and pig) were diluted serially from higher concentration (50
ng/μL) to 10.0, 5.0, 1.0, 0.5, 0.2, 0.1, 0.05, 0.02 and 0.01 ng/μL) and was used as a
template.
Page 119
95
3.6.4 Sensitivity Test of Multiplex PCR Assay under Commercial Products
(Frankfurters and Meatballs)
For the screening of commercial products using developed mPCR system, three types
of ready-to-eat model meatballs and frankfurters of beef, buffalo and pork were prepared
as per Razzak et al. (2015) (Table 3.8). The prepared beef, buffalo and pork products were
deliberately adulterated by spiking of 1%, 0.5% and 0.1% of beef, buffalo and pork into
a balanced amount of buffalo and pork; beef and pork; and beef and buffalo meat,
respectively. Thus, prepared 0.1% contaminated frankfurters and meatballs were
autoclaved at 1210 C for 2.5 h under 15-psi and 45-psi pressure, respectively (Rahman et
al., 2014). All samples were stored at -200 C until DNA was extracted.
Table 3.8: Formulation of model meatball and Frankfurter.
Ingredients Meatball (~35 g/piece) Frankfurter (~70 g/piece)
Beef Buffalo Pork Beef Buffalo Pork
Minced meat 23a 23a 23a 45a 45a 45a
Soy protein 3 3 3 7.5 7.5 7.5
Starch/breadcrumb 5 5 5 6.5 6.5 6.5
Chopped onion 1 1 1 2.5 2.5 2.5
Chopped ginger 0.1 0.1 0.1 0.15 0.15 0.15
Cumin powder 0.75 0.75 0.75 0.75 0.75 0.75
Garlic power 0.5 0.5 0.5 0.5 0.5 0.5
Black pepper 0.14 0.14 0.14 0.23 0.23 0.23
Tomato paste 1.5 1.5 1.5 2.0 2.0 2.0
Butter 1.5 1.5 1.5 2.5 2.5 2.5
Salt SA SA SA SA SA SA
Othersb SA SA SA SA SA SA
Note: a1%, 0.5% and 0.1% of beef, buffalo and pork meat were mixed with a
balanced amount of respective minced meat to prepare ~35 g meatball and ~70 g
frankfurter specimen. bFlavouring agents and enhancers. SA, suitable amounts.
Page 120
96
3.6.5 Target DNA Stability Test under Multiplex PCR Assay
To check the stability of the developed mPCR assay, the raw meat samples were
subjected to three different heat treatments. The first one was boiling, in which the beef,
buffalo and pork meat were boiled in water at 980 C on a hot plate for 90 min (Ali et al.,
2015b). To simulate a conventional canning process and steam cooking practices, the
meat samples were autoclaved at 1210 C under 45-psi pressure for 20 min and 2.5 h (Ali
et al., 2015d). Further, the meat samples were subjected to microwave cooking which is
a quick and modern system of heating at 500 watt, 600 watt and 700 watt for 30 min (Ali
et al., 2015c). All treated samples were kept at -200 C for next uses.
3.7 Enzymatic Digestion and RFLP Analysis
The sequences of the amplified PCR products were retrieved from NCBI GenBank
database (http://www.ncbi.nlm.nih.gov/genbank) and a publicly available NEBcutter
version 2.0 software (http://tools.neb.com/ NEBcutter) was used to select the specific and
appropriate restriction endonucleases for all the PCR amplicons prior to test the mPCR-
RFLP assay to ensure distinctive RFLP patterns for all targets. The restriction patterns of
the PCR amplicons of beef, buffalo, and pork mitochondrial cytb and ND5 genes are
given in Table 3.9.
Table 3.9: Restriction digests of the PCR products.
Target Restriction enzyme Amplicon size (bp) Fragment size
(bp)
Cocytb EciI 120 75, 45
CoND5 FatI 106 87, 19
Bucytb FatI 90 50, 40
BuND5 AluI 138 130, 8
Pocytb CviKI-1 146 80, 45, 21
PoND5 FatI 73 52, 21
Page 121
97
3.7.1 Analysis of Beef and Buffalo PCR Products
The four PCR products of cow and buffalo were digested in two steps: firstly, four
simplex PCR products were digested individually with appropriate restriction enzyme
(Table 3.9) and then tetraplex PCR products of that species were digested using the same
restriction enzyme and reaction conditions.
3.7.1.1 Digestion of Beef and Buffalo Simplex PCR Products
The simplex PCR products of beef cytb and buffalo ND5 genes were digested with
EciI and AluI restriction endonucleases (New England Biolab, Ipswich, MA, United
States), respectively. On the other hand, beef ND5 and buffalo cytb products were
digested with FatI. The total volume of each digestion reaction was 25 μL, which was
composed of 1 μg of unpurified PCR product, 1× digestion buffer (supplied with the
enzyme), 1U of each enzyme, and a balanced amount of sterilized distilled water. The
reaction mixtures were gently mixed and spun down and incubated at 37 °C with EciI and
AluI and 55 °C with FatI in a shaking water bath for 60 min. Finally, the digestion reaction
was stopped by heating the reaction mixtures at 65 °C for EciI and 80 °C for AluI and
FatI for 20 min (Table 3.10).
Table 3.10: Restriction enzyme reaction conditions for the digestion of beef and buffalo
simplex PCR products.
Target Restriction
enzyme
Amount of
PCR Products
(μg)
Incubation
temp. and time
Deactivation
temp. and time
Cocytb EciI 1.0 37 °C for 60 min 65 °C for 20 min
CoND5 FatI 1.0 55 °C for 60 min 80 °C for 20 min
Bucytb FatI 1.0 55 °C for 60 min 80 °C for 20 min
BuND5 AluI 1.0 37 °C for 60 min 80 °C for 20 min
Page 122
98
3.7.1.2 Digestion of Beef and Buffalo Tetraplex PCR Products
The tetraplex PCR products of Cocytb, CoND5, Bucytb, and BuND5 were digested
simultaneously in a 25 μL reaction mixture containing 16 μL of unpurified PCR product,
2.5 μL of digestion buffer, 1.5 μL of AluI, 2.5 μL of EciI, and 2.5 μL of FatI. The reaction
was mixed by gentle shaking, spun down, and incubated in a shaking water bath first at
37°C for 60 min and then at 55°C for 60 min. Enzymatic digestion was stopped by heating
the mixture at 80°C for 20 min in a water bath. The digests were separated in an automated
QIAxcel Advanced Capillary Electrophoresis System (QIAGEN GmbH, Hilden,
Germany) using a QIAxel DNA High- Resolution Kit (QIAGEN GmbH, Hilden,
Germany).
3.7.2 RFLP Analysis of Simplex Pork PCR Products
Pork Pocytb and PoND5 PCR products were digested with CviKI-1 and FatI restriction
endonucleases (New England Biolab, Ipswich, MA, United States) in a separate reaction
tube of 25 μL reaction volume comprising 1 μg of unpurified PCR product, 1× digestion
buffer supplied with the enzyme, 1U of each enzyme, and a required amount of sterilized
distilled water. The reaction mixtures were mixed gently and spun down followed by
incubation at 37°C for CviKI-1 and 55°C for FatI in a shaking water bath for 60 min to
digest the targets properly. Post digested reaction was inactivated by heating the mixtures
for 20 min at 80 °C for FatI while no inactivation was required for CviKI-1 enzyme (Table
3.11).
Table 3.11: Restriction enzyme reaction conditions for the digestion of pork simplex
PCR products.
Target Restriction
enzyme
Amount of PCR
Products (μg)
Incubation
temp. and time
Deactivation
temp. and time
Pocytb CviKI-1 1.0 37°C for 60 min Not required
PoND5 FatI 1.0 55°C for 60 min 80°C for 20 min
Page 123
99
3.7.3 Authentication of PCR Products of frankfurters by RFLP Analysis
To authenticate the four PCR products of beef and buffalo (Cocytb, CoND5, Bucytb,
and BuND5) by RFLP analysis, beef and buffalo frankfurters were adulterated by spiking
of 10% of buffalo and beef, respectively, and were heat-treated by boiling at 98 °C for 90
min and autoclaving at 121 °C under 15 psi pressure for 2.5 h. Porcine frankfurters were
also boiled at 98°C for 90 min and autoclaved at 121°C under 15 psi pressure for 2.5 h,
and RFLP analysis was performed in a separate assay.
3.8 Real-time PCR Assay
3.8.1 Design of Primers and Probes
The oligonucleotide primers designed for the conventional PCR targeting
mitochondrial ND5 gene of cow (Bos taurus) and cytb gene of buffalo (Bubalus bubalis)
and pig (Sus scrofa), respectively were used in the real-time PCR assay and the respective
probe design also described in section 3.3.7 and they were listed in Table 3.12. Beef probe
was labeled with HEX at the 5' end and ZEN/IOWA BLACK FQ at the 3' end; buffalo
was labeled with TAMRA at the 5' end and TAO-IOWA BLACK RQ at the 3' end and
pork probe was labeled with ROX at the 5' end and TAO-IOWA BLACK RQ at the 3'
end (Table 3.12). Eukaryotic 18S rRNA specific primers and TaqMan probe (Table 3.12)
were used as endogenous control (IAC) for the normalization and specificity test of the
developed tetraplex qPCR assay (Ali et al., 2012b). The IAC probe was labeled with FAM
at the 5′ end and ZEN/IOWA BLACK FQ at the 3′ end. The designed primers and probes
were supplied by Integrated DNA Technologies (IDT), Singapore.
Page 124
10
0
Table 3.12: Sequences and concentration of primer and probes used in this study.
Species Target
gene Sequence (5ʹ - 3ʹ)
Amplicon
size (bp)
Final
concentration
(nM)
Reference
Cow ND5
Forward: GGTTTCATTTTAGCAATAGCATGG
Reverse: GTCCAATCAAGGGTATGTTTGAG
Probe: Hex-ACAAATCTCAATACCTGAGACCTCCAACA GA-
ZEN/IOWA BLACK FQ
106
500
500
250
This study
Buffalo Cytb
Forward: GGGTTCTAGCCCTAGTTCTCTCT
Reverse: ATGGCCGGAACATCATACTT
Probe: TAMRA–AATCCTCATTCTCATGCCCCTGCTACA-TAO-IOWA
BLACK RQ
90
300
300
200
This study
Pig Cytb
Forward: TATCCCTTATATCGGAACAGACCTC
Reverse: GCAGGAATAGGAGATGTACGG
Probe: ROX-CCTGCCATTCATCATTACCGCCC- TAO-IOWA BLACK
RQ
146
300
300
200
This study
Eukariotic
(IAC)
18S
rRNA
Forward: GGTAGT GACGAAAAATAACAATACAGGAC
Reversed: ATACGCTATTGGAGCTGGAATTAC C
Probe: FAM-AAGTGGACTCATTCCAATTACAGGGCCT- ZEN/IOWA
BLACK FQ
141
200
200
100
Ali et al.,
2012b
Page 125
101
3.8.2 Multiplex (Tetraplex) Real-time PCR Conditions
Tetraplex real-time PCR assay of beef, buffalo, pork, and IAC were carried out in a
Quant Studio 12K flex real-time PCR system (Applied Biosystems, Foster City, CA) in
a 20 μL reaction volume consisting of 1× GoTaq Probe qPCR Master Mix (Promega,
Madison), 30 ng of the total DNA template for each target species, and required quantity
of nuclease free water. The concentration of primers and probes were listed in Table 3.12.
The amplification was performed using initial denaturation step at 95 °C for 10 min,
followed by 40 cycles of denaturation at 95 °C for 20 s, and annealing and extension at
60 °C for 60 s.
3.8.3 Specificity Test of mqPCR Assay
To analyze the specificity, the tetraplex PCR assay was carried out against the template
DNA of 20 non-target species (goat, lamb, dog, cat, rabbit, monkey, donkey, chicken,
duck, pigeon, quail, rat, salmon, tuna, cod, tilapia, rohu, pangas, frog and turtle) and 5
plant species (wheat, onion, garlic, ginger and pepper) which are commonly used in food.
3.8.4 Limit of Detection (LOD)
To determine the limit of detection (LOD) of the developed tetraplex qPCR assay, total
DNA of the target species (cow, buffalo, and pig) were diluted using 10-fold serial
dilutions (Cheng et al., 2014). Initially, a mixture with equal amount (1:1:1) of genomic
template DNA extracted from the three target species (cow, buffalo, and pig) were made
at 30 ng/μL. Then, it was serially diluted to 3, 0.3, 0.03, and 0.003 ng/μL of total DNA
for three species with nuclease free water. Therefore, 3 μL of the each diluted DNA
solution was added to 20 μL of multiplex reaction mixture so that each target species were
30, 3, 0.3, 0.03, and 0.003 ng of DNA in the reaction mixture and each diluted template
was assayed in 6 replicates.
Page 126
102
3.8.5 Generation of Standard Curves and Quantification of Target DNA and PCR
Efficiency
To construct the standard curves of cow, buffalo, pig, and IAC from tetraplex qPCR
system, DNA was extracted from the ternary admixture (1:1:1) of beef, buffalo and pork
to form mixed DNA template in 1:1:1. After adjusting the concentration to 30 ng/μL
(100%) the extracted DNA was 10-fold serially diluted to 3, 0.3, 0.03 and 0.003 ng/μL of
total DNA with nuclease free water; this resulted in mixtures containing 100% to 0.001%
of DNA for each species. Therefore, 3 μL of the each diluted DNA solution was added
to 20 μL of multiplex reaction mixture as template and three closely spaced Ct values of
the replicates out of six replicates (Cheng et al., 2014; Iwobi et al., 2015) were plotted
against the logarithmic concentration of DNA for each target (Ali et al., 2012b). The
efficiency of the assay was calculated from the slope of the standard curve according to
the following equation (Druml, Mayer, Cichna-Markl, & Hochegger, 2015):
𝐸 (%) = [10(−1/𝑠𝑙𝑜𝑝𝑒) − 1] × 100.
Acceptance range of PCR efficiency between 90 and 110%, corresponding to a
slope of regression between -3.1 and -3.6, and R2 value of ≥ 0.98 (Iwobi et al., 2015).
Quantity of beef, buffalo or pork in an unknown specimen was then determined by
extrapolating the Ct value of the unknown sample in the standard curve for reference
samples (López-Calleja, de la Cruz, González, García, & Martín, 2016). A
semilogarithmic correlation was found between the variables, Ct value and concentration
(Rojas et al., 2010):
Ct = m log [ ] + C
Where, m is the slope and c is the intercept.
Page 127
103
3.8.6 Multiplex Real-time PCR Sensitivity and Validity
To evaluate the sensitivity and suitability of the tetraplex qPCR assay for food product
analysis, two different model meat products (frankfurters and meatballs of beef, buffalo,
and pork) were prepared in the laboratory (section 3.6.4) in three different days to check
inter day reproducibility. Beef products were deliberately adulterated with 10, 1, and
0.1% (w/w) of buffalo and pork, buffalo products were adulterated with 10, 1, and 0.1%
(w/w) of beef and pork, and pork products were adulterated with 10, 1, and 0.1% (w/w)
of beef and buffalo (Table 3.8). The DNA was extracted from the meat products, and the
concentration was adjusted to 30 ng/ μL using nuclease free deionized water and each
template was assayed in 6 replicates.
.
Page 128
104
RESULTS
4.1 Quality and Quantity of Extracted DNA
Total genomic DNA was extracted from raw meat, fish muscle tissues, admixtures and
meat products (burger, meatball and frankfurter) on three different days. The
concentration of the extracted DNA was determined based on the absorbance reading at
260 nm and its purity was evaluated based on the ratio of absorbance at 260 nm and 280
nm (Nejad, Tafvizi, Ebrahimi, & Hosseni, 2014). The absorbance at 260 nm indicates the
absorbance maxima of Nucleic acids and that at 280 nm reflects the absorbance maxima
of proteins. Finally, the A260/A280 ratio provides the DNA purity indication with respect
to the protein contamination (Oliveira, Paim, Reiter, Rieger, & D'azevedo, 2014). The
A260/A280 ratio in this study was found to be between 1.7 and 2.0 for all extracted DNA
which ensured a high quality of DNA was obtained from all samples (Nejad et al., 2014).
The amount of DNA extracted from animal and fish muscle tissue (20 mg) was 74−269
ng/μL, from plant species (100 mg) was 46−134 ng/μL, from meat products (200 mg) was
33−147 ng/μL and from heat treated samples was 32-125 ng/μL (Table 4.1).
Table 4.1: Concentration and purity of the extracted DNA.
Sample Average
Concentration (ng/µl)
Purity
(A260/A280)
Animal tissue (raw) 123−269 1.88-2.0
Animal tissue (Boiled) 71-125 1.80-1.96
Animal tissue (Microwaved) 32-54 1.78-1.85
Animal tissue (Autoclaved) 53-84 1.79-1.92
Fish tissue (raw) 74-161 1.84-2.0
Plant species (raw) 46−134 1.81-1.94
Meat products (raw) 84-147 1.78-1.91
Meat products (Boiled) 49-91 1.76-1.90
Meat products (Autoclaved) 33-62 1.70-1.92
Page 129
105
4.2 Development of Biomarker
In this study, six pairs of primers (two pairs of each species) were designed targeting
cytb and ND5 genes of cow, buffalo, and pig species to develop a double gene targeted
mPCR assay with short length of amplicons (Table 3.1). To develop multiplex PCR assay
with successful PCR products the designed primer pairs must have the particular criteria
including short length amplicon (≥ 150), fully matching with target DNA and not
matching with non-target DNA, with 40-60% GC content and Tm between 55-600 C
(Rashid, 2015a).
4.2.1 In-silico Analysis of Biomarkers using Bioinformatics Tools
The designed primer sequences were aligned in silico against the similar regions of
target and 28 non-target species including 16 terrestrial animal, 8 fish, and 4 plant species,
as cited in section 3.3.7. Complete sequence matching was found only with cow, buffalo,
and pig species, and 3−18 nucleotide (12.5−80%) mismatches were found with other
species (Table 4.2- 4.7). The pairwise distance was also computed using the neighbour-
joining method (section 3.3.8); the lowest distance (0.144) was observed between the cow
and goat species, and the highest (1.993) was found between the cow and wheat species
(Table 4.8-13). These indicated adequate genetic distances among the studied species,
eliminating the probability of any cross-target detection (Taboada et al., 2014). Moreover,
the analysis of phylogenetic trees (Figure 4.1 (a)-(f)) and 3D plots (Figure 4.2 (a)-(f))
demonstrated similar findings, supporting the results of other in silico tests.
Page 130
10
6
Table 4.2: The mismatch comparison of the beef cytb-specific 120 bp site against other 28 non-target species.
Note: FP: forward primer, RP: reversed primer and Pb: probe
Species Mismatch
Cocytb C G G C A C A A A T T T A G T C G A A T G A A T C T G A G G C G G A T T C T C A G T A G A C A A A G C A A C C C T T A C C C G A T T C T T C G C T T T C C A T T T T A T C C T T C C A T T T A T C A T C A T A G C A A T T G C C A T A G T C C A FP RP Pb
Cow . . . . . . . . . . . . . . . . . . . . . . . . . . . . . . . . . . . . . . . . . . . . . . . . . . . . . . . . . . . . . . . . . . . . . . . . . . . . . . . . . . . . . . . . . . . . . . . . . . . . . . . . . . . . . . . . . . . . . . . . 0 0 0
Buffalo T . . T . . . . G . C . G . . T . . G . . . . . T . . . . . G . . . . . . . . . . . . . . . . . . . . . . . . . . C . . . . . . . . . . . . . . A . . T . . C . . C . . . . . C . . . . . C . . T . . . G C . . . . C . . . . A . . . . . . . . 7 4 5
Goat T . . . . . . . . C C . . . . . . . . . . . . . . . . . . . G . . . . . . . . . . . . . . . . . . . . C . . T . . C . . . . . . . . . . . . . . C . . . . . C . . . . . . . . C . . . . . C . . . . . . . C . . . C C . C . . . . . . . . . . . 3 4 4
Sheep T . . . . . . . . C C . . . . . . . . . . . . . . . . . . . A . . . . . . . . . . . . . . . . . . . . T . . . . . C . . . . . . . . T . . . . . C . . T . . C . . . . . T T . C . . . . . C . . . . . . G C . . . C C . C . . . . . . . . T . . 3 6 5
Deer T . . . . . . . . C C . . . . . . . . . . . . . . . . . . . G . . C . . T . . . . . . . . T . . . . . . . . . . . A . . . . . . . . T . . . . . . . . . . . C . . . . . T T . . . . . . . C . . . . . . G C . . . . C . C . . T . . . . . A . . 3 6 3
Donkey . . . T . . T . C G C . C . . . . . . . . . . . . . . . . . T . . . . . . . . . . . . . . . . . . . . C . . . . . . . . . . . . . . T . . T . . C . . . . . C . . . . . T . . A . . C . . . . . . . . . . C . . . C C . G . T A . . C . . . . . 6 7 4
Horse . . . T . . T . C C C . C . . . . . G . . . . . . . . . . . T . . . . . . . . . . . . . . . . . . . . C . . . . . . . . . . . . . . T . . T . . . . . . . . C . . C . . . . . A . . C . . C . . . . . . . C . . . C C . G . T A G . C . . A . . 7 9 4
Pig . . . A . . . G . C C . C . . A . . . . . . . . . . . . . . G . . C . . T . . C . . C . . . . . . . . . . . . . . C . . A . . . . . . . . . . . C . . . . . C . . . . . . . . G . . . . . C . . . . . T . C C . . C C . C . . A G C C . . A . . 6 11 4
Dog . . . A . . T G . C . . . . . A . . . . . G . . . . . . . . . . . C . . . . . . . . G . . . . . . . . . . . . . . A . . A . . . . . . . . T . . A . . . . . . . . C . . . . . C . . T . . C . . . . . . G C . . . T C . A . . A . . . . . A . . 5 7 5
Cat . . . G . . T G . A C . . . . A . . . . . . . . . . . . . . G . . G . . . . . . . . . . . . . . . . . C . . . . . A . . A . . . . . . . . T . G C . . . . . C . . C . . T . . . . . . . . C . . T . . . T C . . . C T . A . . A G G . . . A . . 6 9 7
Rabbit . . . A . . . . C C . . . . . T . . . . . . . . . . . . . . A . . . . . T . . . . . T . . T . . . . . C . . T . . . . . . . . . . . . . . . . . . . . T . . C . . C . . . T . G . . . . . . . . . . . T G C . A . T T . A . T . T . . A . T . . 4 11 4
Monkey . . . A . . T . . C C . T . . . C . . . . . . . . . . . . . A . . . . A . G . C A . T . . . . G C C . C . . . . . C . . A . . . . . . . . . A . C C . G . . C . . . . . . . . A . . C . . C . . . . . . . . C . . C C . C . . A G . C . . A . . 6 8 7
Chicken T . . A C A C . C C C . . . . A . . G . . . G C . . . . . . G . . . . . T . . . . . C . . . . . C C . . . . . . . . . . . . . . . . . . . . . . . . . A . . C . . C C . . . . C . . C . . . G C A . . . G C . . G T . . . A . T . . C A . . . . 10 8 3
Duck . . . A C A G . C C C . G . . A . . . . . . G C . . . . . . A . . . . . . . . . . . G . . T . . C C . . . . . . . A . . . . . . . . . . . . . . C A . T . . C . . C C . A . . A . . C . . . T . A . . . G C . . G . . . C A . . C . . . . . . . 8 6 6
Pigeon T . . . C A . . C C C . C . . T . . . . . . G C . . . . . . . . . . . . T . . C . . . . . T . . C C . T . . A T . A . . A . . . . . . . . . A . C C . T . . C . . C C . . . . C . . C . . . . . A . . . G C . . G C C . C A . T . . C A . . . . 8 10 10
Quial . . . . C A . . C C C . . . . A . . . . . . G C . . . . . . A . . C . . T . . . . . T . . . . . T C . T . . . . . A . . . . . . . . . . . . . . C C . . . . C . . C C . . . . C . . . . . C T . A . . . G C . . G . . . C A . T . . C A . . . . 6 8 5
Rat T . . G . . T . C C C . . . . . . . . . . . . . . . . . . . A . . C . . . . . . . . . . . . . . . . . . . . . . . A . . A . . C . . . . . . . . A . . . . . C . . C . . . . . C . . . . . C . . T . . . G C C . . C C . . . . A . . T . . A . . 6 8 6
Salmon A . . A G G C G C C C . . . . A C . . . . . . . . . . . . . . . . G . . . . . T . . T . . . . . C . . T . . T . . A . . A . . . . . T . . . . . C . . T . . C . . C C . A T . C . . C . . C G . . . . T G C . . . T G C . A . A G . C C . . . . 11 11 8
Tuna T . . A . . T . C C C . C . . T . . . . . . . . . . . . . . G . . C . . T . . . . . . . . . . . T . . T . . . . . . . . . . . . . . . . . . . . A . . . . . C . . C C . A T . C . . . . . C G . . . . . G C . . . C . . G A . A . . T C . T . . 8 9 3
Cord A . . T G A T G C C . . . . . T C . . . . G . . . . . . . . A . . T . . . . . . . . . . . T . . T . . T . . . . . A . . T . . G . . T . . T . . A . . . . . . . . C T . A T . C . . C . . . G . T G . T G C T . . T T . . A . A . . . C . . . . 10 9 7
Tilapia T . . . . A T T C C . . . . . . C . . . . . . . . . . . . . G . . . . . . . . C . . . . . . . . T . . C . . . . . A . . T . . C . . T . . . . . C . . . . . . . . C C . . T . C . . C . . C . . . . . T G C . . . T G C A A . A . . . . . . . . 7 9 6
Rohu A . . A G A C . T A . . . . . . C . . . . . . . T . . . . . T . . C . . . . . . . . . . . . . . T . . C . . A . . A . . A . . T . . . . . . . . A . . . . . C . . C C . A . . A . . . . . . . . . . . T G C C . . C G C A A . . C . T A . T . . 8 13 7
Pangas A . . A G A C . C C C . . . . A C . . . . . . . T . . . . . G . . C . . . . . T . . . . . T . . C . . . . . A . . A . . A . . . . . . . . . . . A . . . . . C . . C C . A . . C . . . . . C G . A G . T . . C . . . G C . A . A C . . C . A . . 10 9 6
Frog . . . . T . T . . C C . T . . . C . . . . G . . . . . . . . A . . C . . . . . . . . . . . . . . C . . T . . . . . C . . . . . . . . T . . T A . A . . T . . C . . C . . T . . C . . . . . . . . T . . T . C C . . T G . . A G T C . . A . T . . 6 11 8
Turtle . . . . . A C . C C . . . . . A C . . . . . . . . . . . . . T . . C . . . . . . . . . . . . . . C . . T . . . . . A . . . . . . . . . . . . A . C C . . . . C . . C C . A . . A . . . . . . G C T . C T . . T . G G T . G . . T . . . . . A . . 6 8 6
Wheat A . . G C . T G . . . . . T C T C T . . C . . G A . . . T T . T A . . . . G T C A G . T . T T . - T T T . T T . . A G T A T C T G G A A C A C G A A A T A G A . A G . G T G G A T . . A A A . A A . A T G G . A . T . . . . . G . . T C A T A C 10 12 25
Onion T A T A . . T . . . C C . . C T C T . . . . . . . . . . T T G . A T . G A A . . A G . T . . G . - C T T . T T T G A . . . . . . . . . . . A T G A A . T G . A . G A . C A A A . T A . . A A . A A T A A . . . T T T C . . . . . C . T C A G G T 10 12 14
Ginger T . C A G A T G . . A . . T A A C T . G . . . . . . A . A T A T . T . C . . . C T C . T G T C . . C A T . T T T . A T T G T T T A G G . . G . G G A . . A C A C . . . C T T G . T T T . . A G . A C A A G . . . . T . C A . G T T . T . C T A T 14 13 20
Chilli T . C G G A T G . . A . . T A A C T . G . . . . . . A . A T A C . T . C . C . C C C . C G T C . . T A T . T T T . A T T G T T T A G G . . G . G A A . T A C G C . . . C T T G . T T T . . A G . A C A A G . . . . T . C . . G G T . T . C T A T 14 12 21
Forward Reversed ProbeMiddle sequence Middle sequence
Page 131
10
7
Table 4.3: The mismatch comparison of the beef ND5-specific 106 bp site against other 28 non-target species.
Species
CoND5 G G T T T C A T T T T A G C A A T A G C A T G G T T C C T A A C A A A T C T C A A T A C C T G A G A C C T C C A A C A G A T C T T C A T A C T A A A C C C A A G C G A C T C A A A C A T A C C C T T G A T T G G A C FP RP Pb
Cow . . . . . . . . . . . . . . . . . . . . . . . . . . . . . . . . . . . . . . . . . . . . . . . . . . . . . . . . . . . . . . . . . . . . . . . . . . . . . . . . . . . . . . . . . . . . . . . . . . . . . . . . . . 0 0 0
Buffalo . . A . . T . . C C . . . . . . . . . . . . . A . . . . . . G . . . . . . . T . . C . . . . . . . . . . . . . . . . . A . . . . . . . . . . . . . . . . . . G A . A . . . . T . . . G . . . . . C . A . . A . . . . 5 5 4
Goat . . A . . . . . C C . G . . . . . . . . . . . A . . . . . . G T C . . C . . T . . C . . T . . G . . . . . T . . . . . A . . . . . T . . . . . . . . A . . . G A . A . . . . . . . T C . . . . . C . A . . A . . C T 5 7 10
Sheep . . A . . T . . . C . . . . C . . . . . . . . A . . T . . . . T T . . C . . . . . C . . . . . . . . T . . . . . . . . A . . . . . T . . . . . . . . T . . . . A . . . . . . . . . . C . . . . . C . A . . A . . . . 5 4 6
Deer . . . . . T . . C C . . . . . . . . . . . . . A . . . . . C . . . . . . . . T . . C G . . . . . . . . T . . . . . . . . . . T . . T G C . . . G . C A . . . . A . A . . . . C . . . . . . . . . C . A . . G . . C . 4 5 4
Donkey . . . . . . . . C A . . . . C . . . . . C . . A . . . . . . T T C . . C A C . . . C . . A . . . . . . . . A . . . . . A . . . . . . . . . . . T G . . . . T . A . C T . A . C . . . C . C . . A C . C T . A . . T . 5 10 10
Horse . . C . . . . . C A . G . . C . . . . . C . . A . . . . . . T T C . . C A C . . . C . . A . . . . . . . . . . . . . . A . . . . . . . . . . . C G . . . . C . A . C T T A . C . . . C . C . . G C . C C . A . . C . 7 11 9
Pig . . A . . T G . C C . . T . C . . . . . . . . A . . . . . . . . C C . C T C A . . C G . A . . . . . T . . T . . . . . A . . . . . T . . . . . . . . . A A T G A A T G . C . . . . . . . . . . A . . A . . C . . C . 8 5 12
Dog . . C . . . . . . A . . A . C . . . . . . . . A . . T . . . C T . . . C T . A . . C . . A . . . . . . . . T . . . . . A . . . . . . . . T A C G . C A A A C G A T A . T . T T . . T C . G . . A C . A C . . . . C . 5 11 9
Cat . . C . . . . . C A . . . . C . . . . . . . . A . . T . . C . . C . . C T C A . . C G . A . . G . . . T . . . . . . . A . . . . . T . . C A C C C . A . A C G A G A . . C T . . . T . . T . . A . . A C . A . . G . 5 9 11
Rabbit . . C . . T . . . A . . . . C T . . . . C . . A . . T G C T . T T . . C . . . . . C . . A . . . . . A . . . . . . . . A . . . . . T . . T T . . G . . A A T . A . A T T A . C . T . C . C . . A C . . . . A . . . T 7 10 7
Monkey . . . C . T . . C C . G . . C . . . A . . . . A . . T . . C C T . C . . T A . . . C T . A . . . . . . . . . . . . . . A . . A C . A G C C . . . . . . T . C . A . T C A A G C T C . C . T . . A . . . G . A A . C . 8 13 9
Chicken . . C C . . . . C C . . A G C . . . . . . . . A C . A G C C T . T T C C . . A . . C . . . . . . . . A A . T . . . . . A . . - - - . . C C . A C C C A A A C C A A A C A C . C . C . C . C . . . C . C C . . . . C . 8 10 11
Duck . . C C . A . . C C . G A G C . . . . . . . . A C . A G C . T . . . C C T . . . . C . . . . . . . . A A . T . . . . . A G C - - - . G . . . A C C C . . A C C A A A C . C . C . T . C . C . . . C . C C . A . . . . 10 9 10
Pigeon . . . C . A . . C C . . A G T . . . . . C . . A C . T G C T T . C . C . A C A . . C . . . . . . . . A A . . . . . . . A . C - - - A . C C T C T . C . A . C C A A A C A C . T . T T C . C . . T C . A C . A . . C . 9 13 10
Quial . . C . . G . . C C . . A G C C . . . . . . . A C . A G C C T . T . C A T . A . . C . . A . . . . . A A . . . . . . . A . C - - - T . . T . A C C C . . A C C A A A C A C . . . C T C . T . . . C . C C . . . . C . 9 10 11
Rat . . . . . . . . C C . . . . T . . . A . C . . A . . . T G C C T . . . C A . A . . C T . . . . . . . A . . . . . . . . A . . T . . . T . . A C C . . T A . C . A . A . T C T . G - - - . C . . T C . C . C A . . . . 6 10 9
Salmon . . A C . . . . C C . . A G T . . . . . C . . . . . . G C . . . . . . C . . A . . C T . A . . . . . A A . T . . . . . A . . A . C . T C T T C . . . A G G . C T T . . . C T . . C A C . C . . T C . T T . G . . C . 8 12 9
Tuna . . A C . . . . . C . T . . C . . . . . . . . A A . A G C . . . T . . C . . A . . C T . A . . . . . A A . A . . . . . A . . A . . A . C C G C T . . A A A C T T . . . T C T . . C T C . C . . . C . C C . A . . . . 6 11 10
Cord . . . . . A . . C C . . . G T . . G . . . . . A C . A G C T . . T . . C G . T . . C . G . . . G . . T A . T . . . . . A . . A . . T T . . A G C . . G G A T T T G . . . A T . . C T C . C . . T C . A C . C . . T T 7 13 11
Tilapia . . C C . A . . . . . T . . T . . . . . T . . A A . . G C . . . T T C C . . . . . C T . T . . . . . A A . A . . . . . A . . A . C T T . . T C T . . A G A T T T T . . T . T . . C T T A C . . . C . T G . . . . C . 7 11 11
Rohu . . A C . A . . . A . . . . C . . . . . C . . A C . T G C . . T . . . C . . . . . C T . A . . . . . A A . . . . . . . A . . T . C . T . . T C . . . A A A C T T T . . . A T G . C . . . C . . . C . A . . A . . . . 7 8 8
Pangas . . C C . A . . . C . T A . T . . T . . C . . A A . T G C . . . . . . C . . . . . C T . A . . . . . A A . T . C . . . A . . . . . A C . . G C C . . A G A . T T . . . . A T . . C A C . T . . . C . A . . G . . C A 10 11 9
Frog . . C . . . C . A C . . T . C T . T T G C . . A . . T T . T . A . . . . G C . C . A . . A . T . . . . T . . G C C . . T . . T C - T C . C G C T . G A A A C T . G C C A C T G . . . . . . . . . C . T C . . . . G T 12 9 12
Turtle . . A C . A . . . C . C A G C . . . T . . . . A C . A G C . . T . . . C A C A . . C . . . . . . . . A . . A . . . . . A . . A . . T . C C A A T . C T A A C C C A A C . C . . C T A C . C . . A C . T C . . . . C . 10 11 9
Wheat . A A C . . T C . . . . . T G C . . C T G . A A . . T T G . . A . T G A A C A C G C . A A . A C C C A T C A A . T G T A . G T A . . C G . A A C . T A T A . . A G . C A G T T . . T C C T G . A G . A . A G . A G G 13 17 25
Onion . A A C . A T . . . . . . . G C . . C T G . A A . . T T G . . A . T G A A . A C G . . A A . . T C C A T C A A . G G T A . G T A . T C G . A A C . T A T A . . A T . C A G T G . . T C C T G . T G . A . A . . A . A 12 15 21
Ginger . A G C . A T . A . . G . T . C . . C T G . A A . . T T . . C A . T T . A . A C G C . A A . . C C C A T C A A . . G T A . G T A C G C G . A A C . T A T A . . A T . C A G T T . . T C C T G . T G . . . A A C A . G 14 16 22
Chilli . . G G . T T . G . G T T T C C C . C . . . A A . . T T G . . A . T G A A C G T T . . A A . . C C C T T C A A . . G T A . G T A . . C G . A A C . T A T A . . A T . C G G T T . . T C C C G . . G . . G C C C A . G 15 16 22
MismatchForward ReversedProbe Midle sequence
Page 132
10
8
Table 4.4: The mismatch comparison of the buffalo cytb-specific 90 bp site against other 28 non-target species.
Species
Bucytb G G G T T C T A G C C C T A G T T C T C T C T A T C C T A A T C C T C A T T C T C A T G C C C C T G C T A C A T A C A T C C A A A C A A C G A A G T A T G A T G T T C C G G C C A T FP RP Pb
Buffalo . . . . . . . . . . . . . . . . . . . . . . . . . . . . . . . . . . . . . . . . . . . . . . . . . . . . . . . . . . . . . . . . . . . . . . . . . . . . . . . . . . . . . . . . . . 0 0 0
Cow . A . . A . . . . . . . . . . C C T . . . . . . . . . . . . . T . . T G C . . . A . . C . . . . . A . . . . . C . . C . . . . . . . . . . . . . . C . . A . . A . . . . . A . . . C 5 5 7
Goat . A . . C . . . . . . . . . . . C . . . . . A . . . . . . . . . T . A G . A . . T G . A . . . T . C . . C . . C . . . . . T . . . . . . . . . . . C . . A . . A . . . . . C . . . A 4 5 10
Sheep . A . . C . . C . . . . . . A . C . . . . . A . . . . . . G . . . . A G . A A . T . . A . . . . . C . . C . . . . . . . . A . . G . . . . . G . . C . . A . . A . . . . . A . . . A 6 6 9
Deer . A . . C T . . . . . . . . . . C T C A . . . . . . . . . . . . T . G . . . . . . . . . . . T T . T . . T . . C . . G . . . . . . . . . . . C . . C . . . . . A . . . . . A . . . . 7 4 6
Donkey . T . . A T . . . . . . . T A . C . . T . . C . . . T . . . . . . . A G C A . . . . . C . . T A C C . . . . . C . T G . . A . . . . . . . . . . . C . . A . . . . . . . . A . . C C 8 5 9
Horse . C . . A T . . . . . . . . A . C . . . . . C . . . . . G . . . . . A G C A . . . . . C . . . A C C . . C . . C . T . . . A . . . . . . . . . . . C . . A . . A . . . . . . . . T C 6 5 10
Pig . A . . G T . G . . . . . . . . A G C . . . C . . . . . . . . . . . A . . . T . A . . . . . . A . A . . . . . C . . . . . . . . . . . . . . . . . C . . A . . A . . T . . A . . . C 8 6 5
Dog . T . . A . . C . . . . . . . . A T . . . . C . . . . . . . . . T . G G C A T . . . . T . . A . . C . . C . . C . . . . . T . . G . . . . . C . . C . . A . . A . . . . . . . . C C 6 6 10
Cat . A . . C . . . . . . . . . . . A . . . . . C . . . . . . G . A . . A G C A A . . . . T . . A A . C . . C . . C . . C . . . . . . . . . . . . G . A . . A . . . . . T . . A . . . C 4 6 12
Rabbit . A . . C . . . . . T . . . . . C . . A . . C . . . . . T G . T . . A G C C T . . . . C . . A T . C . . T . . . . T G . . T . . . . . . . . T . . C . . . . . A . . . . . A . . C A 6 6 13
Monkey . C . . A . . . . . A T . . T . C . . A . . A . . . T . C . . . T . A G C A G C . . . C . . . A . A . . T . . C . A . . . . . . . . . . . A . . . . . . A . . A . . . . . C . . . C 8 4 12
Chicken . T . . A . . . . . . . . . . C A G C . . . A G . . . . C . . . . . . T . C . . A . . C . . . T . C . . C . . C . A . . . T . . . . . . . . . . C A . . A . C C . . . . . A . . . C 7 7 8
Duck . C . . C . . . . . A . . . . C C G C . . . C G . . . . . . . . . . A T . C . . G G . C . . . T . C . . C . . C . A . . . A . . . . . . . . . . C A . . A . C A . . . . . . . . G C 8 7 9
Pigeon . A . . A . . . . . . T . . . C C G C . . . A G . A . . . . . T . . A T . C . . . . C C . . . . . A . . C . . C . A G . . . . . . . . . . . C . C A . . A . . C . . . . . C . . . C 8 7 8
Quial . C . . A . . T . . . . . T . C A G C . . . A G . A . . T . . . . . . C . . . . A . . C . . . T . C . . C . C C . A . . . T . . . . . . . . . . C C . . A . C A . . . . . C . . . C 9 7 8
Rat . A . . C G . . . . . . . . A . C T . A . . A . . . . . . . . . T . A G C C T . . C . A . . A T . C . . G . . . . . T . . A . . . . . . . . C . . C T . A . C A . . . . . C . . . A 8 8 12
Salmon . . . . A . . C . . . . . T T . A T . . . . G . . . . . T G . . . . T . . A G . T G . T . . T A . C T . . . . C . . T . . . . . . . . . . . . G . A C . A . C C . . T . . A . . . C 7 9 12
Tuna . A . . A . . . . . . . . C C . A G C . . . C . . . . . C G . A . . T . . A G . A G . C . . . T . C . . . . . C . . T . . A . . . . . G . . . . C . C . A . C A . . . . . A . . . G 8 7 11
Cord . C . . A . . T . . A . . C C . A T . . . . G . . T . . . G . . . . . . . G G . T G . . . . . T . T . . C . . . . . G . . A . . . . . . . . . G . . T . A . C A . . . . . C . . T C 9 8 8
Tilapia . A . . C . . C . . . . . C T . A T . . . . A . . . . . T G . . . . G . . A G . T G . A . . . A . T . . C . . . . . C . . T . . . . . . . . . G . C C . A . C C . . . . . C . . T A 8 9 11
Rohu . A . . C . . T . . A T . . C . A T . . . . A . . T . . . G . A T . A . . A G . A G . . . . . . . C . . . . . C . . C . . A . . . . . . . . . G . A C . A . C A . . . . . C . . . A 9 8 9
Pangas . A . . A . . . . . . . . G C . A T . . . . . . . . . . . G . A T . A . . A G . T G . C . . . . . A T . . . . C . . C . . . . . . . . G . A . G . A C . C . C C . . . . . C . . C C 6 9 11
Frog . A . . C . . . . . . . . T C . C . . A . . A . . T . . G G . T . . . T . C . . G . . A . . . . . C A C T . . . . . C . . T . . . . T T . . C T C C C . T . . A . . T . . C . . C A 7 11 11
Turtle . T . . . . . C . . . . . C T . A T . . . . C . . T . . . G C A T . A C . C . . A . . A . . A A C C . . C . . C . . . . . A . . . . . . . . C T C A . C T . . A . . T . . A . . C . 7 10 14
Wheat T C A A A A . T . T G A C . . G . G . A C . . G A . G C C . . T . C G G . A A . A G G A T . G . C T T . . G T G G A G . T A T T . . G C G . . . . . G C T . G T G . G G . C . A . . 15 10 18
Onion A . . . . . G . T . T A . G . . C A . T G G . G G . . . . . . . . . A . C . . C T . A . G A T . . A . . . A . . T . . . . A . G T . . . A . . . T C . A A . C . G . . . . . T T . . 11 8 10
Ginger T C A A A A . T . T G A C G . G C G . A C . C G A A G C T . . T . C T G G A A . A G G A T . G . C T T . G G T A G A G . T A T T . . G T G . . . . . G C T . G T G . G G . C . A . . 18 10 20
Chilli T . A A A A . . . T A A C . . G . G . . C . . G A . G C T . . T . C T G . A A . A G G A T . A . C T T . G G T C G A . . T A T T G . G C G . . . . C G C T . G T G . G G . A . A . . 12 11 19
MismatchForward Primer Reversed PrimerProbe Middle sequence
Page 133
10
9
Table 4.5: The mismatch comparison of the buffalo ND5-specific 138 bp site against other 28 non-target species.
Page 134
11
0
Table 4.6: The mismatch comparison of the pork cytb-specific 146 bp site against other 28 non-target species.
Species
Pocytb t a t c c c t t a t a t c g g a a c a g a c c t c g t a g a a t g a a t c t g a g g g g g c t t t t c c g t c g a c a a a g c a a c c c t c a c a c g a t t c t t c g c c t t c c a c t t t a t c c t g c c a t t c a t c a t t a c c g c c c t c g c a g c c g t a c a t c t c c t a t t c c t g c FP RP Pb
Pig . . . . . . . . . . . . . . . . . . . . . . . . . . . . . . . . . . . . . . . . . . . . . . . . . . . . . . . . . . . . . . . . . . . . . . . . . . . . . . . . . . . . . . . . . . . . . . . . . . . . . . . . . . . . . . . . . . . . . . . . . . . . . . . . . . . . . . . . . . . . . . . . . . 0 0 0
Buffalo a . . . . . a . . c . . t . . t . . . a g t . . g . . t . . g . . . . . t . . . . . . . . a . . c . . a . . a . . . . . . . . . . . . . . . . . c . . . . . . . . . . . a . . t . . . . . c . . . . . c . . . . . . . . t . . c g . a . . a . . t . . . a t a . . c . . c . . a t . . . . t . . c . 9 8 6
Cow a . . . . . a . . c . . . . . c . . . a . t t . a . . c . . . . . . . . . . . . . . c . . a . . c . . a . . a . . . . . . . . . . . . . . t . . c . . . . . . . . . . . t . . . . . t . . . . . . . . t . . . . . t . . . . . c . t a . . a a . t . . c a t a . . c . . c . . a . . . . . . . . c . 8 6 7
Goat a . . . . . a . . . . . t . . c . . . a . . . . a . . c . . . . . . . . . . . . . . . . . a . . c . . a . . a . . . . . . . . c . . t . . . . . c . . . . . . . . . . . . . . . . . . . . . . . . . . c . . . . . . . . . . . c . . a . . . . . . . . c a t a . . c . . c . . g . . t . . . . . c . 6 7 3
Sheep a . . t . . a . . . . . t . . c . . . a . . . . a . . c . . . . . . . . . . . . . . a . . a . . c . . a . . a . . . . . . . . t . . . . . . . . c . . . . . t . . . . . . . . t . . . . . . . . t t . c . . . . . . . . . . . c g . a . . . . . . . . c a t a . . t . . c . . a . . c . . . . . c . 7 7 6
Deer a . . t . . a . . c . . t . . c . . . a . . . . a . . c . . . . . . . . . . . . . . . . . . . . . . . a . . a . . t . . . . . . . . . . . a . . c . . . . . t . . . . . t . . . . . . . . . . . t t . t . . . . . . . . . . . c g . a . . a . . . . . t a t a . . . . . . t . a . . c . . . . . t . 8 6 7
Donkey a . . . . . c . . c . . . . . t . . t a c g . . . . . c . . . . . . . . . . . . . . t . . a . . c . . a . . a . . . . . . . . c . . . . . t . . c . . . . . t . . t . . . . . . . . . . . . . . t . . a . . c . . t . . . . . c . . a . . . . . g . t . a t . . . c . . . . . a . . . . . . . . c . 8 4 6
Horse a . . t . . c . . c . . . . . t . . t a c . . . . . . c . . g . . . . . . . . . . . t . . a . . c . . a . . a . . . . . . . . c . . . . . t . . c . . . . . t . . t . . t . . . . . . . . c . . . . . a . . c . . . . . . . . c . . a . . . . . g . t . . t . . . . . . . t . a . . . . . t . . t . 8 5 4
Dog c . . . . . . . . . . . . . . . . . t . . . t . a . . . . . . . . g . . . . . . . . c . . . . . c . . a . . g . . . . . . . . . . . . . . a . . . . . . . . . . . t . . a . . . . . t . . c . . . . . c . . t . . . . . . . . c g . a . . t . . a . . . a t a . . . . . c . . . . . . . . t . . a . 4 5 4
Cat a . . t . . a . . c . . . . . g . . t . . a . . a . . . . . . . . . . . . . . . . . . . . g . . c . . a . . a . . . . . . . . c . . . . . a . . . . . . . . . . . t . g . . . . . . . . . c . . t . . t . . . . . . . . t . . c t . a . . . t . a . . . . g a . . . . . c . . . t . . . . . . . t . 8 5 7
Rabbit a . . . . . a . . . . . . . . . . . . a c . t . a . . t . . . . . . . . . . . . . . a . . a . . . . . a . . t . . t . . . . . c . . t . . t . . c . . . . . . . . . . . t . . t . . . . . c . . . t . . . . . . . t . . . . . . g . a a . t t . a . t c t t a a . t . . c . . . . . c . . t . . a . 6 8 7
Monkey a . . . . . g . . c . . . . . . . . t a . . . . t . . c c . . . . . . . . . . . . . a . . a . a c g . . a . t . . . . g c c . c . . . . . . . . . . . . . . . . . . a . . c . g . . . . . . . . . . . a . . c . . . . . . . . c . t . . . . . . . . . . . t . . . . . . c t . a . . . . . . . . a . 6 5 4
Chicken a . . t . . c . . c . . t . . . c a c a c . . . a . . . . . g . . . g c . . . . . . . . . a . . . . . a . . . . . . . . c c . . . . . . . t . . c . . . . . . . . . . . t . . a . . . . . c c . . . . c . . c . . t g c a . . c g . a . g t a . t a . t a t . a . c . . c . . . a c c . . . . . a . 11 8 12
Duck c c . . . . a . . c . . . . . . c a g a c . . . g . . . . . . . . . g c . . . . . . a . . a . . c . . a . . g . . t . . c c . . . . . . . a . . c . . . . . . . . . . . . a . t . . . . . c c . a . . a . . c . . t t . a . . c g . a . g a a . . a . c c t a . . c . . c t . a a c c . . . . . a . 10 10 12
Pigeon . g . . . . c . . c . . t . . c c a . a c . . . . . . t . . . . . . g c . . . . . . c . . a . . . . . . . . a . . t . . c c . t . . a t . a . . . . . . . . . . . . a . . c . t . . . . . c c . . . . c . . c . . t . . a . . c g . a . g . . . . a . t a t . a . c . . c . . . a c c . . . . . . . 9 7 8
Quial . g . a . . c . . c . . . . . c c a . a c . . . a . . . . . . . . . g c . . . . . . a . . . . . . . . a . . t . . . . . t c . t . . . . . a . . c . . . . . . . . . . . . c . . . . . . . c c . . . . c . . . . . . t . a . . c g . a . g a a . . a . t a t . a . c . . c . . . a c . . . . . . a . 10 7 9
Rat . . . . . . . . . c . . t . . g . . t a c . . . a . . c . . . . . . . . . . . . . . a . . . . . c . . a . . a . . . . . . . . . . . . . . a . . . . . c . . . . . . . . a . . . . . . . . c . . . . . c . . . . . . . . t . . c g . . . . . . . t . . . a t t . . . . . . . . t . . t . . . . . c . 7 5 4
Salmon . g . . . . g . . c g . a . . . g g c . c . . . a . . . c . . . . . . . . . . . . . c . . g . . c . . t . . t . . . . . c . . t . . t . . a . . . . . . . . t . . . . . . . . t . . . . . c c . a t . c . . c . . . g . . . . . g . a . . t g c t a . . . t . c . c . . c . . t . . g . . . . . t . 10 7 10
Tuna a g . . . . a . . . g . t . . . . . t a c . . . . . . t . . . . . . . . . . . . . . . . . . . . . . . a . . a . . . . . t . . t . . . . . t . . c . . . . . . . . . . . a . . . . . . . . c c . a t . c . . . . . . g . . . . c g . a . . . a . g a . . a t t c . t . . c . . t . . t . . . . . t . 8 8 8
Cord . g . t . . . . . . g . a . . t g a t . c . t . a . . t c . . . . g . . . . . . . . a . . t . . c . . a . . a . . t . . t . . t . . . . . a . . t . . g . . t . . t . . a . . . . . t . . c t . a t . c . . c . . t g . t g . . g . t . . t t . t a . . a t a c . c . . c . . a . . t . . t . . c . 11 9 12
Tilapia a . . . . . . . . c . . t . . c . a t t c . t . a . . c c . . . . . . . . . . . . . . . . a . . c . . . . . a . . . . . t . . c . . . . . a . . t . . c . . t . . . . . . . . . . . t . . c c . . t . c . . c . . . . . . . . . g . a . . t g c a a . . a t a . . c . . c t . a a . t . . t . . t . 10 10 8
Rohu c g . a . . a . . c . . a . . . g a c a t a t . a . . c c . . . . . . . t . . . . . t . . . . . c . . a . . a . . . . . t . . c . . a . . a . . . . . t . . . . . . . . a . . . . . . . . c c . a . . a . . . . . t . . . . . . g . . . . . g c a a . c c t t a . t . . c . . . . . . . . . . . c . 14 6 6
Pangas c g . . . . c . . . . . a . . . g a c a c . . . a . . . c . . . . . . . t . . . . . . . . . . . c . . t . . a . . t . . c . . . . . a . . a . . . . . . . . . . . . . . a . . . . . . . . c c . a . . c . . . . . . g . a g . . . t . . . a g c t a . . c t a c . . . . . g c . . . g . . t . . a . 10 8 9
Frog c g c . . . c . . c . . . . . c t . t a . . . . t . . c c . . . . g . . . . . . . . a . . . . . c . . a . . a . . . . . c . . t . . . . . . . . c . . . . . t . . t a . a . . t . . . . . c . . t . . c . . . . . t . . t . . . . . . . . t g . t a g t c t a a . t . . c . . . . . . . . t t . a . 10 8 6
Turtle c . c . . . . . . c . . . . . c . a c a c . t . a . . . c . . . . . . . . . . . . . t . . . . . c . . a . . a . . . . . c . . t . . . . . a . . c . . . . . . . . . a . . c . . . . . . . c c . a . . a . . . . . t g c t . c . . t t . g g t . g . . t a t a . . . . . c t . a . . c . . . . . a . 10 7 12
Wheat a . c g t . . . g a g a t t c . g g c a . t t g . a g . t g . . a t . a . . a g t a a a t a . g . . . . t c . c c a t g t . . . . . a t . . . t t t t . . . g . . t a g g g g g a . t . a c . c t t a c t t g . . t t c t . g . . . a a g t . g . t a c c g g t . t t g c t a t g a c . . t t . a . 18 16 17
Onion . . . a . t . c g g t . t t t t . t t . g . t g . t . c a . c . a t . a . . c - c a . c t . . a . . g a t . g . . t t g . a . . . g a t . . . . g a c - . . a . . t . a a a . g a . t . g a . . g a a c a a . . . - - - - . a . . a a a a t a a a t a t t t . t c c t t c a g g t a t . c t a c . g 15 18 14
Ginger a . c g t . . c g a g a t t c . g g c . . t t g . a g . t g . . a t . a . . a g t a a a t a . g . . . . t c . t c a t g t . . . . . a t . . . t t t t . . . g . . t a g g g g g g . t c a c . c t t a c t t g . . t t . t . g . . . a a g t a g . t a c a g g t . t t g c t a t g a c . . t t . a . 18 16 17
Chilli a . c g t . . c g a g a t t c . . g c a . t t g . . g . t g . . a t . a . . a g t a a a t a c g . . . . c c . c c a c g t . . . . t a t . . . t t t t . . . g . . t a g g g g g a . t . a c g c t t a c t t g . . t t . t . g . . . a a g t a g . t a c t g g . . t t g c t a t g a c . . t t . a . 18 15 17
MismatchProbe ReversedForward Middle sequence
Page 135
11
1
Table 4.7: The mismatch comparison of the pork ND5-specific 73 bp site against other 28 non-target species.
Page 136
11
2
Table 4.8: Pairwise distances of the beef cytb-specific 120 bp site against other 28 non-target species.
Species Cow Buffalo Goat Sheep Deer Donk Horse Pig Dog Cat Rabb Monk Chik Duck Pegi Quial Rat Salm Tuna Cord Telap Rohu Pang Frog Turtl Whet Onion Gingr Chilli
Cow 0.000
Buffalo 0.220
Goat 0.144 0.145
Sheep 0.193 0.157 0.085
Deer 0.169 0.182 0.145 0.121
Donkey 0.197 0.237 0.158 0.196 0.240
Horse 0.239 0.212 0.197 0.250 0.254 0.075
Pig 0.299 0.269 0.214 0.269 0.227 0.240 0.225
Dog 0.213 0.212 0.240 0.252 0.209 0.239 0.213 0.253
Cat 0.298 0.255 0.224 0.252 0.225 0.214 0.200 0.255 0.211
Rabbit 0.250 0.294 0.260 0.232 0.279 0.337 0.326 0.324 0.298 0.357
Monkey 0.426 0.444 0.338 0.369 0.462 0.284 0.269 0.284 0.420 0.422 0.503
Chicken 0.382 0.322 0.382 0.414 0.371 0.400 0.386 0.437 0.382 0.495 0.382 0.573
Duck 0.352 0.325 0.390 0.355 0.402 0.360 0.413 0.467 0.354 0.414 0.402 0.475 0.242
Pigeon 0.429 0.338 0.330 0.329 0.381 0.359 0.411 0.441 0.453 0.515 0.432 0.457 0.242 0.289
Quial 0.346 0.337 0.317 0.315 0.285 0.404 0.426 0.372 0.339 0.389 0.379 0.511 0.211 0.213 0.200
Rat 0.254 0.148 0.174 0.173 0.159 0.226 0.200 0.225 0.146 0.186 0.342 0.351 0.388 0.396 0.387 0.307
Salmon 0.510 0.427 0.404 0.370 0.442 0.430 0.432 0.417 0.362 0.415 0.386 0.491 0.363 0.372 0.399 0.367 0.419
Tuna 0.344 0.241 0.268 0.228 0.230 0.281 0.284 0.301 0.270 0.317 0.315 0.509 0.316 0.406 0.367 0.289 0.200 0.312
Cord 0.419 0.365 0.444 0.392 0.428 0.380 0.434 0.574 0.300 0.402 0.402 0.657 0.456 0.442 0.485 0.416 0.327 0.295 0.295
Tilapia 0.282 0.282 0.225 0.251 0.268 0.294 0.312 0.383 0.241 0.327 0.345 0.431 0.377 0.400 0.355 0.347 0.270 0.252 0.282 0.238
Rohu 0.386 0.441 0.353 0.367 0.385 0.367 0.386 0.424 0.367 0.425 0.334 0.538 0.456 0.388 0.447 0.400 0.286 0.297 0.298 0.308 0.271
Pangas 0.443 0.391 0.413 0.487 0.386 0.529 0.491 0.371 0.367 0.407 0.546 0.552 0.426 0.389 0.522 0.407 0.321 0.230 0.333 0.309 0.333 0.214
Frog 0.357 0.314 0.323 0.267 0.345 0.313 0.345 0.380 0.333 0.336 0.342 0.398 0.474 0.428 0.414 0.398 0.269 0.422 0.355 0.328 0.373 0.297 0.352
Turtle 0.362 0.471 0.408 0.426 0.389 0.411 0.445 0.450 0.393 0.380 0.489 0.494 0.421 0.367 0.415 0.331 0.378 0.430 0.429 0.341 0.374 0.327 0.317 0.331
Wheat 1.858 1.863 1.888 1.682 1.975 1.915 2.066 2.424 1.801 1.955 1.631 2.020 2.323 2.171 2.001 2.172 1.708 1.899 1.842 1.830 1.815 1.815 2.221 1.817 2.229
Onion 1.919 1.974 1.662 1.787 1.747 2.012 2.079 2.198 1.915 1.827 1.870 1.981 2.380 2.171 2.080 2.320 1.687 2.176 1.640 2.083 2.198 2.108 2.012 1.842 2.117 0.806
Ginger 1.786 2.056 1.810 1.504 1.547 1.906 2.017 2.017 1.519 1.634 1.810 2.010 1.784 1.659 1.862 1.639 1.605 1.457 1.645 1.433 1.391 1.605 1.571 1.860 1.969 1.088 1.126
Chilli 1.969 2.129 1.985 1.529 1.786 2.019 2.121 2.200 1.629 1.669 1.933 2.137 2.131 1.862 2.038 1.964 1.560 1.519 1.772 1.464 1.488 1.772 1.690 1.874 2.069 0.999 1.231 0.109 0.000
Page 137
11
3
Table 4.9: Pairwise distances of the beef ND5-specific 106 bp site against other 28 non-target species.
Species Cow Buffa Goat Sheep Deer Donk Horse Pig Dog Cat Rabb Monk Chik Duck Pegi Quial Rat Salm Tuna Cord Telap Rohu Pang Frog Turtl Whet Onion Gingr Chilli
Cow 0.000
Buffalo 0.185
Goat 0.311 0.145
Sheep 0.208 0.157 0.195
Deer 0.267 0.187 0.269 0.269
Donkey 0.392 0.338 0.358 0.333 0.461
Horse 0.424 0.353 0.338 0.348 0.478 0.097
Pig 0.471 0.351 0.351 0.329 0.461 0.408 0.461
Dog 0.514 0.397 0.402 0.421 0.479 0.448 0.402 0.426
Cat 0.559 0.455 0.397 0.432 0.455 0.435 0.405 0.351 0.297
Rabbit 0.492 0.435 0.482 0.306 0.555 0.327 0.329 0.492 0.435 0.499
Monkey 0.568 0.503 0.587 0.503 0.485 0.472 0.435 0.529 0.607 0.597 0.550
Chicken 0.776 0.623 0.643 0.644 0.572 0.654 0.572 0.602 0.452 0.540 0.598 0.752
Duck 0.680 0.500 0.612 0.563 0.607 0.563 0.482 0.654 0.563 0.622 0.627 0.752 0.202
Pigeon 0.817 0.564 0.718 0.664 0.607 0.588 0.569 0.654 0.565 0.607 0.608 0.665 0.293 0.363
Quail 0.752 0.612 0.676 0.602 0.633 0.654 0.553 0.572 0.500 0.486 0.540 0.816 0.171 0.216 0.327
Rat 0.506 0.416 0.496 0.413 0.489 0.455 0.421 0.622 0.461 0.496 0.510 0.563 0.638 0.653 0.551 0.693
Salmon 0.546 0.536 0.536 0.542 0.559 0.659 0.702 0.559 0.496 0.607 0.648 0.833 0.486 0.592 0.503 0.602 0.485
Tuna 0.587 0.544 0.540 0.422 0.649 0.607 0.592 0.578 0.465 0.458 0.504 0.712 0.397 0.530 0.526 0.526 0.486 0.348
Cord 0.696 0.622 0.549 0.522 0.638 0.709 0.778 0.622 0.680 0.536 0.649 1.093 0.602 0.587 0.627 0.607 0.622 0.507 0.526
Tilapia 0.578 0.654 0.578 0.514 0.648 0.685 0.691 0.663 0.577 0.681 0.572 0.914 0.555 0.617 0.664 0.654 0.617 0.366 0.286 0.472
Rohu 0.492 0.432 0.510 0.333 0.574 0.518 0.518 0.569 0.411 0.503 0.348 0.670 0.607 0.507 0.568 0.705 0.441 0.315 0.276 0.478 0.302
Pangas 0.612 0.597 0.553 0.489 0.587 0.745 0.693 0.671 0.557 0.654 0.581 0.851 0.672 0.586 0.665 0.742 0.617 0.319 0.308 0.447 0.286 0.258
Frog 0.955 1.054 1.116 0.977 0.955 0.944 0.887 0.973 0.735 0.695 0.824 1.102 0.974 1.230 0.925 0.955 0.973 1.047 0.851 1.015 1.041 0.807 0.815
Turtle 0.768 0.693 0.676 0.562 0.735 0.659 0.693 0.544 0.458 0.617 0.644 0.781 0.338 0.402 0.373 0.419 0.607 0.522 0.405 0.622 0.602 0.562 0.676 0.907
Wheat 1.993 1.961 2.012 1.801 1.989 1.974 2.064 1.971 1.638 1.637 1.961 2.328 1.998 2.328 2.140 2.117 1.775 1.878 2.011 2.271 2.059 1.723 1.850 1.776 1.874
Onion 1.662 1.754 1.889 1.403 1.799 2.004 2.135 1.897 1.575 1.895 1.850 2.320 1.906 2.052 2.011 1.874 1.480 1.902 1.828 1.908 1.517 1.222 1.549 1.749 1.664 0.172
Ginger 1.849 1.626 1.801 1.732 1.894 2.002 1.931 2.210 1.678 1.965 1.955 1.751 1.927 1.802 1.877 2.018 1.511 2.011 1.989 2.254 1.828 1.576 1.898 1.992 1.927 0.248 0.216
Chilli 1.876 1.974 2.152 1.691 1.966 1.984 2.023 1.952 1.732 1.998 2.090 2.044 2.145 2.092 2.575 2.145 2.037 2.274 2.018 2.251 1.975 1.890 2.045 1.935 1.959 0.391 0.402 0.355 0.000
Page 138
11
4
Table 4.10: Pairwise distances of the buffalo cytb-specific 90 bp site against other 28 non-target species.
Species Buffa cow Goat Sheep Deer Donk Horse Pork Dog Cat Rabb Monk Chik Duck Pegi Quial Rat Salm Tuna Cord Telap Rohu Pang Frog Torts Whet Onion Gingr Chilli
Buffalo 0.000
Cow 0.244
Goat 0.277 0.255
Sheep 0.305 0.302 0.145
Deer 0.247 0.268 0.260 0.358
Donkey 0.385 0.302 0.334 0.350 0.368
Horse 0.331 0.268 0.236 0.264 0.379 0.132
Pig 0.260 0.218 0.283 0.315 0.250 0.347 0.296
Dog 0.353 0.287 0.253 0.267 0.330 0.310 0.248 0.316
Cat 0.332 0.270 0.267 0.266 0.384 0.303 0.280 0.267 0.264
Rabbit 0.401 0.339 0.298 0.300 0.312 0.318 0.314 0.429 0.327 0.303
Monkey 0.411 0.345 0.304 0.409 0.429 0.338 0.272 0.413 0.396 0.391 0.413
Chicken 0.377 0.307 0.308 0.415 0.437 0.439 0.359 0.321 0.377 0.399 0.477 0.440
Duck 0.408 0.352 0.273 0.383 0.420 0.424 0.283 0.350 0.413 0.406 0.428 0.434 0.161
Pegion 0.409 0.274 0.356 0.433 0.393 0.486 0.415 0.374 0.455 0.420 0.479 0.396 0.208 0.253
Quial 0.440 0.346 0.327 0.457 0.484 0.501 0.384 0.344 0.420 0.532 0.551 0.484 0.136 0.239 0.289
Rat 0.441 0.379 0.223 0.271 0.297 0.401 0.366 0.433 0.325 0.397 0.285 0.429 0.520 0.444 0.510 0.571
Salmon 0.452 0.409 0.433 0.422 0.522 0.451 0.494 0.374 0.429 0.301 0.620 0.532 0.430 0.554 0.615 0.498 0.545
Tuna 0.448 0.354 0.379 0.407 0.483 0.471 0.433 0.337 0.496 0.389 0.500 0.524 0.305 0.356 0.511 0.378 0.480 0.302
Cord 0.410 0.479 0.384 0.393 0.499 0.548 0.440 0.455 0.460 0.476 0.575 0.500 0.475 0.419 0.600 0.410 0.457 0.341 0.341
Tilapia 0.452 0.462 0.267 0.279 0.474 0.561 0.452 0.435 0.412 0.374 0.473 0.532 0.464 0.539 0.600 0.462 0.397 0.236 0.359 0.236
Rohu 0.451 0.397 0.284 0.328 0.476 0.592 0.522 0.399 0.454 0.336 0.553 0.455 0.509 0.435 0.511 0.511 0.371 0.340 0.286 0.254 0.270
Pangas 0.442 0.348 0.391 0.485 0.513 0.532 0.525 0.442 0.459 0.366 0.613 0.470 0.517 0.548 0.489 0.629 0.539 0.269 0.306 0.359 0.304 0.238
Frog 0.547 0.531 0.419 0.428 0.548 0.668 0.624 0.658 0.641 0.573 0.408 0.736 0.612 0.633 0.559 0.609 0.484 0.668 0.581 0.599 0.467 0.507 0.586
Turtle 0.551 0.568 0.470 0.448 0.521 0.500 0.479 0.464 0.374 0.383 0.558 0.736 0.510 0.514 0.609 0.583 0.570 0.520 0.514 0.550 0.535 0.466 0.581 0.508
Wheat 1.609 1.886 1.188 1.185 1.290 1.265 1.419 1.319 1.459 1.274 1.301 1.410 1.252 1.287 1.535 1.264 1.643 1.193 1.203 1.379 1.393 1.187 1.551 1.480 1.246
Onion 1.280 1.459 0.935 0.927 1.173 1.319 1.280 1.149 1.117 1.002 1.178 1.221 1.013 1.042 1.227 1.115 1.335 1.055 1.030 1.115 1.131 0.964 1.270 1.346 1.008 0.095
Ginger 1.333 1.525 0.970 0.963 1.173 1.265 1.131 1.104 1.163 1.040 1.178 1.272 1.013 1.042 1.227 1.115 1.396 1.099 1.071 1.162 1.178 1.002 1.322 1.480 1.051 0.094 0.046
Chilli 1.380 1.583 1.003 0.996 1.315 1.555 1.384 1.205 1.172 1.046 1.327 1.376 1.060 1.120 1.322 1.171 1.519 1.107 1.078 1.171 1.187 1.008 1.333 1.543 0.973 0.160 0.057 0.081 0.000
Page 139
11
5
Table 4.11: Pairwise distances of the buffalo ND5-specific 138 bp site against other 28 non-target species.
Species Buffa Cow Goat Sheep Deer Donk Horse Pig Dog Cat Rabb Monk Chik Duck Pegi Quial Rat Salm Tuna Cord Telap Rohu Pang Frog Torts Whet Onion Gingr Chilli
Buffalo 0.000
Cow 0.175
Goat 0.239 0.166
Sheep 0.216 0.186 0.079
Deer 0.196 0.219 0.254 0.208
Donkey 0.421 0.378 0.443 0.415 0.453
Horse 0.435 0.406 0.446 0.418 0.426 0.079
Pigeon 0.308 0.283 0.347 0.310 0.285 0.390 0.362
Dog 0.414 0.421 0.484 0.452 0.386 0.447 0.436 0.461
Cat 0.440 0.485 0.484 0.411 0.435 0.385 0.417 0.302 0.347
Rabbit 0.608 0.596 0.646 0.604 0.616 0.655 0.651 0.576 0.757 0.671
Monkey 0.502 0.506 0.464 0.418 0.537 0.550 0.573 0.557 0.565 0.645 0.534
Chicken 1.116 1.113 1.007 0.914 0.951 0.879 0.836 1.078 1.192 0.940 0.951 0.879
Duck 1.066 1.264 1.319 1.221 1.329 1.022 0.884 1.376 1.298 1.048 0.976 1.008 0.447
Pigeon 1.000 1.039 1.133 1.040 0.978 0.872 0.796 0.977 0.951 0.964 0.926 0.818 0.296 0.466
Quail 1.178 1.176 1.180 1.066 1.106 0.811 0.771 1.052 1.138 0.972 0.849 0.817 0.219 0.471 0.374
Rat 0.535 0.537 0.531 0.521 0.497 0.675 0.620 0.495 0.496 0.592 0.655 0.601 0.903 1.178 0.875 0.882
Salmon 0.900 1.049 0.812 0.740 0.900 0.923 0.909 1.037 1.238 0.973 1.088 0.869 0.871 1.010 0.832 0.880 1.092
Tuna 0.992 1.000 0.796 0.793 0.989 0.850 0.774 0.995 0.982 0.867 0.964 0.690 0.796 0.771 0.756 0.812 0.827 0.465
Cord 0.894 0.956 0.751 0.751 0.950 1.016 0.917 0.913 1.025 0.977 0.946 0.638 0.748 1.105 0.844 0.903 0.778 0.506 0.435
Tilapia 0.738 0.803 0.802 0.751 0.836 0.940 0.850 0.766 0.976 0.846 1.023 0.776 0.605 0.774 0.654 0.639 0.775 0.510 0.325 0.489
Rohu 1.130 0.922 0.778 0.781 0.889 0.881 0.860 0.903 1.133 0.852 0.925 0.770 0.859 1.143 0.819 0.812 0.963 0.564 0.632 0.681 0.758
Pangas 1.091 1.035 0.999 0.874 0.905 1.003 1.011 0.918 0.922 0.906 1.166 0.944 0.772 1.125 0.721 0.822 0.979 0.766 0.683 0.808 0.632 0.621
Frog 1.466 1.356 1.260 1.246 1.334 1.211 1.166 1.514 1.518 1.426 1.705 1.294 1.297 1.538 1.526 1.329 1.220 1.368 1.263 1.154 1.708 1.796 1.263
Turtle 0.913 0.870 0.813 0.747 0.917 0.759 0.752 0.846 0.871 0.739 0.723 0.889 0.600 0.680 0.698 0.614 0.824 0.787 0.655 0.840 0.750 0.732 0.824 1.678
Wheat 1.663 1.563 1.590 1.747 1.950 1.924 2.224 1.981 2.128 2.089 3.245 2.306 2.166 3.358 2.881 2.777 1.640 2.320 3.264 3.156 2.146 3.091 2.954 2.089 2.899
Onion 1.686 1.602 1.705 1.739 1.866 1.949 2.102 2.195 2.078 2.048 2.948 2.165 2.180 3.255 2.152 2.056 1.610 2.890 2.961 3.229 2.337 2.104 3.194 1.970 2.915 0.139
Ginger 1.441 1.399 1.423 1.377 1.622 1.583 1.663 1.854 1.798 2.136 2.087 2.002 2.163 2.757 2.415 2.179 1.241 2.322 2.296 2.322 2.133 2.123 2.981 1.949 2.107 0.159 0.159
Chilli 1.472 1.590 1.634 1.694 1.671 1.844 1.513 2.206 2.147 2.249 2.050 1.943 2.240 2.251 2.157 2.029 1.350 2.011 2.320 2.994 2.015 2.036 2.981 2.036 2.185 0.216 0.250 0.252 0.000
Page 140
11
6
Table 4.12: Pairwise distances of the pork cytb-specific 146 bp site against other 28 non-target species.
Species Pig Buffa Cow Goat Sheep Deer Donk Horse Dog Cat Rabb Monk Chik Duck Pige Quial Rat Salm Tuna Cord Telap Rohu Pang Frog Turtl Whet Onion Gingr Chilli
Pig 0.000
Buffalo 0.291
Cow 0.283 0.163
Goat 0.206 0.155 0.138
Sheep 0.262 0.172 0.181 0.088
Deer 0.252 0.217 0.190 0.172 0.122
Donkey 0.262 0.231 0.194 0.193 0.212 0.253
Horse 0.261 0.240 0.250 0.239 0.249 0.223 0.081
Dog 0.220 0.240 0.233 0.243 0.272 0.279 0.290 0.259
Cat 0.254 0.240 0.262 0.231 0.249 0.241 0.251 0.232 0.220
Rabbit 0.320 0.288 0.249 0.236 0.227 0.279 0.320 0.299 0.272 0.341
Monkey 0.249 0.359 0.330 0.284 0.315 0.373 0.283 0.262 0.348 0.348 0.426
Chicken 0.443 0.340 0.349 0.359 0.370 0.363 0.384 0.383 0.408 0.450 0.345 0.477
Duck 0.507 0.353 0.361 0.384 0.362 0.372 0.406 0.430 0.428 0.472 0.382 0.420 0.223
Pegion 0.406 0.401 0.445 0.360 0.371 0.410 0.405 0.452 0.465 0.503 0.431 0.434 0.203 0.244
Quial 0.384 0.362 0.360 0.339 0.350 0.349 0.413 0.424 0.388 0.417 0.395 0.455 0.176 0.213 0.167
Rat 0.210 0.186 0.255 0.196 0.224 0.221 0.244 0.242 0.191 0.232 0.346 0.328 0.372 0.430 0.385 0.342
Salmon 0.393 0.418 0.450 0.394 0.371 0.434 0.414 0.414 0.379 0.404 0.405 0.425 0.380 0.422 0.379 0.383 0.358
Tuna 0.315 0.271 0.314 0.232 0.232 0.263 0.290 0.290 0.303 0.323 0.300 0.442 0.315 0.401 0.387 0.309 0.222 0.270
Cord 0.533 0.410 0.440 0.443 0.387 0.446 0.424 0.435 0.323 0.456 0.430 0.632 0.480 0.495 0.517 0.468 0.341 0.288 0.319
Tilapia 0.415 0.305 0.326 0.281 0.302 0.305 0.333 0.301 0.286 0.349 0.359 0.409 0.378 0.408 0.402 0.395 0.296 0.281 0.302 0.268
Rohu 0.412 0.392 0.366 0.368 0.391 0.441 0.396 0.435 0.361 0.364 0.362 0.491 0.455 0.428 0.450 0.389 0.315 0.320 0.314 0.378 0.352
Pangas 0.381 0.399 0.463 0.431 0.507 0.423 0.526 0.469 0.367 0.475 0.464 0.502 0.437 0.422 0.472 0.433 0.334 0.281 0.349 0.352 0.398 0.262
Frog 0.398 0.333 0.365 0.364 0.322 0.402 0.348 0.359 0.312 0.384 0.356 0.406 0.441 0.463 0.444 0.392 0.345 0.409 0.376 0.365 0.430 0.349 0.358
Turtle 0.418 0.407 0.316 0.358 0.369 0.343 0.358 0.366 0.366 0.398 0.402 0.377 0.385 0.336 0.415 0.357 0.336 0.427 0.381 0.391 0.355 0.355 0.357 0.336
Wheat 1.574 1.655 1.904 1.771 1.779 1.697 2.276 2.114 1.915 1.795 1.557 1.482 2.583 2.137 2.564 2.731 1.736 2.261 1.989 2.035 2.194 2.237 2.082 1.676 2.186
Onion 1.430 1.671 1.951 1.701 1.709 1.626 1.884 1.823 1.875 1.544 1.495 1.261 2.083 1.914 2.269 2.165 1.384 1.844 1.600 1.922 2.101 2.059 1.795 1.607 1.926 0.138
Ginger 1.569 1.619 1.930 1.840 1.744 1.613 2.162 1.864 1.779 1.568 1.522 1.379 2.180 2.034 2.187 2.253 1.522 2.204 1.905 1.915 2.264 1.943 1.908 1.668 1.834 0.167 0.175
Chilli 1.600 1.510 1.944 1.786 1.740 1.601 1.998 1.737 1.914 1.593 1.549 1.319 2.315 2.158 2.227 2.187 1.493 2.028 1.678 1.720 1.871 1.797 1.775 1.519 1.890 0.266 0.246 0.312 0.000
Page 141
11
7
Table 4.13: Pairwise distances of the pork ND5-specific 73 bp site against other 28 non-target species.
Species Pig Buffalo Cow Goat Sheep Deer Donk Horse Dog Cat Rabb Monk Chik Duck Pegi Quial Rat Salm Tuna Cord Telap Rohu Pang Frog Turtl Whet Onion Gingr Chilli
Pig 0.000
Buffalo 0.395
Cow 0.483 0.170
Goat 0.374 0.107 0.255
Sheep 0.365 0.165 0.144 0.186
Deer 0.595 0.214 0.260 0.281 0.280
Donkey 0.388 0.317 0.380 0.356 0.319 0.470
Horse 0.435 0.313 0.374 0.376 0.314 0.462 0.069
Dog 0.447 0.418 0.663 0.397 0.490 0.528 0.590 0.520
Cat 0.421 0.557 0.706 0.449 0.525 0.518 0.621 0.547 0.337
Rabbit 0.527 0.490 0.572 0.575 0.410 0.626 0.375 0.344 0.518 0.661
Monkey 0.573 0.566 0.647 0.583 0.563 0.573 0.679 0.598 0.432 0.410 0.652
Chicken 0.822 0.962 1.398 0.935 1.013 0.796 1.040 0.916 0.685 0.755 0.639 0.755
Duck 0.739 0.682 0.902 0.759 0.707 0.831 0.662 0.616 0.747 0.826 0.604 0.822 0.238
Pigeon 0.882 0.735 1.069 1.034 0.882 0.817 0.803 0.750 0.705 0.851 0.582 0.929 0.325 0.393
Quail 0.782 0.871 1.122 0.982 0.909 0.974 0.891 0.748 0.715 0.621 0.607 0.715 0.212 0.196 0.334
Rat 0.641 0.530 0.635 0.567 0.464 0.601 0.632 0.501 0.472 0.507 0.539 0.530 0.782 0.816 0.612 0.782
Salmon 0.606 0.674 0.582 0.564 0.552 0.734 0.947 0.965 0.572 0.651 0.592 0.789 0.693 0.866 0.775 0.755 0.630
Tuna 0.696 0.879 0.857 0.772 0.679 0.902 0.885 0.909 0.539 0.578 0.581 0.593 0.531 0.797 0.675 0.662 0.526 0.262
Cord 0.800 0.831 0.851 0.682 0.641 0.969 0.939 0.958 0.846 0.654 0.714 0.858 0.776 0.710 0.987 0.826 0.763 0.565 0.514
Tilapia 0.727 0.779 0.727 0.654 0.607 0.876 0.822 0.928 0.701 0.857 0.634 0.652 0.692 0.746 0.855 0.863 0.668 0.317 0.238 0.480
Rohu 0.620 0.632 0.629 0.626 0.466 0.758 0.731 0.682 0.510 0.600 0.391 0.492 0.690 0.658 0.711 0.739 0.589 0.258 0.242 0.413 0.241
Pangas 0.722 0.707 0.658 0.589 0.485 0.797 0.782 0.764 0.647 0.647 0.547 0.501 0.838 0.739 1.039 0.865 0.643 0.263 0.217 0.362 0.239 0.172
Frog 1.141 1.356 1.188 1.448 1.245 1.214 1.137 1.053 0.879 0.737 1.002 0.782 1.269 1.737 0.939 1.303 1.252 1.325 0.882 1.168 1.349 0.822 0.920
Turtle 0.641 0.885 0.985 0.902 0.744 0.974 0.782 0.885 0.652 0.718 0.648 0.842 0.387 0.439 0.355 0.497 0.545 0.664 0.430 0.677 0.762 0.672 0.811 1.137
Wheat 0.856 0.992 1.107 0.992 1.010 1.301 1.502 1.432 1.168 1.139 1.382 1.546 2.264 2.174 1.681 2.002 1.207 1.453 1.753 1.861 2.469 1.597 1.775 1.635 1.624
Onion 0.815 0.937 0.974 0.937 0.955 1.127 1.371 1.258 0.992 1.117 1.156 1.441 2.276 1.982 1.702 1.873 1.076 1.282 1.595 1.709 2.207 1.453 1.615 1.913 1.542 0.126
Ginger 0.691 0.741 0.934 0.741 0.810 0.981 1.097 1.019 0.737 0.969 1.091 1.095 1.666 1.427 1.386 1.493 0.932 1.107 1.307 1.694 1.860 1.237 1.388 2.074 1.380 0.196 0.170
Chilli 0.912 0.919 1.063 0.981 0.999 1.354 1.332 1.226 1.018 1.196 1.183 1.356 2.150 1.927 1.636 2.019 1.036 1.278 1.472 1.701 2.074 1.196 1.578 1.642 1.542 0.171 0.167 0.263 0.000
Page 142
11
8
Figure 4.1: Phylogenetic tree generated from the amplicon sequences of each target gene and same gene sequences of other 28 non-target animal,
aquatic and plant species using the neighbourhood-joining method. Phylogenetic tree of beef cytb-specific 120 bp site (a), beef ND5-specific 106 bp
site (b), buffalo cytb-specific 90 bp site (c), buffalo ND5-specific 138 bp site (d), pork cytb-specific 146 bp site (e) and pork ND5-specific 106 bp
site (f), respectively.
(a) (b)
Page 143
11
9
Figure 4.1: continued.
(c) (d)
Page 144
12
0
Figure 4.1: continued.
(e) (f)
Page 145
121
Figure 4.2: 3D plot showing mismatch and pairwise distance between targets and non-
targets species. Here, X and Y axes represent the number of forward and reverse primer
mismatches and Z axis represents pairwise distance between targets and other 28 non-
target species. 3D plot from cytb and ND5 primer pairs are shown in figure (a) and (b)
for cow; (c) and (d) for buffalo and (e) and (f) for pig, respectively.
(a)
(b)
Page 146
122
Figure 4.2: continued.
(c)
(d)
Page 147
123
Figure 4.2: continued.
(e)
(f)
Page 148
124
4.3 Simplex PCR Assay
4.3.1 Simplex PCR Optimization
To optimize the assays, the PCR reactions of six sets of primers were individually
carried out on a gradient thermal cycler with total reaction volume of 25 μL containing
appropriate quantity of all PCR components (section 3.4.1). The annealing temperatures
of all sets of primers were checked from 58-620 C in the gradient system to find out the
optimum annealing temperature for successful PCR amplifications. Although some
primer sets were successfully amplified at both 59, 60 and 610 C, but were properly
amplified only at 600 C (Figure 4.3 -4.5). Therefore, 600 C temperature was the optimum
annealing temperature for all the primer sets as in multiplex PCR reaction all primer pairs
have to be amplified in a single reaction condition.
Figure 4.3: Optimization of annealing temperature of designed beef cytb (a) and ND5
(b) primer sets. In the gel image, M 50 bp DNA ladder; lanes 1-5, amplified PCR
products for 58, 59, 60, 61 and 620 C temperatures.
(a) (b)
Page 149
125
Figure 4.4: Optimization of annealing temperature of designed buffalo cytb (a) and
ND5 (b) primer sets. In the gel image, M 50 bp DNA ladder; lanes 1-5, amplified PCR
products for 58, 59, 60, 61 and 620 C temperatures.
Figure 4.5: Optimization of annealing temperature of designed pork cytb (a) and ND5
(b) primer sets. In the gel image, M 50 bp DNA ladder; lanes 1-5, amplified PCR
products for 58, 59, 60, 61 and 620 C temperatures.
4.3.2 Simplex PCR Assay Specificity
The specificity of the primers is very important in developing a robust PCR assay since
the primers that fully match the target species and mismatch the non-target species offer
(b) (a)
(a) (b)
Page 150
126
a higher chance of having a highly specific-PCR assay by eliminating the probability of
non-target amplification (Wu, Hong & Liu, 2009).
After optimization of simplex PCR, species specificity of the primers were cross-tested
against one target and other 22 non-target of terrestrial and aquatic animal species (beef,
buffalo, pork, goat, lamb, dog, cat, rabbit, monkey, donkey, chicken, duck, pigeon, quail,
rat, salmon, tuna, cod, tilapia, rohu, pangas, frog and tortoise) and 5 plant species (wheat,
onion, garlic, ginger and pepper) which are commonly used as food matrices (Figure 4.6
- 4.11). The results showed that specific primer sets amplified only DNA of the target
species but not any of the non-target species. While, universal eukaryotic primers
amplified 99 bp sites from all species, reflecting the good quality of the extracted DNA
and eliminating the possibility of any false-negative detection. This indicated a high
specificity and fidelity of the each set of designed primers for the target species. All tests
were repeated three times on three different days but the same outcomes were observed.
The amplified PCR products were separated by running with automated capillary
electrophoretic system (QIAGEN GmbH, Hilden, Germany). The system is capable of
separating nucleic acid with 3-5 bp resolution by using an in-built gel cartridge within 12
min through the application of an electrical current to a gel-filled capillary cartridge via
individual electrode of each capillary. The migrated nucleotide molecules were detected
in an in-built-detector and displayed as gel image (Figure 4.6 - 4.11).
Page 151
127
Figure 4.6: The specificity of the simplex PCR of beef cytb (120 bp)-specific primer
pair with DNA of different species. In the gel image, M DNA ladder; N negative
template control; lane 1, PCR products of beef cytb (120 bp) and endogenous control
(99 bp); lanes 2-28, PCR products of endogenous control (99 bp) for buffalo, pork,
goat, lamb, dog, cat, rabbit, monkey, donkey, chicken, duck, pigeon, quail, rat, salmon,
tuna, cod, tilapia, rohu, pangas, frog, tortoise, wheat, onion, garlic, ginger and pepper,
respectively.
Figure 4.7: The specificity of the simplex PCR of beef ND5 (106 bp)-specific primer pair with
DNA of different species. In the gel image, M DNA ladder; N negative template control; lane
1, PCR products of beef ND5 (106 bp) and endogenous control (99 bp); lanes 2-28, PCR
products of endogenous control (99 bp) for buffalo, pork, goat, lamb, dog, cat, rabbit, monkey,
donkey, chicken, duck, pigeon, quail, rat, salmon, tuna, cod, tilapia, rohu, pangas, frog, tortoise,
wheat, onion, garlic, ginger and pepper, respectively.
120 bp
99 bp
106 bp
99 bp
Page 152
128
Figure 4.8: The specificity of the simplex PCR of buffalo cytb (90 bp)-specific primer pair with
DNA of different species. In the gel image, M DNA ladder; N negative template control; lane
1, PCR products of buffalo cytb (90 bp) and endogenous control (99 bp); lanes 2-28, PCR
products of endogenous control (99 bp) for beef, pork, goat, lamb, dog, cat, rabbit, monkey,
donkey, chicken, duck, pigeon, quail, rat, salmon, tuna, cod, tilapia, rohu, pangas, frog, tortoise,
wheat, onion, garlic, ginger and pepper, respectively.
Figure 4.9: The specificity of the simplex PCR of buffalo ND5 (138 bp)-specific primer pair
with DNA of different species. In the gel image, M DNA ladder; N negative template control;
lane 1, PCR products of buffalo ND5 (138 bp) and endogenous control (99 bp); lanes 2-28,
PCR products of endogenous control (99 bp) for beef, pork, goat, lamb, dog, cat, rabbit,
monkey, donkey, chicken, duck, pigeon, quail, rat, salmon, tuna, cod, tilapia, rohu, pangas,
frog, tortoise, wheat, onion, garlic, ginger and pepper, respectively.
99 bp
90 bp
138 bp
99 bp
Page 153
129
Figure 4.10: The specificity of the simplex PCR of pork cytb (146 bp)-specific primer pair with
DNA of different species. In the gel image, M DNA ladder; N negative template control; lane
1, PCR products of pork cytb (146 bp) and endogenous control (99 bp); lanes 2-28, PCR
products of endogenous control (99 bp) for beef, buffalo, goat, lamb, dog, cat, rabbit, monkey,
donkey, chicken, duck, pigeon, quail, rat, salmon, tuna, cod, tilapia, rohu, pangas, frog, tortoise,
wheat, onion, garlic, ginger and pepper, respectively.
Figure 4.11: The specificity of the simplex PCR of pork ND5 (73 bp)-specific primer pair with
DNA of different species. In the gel image, M DNA ladder; N negative template control; lane
1, PCR products of pork ND5 (73 bp) and endogenous control (99 bp); lanes 2-28, PCR
products of endogenous control (99 bp) for beef, buffalo, goat, lamb, dog, cat, rabbit, monkey,
donkey, chicken, duck, pigeon, quail, rat, salmon, tuna, cod, tilapia, rohu, pangas, frog, tortoise,
wheat, onion, garlic, ginger and pepper, respectively.
146 bp
99 bp
99 bp
73 bp
Page 154
130
4.3.3 PCR product sequencing
PCR products were sequenced to confirm the originality of the amplified PCR products
of all targets. The obtained sequences were aligned firstly, with GenBank
(www.ncbi.nlm.nih.gov) sequences for checking if there were matches and secondly,
with specific gene sequence using the MEGA5 alignment tool to determine the similarity.
The results of sequencing are summarized in Table 4.14. The sequence similarity score
obtained from PCR products of beef (Cocytb and CoND5), Buffalo (Bucytb) and pork
(Pocytb and PoND5) revealed 100% homology with Bos taurus, Bubalus bubalis and Sus
scrofa sequences available in GenBank, respectively. On the contrary, only the PCR
products of BuND5 showed the similarity of 98.55% with the ND5 gene of Bubalus
bubalis but it was within acceptable range because the limit of sequence similarity for the
designate species identification is at least 98% (Cawthorn et al., 2013).
Table 4.14: Sequencing results of PCR products.
Name of
target
Target
gene Species
GeneBank
accession ID
Similarity
(%)
Cocytb Cytb Cow
(Bos taurus) V00654.1 100
CoND5 ND5 Cow
(Bos taurus) V00654.1 100
Bucytb Cytb Buffalo
(Bubalus bubalis) NC_006295.1 100
BuND5 ND5 Buffalo
(Bubalus bubalis) NC_006295.1 98.55
Pocytb Cytb Pork
(Sus scrofa) AF034253.1 100
PoND5 ND5 Pork
(Sus scrofa) AF034253.1 100
Page 155
131
4.4 Tetraplex PCR Assay
4.4.1 Optimization of Tetraplex PCR Assay
Initially, simplex PCR was optimized for each primer pair against the template DNA
extracted from muscle tissues of each target species to ensure the specificity and ability
for amplifying the target sites of the designed primers (Dalmasso et al., 2004). The step
by step development of a tetraplex PCR is demonstrated in Figure 4.12. As described in
the methodology (Section 3.4.1 and 3.5.1), simplex (lanes 1-4), duplex (Lanes 5 and 6),
triplex (lane 7) and the tetraplex (lane 8) PCR system were developed in an ordered way
to ensure the clarity of the system (Ali et al., 2015d). The developed simplex, duplex,
triplex and tetraplex systems amplified the targeted gene (Cytb and ND5) sites of
fragment-size 120 and 106 bp for beef and 90 and 138 bp for buffalo, respectively (Figure
4.12), reflecting full consistency with the simplex PCR system.
Figure 4.12: The gel image (a) and electroferogram (b) of double gene-site targeted
tetraplex PCR for beef and buffalo authentication. In the gel image: lane M represents
DNA ladder; lanes 1-8 PCR products from buffalo Cytb (lane 1); beef ND5 (lane 2);
beef Cytb (lane 3); buffalo ND5 (lane 4); duplex PCR of Cytb of beef and buffalo
(lane 5); duplex PCR of ND5 of beef and buffalo (lane 6); triplex PCR of Cytb of beef
and ND5 of beef and buffalo (lane 7); multiplex PCR of Cytb and ND5 of beef and
buffalo (lane 8); and negative control (lane 9). The inset is the corresponding
electropherogram showing all products from beef and buffalo.
106 bp
138 bp
90 bp
120 bp
90 bp 106 bp 120 bp
138 bp
(a)
400
Page 156
132
Figure 4.12: continued.
4.4.2 Tetraplex PCR Assay Specificity
The specificity of the developed tetraplex PCR assay was screened against two targets
(beef and buffalo) and other 21 non-targets of terrestrial and aquatic animal species and
5 plant species (Section 3.5.2); wherein the developed tetraplex PCR system yielded PCR
products only from the beef and buffalo targets and no products from non-targets (Figure
4.13).
[FU]
2.0
0.0
3.0
1.0
15 50 200 100 300 400 600 [bp]
106 bp 120 bp
138 bp 90 bp
(b)
Page 157
133
Figure 4.13: Specificity test of the developed tetraplex PCR. In the gel images of (a)
and (b), M DNA ladder; N negative template control and lane 1, tetraplex PCR products
of cytb and ND5 of beef and buffalo. In image a, lanes 2 and 3, PCR products of cytb
and ND5 of beef and buffalo, respectively; lanes 4-15, PCR products from goat, lamb,
dog, pork, cat, rabbit, monkey, donkey, chicken, duck, pigeon and quail respectively.
In image b, lanes 2-15, PCR products from rat, salmon, tuna, cod, tilapia, rohu, pangas,
frog, turtle wheat, onion, garlic, ginger and pepper respectively. Corresponding
electropherograms are presented by respective labels.
4.4.3 Limit of detection (LOD) of Tetraplex PCR Assay under Raw State
Extracted DNA of both target-species (cow and buffalo) was serially diluted from
higher concentration (50 ng/μL) to 10.0, 5.0, 1.0, 0.5, 0.2, 0.1, 0.05, 0.02 and 0.01 ng/μL
and was used as a template to determine the tetraplex PCR sensitivity since I have found
spectroscopic determination of nucleic acid concentration is more reliable at higher
concentration. The QIAxcel automated capillary electrophoresis produced four bands
corresponding to two cytb and two ND5 genes of cow and buffalo species from as low as
90 bp 106 bp
138 bp 120 bp
(a)
(b)
Page 158
134
0.01 ng DNA template (Figure 4.14 a). Although the band intensity of the lane 9 (0.01
ng) was very low in gel image, they were clearly reflected in the electroferograms (Lane
9 of Figure 4.14 b). Thus 0.01 ng of source DNA was defined as the limit of detection
(LOD) of the developed tetraplex system.
Figure 4.14: Sensitivity analysis of tetraplex PCR system. Shown are in the gel image
(a), lane M is DNA ladder, lane 1–10 are the PCR products of 10, 5, 1, 0.5, 0.2, 0.1,
0.05, 0.02, 0.01 and 0 ng of DNA of cow and buffalo species and in the
electropherograms (b), lanes 1–10, are presented with labels as shown in the figure.
[FU]
6.0
4.0
2.0
0.0
15 50 200 100 300 400 600 [bp]
106 bp
120 bp
138 bp
Lane 1(10 ng)
1.0
3.0
5.0
7.0
[FU]
4.0
5.0
2.0
0.0
15 50 200 100 300 400 600 [bp]
Lane 2 (5 ng)
1.0
3.0
10 5.0 1.0 0.5 0.2 0.1 0.05 0.02 0.01 0.0 ng Template
(a)
(b)
Page 159
135
Figure 4.14: continued.
[FU]
0.6
0.4
0.8
0.2
0.0
15 50 200 100 300 400 600 [bp]
600 bp
15 bp
Lane 10 (Negative control)
1.0
1.2
Lane 3 (1 ng) [FU]
2.0
0.0
1.0
50 200 100 300 400 600 [bp]
2.5
1.5
0.5
[FU]
0.8
1.2
0.4
0.0
15 50 200 100 300 400 600 [bp]
Lane 4 (0.5 ng)
1.0
1.4
0.2
0.6
[FU]
0.8
1.0
0.4
0.0
0.6
0.2
15 50 200 100 300 400 600 [bp]
Lane 5 (0.2 ng) [FU]
0.8
1.2
1.0
0.4
0.0
0.6
0.2
15 50 200 100 300 400 600 [bp]
Lane 6 (0.1 ng)
[FU]
0.6
0.4
1.2
0.8
0.2
0.0
1.0
15 50 200 100 300 400 600 [bp]
Lane 7 (0.05 ng) [FU]
1.2
0.8
0.4
0.0
15 50 200 100 300 400 600 [bp]
Lane 8 (0.02 ng)
[FU]
0.6
0.4
0.8
0.2
0.0
1.0
15 50 200 100 300 400 600 [bp]
Lane 9 (0.01 ng)
90 bp
106 bp
120 bp
138 bp
Page 160
136
4.4.4 Sensitivity test of Tetraplex PCR Assay
4.4.4.1 Sensitivity test of Tetraplex PCR Assay under Binary Meat Admixture
To evaluate the performance of the tetraplex PCR, beef and buffalo were
concomitantly detected in binary admixtures of beef and buffalo (1:99 to 99:1). The
system amplified both targets (cytb and ND5) in admixtures, containing as little as 1%
beef into buffalo and vice versa (Figure 4.15). While all four bands (90, 106, 120 and 138
bp) appeared from 1% to 99% beef in buffalo and vice versa, only two bands (106 and
120 bp) and (90 and 138 bp) were obtained from pure beef (lane 1) and buffalo (lane 11),
respectively, clearly indicating strong specificity and sensitivity at the 1% level.
Electroferograms of the image (Figure. 4.15 b) clearly revealed that when the amounts of
beef DNA were decreased, the bands became fainter as might be expected and the 90 and
138 bp fragments (cytb and ND5 genes of buffalo) became more obvious, revealing
correlation between the intensity and concentration.
Figure 4.15: Tetraplex PCR of beef and buffalo binary ad-mixture. In the gel image (a),
lane 1–11 represent PCR products of the ad-mix of beef and buffalo meat in the ratio
of 100:0, 99:1, 95:5, 90:10, 75:25, 50:50, 25:75, 10:90, 5:95, 1:99 and 0:100,
respectively and lane M is ladder DNA and lane 12 is negative control. The
corresponding electropherograms are as shown with label (b).
100:0 99:1
95:5 90:10
75:25 50:50
25:75
10:90 5:95
1:99 0:100
0:0 Ratio of beef
and buffalo
meat
(a)
Page 161
137
Figure 4.15: continued.
(b) [FU]
4.0
5.0
2.0
0.0
3.0
1.0
1 5 21 3 4 6
106 bp
120 bp 90 bp
138 bp
Lane 2; Beef : Buffalo (99:1)
[FU]
4.0
2.0
0.0
3.0
1.0
15 50 200 100 300 400 600 [bp]
Lane 3; Beef : Buffalo (95:5) [FU]
4.0
2.0
0.0
3.0
1.0
15 50 200 100 300 400 600 [bp]
Lane 4; Beef : Buffalo (90:10)
[FU]
4.0
2.0
0.0
3.0
1.0
15 50 200 100 300 400 600 [bp]
Lane 5; Beef : Buffalo (75:25)
[FU]
4.0
5.0
2.0
0.0
15 50 200 100 300 400 600 [bp]
120 bp
Lane 1; Beef : Buffalo (100:0)
3.0
6.0
1.0
[FU]
4.0
2.0
0.0
3.0
1.0
15 50 200 100 300 400 600 [bp]
Lane 6; Beef : Buffalo (50:50)
[FU]
4.0
2.0
0.0
1.0
3.0
15 50 200 100 300 400 600 [bp]
Lane 7; Beef : Buffalo (25:75) [FU]
4.0
2.0
0.0
3.0
1.0
15 50 200 100 300 400 600 [bp]
Lane 8; Beef : Buffalo (10:90)
Page 162
138
Figure 4.15: continued.
4.4.4.2 Sensitivity Test of Tetraplex PCR Assay under Commercial Product (Burger
and Meat Curry)
The applicability of the tetraplex PCR assay for identifying beef and buffalo in
processed foods was checked by screening seven meat curries and 45 burgers samples
collected from Malaysian commercial outlets (Table 4.15).
To check the validity of the designed multiplex PCR assay, model standard, pure and
deliberately adulterated (1%) beef and buffalo burgers were prepared in the laboratory as
described in section 3.5.5. Experimental findings are given in Figure 4.16 and analytical
data is presented in Table 4.15. Model pure beef burgers as well as commercial beef
burgers amplified only beef-specific products (120 and 106 bp) (Figure 4.16; lanes 1 and
2) and pure buffalo burgers produced only buffalo-specific (90 and 138 bp) products
[FU]
2.0
0.0
3.0
1.0
15 50 200 100 300 400 600 [bp]
Lane 9; Beef : Buffalo (5:95)
4.0 [FU]
2.0
0.0
3.0
1.0
15 50 200 100 300 400 600 [bp]
Lane 10; Beef : Buffalo (1:99)
2.5
1.5
0.5
[FU]
0.6
0.4
0.8
0.2
0.0
15 50 200 100 300 400 600 [bp]
600 bp
15 bp
Lane 12; Negative control [FU]
2.0
0.0
3.0
1.0
15 50 200 100 300 400 600 [bp]
90 bp 138 bp
Lane 11; Beef : Buffalo (0:100)
Page 163
139
(Figure 4.16; lane 3). The findings were also true for 1% model beef and buffalo burgers
(Figure 4.16 and lanes 4 - 9).
On the other hand, while beef was detected in all commercial beef burgers, only two
of the seven beef curries were found to contain beef and five of the seven were buffalo.
This reflected that fraud selling of buffalo curries in the name beef curries are rampant in
Malaysia. It was noted that nobody was legally selling buffalo burgers and buffalo curries
in Malaysia.
Figure 4.16: The gel image (left) and electropherograms (right-insets) of tetraplex PCR
for beef (lanes 1, 2, 4, 5, 7 & 8) and buffalo (lanes 3, 6 & 9). Shown are lab-made pure
beef burger (lanes 1), lab made pure buffalo burger (Lane 3), lab made 1% buffalo
adulterated beef burger before (lanes 4) and after autoclaving (lane 7), lab made 1%
beef adulterated buffalo burger before (lane 6) and after autoclaving (lane 9),
commercial pure beef burger (lane 2) and 1% buffalo lab adulterated commercial beef
burgers before (lane 5) and after autoclaving (lane 8). Lane M is ladder DNA and lane
10 is negative control.
[FU]
0.8
1.0
0.4
0.0
0.6
0.2
15 50 200 100 300 400 600
[bp]
90 bp
138 bp
[FU]
0.8
1.6
1.2
0.4
0.0
2.0
15 50 200 100 300 400 600 [bp]
120 bp
138 bp
106 bp
Page 164
140
Table 4.15: Analysis of model and commercial burgers under raw and processed states.
Sample Type
Deliberately
adulterated
(1%)
State
Detected
species
PCR
accuracy
(%) Cow Buffalo
Beef
burger Model
Buffalo
meat Raw 9/9 9/9 100
Beef
burger Model
Buffalo
meat
Autoclaved
for 2.5 h 9/9 9/9 100
Beef
burger Commercial
Buffalo
meat Raw 9/9 9/9 100
Beef
burger Commercial
Buffalo
meat
Autoclaved
for 2.5 h 9/9 9/9 100
Buffalo
burger Model Beef Raw 9/9 9/9 100
Buffalo
burger Model Beef
Autoclaved
for 2.5 h 9/9 9/9 100
Beef
burger A Commercial - Raw 9/9 0/9 100
Beef
burger B Commercial - Raw 9/9 0/9 100
Beef
burger C Commercial - Raw 9/9 0/9 100
Beef
burger D Commercial - Raw 9/9 0/9 100
Beef
burger E Commercial - Raw 9/9 0/9 100
Beef
curry Commercial - - 2/7 5/7 100
4.4.5 Target DNA Stability Test under Tetraplex PCR Assay
To evaluate the detection efficiency of the developed tetraplex PCR, various heat
treated meat samples were analyzed. For this purpose, beef and buffalo meat were
Page 165
141
subjected to three different thermal treatment processes, namely boiling, autoclaving and
microwave cooking. The methods of cooking are described in earlier literatures (Ali et
al., 2015d) and in section 3.5.6. The developed tetraplex PCR system successfully
identified two different targets for beef and two different targets for buffalo from all
thermally processed samples, including extensive autoclaving for (1210 C at 15-psi for
2.5 h) and extensive microwaving at 700 watt for 30 min (Figure 4.17), which are known
to degrade DNA.
Figure 4.17: Stability test of tetratiplex PCR of DNA extracted from beef and buffalo
meat (lanes 1 - 5) under boiling (lane 1), autoclaving (lane 2) and microwave (lanes 3
– 5 at 500, 600 & 700 W respectively for 30 min) cooking treatments. Lane M is ladder
DNA and lane 6 is negative control.
4.5 Multiplex (Hexaplex) PCR (mPCR) Assay
4.5.1 Optimization of Multiplex (Hexaplex) PCR (mPCR) Assay
After development of tetraplex PCR assay of beef and buffalo, I included two more
primer sets from cytb and ND5 genes of pig species to develop a double genes targeted
multiplex (hexaplex) PCR technique for the simultaneous detection of all target species
in a single assay platform. This system was developed step by step from simplex to
[FU]
0.6
0.4
0.8
0.2
0.0
1.0
15 200 100 300 400 600 [
90 bp
106 bp
120 bp
138 bp
50
Boiled Auto-
laved 500 W 600 W 700 W
Page 166
142
hexaplex as described in the section 3.5.1 and 3.6.1 (Figure 4.18). The order of the
developmental stage went through the simplex (lanes 1-6), duplex (lanes 7 and 8), triplex
(lane 9), tetraplex (lane 10) and hexaplex (lane 11) PCR systems to ensure the consistency
of the multiplex system (Ali et al., 2015d). The simplex and all the multiplex systems
(duplex, triplex, tetraplex and hexaplex) amplified the target gene (cytb and ND5) sites
(120 and 106 bp for beef, 90 and 138 bp for buffalo and 146 and 73 for pig) respectively
(Figure 4.18), reflecting full conformity with the simplex PCR system. Furthermore,
consistent results were found in hexaplex PCR when a different multiplex PCR master
mix kit (QIAGEN Multiplex PCR Plus Kit) was used.
Figure 4.18: The gel image (a) and electroferogram (b) of double gene-site targeted
multiplex PCR for beef, buffalo and pork authentication. In the gel image: lane M
represents DNA ladder; lanes 1-11 PCR products from pork ND5 (lane 1); buffalo cytb
(lane 2); beef ND5 (lane 3); beef cytb (lane 4); buffalo ND5 (lane 5); pork cytb (lane
6); duplex PCR of cytb of beef and buffalo (lane 7); duplex PCR of ND5 of beef and
buffalo (lane 8); triplex PCR of cytb of beef and ND5 of beef and buffalo (lane 9);
tetraplex PCR of cytb and ND5 of beef and buffalo (lane 10); multiplex PCR of cytb
and ND5 of beef, buffalo and pork (lane 11); and negative control (lane N). The
corresponding electropherogram of lane 11 is representated showing all products from
beef, buffalo and pork.
Pork cytb (146 bp) Buffalo ND5 (138 bp)
Beef cytb (120 bp)
Beef ND5 (106 bp)
Buffalo cytb (90 bp)
Pork ND5 (73 bp)
(a)
Page 167
143
Figure 4.18: continued.
4.5.2 Multiplex PCR Assay Specificity
As like as tetraplex PCR assay, the specificity test of the developed mPCR assay was
carried out against three targets (beef, buffalo and pork) and other 20 non-target of animal
species and 5 plant species (Section 3.6.2) and the results revealed that the assay yielded
PCR products only from the beef, buffalo and pig targets and no products from any other
non-targets (Figure 4.19). The figure clearly shows that when DNA of three targets were
added in a single reaction tube, three target species were amplified simultaneously (73,
90, 106, 120,138 and 146 bp products) from that tube (Figure 4.19 a, lane 1), when DNA
of single target species was added, the assay amplified only the added species (in Figure
4.19 a, lane 2-4 for beef, buffalo and pork, respectively).
[FU]
4.0
5.0
2.0
0.0
3.0
1.0
15 50 200 100 300 400 600 [bp]
120 bp
73 bp
90 bp 106 bp
138 bp
146 bp
(b)
Page 168
144
Figure 4.19: Specificity test of the developed multiplex (hexaplex) PCR (mPCR). In
the gel images of (a) and (b), lane M DNA ladder; lane N negative template control and
lane 1, mPCR products of cytb and ND5 of beef, buffalo and pork. In image a, lanes 2,
3 and 4, PCR products of cytb and ND5 of beef, buffalo and pork, respectively; lanes
5-15, PCR products from goat, lamb, dog, cat, rabbit, monkey, donkey, chicken, duck,
pigeon and quail respectively. In image (b), lanes 2-15, PCR products from rat, salmon,
tuna, cod, tilapia, rohu, pangas, frog, turtle wheat, onion, garlic, ginger and pepper
respectively.
120 bp
106 bp 90 bp 73 bp
138 bp 146 bp
(a)
(b)
Page 169
145
4.5.3 Limit of Detection (LOD) of Multiplex PCR Assay under Raw State
To determine the sensitivity of the mPCR assay, extracted DNA of the target species
(cow, buffalo and pig) were diluted serially from higher (50 ng/ml) to lower
concentrations (10.0, 5.0,1.0, 0.5, 0.2, 0.1, 0.05, 0.02 and 0.01 ng/ml) since spectroscopic
measurement at low concentration is not reproducible and trustworthy
(www.biochrom.co.uk/download/72/). The QIAxcel automated capillary lectrophoresis
yielded six bands corresponding to two cytb and two ND5 genes of beef, buffalo and pig
species from as low as 0.02 ng of total DNA extracted from muscle tissues (Figure 4.20).
The electroferogram (Figure 4.20 b) also clearly represented six peaks corresponding to
the six different bands displayed in the gel- view. Thus the limit of detection (LOD) of
the developed mPCR assay was concluded to be 0.02 ng DNA.
Figure 4.20: Sensitivity analysis of multiplex PCR system. Shown are in the gel view (a), lane
M is DNA ladder, lane 1-8 are the PCR products of 10, 5,1, 0.5, 0.2, 0.1, 0.05 and 0.02 ng of
DNA of beef, buffalo and pig species, respectively, and lane N is negative control (0 ng of
DNA). The electropherogram (b) of lanes 8 is presented with labels.
Buffalo cytb (90 bp)
Pork cytb (146 bp)
Beef ND5 (106 bp)
Beef cytb (120 bp)
Buffalo ND5 (138 bp)
Pork ND5 (73 bp)
10 5 0.5 1 0.2 0.1 0.05 0.02 0.0 ng Template
DNA
(a)
Page 170
146
Figure 4.20: continued.
4.5.4 Sensitivity test of Multiplex PCR Assay under Commercial Meat Products
(Meatballs and Frankfurters)
Meatballs and frankfurters are popular all of the world and could be consumed either
as a separate menu or as additives for other dishes. Deliberately contaminated model
meatballs and frankfurters of each target species were prepared in laboratory as described
in section 3.6.4. The commercial meatballs of five different brands for beef (described
as A-E) and pork (described as A-E) were purchased from different selling outlets across
Malaysia on three different dates. Moreover, 20 beef frankfurters and 9 pork frankfurters
of different brand were procured from different shops across Malaysia. The model
meatballs and frankfurters of each target species were deliberately adulterated with 1%,
0.5% and 0.1% raw meat of other two target species as given in section 3.6.4. The 0.1%
spiked meatballs and frankfurters of three species were autoclaved at 1210 C for 2.5 h
under 15-psi and 45-psi pressure, respectively to simulate extensive cooking effect. The
experimental finding of meatballs and frankfurters are given in Figure 4.21 and Figure
4.22, respectively and the analytical data are presented in Table 4.16. The model beef,
buffalo and pork meatballs and frankfurters, adulterated with 1%, 0.5% and 0.1% of
[FU]
0.6
0.4
0.8
0.2
0.0
1.0
15 50 200 100 300 400 600 [bp]
73 bp
106 bp
120 bp 138 bp
90 bp 146 bp
1.2 (b)
15 bp
600 bp
Page 171
147
buffalo and pork; beef and pork; and beef and buffalo, amplified all the six targets (Figure
4.21; lanes 1-3; 5-7 and 9-11 and Figure 4.22; lanes 1-3; 5-7 and 9-11, respectively)
representing the three target species. The 0.1% adulterated autoclaved meatballs and
frankfurters also positively amplified six targets for beef, buffalo and pork (lane 4, 8 and
12 of Figure 4.21 and 4.22).
In case of commercial meatball products, only pork was contained in pork meatballs
but 80% of the analyzed beef meatball was found to contain both beef and buffalo and
20% was found to contain only buffalo species. Thus the absence of pure beef meatballs
in Malaysian markets reflected that buffalo substitution in beef products is rampant for
the pursuit of illegal economic gain (Table 4.17). However, all the tested commercial beef
frankfurters were found as both beef and buffalo positive; this indicated that all beef
frankfurter products in Malaysia was buffalo adulterated. I also checked chicken and pork
frankfurters, but none of them were beef and buffalo positive; this was probably because
the prices of beef and buffalo are higher than those of chicken and pork (Table 4.17).
Page 172
148
Figure 4.21: The gel image (a) and electropherograms (b-d) of multiplex PCR (mPCR)
for the detection of double gene-targeting cow, buffalo and pig in deliberately
adulterated model beef, buffalo and pork meatball under raw and processed states. In
the gel image; lane M, Ladder; lanes 1-3, m-PCR of beef meatball spiked with 1%,
0.5% and 0.1% of buffalo and pork, respectively, under raw state; lanes 5-7, mPCR of
buffalo meatball spiked with 1%, 0.5% and 0.1% of beef and pork, respectively, under
raw state; lanes 9-11, mPCR of pork meatball spiked with 1%, 0.5% and 0.1% of beef
and buffalo, respectively, under raw state; lane 4, 8 and 12, mPCR of heat treated
(autoclaved for 2.5 h) 0.1% adulterated beef, buffalo and pork meatballs respectively;
lane N negative control. The corresponding electroferograms of lane 4, 8 and 12 are
shown with labels in b, c and d, respectively.
(a)
[FU] 1.2
0.8
1.0
0.4
0.0
0.6
0.2
15 50 200 100 300 400 600 [bp]
146 bp
138 bp
120 bp 106 bp
90 bp
73 bp
(b)
15 bp
600 bp
[FU]
1.2
0.8
1.0
0.4
0.0
0.6
0.2
15 50 200 100 300 400 600 [bp]
(c)
73 bp
90 bp
120 bp
138 bp
146 bp
106 bp
Page 173
149
Figure 4.21: continued.
Figure 4.22: Gel image (a) and the electropherograms (b−d) of mPCR for the detection
of double gene-targeted beef, buffalo, and pork in deliberately adulterated model beef,
buffalo, and pork frankfurters under raw and processed states. In the gel image, M,
Ladder; lanes 1−3, m-PCR of beef frankfurter spiked with 1%, 0.5%, and 0.1% of
buffalo and pork, respectively, under raw state; lanes 5−7, mPCR of buffalo frankfurter
spiked with 1%, 0.5%, and 0.1% of beef and pork, respectively, under raw state; lanes
9−11, mPCR of pork frankfurter spiked with 1%, 0.5%, and 0.1% of beef and buffalo,
respectively, under raw state; lanes 4, 8, and 12, mPCR of heat-treated (autoclaved for
2.5 h) 0.1% adulterated beef, buffalo, and pork frankfurter, respectively; lane N,
negative control. The corresponding electroferograms of lane 4, 8, and 12 are shown
labeled as b, c, and d, respectively.
[FU] 1.2
0.6
0.8
1.0
0.2 0.0
0.4
15 50 200 100 300 400 600 [bp]
(d)
90 bp
120 bp
138 bp
73 bp
106 bp
146 bp
Page 174
15
0
Table 4.16: Screening of model meatball and frankfurter products using developed multiplex PCR.
Sample
Adulteration
State
Detected species PCR accuracy
(%) species % Beef Buffalo Pork
Model meatballs
Beef meatball Buffalo and pork 1.0 Raw 9/9 9/9 9/9 100
Beef meatball Buffalo and pork 0.5 Raw 9/9 9/9 9/9 100
Beef meatball Buffalo and pork 0.1 Raw 9/9 9/9 9/9 100
Beef meatball Buffalo and pork 0.1 Autoclaved for 2.5 h 9/9 9/9 9/9 100
Buffalo meatball Beef and pork 1.0 Raw 9/9 9/9 9/9 100
Buffalo meatball Beef and pork 0.5 Raw 9/9 9/9 9/9 100
Buffalo meatball Beef and pork 0.1 Raw 9/9 9/9 9/9 100
Buffalo meatball Beef and pork 0.1 Autoclaved for 2.5 h 9/9 9/9 9/9 100
Pork meatball Beef and Buffalo 1.0 Raw 9/9 9/9 9/9 100
Pork meatball Beef and Buffalo 0.5 Raw 9/9 9/9 9/9 100
Pork meatball Beef and Buffalo 0.1 Raw 9/9 9/9 9/9 100
Pork meatball Beef and Buffalo 0.1 Autoclaved for 2.5 h 9/9 9/9 9/9 100
Note: The numerator and denominator of each fraction denote the number of positive detection and total number of samples analysed using the
multiplex PCR assay.
Page 175
15
1
Table 4.16: continued.
Sample Adulteration
State Detected species PCR accuracy
(%) species % Beef Buffalo Pork
Model frankfurters
Beef frankfurter Buffalo and Pork 1.0 Raw 9/9 9/9 9/9 100
Beef frankfurter Buffalo and Pork 0.5 Raw 9/9 9/9 9/9 100
Beef frankfurter Buffalo and Pork 0.1 Raw 9/9 9/9 9/9 100
Beef frankfurter Buffalo and Pork 0.1 Autoclaved for 2.5 h 9/9 9/9 9/9 100
Buffalo frankfurter Beef and Pork 1.0 Raw 9/9 9/9 9/9 100
Buffalo frankfurter Beef and Pork 0.5 Raw 9/9 9/9 9/9 100
Buffalo frankfurter Beef and Pork 0.1 Raw 9/9 9/9 9/9 100
Buffalo frankfurter Beef and Pork 0.1 Autoclaved for 2.5 h 9/9 9/9 9/9 100
Pork frankfurter Beef and Buffalo 1.0 Raw 9/9 9/9 9/9 100
Pork frankfurter Beef and Buffalo 0.5 Raw 9/9 9/9 9/9 100
Pork frankfurter Beef and Buffalo 0.1 Raw 9/9 9/9 9/9 100
Pork frankfurter Beef and Buffalo 0.1 Autoclaved for 2.5 h 9/9 9/9 9/9 100
Page 176
152
4.5.5 Target DNA Stability Test under Multiplex PCR Assay
To assess the detection efficiency of the described mPCR assay, various thermally
treated meat samples were analysed. As reported in methodology (section 3.6.5), raw
meat of beef, buffalo and pork were subjected to three different heat treatment processes,
namely boiling, autoclaving and microwave cooking. The extracted DNA of the all
processed meat samples were used as templates for the mPCR assay. The system
successfully detected all target species, beef, buffalo and pork under all thermal
Table 4.17: Screening of Commercial meatball, frankfurter and beef curry samples
using developed multiplex PCR.
Sample State
Detected species PCR
accuracy
(%) Beef Buffalo Pork
Commercial meatballs
Beef meatball A Raw 9/9 9/9 0/9 100
Beef meatball B Raw 9/9 9/9 0/9 100
Beef meatball C Raw 6/9 9/9 0/9 100
Beef meatball D Raw 7/9 9/9 0/9 100
Beef meatball E Raw 5/9 9/9 0/9 100
Pork meatball A Raw 0/9 0/9 9/9 100
Pork meatball B Raw 0/9 0/9 9/9 100
Pork meatball C Raw 0/9 0/9 9/9 100
Pork meatball D Raw 0/9 0/9 9/9 100
Pork meatball E Raw 0/9 0/9 9/9 100
Commercial frankfurters
Beef frankfurter Raw 20/20 20/20 0/20 100
Chicken frankfurter Raw 0/10 0/10 0/10 100
Pork frankfurter Raw 0/10 0/10 10/10 100
Note: The numerator and denominator of each fraction denote the number of positive
detection and total number of samples analysed using the multiplex PCR assay.
Page 177
153
processing conditions, including extensive autoclaving (1210C at 15-psi for 2.5 h) and
extreme microwaving at 700W for 30 min (Figure 4.23).
Figure 4.23: The gel image (a) and electroferogram (b) of the stability test of multiplex
PCR of DNA extracted from beef, buffalo and pork (lanes 1-6) under boiling (lane 1),
autoclaving (lane 2 and 3 for 20 min and 2.5 h respectively) and microwaving (lanes 4-
6 at 500, 600 & 700Wrespectively for 30 min) cooking treatments. LaneMis ladder
DNA and lane N is negative control. The corresponding electroferogram (b) of lane 6
is shown with labels.
Beef cytb (120 bp)
Buffalo cytb (90 bp)
Pork cytb (146 bp) Buffalo ND5 (138 bp)
Beef ND5 (106 bp)
Pork ND5 (73 bp)
(a)
[FU]
0.6
0.4
0.8
0.2
0.0
1.0
15 50 200 100 300 400 600 [bp]
73 bp
106 bp
120 bp
138 bp 90 bp
146 bp
1.2 (b)
15 bp
600 bp
Page 178
154
4.6 PCR Products Authentication by RFLP Analysis
4.6.1 RFLP Analysis of Beef and Buffalo PCR Products
4.6.1.1 Authentication of Beef and Buffalo PCR Products of raw meat by RFLP
Analysis
In this study, the tetraplex PCR products of beef and buffalo were digested
simultaneously with three restriction enzymes as cited in section 3.7.1.1 and 3.7.1.2, and
clear fingerprints were obtained for each of the four different targets (Figure 4.24 and
Table 3.9). First, each target was digested separately with an appropriate RE (Table 3.9)
to study its individual restriction patterns (Figure 4.24). Both buffalo cytb (90 bp) (Figure
4.24, lane 1) and beef ND5 (106 bp) (Figure 4.24, lane 3) products were digested by FatI
RE, which generated two fragments for each target (50 and 40 bp for buffalo cytb (lane
2) and 87 and 19 bp for beef ND5 (lane 4)). On the other hand, beef cytb (120 bp) (lane
5) was digested by EciI that produced two fragments (75 and 45 bp) (lane 6). In contrast,
buffalo ND5 product (lane 7) was digested with AluI, which resulted in another two
fragments (130 and 8 bp) (lane 8). However, 8 bp fragment was not detected because it
went beyond the lower limit of instrumental resolution, which was ≤15 bp. Finally, the
tetraplex PCR products (lane 9) were subjected to RE digestion with the three enzymes
(FatI, EciI, and AluI) in a single tube, and this generated molecular fingerprints which
were composed of a total of seven fragments (19, 40, 45, 50, 75, 87, and 130) (lane 10).
The origins of these products (lane 9) were confirmed by the separate digests of the four
targets (lanes 1−8).
Page 179
155
Figure 4.24: RFLP analysis of simplex and mPCR products before (lanes 1, 3, 5, 7, and
9) and after (lanes 2, 4, 6, 8, and 10) restriction digestion. In the gel image, lanes 1 and
2, cytb of buffalo; lanes 3 and 4, ND5 of beef; lanes 5 and 6, cytb of beef; lanes 7 and
8, ND5 of buffalo; and lanes 9 and 10, mPCR of cytb and ND5 of beef and buffalo.
Corresponding electropherograms are shown with labels.
130 bp
87 bp 75 bp 50 bp
40 bp 45 bp
19 bp 15 bp
90 bp 50 bp
40 bp
106 bp 120 bp
87 bp
19 bp
75 bp
45 bp
130 bp 138 bp
[FU]
0.8
1.0
0.4
0.0
0.6
0.2
15 50 200 100 300 400 600 [bp]
Lane 2
40 bp
50 bp
15 bp
600 bp
[FU]
0.8
1.0
0.4
0.0
0.6
0.2
15 50 200 100 300 400 600 [bp]
Lane 4
19 bp 87 bp
[FU]
0.8
1.0
0.4
0.0
0.6
0.2
15 50 200 100 300 400 600 [bp]
Lane 6
45 bp 75 bp
[FU]
0.8
1.0
0.4
0.0
0.6
0.2
15 50 200 100 300 400 600 [bp]
Lane 8
130 bp
Page 180
156
Figure 4.24: continued.
4.6.1.2 Authentication of Tetraplex PCR Products of frankfurters by RFLP Analysis
After the tetraplex PCR-RFLP assay under pure states was optimized, it was
subsequently optimized and evaluated for the screening of commercial beef and buffalo
frankfurters under raw, boiled, and autoclaved states (Taboada et al., 2014). Dummy
frankfurters were deliberately adulterated, and their restriction digestion patterns were
studied (Figure 4.25). The digest of all samples (lanes 1, 3, 5, 7, 9, and 11) clearly
presented the signature fingerprints of 7 fragments (lanes 2, 4, 6, 8, 10, and 12), the
stability of the four biomarkers were not affected by several thermal treatment.
50 bp 45 bp
40 bp
[FU]
0.6
0.8
0.2
0.0
0.4
1.0
15 50 200 100 300 400 600 [bp]
130 bp 87 bp
75 bp
19 bp
Lane 10
Page 181
157
Figure 4.25: PCR-RFLP analysis of mPCR products of deliberately adulterated raw and
heat-treated (boiled and autoclaved) beef (lanes 1−6) and buffalo (lanes 7−12)
frankfurters. In gel image, lanes 1 and 2,buffalo-adulterated raw beef frankfurter before
and after digestion, respectively; lanes 3 and 4,buffalo-adulterated boiled (98 °C for 90
min) beef frankfurter before and after digestion, respectively; lanes 5 and 6,buffalo-
adulterated autoclaved (121 °C and 15 psi pressure for 2.5 h) beef frankfurter before
and after digestion, respectively; lanes 7 and 8, beef-adulterated raw buffalo frankfurter
before and after digestion, respectively; lanes 9 and 10, beef-adulterated boiled (98 °C
for 90 min) buffalo frankfurter before and after digestion, respectively; lanes 11 and
12, beef-adulterated autoclaved (121 °C and 15 psi pressure for 2.5 h) buffalo
frankfurter before and after digestion, respectively.
4.6.2 Authentication of Pork PCR Products of Raw Meat and Frankfurter by RFLP
Analysis
Simplex PCR products of pork Pocytb and PoND5 were digested individually with
CviKI-1 and FatI RE, respectively, because in silico studies demonstrated overlapping
fragments with beef and buffalo. Post digested PoND5 PCR product (73 bp) (Figure 4.26,
lane 1) produced 2 fragments of 52 and 21 bp (Figure 4.26, lane 2), and Pocytb PCR
product (146 bp) (lane 3) generated 3 fragments of 80, 45, and 21 bp (lane 4). Similar
products were found from boiled (98 °C for 90 min) and autoclaved (121 °C at 45 psi for
130 bp
87 bp 75 bp 50 bp
40 bp 45 bp
19 bp 15 bp
138 bp
106 bp 90 bp
120 bp
Page 182
158
2.5 h) pork frankfurters. The restriction digestion maps of different heat-treated (boiled
and autoclaved) samples were similar to those from the raw sample (Figure 4.27).
Figure 4.26: PCR-RFLP analysis of simplex PCR products of pork PoND5 and Pocytb
before and after restriction endonuclease digestion. In the gel image, lanes 1 and 2, PCR
products of PoND5 before and after digestion; lanes 3 and 4, products of Pocytb before
and after digestion, respectively. Corresponding electropherograms are indicated by
corresponding labels.
[FU]
0.8
1.0
0.4
0.0
0.6
0.2
15 50 200 100 300 400 600 [bp]
Lane 2
21 bp
52 bp
[FU]
0.8
1.0
0.4
0.0
0.6
0.2
15 50 200 100 300 400 600 [bp]
Lane 4
80 bp
45 bp
21 bp
15 bp
600 bp
73 bp 21 bp
146 bp
80 bp 45 bp
21 bp
52 bp
Page 183
159
Figure 4.27: RFLP analysis of pork PoND5 (lanes 1−6) and Pocytb (lanes 7−12) PCR
products before (lanes 1, 3, 5, 7, 9, and 11) and after (lanes 2, 4, 6, 8, 10, and 12)
restriction digestion. In the gel view, PCR products from raw (lanes 1, 2, 7, and 8),
boiled (lanes 3, 4, 9, and 10), and autoclaved (lanes 5, 6, 11, and 12) pork frankfurter;
lane M, DNA ladder.
4.7 Real-time PCR Assay
4.7.1 Multiplex Real-time PCR System
A singleplex qPCR system for each individual species was optimized one by one using
the respective primers and probes for each of the three target species and after that
additional species (primers and probes) were added sequen- tially one after another into
the reaction mixture to optimize the final tetraplex qPCR system. The Ct values of
tetraplex qPCR assay were Ct = 18.74 ± 0.04, 17.75 ± 0.06, 14.80 ± 0.05, and 15.14 ±
0.05 that nicely matched with the qPCR Ct for cow, buffalo, pig, and IAC, respectively,
effectively confirming that there were not any significant variation of Ct values when the
platforms were changed from single to multiplex (Figure 4.28).
73 bp 52 bp
21 bp
146 bp
80 bp
45 bp
21 bp
Page 184
160
Figure 4.28: Amplification plot of tetraplex qPCR for cow, buffalo, pig and endogenous
control. Color of curve indicates specific species; blue for cow, green for buffalo, red
for pig and pink for endogenous control.
4.7.2 Specificity of the Multiplex Real-time PCR System
The nucleic acid sequences of the designed primer sets and probes were screened with
NCBI database using online Basic Local Alignment Search Tool (BLAST) and the results
were found to have completely identical sequences with target species and sufficient
mismatch with other species. On the other hand, alignment of both primer sets and probes
sequences with 29 target and non-target species using MEGA5 software showed 100%
sequence similarity with target species and multiple nucleotide mismatches (3-18 nt in
primers and 3-25 nt in probes) with other related or non-target species (Table 4.2-4.7),
indicating that there were no or very little chances for amplifying a cross-species.
The experimental specificity of the tetraplex qPCR system was evaluated with 30 ng
of DNA extracted from fresh muscle tissues of three target species (cattle, buffalo, and
pig) and 25 nontarget species (lamb, goat, cat, dog, pigeon, chicken, quail, duck, rat,
Page 185
161
monkey, rabbit, donkey, tilapia, tuna, rohu, salmon, cod, pangas, turtle, frog, onion,
ginger, wheat, garlic, and pepper) on three different days in triplicate. The amplification
profile clearly demonstrated the species specific amplification curves as well as
background fluorescence for the relevant species in a 40 cycle PCR assay, confirming the
absence of any cross-amplifications (Figure 4.29). Additionally, the IAC that amplified
eukaryotic target from all species reflected that good quality DNA template was present
in all tubes (Figure 4.29). While the amplification signals (Ct values) of the tetraplex
qPCR assay for the target species were 18.84 ± 0.06, 17.86 ± 0.03, and 14.83 ± 0.08 for
cattle, buffalo, and pig, respectively, the non-target species did not yield any detectable
Ct during the 40 cycle PCR reaction (Table 4.18). On the other hand, Ct values of IAC
for all the target and nontarget species were 15.61−18.50 (Table 4.18), eliminating the
chances of any false positive detection.
Figure 4.29: Multiplex qPCR amplification plot for porcine (red), cattle (blue), and
buffalo (green) species along with the endogenous control for eukaryotes (sky blue)
against 25 species (below the threshold cycle).
Page 186
162
Table 4.18: Specificity/cross-reactivity tests of multiplex qPCR and endogenous
system.
Animal
species
tested
Multiplex real-time PCR
system Endogenous PCR system
Increase of
fluorescence
signal
Mean Ct
value
Increase of
fluorescence
signal
Mean Ct
value
Cow + 18.84±0.06 + 16.53±0.13
Buffalo + 17.86±0.03 + 15.80±0.15
Pig + 14.83±0.08 + 16.33±0.07
Sheep - - + 17.30±0.04
Goat - - + 17.51±0.13
Cat - - + 18.06±0.10
Dog - - + 17.82±0.08
Pigeon - - + 15.92±0.11
Chicken - - + 17.50±0.11
Quail - - + 17.81±0.06
Duck - - + 18.43±0.09
Rat - - + 16.94±0.08
Monkey - - + 15.66±0.13
Rabbit - - + 15.78±0.08
Donkey - - + 18.07±0.04
Tilapia - - + 17.45±0.13
Tuna - - + 17.16±0.10
Rohu - - + 16.59±0.12
Salmon - - + 16.43±0.09
Cod - - + 17.61±0.06
Panga - - + 18.46±0.13
Turtle - - + 16.69±0.15
Frog - - + 17.72±0.11
Onion - - + 18.07±0.14
Ginger - - + 16.03±0.05
Wheat - - + 17.33±0.08
Garlic - - + 17.75±0.14
Pepper - - + 15.37±0.12
Note: ‘+’ Positive PCR result (Ct value < 40) and ‘-’ no increase of the fluorescence
signal within 40 cycles.
4.7.3 Limit of Detection (LOD)
In this assay, the LOD of the tetraplex qPCR system was determined using 10-fold
serially diluted mixed genomic DNA (30−0.003 ng for each species) of the target species
(cow, buffalo, and pig). The amplification plots reflected detectable Ct from all
concentrations, starting from 30 ng to 0.003 ng of DNA, suggesting the assay could detect
Page 187
163
and quantify minimum 0.003 ng of target DNA in a 20 μL of reaction mixture (Figure
4.30 a – d). The Ct values and relative standard deviation (RSD) for all the dilutions are
shown in Table 4.19. RSD for all diluted DNA were less than 1.0 (0.1−0.94).
4.7.4 Quantification and Efficiency of the Tetraplex Quantitative PCR System
The quantitative detection was performed by generating separate standard curves for
each of three species and IAC by plotting the Ct values against the logarithmic value of
each DNA concentration (30 ng/μL that came from total genomic DNA extracted from
the ternary admixture of beef, buffalo, and pork mixed in a ratio of 1:1:1). The standard
curve for cow was in the range from 30 ng to 0.03 ng whereas that of buffalo, pig, and
IAC were from 30 ng to 0.003 ng (Figure 4.30 e−h). Four point dilutions (30−0.03 ng)
were used for the cattle quantification because a five point dilutions (30−0.003 ng) did
not comply with the recommended PCR efficiency (90−110%) (Ali et al., 2012a). In all
standard curves, a good linear regression were found for all measurements, wherein the
regression coefficient (R2) was 0.9847, 0.9996, 0.9999, and 0.9978 for cow, buffalo, pig,
and IAC, respectively, and the corresponding slopes were −3.1289, −3.1477, −3.4562,
and −3.2288. The PCR efficiencies (E) were calculated using the formula described in
methodology and were 108.73%, 107.82%, 94.68%, and 104.03% for cow, buffalo, pig,
and IAC, respectively. These values were within the recommended limit of qPCR
efficiency (90-110%) (Ali et al., 2012a).
Page 188
164
Figure 4.30: Amplification plots (a−d) and standard curves (e−h) of tetraplex qPCR
products obtained from 10-fold serially diluted mixed DNA of three target species.
Amplification plots and standard curves of (a and e) for beef, (b and f) for buffalo, (c
and g) for pork, and (d and h) for endogenous control (IAC) specific qPCR systems,
respectively.
(a) (e)
(f) (b)
(c) (g)
Page 189
165
Figure 4.30: Continued
(h) (e)
Page 190
16
6
Table 4.19: Ct values of each target species obtained from the amplification plot with a 10 fold serially diluted DNA of each target species for the
determination of LOD and generation of standard curves.
DNA
concentration
(ng)
Cow Buffalo Pig
Ct
value
Mean
Ct
value
SD RSD
(%)
Ct
value
Mean
Ct
value
SD RSD
(%)
Ct
value
Mean
Ct
value
SD RSD
(%)
10 18.244
18.267
18.454
18.32 0.115 0.63 17.419
17.391
17.415
17.41 0.015 0.09 14.375
14.334
14.354
14.35 0.020 0.14
1 21.781
21.752
21.756
21.76 0.015 0.07 20.554
20.533
20.578
20.56 0.022 0.11 17.886
17.867
17.781
17.84 0.055 0.31
0.1 25.243
25.289
25.364
25.30 0.061 0.24 23.970
24.053
23.999
24.01 0.042 0.18 21.769
21.688
21.781
21.75 0.050 0.23
0.01 28.155
28.158
28.155
28.16 0.002 0.01 27.150
27.116
27.184
27.15 0.034 0.13 25.068
25.192
25.208
25.16 0.076 0.30
0.001 29.215
29.182
29.287
29.23 0.054 0.18 30.153
30.303
30.428
30.29 0.137 0.45 27.957
28.264
28.488
28.24 2.66 0.94
Note: SD, standard deviation; RSD, relative standard deviation.
Page 191
167
4.7.5 Sensitivity and Validity of the Tetraplex qPCR Assay under Ternary and
Commercial Matrixes
The The sensitivity of the developed tetraplex qPCR assay was tested to detect the
level of beef, buffalo, and pork in deliberately adulterated model ternary meat admixtures
(section 3.8.6) and all the species were detected until 0.1% adulteration in the ternary
admixes. The Ct values of lower detectable quantity (0.1%) were 25.19 ± 0.23 to 27.68 ±
1.47 for all the three target species (Table 4.20), but the IAC constantly yielded a mean
Ct between 15.63 ± 0.11 and 16.83 ± 0.21 for all level of adulterations, reflecting that the
endogenous target did not change significantly with a variation in adulterations because
all adulterants were eukaryotic. The inter day relative standard deviations (RSDs) were
calculated from the mean Ct values of the different spiked level model meat products and
were found between 0.06 and 1.2%. Only seven samples produced RSDs ≥ 1.0%, but the
other 47 out of the 54 samples yielded RSDs < 1.0% (Table 4.20). These clearly
demonstrated that the developed tetraplex qPCR system was very sensitive, specific, and
robust and can reliably detect all the three targets from 0.1% contaminated specimens.
The tetraplex qPCR system was further validated for the analyses of processed meat
products (frankfurters and meat- balls). The analysis results (Table 4.21) of the three
target species revealed that the target recoveries from 10% to 0.1% spiked level were
85.90−115.3% along with a systematic error between −14.10 and +15.3% and RSD
0.61−19.40%. Thus, the maximum recovery was 115.3% for the 10% spiked pork in
buffalo meatball and minimum was 85.90% for the 10% spiked beef in pork meatball
product, respectively. On the other hand, maximum RSD was found in buffalo frankfurter
containing 0.1% pork adulteration and minimum RSD was found in 1% adulterated pork
frankfurter. When a graph was generated by plotting the recovered values (y-axis) (Table
4.21) against the reference (actual) values (x-axis) for each target, a very high correlation
Page 192
168
coefficient (R2 = 0.9999) was attained (Figure 4.31), confirming that the experimental
values were fairly close to their actual values.
Figure 4.31: Relationship between the experimental and reference values of the
tetraplex qPCR system. The experimental quantity (mean value) obtained from the
tetraplex qPCR assay for adulterated (0.1, 1 and 10 %) model frankfurter and meatball
of three target species plotted against the reference values that were used in their
laboratory preparation.
Page 193
16
9
Table 4.20: Mean Ct values and inter day RSD of different model meat products.
Products Spike level (%) Species Mean Ct value
SD RSD (%) Day 1 Day 2 Day 3
Beef frankfurter
10 Beef 19.443 19.372 19.507 0.067 0.35
Buffalo 20.805 20.992 21.142 0.168 0.80
Pork 18.318 18.170 17.952 0.184 1.01
1 Beef 19.180 19.152 19.124 0.028 0.15
Buffalo 24.548 24.435 24.092 0.237 0.97
Pork 21.546 21.705 21.736 0.101 0.47
0.1 Beef 19.184 19.083 19.167 0.054 0.28
Buffalo 27.583 27.240 27.315 0.180 0.66
Pork 25.396 25.362 25.258 0.071 0.28
Buffalo frankfurter
10 Buffalo 18.291 18.221 18.285 0.038 0.21
Beef 22.357 21.964 22.129 0.197 0.89
Pork 17.856 18.242 18.135 0.199 1.10
1 Buffalo 17.977 18.018 18.022 0.024 0.14
Beef 25.536 25.207 25.116 0.221 0.87
Pork 21.470 21.788 21.989 0.261 1.20
0.1 Buffalo 17.926 17.988 17.946 0.031 0.18
Beef 28.245 28.289 28.749 0.279 0.98
Pork 24.947 25.469 25.379 0.279 1.10
Pork frankfurter
10 Pork 15.036 15.120 15.002 0.060 0.40
Beef 22.096 22.407 22.425 0.185 0.83
Buffalo 21.325 21.193 20.929 0.201 0.95
1 Pork 14.800 14.806 14.788 0.009 0.06
Beef 25.210 25.579 25.257 0.200 0.79
Buffalo 24.114 24.293 24.495 0.190 0.78
0.1 Pork 14.737 14.811 14.793 0.038 0.26
Beef 28.474 28.611 28.796 0.161 0.56
Buffalo 27.092 27.180 27.491 0.209 0.77
Page 194
17
0
Note: SD, standard deviation; RSD, relative standard deviation.
Table 4.20: Continued.
Products Spike level (%) Species Mean Ct value
SD RSD (%) Day 1 Day 2 Day 3
Beef meatball
10 Beef 19.403 19.483 19.476 0.044 0.23
Buffalo 21.092 21.199 21.303 0.105 0.50
Pork 18.311 18.080 18.398 0.164 0.90
1 Beef 19.190 19.202 19.090 0.061 0.32
Buffalo 23.957 24.416 24.111 0.233 0.97
Pork 21.702 21.539 21.688 0.090 0.42
0.1 Beef 19.167 19.203 19.179 0.018 0.10
Buffalo 27.070 27.595 27.214 0.271 0.99
Pork 25.227 25.379 25.148 0.117 0.46
Buffalo meatball
10 Buffalo 18.177 18.203 18.314 0.072 0.40
Beef 22.159 22.588 22.516 0.229 1.02
Pork 17.991 17.807 18.198 0.195 1.09
1 Buffalo 17.939 18.015 17.971 0.038 0.21
Beef 25.113 25.479 25.207 0.190 0.75
Pork 21.857 21.553 21.760 0.155 0.71
0.1 Buffalo 17.903 18.014 18.003 0.061 0.34
Beef 28.486 28.780 28.686 0.150 0.52
Pork 25.161 24.698 24.881 0.233 0.94
Pork meatball
10 Pork 15.021 15.063 15.154 0.068 0.45
Beef 22.626 22.404 22.407 0.127 0.57
Buffalo 20.807 21.060 21.231 0.213 1.01
1 Pork 14.784 14.712 14.701 0.045 0.31
Beef 25.342 25.658 25.548 0.160 0.63
Buffalo 24.309 24.092 24.290 0.120 0.50
0.1 Pork 14.762 14.679 14.778 0.053 0.36
Beef 28.715 28.214 28.314 0.265 0.93
Buffalo 27.227 27.595 27.136 0.243 0.89
Page 195
17
1
Table 4.21: Reproducibility and recovery of the target species in model meat products.
Products Spike level
(%) Species
Content of target determined (%) RSD
(%)
Recovery
(%)
Systematic
error (%) Day 1 Day 2 Day 3 Mean Beef
frankfurter
10 Beef 80.01 84.31 76.33 80.21 4.98 100.26 0.26
Buffalo 12.51 10.91 9.76 11.06 12.49 110.60 10.60
Pork 9.27 10.23 11.83 10.44 12.38 104.40 4.40
1 Beef 97.09 99.12 101.2 99.13 2.07 101.15 1.15
Buffalo 0.809 0.879 1.129 0.939 17.92 93.90 -6.10
Pork 1.079 0.971 0.951 1.00 6.88 100.00 0.00
0.1 Beef 96.81 104.3 98.03 99.71 4.03 99.90 -0.10
Buffalo 0.088 0.113 0.107 0.103 12.71 103.00 3.00
Pork 0.083 0.085 0.091 0.086 4.82 91.00 -9.00
Buffalo
frankfurter
10 Buffalo 78.69 82.82 79.03 80.18 2.86 100.22 0.22
Beef 9.37 12.52 11.09 10.99 14.35 109.90 9.90
Pork 12.61 9.750 10.47 10.94 13.59 109.40 9.40
1 Buffalo 99.00 96.08 95.80 96.96 1.83 98.93 -1.07
Beef 0.903 1.151 1.231 1.095 15.62 109.50 9.50
Pork 1.135 0.918 0.803 0.952 17.71 95.20 -4.80
0.1 Buffalo 102.8 98.21 101.3 100.77 2.32 100.97 0.97
Beef 0.123 0.119 0.085 0.109 19.16 109.00 9.00
Pork 0.112 0.079 0.084 0.092 19.40 92.00 -8.00
Pork
frankfurter
10 Pork 82.53 78.04 84.42 81.66 4.01 102.07 2.07
Beef 11.36 9.03 8.92 9.77 14.11 97.70 -2.30
Buffalo 8.55 9.42 11.42 9.79 15.02 97.90 -2.10
1 Pork 96.58 96.20 97.36 96.71 0.61 98.68 -1.32
Beef 1.148 0.875 1.109 1.04 14.14 104.00 4.00
Buffalo 1.112 0.975 0.841 0.976 13.88 97.60 -2.40
0.1 Pork 100.7 95.88 97.03 97.87 2.57 98.06 -1.94
Beef 0.104 0.094 0.082 0.093 11.80 93.00 -7.00
Buffalo 0.126 0.118 0.094 0.113 14.78 113.00 13.00
Page 196
17
2
Note: RSD, relative standard deviation.
Table 4.21: Continued.
Products Spike level
(%) Species
Content of target determined (%) RSD
(%)
Recovery
(%)
Systematic
error (%) Day 1 Day 2 Day 3 Mean Beef
meatball
10 Beef 82.40 77.69 78.09 79.39 3.29 99.23 -0.77
Buffalo 10.14 9.38 8.69 9.40 7.71 94.00 -6.00
Pork 9.311 10.86 8.788 9.65 11.16 96.50 -3.50
1 Beef 96.39 95.54 103.75 98.56 4.58 100.57 0.57
Buffalo 1.247 0.891 1.114 1.08 16.59 108.00 8.00
Pork 0.973 1.084 0.982 1.013 6.09 101.30 1.30
0.1 Beef 98.03 95.47 97.17 96.89 1.34 97.08 -2.92
Buffalo 0.128 0.087 0.115 0.11 19.05 110.00 10.00
Pork 0.093 0.084 0.098 0.092 7.74 92.00 -8.00
Buffalo
meatball
10 Buffalo 85.53 83.92 77.37 82.27 5.25 102.83 2.83
Beef 10.84 7.91 8.33 9.03 17.55 90.30 -9.70
Pork 11.52 13.03 10.04 11.53 12.97 115.30 15.30
1 Buffalo 101.8 96.29 99.44 99.17 2.79 101.19 1.19
Beef 1.233 0.942 1.151 1.11 13.53 111.00 11.0
Pork 0.877 1.074 0.936 0.962 10.51 96.20 3.80
0.1 Buffalo 104.5 96.36 97.14 99.33 4.52 99.52 -0.48
Beef 0.103 0.083 0.089 0.092 11.20 92.00 -8.00
Pork 0.097 0.132 0.117 0.115 15.22 115.00 15.00
Pork
meatball
10 Pork 83.36 81.06 76.29 80.23 4.49 100.28 0.28
Beef 7.690 9.054 9.034 8.59 9.10 85.90 -14.10
Buffalo 12.49 10.38 9.159 10.67 15.78 106.70 6.70
1 Pork 97.62 102.4 103.2 101.07 2.99 103.13 3.13
Beef 1.042 0.826 0.895 0.92 11.98 92.00 -8.00
Buffalo 0.964 1.129 0.977 1.02 8.96 102.00 2.00
0.1 Pork 99.06 104.7 98.00 100.58 3.58 100.78 0.78
Beef 0.087 0.126 0.117 0.110 18.56 110.00 10.00
Buffalo 0.114 0.087 0.122 0.108 17.03 108.00 8.00
Page 197
173
4.7.5.1 Residual Analysis
Graph of residual verses fitted recovery values of variables for both frankfurters and
meatballs of three target species (bovine, buffalo and porcine) were generated (Figure
4.32 (a-f). The random distribution of all variables were very low (within +1 to -1.5 from
zero line) for beef meatballs, whereas they were relatively higher (within ± 3.0 from zero
line) for beef and buffalo frankfurters as well as buffalo meatballs. On the other hand,
they were within ± 2.0 for buffalo frankfurters.
Figure 4.32: Graph of residual verses fitted recovery values of the tetraplex qPCR
assays the variablely adulterated (0.1, 1 and 10%) frankfurters and meatballs of beef (a
and b), buffalo (c and d) and pork (e and f), respectively.
(a) (b)
(c) (d)
(e) (f)
Page 198
174
4.7.6 Analysis of Commercial Meat Products by mqPCR
Very popular meat products namely hotdogs, meatballs and burgers were purchased
from various Malaysian outlets and were analyzed using the mqPCR assay. The total
analyzed products were 12 frankfurter (7 beef and 5 pork), 12 meatball (7 beef and 5
pork) and 12 burger (7 beef and 5 pork) and the results were listed in Table 4.22. The
experimental results demonstrated that 71% of beef frankfurter, 100% of beef meatballs
and 85% of beef burgers were adulterated with buffalo meat but no porcine DNA was
found in beef products. However, all adulterated samples were found to contain both beef
and buffalo but no meat products were found to contain 100% buffalo. On the other hand,
all pork products were found to contain only pork and no contamination with beef and
buffalo.
Page 199
175
Table 4.22: Screening of model and commercial meat products using the developed
tetraplex qPCR assay.
Sample
Adulteration Detected species PCR
accuracy
(%) species % Cattle Buffalo pig
Model frankfurter
Beef Buffalo and Pig 10.0 3/3 3/3 3/3 100
Beef Buffalo and Pig 1.0 3/3 3/3 3/3 100
Beef Buffalo and Pig 0.1 3/3 3/3 3/3 100
Buffalo Cow and Pig 10.0 3/3 3/3 3/3 100
Buffalo Cow and Pig 1.0 3/3 3/3 3/3 100
Buffalo Cow and Pig 0.1 3/3 3/3 3/3 100
Pork Cow and
Buffalo 10.0 3/3 3/3 3/3 100
Pork Cow and
Buffalo 1.0 3/3 3/3 3/3 100
Pork Cow and
Buffalo 0.1 3/3 3/3 3/3 100
Model meatball
Beef Buffalo and Pig 10.0 3/3 3/3 3/3 100
Beef Buffalo and Pig 1.0 3/3 3/3 3/3 100
Beef Buffalo and Pig 0.1 3/3 3/3 3/3 100
Buffalo Cow and Pig 10.0 3/3 3/3 3/3 100
Buffalo Cow and Pig 1.0 3/3 3/3 3/3 100
Buffalo Cow and Pig 0.1 3/3 3/3 3/3 100
Pork Cow and
Buffalo 10.0 3/3 3/3 3/3 100
Pork Cow and
Buffalo 1.0 3/3 3/3 3/3 100
Pork Cow and
Buffalo 0.1 3/3 3/3 3/3 100
Commercial products
Beef
frankfurter - - 7/7 5/7 0/7 100
Pork
frankfurter - - 0/5 0/5 5/5 100
Beef
meatball - - 7/7 7/7 0/7 100
Pork
meatball - - 0/5 0/5 5/5 100
Beef
burger - - 7/7 6/7 0/7 100
Pork
burger - - 0/5 0/5 5/5 100
Page 200
176
DISCUSSION
5.1 DNA Extraction
The yield of extracted total genomic DNA depends on quantity and quality of starting
materials, state of samples (raw, processed, heat or chemical treated etc.), extraction kit
and protocol. To get good quality DNA, I used three different types of commercial DNA
extraction kit for the extraction of total DNA from three different samples such as pure
meat, meat products (burger, meatball and frankfurters) and plant species. Because
specific type of kit was designed for specific sample depending on the presence of
proteins, ingredients etc. Furthermore, commercial DNA extraction kits offered higher
yields of DNA than the conventional liquid-liquid extraction techniques due to the present
of aqueous and organic phases of in this system. Moreover, commercial kits were safer
for handling and there is minimal chance of damage of DNA during extraction (Al Amin,
2015).
The Genomic DNA Mini Kit was designed for the purification of total DNA, including
mitochondrial DNA and genomic DNA from different animal tissues. To shorten the cell
lysis time, the kit was combined with micropestle which facilitated the disintegration of
homogenized tissue specimens efficiently. Proteinase K and lysis buffer were used to
perform cell lysis and degradation of protein to eliminate contamination of proteins. The
use of chaotropic salt enhanced the stable DNA binding to the spin column glass fiber
matrix. Effective wash buffer was used to remove any contamination and finally, DNA
was eluted using low salt containing TE buffer which facilitated the stabilization of
storage DNA PH (Rashid, 2015).
The concentration of extracted DNA was determined based on the absorbance reading
at 260 nm and its purity was evaluated based on the ratio of absorbance at 260 nm and
Page 201
177
280 nm. This is because 260 nm is the absorbance maxima of nucleic acids and that at
280 nm reflects the absorbance maxima of proteins. Finally, the A260/A280 ratio provides
the DNA purity indication with respect to the protein contamination.
I found the highest DNA yield in raw meat (123-269 ng/µl) and lowest in severely
microwaved (700 W) samples (32-54 ng/µl) (Table 4.1). This might be due to the higher
degree of denaturation and degradation of the DNA under extensive heat treatment (Ali
et al., et al., 2015b). Similarly, second lowest DNA yield was obtained from the
autoclaved samples (53-84 ng/µl for raw meat and 33-62 ng/µl for meat products), as
prolonged heat and pressure are applied under autoclaved condition. The DNA
concentration from the boiled treated samples were found relatively higher (71-125 ng/µl
for raw meat and 49-91 ng/µl for meat products) than those of the microwaved and
autoclaved treated samples, this might be less due to the degradation and denaturation
under relatively mild heat treatment. On the other hand, the purity and the yield of DNA
was comparatively higher in all pure meat samples (raw, boiled and autoclaved) than
those of the meat products (raw, boiled and autoclaved); this might be due to the presence
of higher amount of fat and food ingredients including salt, spices, vegetables and other
food additives in the commercial meat products (Table 4.1). The absorbance ratio at
A260/A280 was between 1.7 and 2.0 for all extracted DNA. Herein, the absorbance ratio
at A260/A280 was between 1.8 and 2.0 for all untreated raw samples but that was between
1.7 and 2.0 for only meat products and heat treated samples. This is because some
inhibitors might be present in meat products. This ensured that good quality DNA was
extracted from all samples and it was suitable for PCR amplification (Nejad et al., 2014).
5.2 Development of Biomarker
The motivation of adulteration comes from a company's interest in making an on
growing profit by selling a cheaper item in the name of its expensive counterparts. It
Page 202
178
incurs a serious risk especially when an animal material is involved. According to the US
Department of Agriculture, about 75% of the recently emerging infectious diseases
affecting humans are the diseases of the animal origins (USDA, 2015). Certain animal
materials such as bovine and porcine are also sensitive social and religious issues. Overall
food falsification is a crime under the food and drug laws in most countries and its
prevention is a long cherished hope. In this regards, authentication technologies play a
key role by verifying the food ingredients prior to the enforcement of regulatory laws.
The key purpose is not to punish the violators but to prevent the practices at its origin for
the greater societal and health benefits. The adulteration of beef products with buffalo
and buffalo with beef in many cases are unreported, especially when societal issues are
not dominant such as in Malaysia. However, it is a matter of economic cheating and also
it involves certain degree of health risk and socio-cultural outburst depending on the place
and availability (Girish et al., 2013; Karabasanavar et al., 2011a, Sakaridis et al., 2013).
It might also take innocent lives under special circumstances, such the killing of a man in
India (Matthew, 2015). Considering the needs, I developed here six pairs of species-
specific primers targeting the interspecies hyper variable and intra-species conserved
regions of cytb and ND5 genes of beef, buffalo and pork (Table 3.1). The mitochondrial
DNAs (mtDNA) are more focused over the nuclear ones (nDNA) for authentication
studies because of its maternal origins, extra protection by mitochondrial membrane and
abundance in multiple copies (Girish et al., 2004; Zha et al., 2010). In this study,
additional security was ensured by targeting two different sites on two different
mitochondrial genes since it is unlikely that both targets would be missing under
compromised states. Additionally, all targets were kept within 146 bp in length since
short-targets are thermodynamically more stable over the longer (Ali et al., 2015b). The
designed two sets of primers for each of cow, buffalo and pig amplified short-length PCR
products which were between 73 and 146 bp (Cocytb:120 bp, CoND5:106 bp, Bucytb:90
Page 203
179
bp, BuND5:138 bp, Pocytb: 146 bp and PoND5: 73 bp). Biomarker targets within this
range were suitable for efficient amplification and stable under extreme food processing
conditions. Overall, this ensured better efficiency and accuracy of the assay to detect
targets even in degraded samples (Ali et al., 2015b, Ali et al., 2015d). The success of an
mPCR assay mainly depends on primer specificity and melting temperature (Tm) (Ali et
al., 2015d). This is because all primers must anneal to their respective binding regions
under the same set of PCR condition. In the design of species- specific primer, the
oligonucleotide mismatch calculation plays critical roles since the efficiency of a PCR
assay may reduce or amplification reaction may fail due to the presence of a critical
mismatch in the primer binding site (Rashid, 2015a). In the present study, the developed
six primer sets contained 100% matching with specific gene targets and (3-18)
nucleotides (12.5-78%) mismatching with other related or non-target species, reflecting
there is no probability of cross-reaction even with closely related species during PCR
assays. Because the presence of single mismatch at the primer binding position might be
effective to failure the PCR amplification (Rashid et al., 2015b). Furthermore, identical
Tm (~ 600 C (57.8-60.90 C)) of all primers confirms that all primers would anneal only
with the target template and there is very little or no possibility to anneal with any others
non-target species (Table 3.1) (Razzak et al., 2015). The pairwise distances among 25
animals and 4 plant species was between 0.144 and 1.993 (Table 4.8-4.13) which was
computed using the neighbour-joining method. The minimum distance was found
between the beef cytb-specific 120 bp site and goat (0.144) (Table 4.8) and the maximum
was between the beef ND5-specific 106 bp site and wheat (1.993) (Table 4.9), reflecting
adequate genetic distances among the studied species. Moreover, the analysis of
phylogenetic tree (Figure 4.1, a-f) based on genome sequences demonstrated similar
findings, supporting the results of other in silico tests. In addition, the 3D plot was created
from the data of mismatch of primer pairs and pairwise distance, which also support the
Page 204
180
adequate genetic distance among the targets and non-target species (Figure 4.2, a-f). Thus
bioinformatics studies ensured that there were no or very little chances for amplifying a
cross-species target (Ali, et al., 2014a). To confirm the theoretical finding, PCR
experiments were carried out against 27 non-target species.
5.3 PCR Assay Optimization
Optimization of the PCR reaction is a vital step to get successful PCR products. I
optimized simplex PCR assay first and then duplex, triplex, tetraplex and finally
hexaplex. Various components the reaction were optimized step by step. First thing
considered was the reaction volume; the higher reaction volume causes higher cost but
very low volume might be insufficient for the amplification of primers, particularly for
the multiplex PCR assay. Therefore, I optimized in 25 μL reaction volume which was
cost effective but sufficient for a multiplex PCR reaction. Buffer concentration is also
important in PCR reaction. The cations of buffer neutralize the negative charged of the
phosphate group of DNA template which decreases the electrorepulsive forces of between
the DNA stands. As a result primer can come into contact with DNA strands easily that
facilitates the annealing between them. By following the supplier instruction I used 1x
buffer concentration for successful reaction. Magnesium chloride plays a critical role for
success PCR amplification
Mg2+ is said to be a cofactor of the polymerase enzyme because it forms soluble
complexes with deoxynucleoside triphosphates (dNTPs) to prepare a recognizable
substrate for Polymerase. Therefore, Mg2+may affect DNA polymerase activity and
fidelity, specificity of PCR, denaturation temperatures of both template and PCR product
DNA strand, annealing of primer and formation of primer dimer. Excess Mg2+ leads to
nonspecific amplification due to nonspecific primer annealing, while inadequate
magnesium results in decreased the yield of the expected amplified product. Thus, for
Page 205
181
optimum activity, polymerase enzyme requires sufficient free magnesium other than that
of bound with dNTP and template DNA (Markoulatos, Siafakas, & Moncany, 2002).
Several experiments were repeated by changing the MgCl2 concentration and finally
optimized 2.5 mM concentration for simplex, duplex and triplex reactions and 3.5 and 4.0
mM were used tetraplex and hexaplex reaction. On the other hand, two different
concentration (0.20 mM for simplex to tetraplex and 0.25 mM for multiplex) of the
dNTPs (dATP, dCTP, dGTP and dTTP) were used to optimize the simplex to multiplex
reactions. Because, concentration of dNTPs may affect the specificity, fidelity and yield
of a PCR amplification, because concentration of free Mg2+ is affected by the amount of
dNTPs. Hence Mg2+ binds with dNTPs. DNA polymerase fidelity reduce due to the
imbalance amount of four dNTPs (Kunz & Kohalmi, 1991), whereas, excess dNTPs may
result in inhibition of amplification due to increase error rate of polymerase (Kramer &
Coen, 2001). Another important parameter determined experimentally was annealing
temperature (Ta). The highest annealing temperature is favorable because it increased
specificity by reducing non-specific binding of primers (Ali 2012c; Wu et al., 2009). Tm
of all primers should be same in multiplex PCR assay because all primers are amplified
in a single reaction tube with same conditions. Although Tm values of the developed six
sets of primers were different (57.8-60.90 C) but all primers sets were able to amplify at
same temperature (600 C), resulting the favorable for the development of mPCR assay
(Figure 4.3-4.5).
After optimization the simplex PCR, two duplex PCR for Cocytb and Bucytb and
CoND5 and BuND5; one triplex of Cocytb, CoND5 and BuND5; one tetraplex of Cocytb,
Bucytb, CoND5 and BuND5 and finally multiplex (hexaplex) PCR of Pocytb, Cocytb,
Bucytb, CoND5, BuND5 and PoND5 were optimized step by step to eliminate the
possibility of forming any unwanted primer dimers or multimers (Figure 4.12 and 4.18)
(Ali et al., 2015d). The novel double genes targeted mPCR system clearly amplified
Page 206
182
targeted products [106, 138, and 73 bp (ND5 of beef, buffalo, and pork) and 120, 90, and
146 bp (cytb of beef, buffalo, and pork)]. Due to the narrow differences in the length of
the targets, agarose gel electrophoresis, which hardly separate nucleic acid of less than 50
bp difference in length, could not be used to separate the amplicons for visualization
(Bottero & Dalmasso, 2011). It is also a laborious technique and require rather longer
separation time. Consequently, I used here a fully automated multi-capillary
electrophoresis device (QIAxcel Advanced Capillary Electrophoresis System, Germany)
for the separation and visualization of PCR products. This effectively enhanced
sensitivity and resolution (~5 bp) and shortened analysis time, minimizing the manual
handling errors and exposure to hazardous chemicals by virtue of its in-built gel matrices
in a ready- to-run gel cartridge (Bottero & Dalmasso, 2011; Fajardo et al., 2010). The
well separated tetraplex and mPCR products were clearly visualized in the gel image
along with the electropherograms (Figure 4.12 and 4.18) for all of six targets.
5.4 PCR Assay Specificity
In the initial step of simplex PCR assay specificity test, beef primer sets (Cocytb and
CoND5) were assayed against buffalo and pork DNA, buffalo primer sets (Bucytb and
BuND5) with beef and pork DNA, and pork primer sets (Pocytb and PoND5) with beef
and buffalo DNA as non-target to avoid cross-amplification in multiplex PCR. The next
step was the cross-specificity which was performed with 27 different non-target species
using 20 ng of DNA extracted from all of the tested samples. Specific PCR products [106,
138, and 73 bp (ND5 of beef, buffalo, and pork) and 120, 90, and 146 bp (cytb of beef,
buffalo, and pork)] were found only from beef, buffalo, and pork, and such a product was
absent from the other samples (goat, lamb, dog, cat, rabbit, monkey, donkey, chicken,
duck, pigeon, quail, rat, salmon, tuna, cod, tilapia, rohu, pangas, frog, turtle, wheat, onion,
garlic, ginger, and pepper). On the other hand, the use of the universal eukaryotic primers
which amplified 99 bp product from all species reflected the presence of good quality
Page 207
183
DNA in all tubes, eliminating the possibility of any false-negative detection (Figure 4.6-
4.11).
After confirmation of the simplex PCR, the mPCR system was developed step by step
through the duplex, triplex, and tetraplex and hexaplex (multiplex) PCR systems and
cross-specificity test of the developed tetraplex and mPCR assays were performed. The
developed tetraplex and mPCR system clearly amplified targeted products (73, 90, 106,
120, 138, and 146 bp) from beef, buffalo, and pork samples, and no cross-amplifications
were observed in any non-target species (Figure 4.13 and 4.19), confirming that the
developed tetraplex and mPCR assay was highly specific for the discriminatory detection
of beef, buffalo, and pork. Triplicate assays were performed on three different days and
reproducible results were obtained.
5.5 PCR Product Sequence Analysis
Although a properly designed and optimized species-specific PCR assays are often
conclusive to assign specific species (Ali et al., 2015d; Karabasanavar et al., 2014) but
authentication of PCR products by sequence analysis greatly increase the reliability of the
PCR assay. Moreover, PCR products indicate only the presence or absence of the species
but PCR products sequencing results properly confirm whether the accurate species are
detected (Bevan, Rapley, & Walker, 1992). The PCR products obtained in this research
were cloned prior to sequencing because they were very short-length and direct
sequencing cannot derive the full length sequence of the products. The PCR products
sequencing results showed that all PCR products were 100% similar with the target
sequences of the specific species but the buffalo ND5 gene (Table 4.14) that showed
98.5% similarity but this value was within the acceptable limit because at least 98%
sequence similarity is required for the potential species identification (Cawthorn et al.,
2013). Previously, Cawthorn et al. (2013) reported that 99% sequence similarity for three
Page 208
184
tested samples (one ‘blesbok biltong’ and two ‘kudu biltong’). On the other hand,
Natonek-Wisniewska et al. (2013) found 97.78% sequence similarity for bovine specific
PCR products, whereas ovine specific products showed more than 94% similarity with
ovis species and incase of porcine products it was more than 99% similar. Hsieh et al.,
(2005) also found a sequence similarity of 98 -100% for various samples. Thus, little
variation in sequence similarity is a common phenomenon.
5.6 Tetraplex PCR Assay
5.6.1 LOD of Tetraplex PCR Assay
In this study, dilution method (Ali et al., 2015d) was followed to determine the
sensitivity of the developed multiplex PCR system. At first, the concentration of the
starting DNA was spectrophotometrically determined in triplicates at a relatively high
concentration (50 ng/μL) and then sequentially diluted into 10.0, 5.0, 1.0, 0.5, 0.2, 0.1,
0.05, 0.02 and 0.01 ng/μL by adding required amount of deionized distilled water since
spectrophotometry provides inconsistent data at lower concentration. Both the gel images
(Figure 4.14 a) and electropherograms (Figure 4.14(b)) of the corresponding multiplex
PCR products were observed from as low as 0.01 ng of DNA extracted from raw meat.
After 0.01 ng, both the gel images and electropherograms became very fainted or
undetectable and thus the limit of detection (LOD) of the assay was determined to be 0.01
ng total DNA extracted from raw meat. This relatively high sensitivity was attributed to
the short-length amplicon (< 140 bp) targets used in this multiple PCR system (Ali et al.,
2015a). This result was consistent with the previous work done in our laboratory (Ali et
al., 2015b) where the LOD was 0.01 ng total DNA from pig, dog, monkey, cat and rat in
a multiplex PCR with 108 – 172 bp product sizes. Safdar & Junejo, (2015) also obtained
similar result (0.01%) for a multiplex PCR of ovine (119 bp), caprine (142 bp), fish (224
bp) and bovine (271 bp). In another report, LOD was found to be 0.125 ng by Bottero et
al. (2003) for the identification of cow, goat and sheep in a multiplex PCR of product-
Page 209
185
size 172 – 326 bp. On the other hand, Dalmasso et al. (2004) found 0.0025 – 0.025 ng
LOD for Ruminant (Bos taurus, Capra hircus, Ovis aries) poultry, fish and pork species
with 104 -290 bp target amplicons. Furthermore, Rea et al. (2001) developed duplex PCR
for the detection of bovine and water buffalo milk used in making mozzarella cheese with
113 and 152 bp products and sensitivity was 0.001 ng DNA. The same primers of Rea et
al. (2001) were used by Gupta et al, (2012) in a duplex PCR for the detection of beef and
buffalo meat and similar result (0.001 ng) was obtained. Although the sensitivity of
duplex PCR was found to be 0.001 ng, no multiplex PCR with double gene-targets has
been documented for beef and buffalo meat differentiation under raw and processed
states.
5.6.2 Sensitivity test of Tetraplex PCR Assay under Binary Meat Admixture
The sensitivity of multiplex PCR depends on several factors, namely target species,
target gens and amplicon size (Ali et al., 2014b). In pure meat adulteration studies, the
developed multiplex PCR was able to detect all targeted gene-sites (cytb and ND5) of
beef and buffalo from as low as 1% of binary admixture (Figure 4.15). The bands of both
adulterated buffalo (lanes 2 (1% buffalo meat adulteration with beef)) and beef (lanes 10
(1% beef adulteration with buffalo meat)) (Figure 4.13 a) were very clear and the
corresponding electroferograms also demonstrated them with good resolution (Figure
4.13b). From this observation, I concluded that the developed multiplex PCR technique
is able to identify less than 1% (w/w) adulterated target meat under mixed matrices (Hou
et al., 2015). The detection limit of duplex PCR as documented by Rea et al., (2001) for
beef and buffalo species in admix milk was up to 1%. Mane et al. (2012a and 2012b)
also found 1% sensitivity of both beef and buffalo target species in simplex PCR system.
Similar result (1%) was presented by Hou et al. (2015) in a mixture of three different
target species (chicken, duck and goose).
Page 210
186
5.6.3 Stability of Tetraplex PCR Assay
Extremely heat or processing treatment refer to breakdown or degradation of DNA in
food products due to mechanical forces or natural decomposition (Arslan et al., 2006;
Ilhak & Arslan, 2007). To study the effect of different heat treatment on target DNA
breakdown pure, deliberately adulterated and commercial burgers were studied after 2.5
h autoclaving under 15-psi pressure, and raw meats were studied after 45 min of boiling,
2.5 h autoclaving under 15-psi pressure and 30 min of microwaving at 500, 600 and
700W. Boiling is the widely used traditional cooking process and a modern rapid food
heating technique is microwaving. Whereas, autoclaving method is used to mimic
canning and steaming process as it is applied to destroy the potential microorganisms at
high pressure and temperature (~3000 C) (Todar, 2008).
PCR products of desired targets were obtained from as low as 1% adulterated burger
samples under 2.5 h autoclaving conditions (Figure 4.16). The finding was consistent with
earlier studies for other species (Ali et al., 2015d). Figure 4.17 clearly shown that
developed tetraplex assay successfully amplified the extracted DNA from all the thermal
treated specimens including microwaving at 700W for 30 min. Microwaving at 700W is
extreme heat treatment, the samples treated above 700 W for 30 min became burnt, dried
out and thus not suitable for intake (Rashid, 2015a). This reflected that the tetraplex PCR
technique I developed here were very stable even in degraded samples when exposed to
harsh cooking conditions. Earlier studies in our laboratory, demonstrated that shorter-
length PCR targets are more stable than those of longer ones (Ali et al., 2015b, Ali et al.,
2015c). Thus we attributed this higher stability to the less than 140 bp length of all targets
used in the multiplex PCR system. Additionally, I used here two different targets from
two different mitochondrial genes (cytb and ND5) to overcome the probability of any
false negative detection due to breakdown of a single gene target. It is highly unlikely that
both gene sites would be lost or remain undetected due to degradation by natural
Page 211
187
decomposition or processing treatments. To ensure the accuracy of the method, I screened
here model and commercial burgers deliberately adulterated with beef and buffalo as well
as beef curries purchased from various Malaysian outlets. 5 x 9 number of beef burgers
were studied and none of them were found buffalo positive. On the other hand, out of
seven beef curry samples, five were detected as buffalo positive. I did not find any buffalo
burgers or buffalo curries in commercial markets or restaurants sold in the name of
buffalo. However, a significant level (>70%) of buffalo adulteration was found in beef
curries (Table 4.15). While the consumption of both buffalo and beef are allowed in
Malaysia, beef price in commercial market is almost two times of buffalo meat. Thus
buffalo adulteration in beef curries was for economic gain.
5.7 Multiplex PCR Assay
5.7.1 Limit of Detection of Multiplex PCR Assay
To check the sensitivity of the mPCR assay, DNA template of all target species was
serially diluted from higher to lower concentration (10 ng-0.01 ng) by adding required
amount of deionized water (Ali et al., 2015d) (Figure 4.20). The six distinct bands of the
six PCR target amplified from 0.02 ng DNA template were observed in both the gel-view
(lane 8) and electroferogram (inset), confirming the detection limit (LOD) at 0.02 ng
DNA. LOD at this range was sufficient to detect any commercial frauding for profit
making purposes (Razzak et al., 2015). Previously, Ali et al., (2015d) detected 0.01 ng
DNA of dog, monkey and rat but 0.02 ng was found for pig and cat in a pentaplex PCR
system of 108-172 bp product sizes. Zhang (2013) documented 1 pg (0.001 ng) sensitivity
for a semi-nested mPCR for beef (263 bp), pork (387 bp), mutton (322 bp) and chicken
(216 bp). However, in semi-nested mPCR a common primer pair is amplified at first place
and the amplified product is then used as a template for the multiplex PCR. These make
the assay more difficult, costlier time consuming and less trustworthy. In addition, the
identical efficiency of the shortened primers for different templates often makes them
Page 212
188
incapable to detect an accurate species (Ali et al., 2015d). Furthermore, Kitpipit et al.
(2014) obtained 7-21 fg LOD for beef, Pork, lamb, chicken, ostrich and horse with
amplicon sizes of 100-311 bp. On the other hand, Luo et al. (2008) detected 0.1-0.2 ng
DNA in a mPCR assay for cattle, pig, sheep and chicken containing 149-274 bp product
sizes. Additionally, a duplex PCR identified beef (113 bp) and buffalo (152 bp) milk and
meat from 0.001 ng DNA (Rea et al., 2001; Gupta et al., 2012). Thus the variation in
sensitivity is a common phenomenon in mPCR and it depends on several factors such as
target gene, target species, amplicon size and quality of the source material (Hou et al.,
2015).
5.7.2 Sensitivity and Stability Test of Multiplex PCR Assay
Although several assays are reported for bovine, buffalo and Porcine identification,
the most of the reported mPCR assays have not been optimized and tested for adulteration
detection under commercial matrices and extensive food processing conditions. This
novel mPCR assay was optimized and validated for the analysis of a very popular meat
product, meatball and frankfurter under raw and heat treated condition to evaluate the
reliability and accuracy of the method. It positively detected six targets for beef, buffalo,
and pork from up to 0.1% adulterated and severely autoclaved model meatballs and
frankfurter (Figure 4.21 and 4.22), reflecting the sensitivity and discriminatory attributes
of the novel PCR assay. More recently, Razzak et al. (2015) documented a sensitivity
threshold of 0.1% for adulterated meatball, burger and frankfurter products under raw
states but up to 1% for 2.5 h autoclaved samples. Safdar & Junejo (2015) also reported a
0.1% limit of detection (LOD) for the identification of ovine, caprine, fish, and bovine
material using a tetraplex PCR assay involving 119−271 bp amplicons in heat-treated
(133 °C at 300 kPa for 20 min) mixed meat. In another report, Safdar et al. (2014)
documented 0.01% LOD for the identification of horse, soybean, poultry and pork with
85−212 bp amplicon targets. Hou et al. (2015) reported a sensitivity limit up to 1% for
Page 213
189
chicken, duck and goose boiled at 1000 C. In simplex PCR, Karabasanavar et al. (2014)
identified 0.1% adulterated pork under raw states. Mane et al. (2012) documented less
than 1% autoclaved beef in mixed states. However, instead of using processed samples,
most of them used raw meat.
As like as tetraplex PCR assay, the mPCR assay also validated under extreme thermal
treated meat samples namely boiled (980 C for 90 min), autoclaving (1210 C and 15-psi
for 20 min and 2.5 h) and microwaving (500, 600 and 700 W for 30 min) and the
developed mPCR assay successfully amplified the DNA extracted from the all heat
treated samples, even from the sample treated at 700 W for 30 min (Figure 4.23).
To the best of our knowledge, no other studies have tested mPCR assay under extreme
food processing conditions such as boiling (90 min), autoclaving (2.5 h) and micro-oven
cooking (700 W for 30 min) (Figure 4.23), although simplex PCR assays have been
documented under harsh processing condition (Ali et al., 2015b, Ali,et al., 2015c;
Karabasanavar et al., 2011a, Karabasanavar et al., 2011b). In earlier report, it was
scientifically proven that the stability of the PCR assay under extensive processing
atmosphere largely depends on the amplicon sizes; longer targets break down before the
shorter ones (Ali et al., 2015b; Ali et al., 2015c). This study has carefully addressed this
point and kept amplicon lengths between 73 and 146 bp; additionally, double gene sites
were used as targets for each species to complement a potential missing target. Therefore,
this novel mPCR assay offered better reliability but equivalent sensitivity compared to
those of other published reports. In addition, the specialty of our assay was double gene
target, short amplicon length, exceptional stability and sufficient sensitivity under raw,
admixed and processed states. A double targeted PCR assay is more reliable and
trustworthy since alternative targets can compensate the detection of a missing target
under the state of decomposition.
Page 214
190
5.7.3 Commercial Product Analysis under mPCR Assay
The motivation of the substitution of an expensive meat with its cheaper counterpart
comes with the inclination of a company to have more sales and better profit, and instead
of raw meat, adulteration could be skillfully manipulated in processed meat products (von
Bargen et al., 2013). Because meatball and frankfurter are very popular and consumed
widely all over the world, I have screened 45 and 20 halal branded beef meatball and
frankfurters, respectively in Malaysian markets (Table 4.17). It would be noteworthy here
that no buffalo meatball and frankfurter products were found in the Malaysian markets;
that is, all were labeled as beef products. However, all the tested beef frankfurters were
found as both beef and buffalo positive; this indicated that all beef frankfurter products
in Malaysia was buffalo adulterated. On the other hand, beef meatballs were detected both
beef and buffalo for 80% samples and total replacement of beef with buffalo in other 20%
(Table 4.17).
I also checked chicken and pork meatballs and frankfurters, but none of them were
beef and buffalo positive; this was probably because the prices of beef and buffalo are
higher than those of chicken and pork. Although both beef and buffalo are permitted by
the Halal Authority of Malaysia, beef meatball and frankfurter were adulterated with
buffalo for gaining unjustified profit since the buffalo meat is cheaper than beef in
Malaysia. However, as per the European guideline, fake labelling in food is a crime and
it must be prevented (Przyrembel, 2004). However, because of the strict monitoring of
haram species, Halal certified buffalo adulterated beef meatballs and frankfurters as well
as chicken frankfurters were found free from any non-Halal porcine materials.
Although several PCR assays are proposed for the beef and buffalo differentiation
(Karabasanavar et al., 2011a; Mane et al., 2012b), none of them were tested under
commercial matrices despite having the risk of PCR inhibition by multiple ingredients
Page 215
191
present in commercial products (Bottero et al., 2002; Di Pinto et al., 2005). Previous
reports analyzed only model meat products such as kabab, patty, and meat block using
simplex PCR systems for beef and buffalo, which incurs additional cost and time due to
the use of separate assays for each species (Mane et al., 2012a; B. G. Mane et al., 2012b).
Although several reports were documented for the analysis of meatball, streaky bacon,
frankfurter, and burger model products for the identification of pig species (Ali et al.,
2012c; Erwanto, Abidin, & Rohman, 2012), all of those were simplex PCR assays.
5.8 Authentication of PCR products by RFLP Analysis
Species-specific PCR assay is often conclusive (Ali et al., 2015d), but it has yet to be
considered a definitive analytical method because of certain “hard-to-control” features of
the amplification process (Focke et al., 2010; Yang et al., 2005). For example, it
sometimes produces artifacts due to contamination by alien DNA at a minute scale
(Doosti et al., 2014; Yang et al., 2005), but these ambiguities or doubts could be
eliminated by the verification of the amplified product through at least one of three
different methods, namely, PCR-RFLP assay, probe hybridization, and target product
sequencing (Maede, 2006). Probe hybridization is an attractive technique because it can
detect multiple species in a single experimental run through the use of multiple labeled
probes (do Nascimento et al., 2010), but this procedure requires purified DNA and is also
laborious, expensive, and time- consuming (Rashid et al., 2015b). In contrast, DNA
sequencing is a more efficient and reliable tool, but it requires an expensive laboratory
setup and is often not suitable for the analysis of processed food under complex matrices
(Girish et al., 2004; Mafra et al., 2007) because of the coextraction of the food ingredients
that often bring errors into the final results (Albers, Jensen, Bælum, & Jacobsen, 2013).
In contrast, the PCR-RFLP assay can overcome all of these limitations and has been
widely used to authenticate the original PCR product amplified from a particular gene
fragment (Park et al., 2007; Sharma et al., 2008). It comprises the generations of a specific
Page 216
192
fragment profile through restriction digestion with one or two endonucleases. A carefully
selected restriction endonuclease cleaves the PCR product at specific recognition sites,
producing a set of DNA fragments of different lengths that could be separated and
visualized by gel electrophoresis;48 thus, it distinguishes the artificial PCR product from
the original through the analysis of the restriction fingerprints (Doosti et al., 2014;
Murugaiah et al., 2009). In this research, firstly, each target was digested individually
with an appropriate RE (Table 3.9) to study its different restriction profile in order to
eliminate any ambiguities that may arise from the final tetraplex PCR products that were
the mixture of four different amplicons (Figure 4.24). Then, tetraplex PCR products of
beef and buffalo were digested simultaneously with three restriction enzymes as cited in
section 3.7.1.2, and clear fingerprints were obtained for each of the four different targets
(Figure 4.24 and Table 3.9). Three different restriction enzymes (FatI, EciI, and AluI)
were used for the digestion of four PCR products (two beef (cytb and ND5) and two
buffalo (cytb and ND5)). FatI enzyme digested two products (buffalo cytb (90 bp) and
beef ND5 (106 bp)) and other two products, beef cytb (120 bp) and buffalo ND5 (138 bp)
were digested by EciI and AluI, respectively (Table 3.9). A total of eight restriction
fragments (8, 19, 40, 45, 50, 75, 87, and 130 bp) were generated after digestion of four
simplex PCR product with RE. The generated seven fragments were clearly visualized
and 8 bp fragment was not detected because it was below the lower resolution limit of the
instrument (≤15 bp). When tetraplex PCR products were digested using the same three
enzymes (FatI, EciI, and AluI) in a single experimental tube which generated a RFLP
patterns that were comprised of a total of seven fragments (19, 40, 45, 50, 75, 87, and 130
bp). The finding was consistent with RFLP profile of simplex PCR products, indicating
that the developed tetraplex PCR also amplified the same target region as simplex PCR
assay. The sizes of the digested fragments were the same as the sizes obtained from the
theoretical RFLP analysis using NEBcutter software (Table 3.9). Thus, experimental
Page 217
193
results were supported the theoretical RFLP analysis, indicating that developed PCR
systems amplified exact target sites.
The developed mPCR-RFLP assay was evaluated for the screening of commercial beef
and buffalo frankfurters under raw, boiled, and autoclaved states. Dummy frankfurters
were deliberately adulterated, and their restriction digestion patterns were studied (Figure
4.25). The digest of all samples (raw and heat treated) clearly presented the signature
fingerprints of 7 fragments (Figure 4.25), reflecting that variations in food processing
treatments cannot affect the stability of any of the four biomarkers developed in this
study; in other words, this novel mPCR-RFLP assay was sensitive, reliable, and robust
for the discriminatory detection of beef and buffalo in processed foods.
To authenticate by RFLP, the two pork (Pocytb and PoND5) simplex PCR products
were digested individually with CviKI-1 and FatI RE, respectively, because in silico
studies using NEBcutter software demonstrated overlapping fragments with beef and
buffalo. After digestion, the PoND5 PCR product (73 bp) generated 52 and 21 bp
fragments, while Pocytb PCR product (146 bp) produced 3 fragments of 80, 45, and 21
bp (Figure 4.26). Similar products were found from boiled (98 °C for 90 min) and
autoclaved (121 °C at 15-psi for 2.5 h) pork frankfurters. The restriction digestion maps
of different heat-treated (boiled and autoclaved) samples were similar to those from the
raw sample (Figure 4.27). Therefore, the finding indicated that as like as the beef and
buffalo biomarkers, the stability of the pork biomarkers were not affected by different
food processing treatments. Thus the developed hexaplex PCR assay was highly stable,
reliable and very sensitive tool for the identification and differentiation of bovine, buffalo
and porcine materials in severely degraded food products.
Previously, Haider et al., (2012) reported a PCR-RFLP assay with a 710 bp amplicon
that was amplified using common primer pairs for the cow, chicken, turkey, sheep, pig,
Page 218
194
buffalo, camel, and donkey. Girish et al. (2005) also documented a PCR-RFLP assay with
456 bp amplicon length for the detection of Goat, Sheep, Cattle and Buffalo. Recently,
Kumar et al. (2014) proposed a RFLP pattern with a 609 bp target to discriminate cattle,
buffalo, goat, sheep and pig. In addition, Erwanto et al. (2012) demonstrated a PCR-RFLP
technique for a 359 bp product. On the other hand, Verkaar et al. (2002) introduced a
PCR-RFLP assay for the identification and discrimination of bovine species with 271,
651, 604 and 822 bp products containing four sets of primers. A PCR-RFLP assay with
universal primer pair of 360 bp amplicon sized was used for the detection of ten common
meat species (cow, buffalo, pig, deer, chicken, goat, duck, turkey, rabbit and ostrich)
(Wong, Lim, & Chua, 2010). Furthermore, pork species also identified by PCR-RFLP
assay with 109 bp target (Ali et al., 2012c). However, such long targets (271−822 bp) are
more prone to break down and thus would definitely lose their applicability for the
analysis of highly processed foods. In contrast, here I reported a double gene site and
short amplicon length (≤146 bp) mPCR-RFLP and systematically proved its reliability
and sensitivity under raw, boiled (98 °C for 90 min), and autoclaved (121 °C and 15 psi
pressure for 2.5 h) atmospheres for differential identification of beef, buffalo, and pork in
pure, admixed, and frankfurter formulation.
5.9 Real-time PCR Assay
5.9.1 Multiplex Real-time PCR System
Design of specific primers and probes were the key step in the development of mqPCR
system for bovine, buffalo and porcine species detection because it was necessary to
ensure that all the primers and probes must have the same or very closely related melting
temperatures (Tms) so that they can anneal to their specific partner sites in template DNA
under the same set of PCR conditions (Cheng et al., 2014). The Tms of three primer sets
were (57.8- 61.00C) which annealed to the primer binding sites at 600 C and Tms of the
probes (68.5-70.700C) were 8-100C higher than that of the primers to facilitate the
Page 219
195
preferential binding of the probes prior to the annealing of the primers to the template
(Arya et al., 2005). The multiple amplicons were discriminated in the same reaction tube
through three different fluorescent reporter dyes (section 3.8.1 and Table 3.12). The Ct
values of tetraplex qPCR assay were Ct = 18.74 ± 0.04, 17.75 ± 0.06, 14.80 ± 0.05, and
15.14 ± 0.05 that nicely matched with the qPCR Ct for cow, buffalo, pig, and IAC,
respectively, effectively confirming that there were not any significant variation of Ct
values when the platforms were changed from single to multiplex. The use of endogenous
system in the qPCR assay eliminated any false negative detection as well as helped in
accurate quantification of target. It also indicated whether there is any effect of inhibitors
and reagents in the reaction mixture (Rojas et al., 2011). Moreover, the presence of
endogenous control was mandatory, particularly for the analysis of extremely processed
food samples since the extracted DNA might be of low quality and degraded.
Furthermore, the endogenous system play a key role to a verify qPCR assay if any
amplification variations was occurred with species specific biomarkers due to the
variation in template DNA concentration, purity of extracted DNA, degradation of DNA
and the presence of PCR inhibitors (Soares et al., 2013). Therefore, factual error between
the unknown samples and standards can be eliminated by the comparison of endogenous
system and species-specific assay signal generated from samples (Rojas et al., 2010).
5.9.2 Specificity of the Multiplex Real-time PCR System
NCBI BLAST analysis results demonstrated that the designed primer pairs and probes
had completely identical sequences with target species and sufficient mismatch with the
other species. Alignment of primer sets and probes with target and non-target species
(commonly used in meat products) using MEGA5 software showed 100% sequence
similarity with the target species and multiple nucleotide mismatches (3-18 nt in primers
and 3-25 nt in probes) with other related or non-target species (Table 4.2-4.7). From the
in silico specificity analysis, it can be concluded that there were no or very little possibility
Page 220
196
for amplifying the non-target species in a practical PCR experiments. Because the
existence of a single mismatch at the primer annealing position may reduce the PCR
efficiency or causes false or no amplification (Wu et al., 2009). Finally, the practical
specificity of the mqPCR system was conducted with 30 ng of DNA extracted from fresh
muscle tissues of three target species (cow, buffalo and pig) and 25 non-target species
(lamb, goat, cat, dog, pigeon, chicken, quail, duck, rat, monkey, rabbit, donkey, tilapia,
tuna, rohu, salmon, cod, pangas, turtle, frog, onion, ginger, wheat, garlic, and pepper) on
three different days in triplicates. The amplification profile (Figure 4.29) clearly showed
that the mqPCR system amplified only three target species (cow, buffalo and pig) with
the Ct values of 18.84±0.06, 17.86±0.03 and 14.83±0.08, respectively (Table 4.18) and
only background florescence were provided from non-target species within 40 cycles,
confirming the absence of any cross-amplifications. On the other hand, this study used
the endogenous PCR system (eukaryotic 18S rRNA) to eliminate any false negative
amplification. The endogenous system amplified eukaryotic target from all targets and
non-target species with the Ct values between 15.61 and 18.50 (Table 4.18) reflected that
good quality DNA template was present in all tubes (Figure 4.29). Thus the developed
mqPCR system effectively amplified only target species and no cross-amplifications were
observed, reflecting the high specificity of the technique.
5.9.3 Limit of Detection and Efficiency of the Multiplex Quantitative PCR System
Ten fold serially diluted genomic DNA (30 to 0.003 ng) from each of the target species
(cow, buffalo and pig) were used to determine the LOD of the assay and amplification
plots clearly demonstrated that the system amplified up to 0.003 ng DNA with detectable
fluorescence signals for all targets, suggesting the assay could detect and quantify
minimum 0.003 ng target DNA (Figure 4.30 a – d). RSD for all diluted DNA were less
than 1.0 (0.1−0.94) (Table 4.19), indicating that minimum variation between the
replicates were present in the developed mqPCR assay. Previously, Cheng et al. (2014)
Page 221
197
reported an mPCR system for the identification of duck, pig and chicken, wherein the
LOD was 0.15 ng DNA for each species. On the other hand, it was 0.32 ng DNA for
beef, pork, chicken and turkey as documented by Koppel et al. (2008). Recently, our
laboratory also detected 0.0017 ng DNA by a duplex SYBR Green PCR for Malayan Box
Turtle (Asing et al., 2016a). Thus LOD might vary from species to species and samples
to samples but 0.001 ng detectable limit of the present assay made it highly sensitive for
the adulteration authentication.
For quantitative detection standard curves of all target species were generated by
plotting the Ct values against the logarithmic value of each DNA concentration. The
standard curve of buffalo and pig were constructed from five point dilutions (30-0.003
ng), whereas four point dilutions (30-0.03) were used for the generation of cow standard
curve. Because a five point dilutions (30-0.003 ng) did not comply with the recommended
PCR efficiency (90-110%) (Safdar & Abasıyanık, 2013). The quantification of 0.03 ng
DNA was sufficient to detect any commercial frauding for profit making purposes
(Razzak et al., 2015). In fact, a good linear regression were found in the standard curves
for all measurements, wherein the regression coefficient (R2) was 0.9847, 0.9996, 0.9999,
and 0.9978 for cow, buffalo, pig, and IAC, respectively, and the corresponding slopes
were −3.1289, −3.1477, −3.4562, and −3.2288. The PCR efficiency were found to be
108.73%, 107.82%, 94.68%, and 104.03% for cow, buffalo, pig, and IAC, respectively.
These values were within the recommended values (90-110%) (Ali et al., 2012a) and thus,
the generated standard curves and mqPCR systems were suitable for the quantitative
determination of the target species contribution from mixed meat samples. The findings
were supported by Cheng et al. (2014) in which the mqPCR efficiencies were 104.38,
91.75 and 97.46% for chicken, duck and pig species, respectively. Similarly, Iwobi et al.
(2015) found the efficiencies of their mqPCR system for beef and pork at 101.1% and
91.6%, respectively.
Page 222
198
5.9.4 Sensitivity and Validity of the tetraplex qPCR Assay under Ternary and
Commercial Matrices
Sensitivity of the PCR system is a key factor for the authentication of processed food
products. Deliberately adulterated model ternary meat admixtures of beef, buffalo and
pork (10, 1 and 0.1%) were prepared (section 3.8.7) to evaluate the sensitivity of the
mqPCR method. All the species were detected until 0.1% adulteration in the ternary
admixes with Ct values of 25.19 ± 0.23 to 27.68 ± 1.47 for all the three target species but
the IAC constantly yielded a mean Ct between 15.63 ± 0.11 and 16.83 ± 0.21 for all level
of adulterations, reflecting that the endogenous target did not change significantly with a
variation in adulterations because all adulterants were eukaryotic. These clearly
demonstrated that the developed mqPCR system was very sensitive, specific and robust
and can reliably detect all the three targets from 0.1% contaminated specimens. Cheng et
al., (2014) developed an mqPCR system for the detection of pig, chicken and duck with
the sensitivity of 1% for all target species in ternary mixture. Recently, the sensitivity of
the mqPCR in binary admixture was found to be 0.5% spiked level of pork in beef
background (Iwobi et al., 2015). The same sensitivity (0.5%) was also found by Dooley
et al., (2004) in a TaqMan real-time PCR assays for the detection of beef, pork, turkey,
chicken and lamb. More recently, Fang and Zhang (2016) established a qPCR assay for
the detection of murine species with sensitivity of 0.1% murine adulteration in meat
admixtures.
The mqPCR system was further validated for the analyses of processed meat products
(frankfurters and meatballs). The analysis results (Table 4.20) of the three target species
revealed that the target recoveries from 10% to 0.1% spiked level were 85.90−115.3%
along with a systematic error between −14.10 and +15.3% and RSD 0.61−19.40%. Thus,
the maximum recovery was 115.3% for the 10% spiked pork in buffalo meatball and
minimum was 85.90% for the 10% spiked beef in pork meatball product, respectively.
Page 223
199
On the other hand, maximum RSD was found in buffalo frankfurter containing 0.1% pork
adulteration and minimum RSD was found in 1% adulterated pork frankfurter. When a
graph was generated by plotting the recovered values (y-axis) (Table 4.21) against the
reference (actual) values (x-asis) for each target, a very high correlation coefficient (R2 =
0.9999) was attained (Figure 4.31), confirming that the experimental values were fairly
close to their actual values. Druml et al. (2015) found 40.9% systematic error and 12.9%
RSD for 2% adulteration and Asing et al. (2016a) found 23.10% systematic error and
1.69% RSD and for 0.1% contamination. Thus the systematic error between -19.0 and
+23.8% and RSD 2.04 and 22.86% of this assay was within the acceptable limits of the
published reports.
5.9.4.1 Residual Analysis
Residuals are differences between the actual or predicted and the measured values from
a set of variables. They determine the experimental errors by subtracting the experimental
value from the predicted value (Ali et al., 2012a). Therefore, the graph of residual verses
fitted recovery values of variables for both frankfurters and meatballs of three target
species (bovine, buffalo and porcine) were generated (Figure 4.32 a-f). The random
distribution of all variables were very low (within +2.0 to −2.0 from zero line) for
frankfurter, whereas they were relatively higher (within +3.0 to −2.0 from zero line) for
meatball products. These distributions of residuals indicated a good precision and
accuracy of the developed mqPCR system for the measurement of 0.1-10% adulteration
of the three target species in meat products (Ali et al., 2012a).
5.9.5 Analysis of Commercial Meat Products by mqPCR
The motivation of the replacement of an expensive meat with its cheaper counterpart
comes with the inclination of a company to have more sales and better profit and therefore
instead of raw meat, adulteration practices are skillfully manipulated in processed meat
Page 224
200
products. Bovine, buffalo and porcine adulterations in food chains have enormous threats
to public health, religions, cultures, and economy. Since, hotdogs, meatballs and burgers
are very popular meat products and very widely consumed all over the world, 12
frankfurter (7 beef and 5 pork), 12 meatball (7 beef and 5 pork) and 12 burger (7 beef and
5 pork) products were procured from various Malaysian outlets and were analyzed using
the tetraplex qPCR assay (Table 4.22). The experimental results revealed that 100% of
beef meatballs, 85% of beef burgers and 71% of beef frankfurter were adulterated with
buffalo meat but no porcine DNA was found in beef products. Surprisingly no meat
products were found to contain 100% buffalo but all adulterated samples were found to
contain both beef and buffalo, strongly suggesting that these adulterations were for the
purpose of economic gain. On the other hand, all pork products were found to contain
only pork and no contamination with beef and buffalo. These clearly reflected that buffalo
substitution in beef products are very rampant in Malaysia and it is mainly done for
economic gain since buffalo is cheaper than beef in Malaysian Markets but fraud stars are
not mixing any porcine in halal products because of the strict monitoring of halal status
in by the Malaysian government.
Page 225
201
CONCLUSIONS AND RECOMMENDATIONS
6.1 Conclusion
Fraud labelling of meat species in food products is mainly done to realize additional
economic gain by selling lower valued ingredients in place of a higher priced one. These
malicious practices not only cheat customers economically but also pose huge adverse
impacts to our public health, religious faiths and cultures, endangered wild species and
reputation of our businesses. These practices must have to be stopped and regulatory
bodies must need a trustworthy and convenient technique to reveal accurate product
information. Bovine, buffalo and porcine adulteration in food chains are very common
across the globe and definitely a great threat to our public health, religions, cultures, and
economy. It is also a very sensitive issue because many religions do not allow their
followers to consume porcine and bovine products. Several duplex PCR systems for the
detection of beef and buffalo or beef and pork have been documented; but to the best of
our knowledge, no methods have been proposed for reporting all the three species,
namely, bovine, buffalo and porcine in a single assay platform.
This study has addressed the above knowledge gap by developing and validating a
multiplex PCR (mPCR) system involving double-sites of two different mitochondrial
genes (cytb and ND5) of cow, buffalo and pig species for the first time. This novel mPCR
assay is outstanding because it ensured extra security through targeting two different sites
of two different genes that are less likely to break down even under the states of
decomposition. Furthermore, the alternative target can complement the detection of a
potential missing target that might be degraded during food processing. Additionally, the
detection of multiple targets in a single assay is highly promising because it definitely
saves analytical cost and time. The assays were evaluated for specificity, stability and
Page 226
202
sensitivity under raw, admixtures and commercial meat products including burger,
meatball, frankfurter and beef curry.
The purity of the DNA extracted from raw and processed meat and commercial meat
products were of good quality and various commercial kits had to be used for an optimum
yield. Unlike pure meat, commercial meat products contain spices, food additives and
vegetables and so a need different kit was necessary to get good quality DNA.
Species-specific PCR assay was developed step by step because it is a simple and low-
cost technique that could be performed in most laboratories and also it is often conclusive
for the speciation of different meat. So, at first primers specificities were confirmed
through simple PCR and eventually multiplex PCR for all the six targets were optimized
and validated against the 3 target and 27 non-targets species. A universal eukaryotic
primer set were used to co-amplify a 99 eukaryotic control from all tubes, eliminating the
possibility of any false-negative detection.
At first, a tetraplex PCR system was optimized for the simultaneous detection and
differentiation of cow and buffalo species and a cross-specificity test was performed
against 21 non-target animal and 5 plant species; it yielded PCR products only from the
beef (106 and 120 bp) and buffalo (90 and 138 bp) targets and no products from non-
targets, indicating the high specificity of the tetraplex PCR assay. The stability and
sensitivity was confirmed under extensive autoclaving, boiling and microwaving
treatments for pure meat and meat-based products such as burgers. In addition to double
targets, all targets of both species were kept between 90 and138 bp which offered
additional stability because short targets are more stable than the longer ones. The
developed tetraplex PCR system was validated by the screening beef curries and beef
burgers that revealed that 71% beef curries in Malaysia were adulterated by buffalo meat.
Page 227
203
After validating a tetraplex PCR assay for beef and buffalo, a hexaplex PCR (mPCR)
assay targeting double gene sites for each species were developed for the discrimination
of bovine, buffalo and porcine materials in food chain. This multiplex system amplified
all the target gene (Cytb and ND5) sites accurately, reflecting conformity with the simplex
PCR system. Change of operators and laboratories did not change the findings. Cross-
species were tested under pure, mixed and commercial matrices under various processed
treatments but no significant variations were detected, confirming the assay fidelity. The
sensitive of this hexaplex PCR assay was 0.02 ng DNA or 0.1% meat under mixed
matrices. The method was validated for the screening of commercial meatball and
frankfurter products and operationally feasibility was found for the detection of trace
amount of bovine, buffalo and porcine materials in food chain. Thus, the novel assay
demonstrated sufficient merits to be used by regulatory bodies for beef, buffalo, and pork
authentication even under the state of degraded specimens.
Market survey revealed about 80% of beef meatballs are adulterated with buffalo and
about 20% are totally replaced with buffalo. However, the beef frankfurters were found
to contain both beef and buffalo positive in 100% tested samples; this indicated that beef
products adulteration with buffalo is rampant in Malaysia. On the other hand, chicken and
pork frankfurters were not positive for beef and buffalo; this was probably because the
prices of beef and buffalo are higher than those of chicken and pork in Malaysia.
However, no porcine material was fond in Halal branded beef and chicken products.
Authentication of PCR products is very important to be confirmed that authentic
targets were amplified. Two types of authentication schemes were applied; sequencing
and RFLP analysis. The amplified products were purified and cloned prior to sequencing
the results showed that all PCR products were 100% identical with the specific target
sequences 98.5% similar but it was within the acceptable range. In the second way, PCR
Page 228
204
products were digested by four different restriction enzymes such as AluI, EciI, FatI, and
CviKI- that confirmed the authentic molecular fingerprints for the target species. The
tetraplex PCR products of beef and buffalo were digested simultaneously with three
restriction enzymes and clear fingerprints were obtained for each of the four different
targets. The tetraplex PCR-RFLP assay was validated for the screening of deliberately
adulterated commercial beef and buffalo frankfurters under raw, boiled, and autoclaved
states and signature fingerprints were obtained. Thus it was confirmed that this novel
tetraplex PCR-RFLP assay was sensitive, reliable, and robust for the discriminatory
detection of beef and buffalo in processed foods. On the other hand, porcine PCR products
were digested individually with CviKI-1 and FatI RE, because they produced overlapping
fragments for beef and buffalo; it was proven that like beef and buffalo biomarkers, pork
biomarkers was also stable under food processing treatments.
Although our conventional mPCR and mPCR-RFLP assays successfully identified
bovine, buffalo and porcine materials in food chain, they cannot quantify how much
adulterant was used. Therefore, a short amplicon length TaqMan probe multiplex
(tetraplex) real-time PCR assay was developed for the quantitative detection of beef,
buffalo and pork in a single assay platform. It was a greatly reliable assay for the
quantitative determination of bovine, buffalo, and porcine materials under any matrices
because specific targets were detected firstly, by species-specific primers and secondly,
by the TaqMan probes, confirming a double checking satisfaction. Thirdly, the shorter
length of the targets offered additional stability even under the state of decomposition,
and fourthly, the use of an internal positive control effectively eliminated the chances of
any false negative detection. Species specificity of all targets was confirmed by cross-
checking all the primers and probes against 25 non-target species. The assay was sensitive
enough to detect all the bovine, buffalo, and porcine targets in pure, admixed and
processed frankfurter and meatball samples having as low as 0.1% adulteration.
Page 229
205
Furthermore, the screening of the commercial food samples reflected that the assay could
be applied for the analysis of real-world samples.
Thus, this novel assay demonstrated sufficient merits to be used by regulatory bodies
for beef, buffalo, and pork authentication in any samples even under degraded conditions.
In addition to multiplex, the assay could be used in simplex PCR system for identification
of all targets individually as well as tetraplex PCR system for identification and
differentiation of beef and buffalo under double targeted system based on the
requirements and needs. A brief summary of the present research according to the
objectives are given below:
1. Development of Biomarkers Targeting Double Genes Sites
The amplicon sizes of the designed three sets of primers for each of cow, buffalo and
pig were between 73 and 146 bp (cytb and ND5 genes of cow (120 and 106 bp), buffalo
(90 and138 bp), Pork (146 and 73 bp)). Biomarker targets within this range were suitable
for efficient amplification and stability under extreme food processing conditions. The
in-silico analysis revealed that the developed six primer sets matched 100% with the
targets and had 3–18 nucleotides (12.5–78%) mismatching with non-target species,
indicating that the primers would only bind with target DNA and avoid annealing with
any potential non-targets. Moreover, measurement of pairwise distances and phylogenetic
tree among the 24 animals and four plants species revealed sufficient genetic distances to
rule out any chances of non-target amplification. Finally, the theoretical results were
experimentally validated by an authentic PCR test against the target and 27 different non-
target species using 20 ng of DNA extracted from all of the tested samples.
Page 230
206
2. Development of multiplex conventional and real-time PCR systems
Mitochondrial cytb and ND5 genes were targeted and six different targets (length: 90-
146 bp), two for each of cow (120 and 106bp), buffalo (90 and 138bp) and pig (73 and
146bp), were successfully amplified from raw, boiled, autoclaved and microwaved
cooked meat under pure and mixed matrices. The detection limit was 0.01 ng DNA for
tetraplex and 0.02 ng DNA for hexaplex under pure states and 0.1% target meat in mixed
and commercial matrices. For authentication, the PCR products were digested by four
restriction enzymes (RE), namely AluI, EciI, FatI and CviKI-1 and clear restriction
fingerprints were obtained. PCR products sequencing results confirmed the authenticity
of RFLP findings. I also described here a quantitative multiplex real-time PCR assay with
TaqMan Probes to detect and quantify contributions from bovine, buffalo and porcine
materials simultaneously. Amplicon-sizes were very short (120, 90 and 146 bp for bovine,
buffalo and porcine) because longer targets break down, bringing serious ambiguity in
molecular diagnostics. False negative detection was eliminated through an endogenous
control (141 bp site of eukaryotic 18S rRNA). Analysis of reference samples reflected
good target recovery, PCR efficiency and detection limit under mixed matrices. The
developed mqPCR assay successfully detected 0.003 ng DNA in a pure state and 0.1%
target meat in mixed and commercial matrices.
3. Assay performance under processed meat products
The novel methods were used for the screening of bovine, buffalo and porcine
materials in various commercial meat curries and processed foods, namely meatballs and
frankfurters. Survey results revealed about 80% of beef meatballs were adulterated with
buffalo and surprisingly about 20% the beef products were totally replaced with buffalo.
Moreover, the analysis of 20 beef frankfurters revealed the presence of both beef and
buffalo in all specimens. This demonstrated that all beef frankfurter products were
Page 231
207
adulterated with buffalo in Malaysia. However, the analysis of 7 beef curries reflected
only 2 them were beef and others 5 were buffalo. In contrast, porcine meatball and
frankfurter were found 100% authentic and also no porcine was detected in halal branded
beef curries, meatballs and frankfurters and also in chicken frankfurters. Furthermore,
market survey under mqPCR assay revealed 71%, 100% and 85% of beef frankfurters,
meatballs and 85% burgers contained buffalo adulteration but no porcine in Malaysian
markets.
6.2 Recommendation for Future Work
The developed short amplicon length and double genes targeted multiplex food
authentication schemes in the present study are highly promising technique as they can
detect the targets in qualitatively and quantitatively in severely heat treated samples
wherein most of DNA are degraded. Furthermore, the assay was highly secured as
alternative targets could complement the detection of a missing target. In addition,
quantification of the target DNA can be helpful to measure the limit of contamination.
Due to time limitation, all types of samples such as dairy and pharmaceutical products
could not be analyzed. I believe this technique can be applied for the detection of species
origin in pharmaceutical capsule shells, dairy and cosmetics samples as well. The sources
of capsule shell gelatin are bovine, buffalo, porcine and fish. Among these bovine and
porcine are most dominant sources but they have limited acceptability due to religious
belief. However, the DNA extraction from capsule shells, dairy and cosmetics items is
also difficult and has not been optimized yet; hence an appropriate protocol for the
extraction of DNA should be developed. Furthermore, horse meat is another potential
adulterant worldwide, since it has also limited acceptability because of potential zoonotic
threats and religious restriction. If double genes targeted two horse biomarkers can be
included to develop on octaplex system, it would be highly appreciated.
Page 232
208
The current trend of the researchers to develop biosensor based techniques which offer
fast, low cost, high sensitive that does not require expensive laboratory set up, costly
instruments and skilled personnel and offer on-field delivery of results could be
developed.
6.3 Limitation of this Study
It is difficult for another research group to replicate the results unless one has the
capillary electrophoretic system like that of the automated Qiaxcel Advanced
Capillary system. The nature of the study is the utilization of short length
oligonucleotides which generate very small sized amplicons and differences between
the amplicons were very short. Thus it requires special instrumentation for
visualization. This incurs further costs. So, future study could explore whether such
short-length variable amplicons could be separated by a different and more convenient
approach.
Page 233
209
REFERENCES
Abbas, O., Pierna, J. F., Boix, A., Von Holst, C., Dardenne, P., & Baeten, V. (2010). Key
parameters for the development of a NIR microscopic method for the
quantification of processed by-products of animal origin in compound
feedingstuffs. Analytical and bioanalytical chemistry, 397(5), 1965-1973.
Abd-Elsalam, K. A. (2003). Bioinformatic tools and guideline for PCR primer design.
African Journal of Biotechnology, 2(5), 91-95.
Addinsoft, S. (2013). XLSTAT-PLSPM. Paris, France.
Addis, M. F., Cappuccinelli, R., Tedde, V., Pagnozzi, D., Porcu, M. C., Bonaglini, E., . .
. Uzzau, S. (2010). Proteomic analysis of muscle tissue from gilthead sea bream
(Sparus aurata, L.) farmed in offshore floating cages. Aquaculture, 309(1), 245-
252.
Adulterated Food. (2002). Retrieved 24 Dec, 2016, from Federal Food, Drug, and
Cosmetic Act, United State. https://www.epw.senate.gov/FDA_001.pdf
Aftosa, F. (2014). Foot and Mouth Disease, The center for food security and public health,
Iowa State University. College of Veterinary Medicine. (Accessed on January 31,
2017). Retrieved from www.cfsph.iastate.edu/Factsheets/pdfs/foot_and_
mouth_disease.pdf
Aida, A., Man, Y. C., Wong, C., Raha, A., & Son, R. (2005). Analysis of raw meats and
fats of pigs using polymerase chain reaction for Halal authentication. Meat
Science, 69(1), 47-52.
Al Amin, M. (2015). Development and validation of short amplicon-length PCR assays
for the detection of feline species in processed foods/Md. Al Amin. (Master of
Philoshopy), University of Malaya.
Albers, C. N., Jensen, A., Bælum, J., & Jacobsen, C. S. (2013). Inhibition of DNA
polymerases used in Q-PCR by structurally different soil-derived humic
substances. Geomicrobiology Journal, 30(8), 675-681.
Ali, M. E., Hashim, U., Mustafa, S., Man, Y. C., Dhahi, T. S., Kashif, M., . . . Hamid, S.
A. (2012a). Analysis of pork adulteration in commercial meatballs targeting
porcine-specific mitochondrial cytochrome b gene by TaqMan probe real-time
polymerase chain reaction. Meat Science, 91(4), 454-459.
Ali, M. E. (2011a). Development of nanoparticle sensors for the detection and
quantification of swine DNA in mixed biological and commercial samples for
halal authentication. (Doctoral dissertation), Universiti Malaysia Perlis
(UniMAP).
Ali, M. E., Al Amin, M., Hamid, S. B. A., Hossain, M. M., & Mustafa, S. (2015a). Lab-
on-a-chip-based PCR-RFLP assay for the confirmed detection of short-length
feline DNA in food. Food Additives & Contaminants: Part A, 32(9), 1373-1383.
Page 234
210
Ali, M. E., Al Amin, M., Razzak, M. A., Abd Hamid, S. B., Rahman, M. M., Abdul
Rashid, N., & Asing. (2015b). Short Amplicon-Length PCR Assay Targeting
Mitochondrial Cytochrome b Gene for the Detection of Feline Meats in Burger
Formulation. Food Analytical Methods, 9(3), 571-581.
Ali, M. E., Asing, Hamid, S. B. A., Razzak, M. A., Rashid, N. R. A., Al Amin, M., &
Mustafa, S. (2015c). A suitable method to detect potential fraud of bringing
Malayan box turtle (Cuora amboinensis) meat into the food chain. Food Additives
& Contaminants: Part A, 32(8), 1223-1233.
Ali, M. E., Hashim, U., Dhahi, T. S., Mustafa, S., Man, Y. B. C., & Latif, M. A. (2012b).
Analysis of pork adulteration in commercial burgers targeting porcine-specific
mitochondrial cytochrome B gene by TaqMan probe real-time polymerase chain
reaction. Food Analytical Methods, 5(4), 784-794.
Ali, M. E., Hashim, U., Mustafa, S., & Man, Y. B. C. (2012c). Swine-specific PCR-RFLP
assay targeting mitochondrial cytochrome B gene for semiquantitative detection
of pork in commercial meat products. Food Analytical Methods, 5(3), 613-623.
Ali, M. E., Kashif, M., Uddin, K., Hashim, U., Mustafa, S., & Che Man, Y. B. (2012d).
Species Authentication Methods in Foods and Feeds: the Present, Past, and Future
of Halal Forensics. Food Analytical Methods, 5(5), 935-955.
Ali, M. E., Rahman, M. M., Hamid, S. B. A., Mustafa, S., Bhassu, S., & Hashim, U.
(2014a). Canine-specific PCR assay targeting cytochrome b gene for the detection
of dog meat adulteration in commercial frankfurters. Food Analytical Methods,
7(1), 234-241.
Ali, M. E., Rashid, N. R., Hamid, S. B., Hossain, A. S. M., Asing, Hossain, M. A. M., &
Zaidul, I. S. M. (2016). Development and Validation of Short-Amplicon Length
PCR Assay for Macaques Meat Detection under Complex Matrices. International
Journal of Food Properties, 20(1), 231-245.
Ali, M. E., Razzak, M. A., & Hamid, S. B. A. (2014b). Development of PCR-Targets for
Multiplex PCR Assay. Paper presented at the International Conference on Food
Innovation 2014 INNOVAFOOD-2014 Penang, Malaysia.
Ali, M. E., Razzak, M. A., & Hamid, S. B. A. (2014c). Multiplex PCR in species
authentication: probability and prospects—a review. Food Analytical Methods,
7(10), 1933-1949.
Ali, M. E., Razzak, M. A., Hamid, S. B. A., Rahman, M. M., Amin, M. A., Rashid, N. R.
A., & Asing. (2015d). Multiplex PCR assay for the detection of five meat species
forbidden in Islamic foods. Food Chemistry, 177, 214-224.
Ali, M. E., U. Hashim, S. Mustafa, & Man, Y. B. C. (2011b). Swine-Specific PCR-RFLP
Assay Targeting Mitochondrial Cytochrome B Gene for Semiquantitative
Detection of Pork in Commercial Meat Products. Food Analytical Methods, 5(3),
613-623.
Page 235
211
Al-Nassir, H. S., Kassim, R. A., & Muhammed, B. H. . (2014). Incidence of Illegal
Substitution of Beef with Inferior-Quality Animal Species Meats Sold in Kerbala.
Bas. Journal of Veterinary Research, 1, 108-115.
Anonym. (2007). Rotten Meat Scandal Raises Stink in Germany. Retrieved from
http://www.dw.com/en/rottenmeatscandalraisesstinkingermany/a2760787
Anonym. (2016a). Halal market developments in Dubai. (Accessed on Januay 19, 2017).
Retrieved from http://www.hollandplusyou.com/news/2016/05/halal-market-
developments-in-dubai.html
Anonym. (2016b). World Per Capita Pork Consumption-Pork Checkoff. (Accessed on
january 09, 2017). Retrieved from http://www.pork.org/pork-quick-
facts/home/stats/u-s-pork-exports/world-per-capita-pork-consumption-2/
Anonym. (2017a). Kosher Marketing-Kosher Australia. (Accessed on January 12, 2017).
Retrieved from https://www.kosher.org.au/pages/201601111117Kosher
Marketing
Anonym. (2017b). Muslim Foood halal and haram food. (Accessed on January 14, 2017).
Retrieved from http://www.muslimconverts.com/food/
Anonym. (2017c). Water Buffalo (Bubalus Bubalis)-Animals -A-Z Animals-Animal
Facts, Information, Pictures, Videos, Resources and Links. (Accessed on January
08, 2017). Retrieved from http://azanimals.com/animals/waterbuffalo/
Arif, I. A., Bakir, M. A., Khan, H. A., Al Farhan, A. H., Al Homaidan, A. A., Bahkali, A.
H., . . . Shobrak, M. (2010). A brief review of molecular techniques to assess plant
diversity. International journal of molecular sciences, 11(5), 2079-2096.
Aristoy, M. C., Soler, C., & Toldrá, F. (2004). A simple, fast and reliable methodology
for the analysis of histidine dipeptides as markers of the presence of animal origin
proteins in feeds for ruminants. Food Chemistry, 84(3), 485-491.
Aristoy, M. C., & Toldrá, F. (2004). Histidine dipeptides HPLC-based test for the
detection of mammalian origin proteins in feeds for ruminants. Meat Science,
67(2), 211-217.
Arslan, A., İlhak, İ., Calicioglu, M., & Karahan, M. (2005). Identification of meats using
random amplified polymorphic DNA (RAPD) technique. Journal of Muscle
Foods, 16(1), 37-45.
Arslan, A., Ilhak, O. I., & Calicioglu, M. (2006). Effect of method of cooking on
identification of heat processed beef using polymerase chain reaction (PCR)
technique. Meat Science, 72(2), 326-330.
Arslan, A., Ilhak, O. I., & Calicioglu, M. (2006). Effect of method of cooking on
identification of heat processed beef using polymerase chain reaction (PCR)
technique. Meat Science, 72(2), 326-330.
Page 236
212
Arya, M., Shergill, I. S., Williamson, M., Gommersall, L., Arya, N., & Patel, H. R. (2005).
Basic principles of real-time quantitative PCR. Expert review of molecular
diagnostics, 5(2), 209-219.
Arya, M., Shergill, I. S., Williamson, M., Gommersall, L., Arya, N., & Patel, H. R. (2014).
Basic principles of real-time quantitative PCR. Expert review of molecular
diagnostics, 5(2), 209-219.
Asensio, L. (2008). Application of multiplex PCR for the identification of grouper meals
in the restaurant industry. Food Control, 19(11), 1096-1099.
Asensio, L., González, I., García, T., & Martín, R. (2008). Determination of food
authenticity by enzyme-linked immunosorbent assay (ELISA). Food Control,
19(1), 1-8.
Asing, Ali, E., Hamid, S. B. A., Hossain, M., Ahamad, M. N. U., Hossain, S. A., . . .
Zaidul, I. (2016a). Duplex real-time PCR assay using SYBR Green to detect and
quantify Malayan box turtle (Cuora amboinensis) materials in meatballs, burgers,
frankfurters and traditional Chinese herbal jelly powder. Food Additives &
Contaminants: Part A, 33(11), 1643-1659.
Asing, Ali, M. E., Hamid, S. B. A., Hossain, M. M., Mustafa, S., Kader, M. A., & Zaidul,
I. (2016b). Lab-on-a-chip-based PCR-RFLP assay for the detection of Malayan
box turtle (Cuora amboinensis) in the food chain and traditional Chinese
medicines. PloS one, 11(10), e0163436.
Avery, J. (2014). Fighting food fraud. Retrieved from
http://www.europarl.europa.eu/RegData/bibliotheque/briefing/2014/130679/LD
M_BRI(2014)130679_REV1_EN.pdf
Ayaz Y, Ayaz ND, & I., E. (2006). Detection of species in meat and meat products using
enzyme-linked immunosorbent assay. Muscle Foods, 17(2), 214-220.
Badpa, A., & Ahmad, S. (2014). Buffalo: a potential animal for quality meat production-
a review. Livestock research international, 2(2), 19-29.
Bai, W., Xu, W., Huang, K., Yuan, Y., Cao, S., & Luo, Y. (2009). A novel common
primer multiplex PCR (CP-M-PCR) method for the simultaneous detection of
meat species. Food Control, 20(4), 366-370.
Balizs, G., Weise, C., Rozycki, C., Opialla, T., Sawada, S., Zagon, J., & Lampen, A.
(2011). Determination of osteocalcin in meat and bone meal of bovine and porcine
origin using matrix-assisted laser desorption ionization/time-of-flight mass
spectrometry and high-resolution hybrid mass spectrometry. Analytica chimica
acta, 693(1), 89-99.
Ballin, N. Z., Vogensen, F. K., & Karlsson, A. H. (2009). Species determination–Can we
detect and quantify meat adulteration? Meat Science, 83(2), 165-174.
Page 237
213
Barakat, H., El-Garhy, H. A., & Moustafa, M. M. (2014). Detection of pork adulteration
in processed meat by species-specific PCR-QIAxcel procedure based on D-loop
and cytb genes. Applied microbiology and biotechnology, 98(23), 9805-9816.
Barbuto, M., Galimberti, A., Ferri, E., Labra, M., Malandra, R., Galli, P., & Casiraghi,
M. (2010). DNA barcoding reveals fraudulent substitutions in shark seafood
products: the Italian case of “palombo”(Mustelus spp.). Food Research
International, 43(1), 376-381.
Bauer, K. (1997). Foot-and-mouth disease as zoonosis. Archives of Virology Supplement,
95-98.
Belak, S., & Thorén, P. (2004). Validation and quality control of polymerase chain
reaction methods used for the diagnosis of infectious diseases. OIE Manual of
Diagnostic Tests and Vaccines for Terrestrial Animals, 5th ed. Office
International des Epizooties, Paris, France, 30-36.
Bender, A. E. (1992). Meat and meat products in human nutrition in developing countries
(Vol. 556): FAO Rome.
Berger, R., Mageau, R., Schwab, B., & Johnston, R. (1987). Detection of poultry and pork
in cooked and canned meat foods by enzyme-linked immunosorbent assays.
Journal-Association of Official Analytical Chemists, 71(2), 406-409.
Berrini, A., Tepedino, V., Borromeo, V., & Secchi, C. (2006). Identification of freshwater
fish commercially labelled “perch” by isoelectric focusing and two-dimensional
electrophoresis. Food Chemistry, 96(1), 163-168.
Bevan, I., Rapley, R., & Walker, M. (1992). Sequencing of PCR-amplified DNA.
Genome Research, 1(4), 222-228.
Bollongino, R., Burger, J., Powell, A., Mashkour, M., Vigne, J. D., & Thomas, M. G.
(2012). Modern taurine cattle descended from small number of Near-Eastern
founders. Molecular biology and evolution, 29(9), 2101-2104.
Borda, I. A., Philen, R. M., de la Paz, M. P., de la Cámara, A. G., Ruiz-Navarro, M. D.,
Ribota, O. G., . . . Leal, C. F. (1998). Toxic oil syndrome mortality: the first 13
years. International journal of epidemiology, 27(6), 1057-1063.
Borghese, A. (2005). Buffalo production and research (REU Technical Series 67). Inter-
regional Cooperative Research Network on Buffalo (ESCORENA), FAO
Regional Office for Europe, Rome.
Bottero, M., Civera, T., Anastasio, A., Turi, R., & Rosati, S. (2002). Identification of
cow's milk in “buffalo” cheese by duplex polymerase chain reaction. Journal of
food protection, 65(2), 362-366.
Bottero M. T, & Dalmasso A. (2011). Animal species identification in food products:
Evolution of biomolecular methods. The Veterinary Journal, 190, 34-38.
Page 238
214
Bottero, M. T., Civera, T., Nucera, D., Rosati, S., Sacchi, P., & Turi, R. M. (2003). A
multiplex polymerase chain reaction for the identification of cows’, goats’ and
sheep's milk in dairy products. International Dairy Journal, 13(4), 277-282.
Bottero, M. T., & Dalmasso, A. (2011). Animal species identification in food products:
evolution of biomolecular methods. The veterinary journal, 190(1), 34-38.
Bourguiba-Hachemi, S., & Fathallah, M. D. (2016). DNA testing of meat foods raises
issues beyond adulteration. Sky Journal of Food Science, 5(1), 1-7.
Broeders, S., Huber, I., Grohmann, L., Berben, G., Taverniers, I., Mazzara, M., ... &
Morisset, D. (2014). Guidelines for validation of qualitative real-time PCR
methods. Trends in food science & technology, 37(2), 115-126.
Brown, P., Will, R. G., Bradley, R., Asher, D. M., & Detwiler, L. (2001). Bovine
spongiform encephalopathy and variant Creutzfeldt-Jakob disease: background,
evolution, and current concerns. Emerging infectious diseases, 7(1), 6.
Bryner, J. (2021). 13 Animal-to-Human Diseases Kill 2.2 Million People Each Year-Live
Science. (Accessed on DEcember 22, 2016). Retrieved from
http://www.livescience.com/21426-global-zoonoses-diseases-hotspots.html
Buchanan, R. T. (2015). Mad cow disease in the UK: What is BSE and what are the
symptoms? | The Independent. (Accessed on January 24, 2017). Retrieved from
http://www.independent.co.uk/news/uk/home-news/mad-cow-disease-in-the-uk-
what-is-bse-and-what-are-the-symptoms-a6675351.html
Buckenhüskes, H. J. (2015). Kosher Foods-Kosher market – Religious Backgrounds –
CertificationDLG-Expert report 9/2015: Kosher Foods. (Accessed on January 12,
2017). Retrieved from http://2015.dlg.org/fileadmin/downloads/food/
Expertenwissen/Ernaehrung/e_2015_9_Expertenwissen_Kosher.pdf
Buckley, C. (2013). Rat Meat Sold as Lamb Highlights Fear in China. The New York
Times. (Accessed March 04, 2017). Retrieved from http://www.nytimes.com/
2013/05/04/world/asia/rat-meat-sold-as-lamb-in-china-highlights-fears.html
Buzby, J. C., & Chandran, R. (2003). The Belgian dioxin crisis and its effects on
agricultural production and exports. International trade and food safety:
Economic theory and case studies, 125.
Calvo, J., Zaragoza, P., & Osta, R. (2001a). Random amplified polymorphic DNA
fingerprints for identification of species in poultry pate. Poultry Science, 80(4),
522-524.
Calvo, J., Zaragoza, P., & Osta, R. (2001b). Technical note: A quick and more sensitive
method to identify pork in processed and unprocessed food by PCR amplification
of a new specific DNA fragment. Journal of animal science, 79(8), 2108-2112.
Cammà, C., Di Domenico, M., & Monaco, F. (2012). Development and validation of fast
Real-Time PCR assays for species identification in raw and cooked meat
mixtures. Food Control, 23(2), 400-404.
Page 239
215
Carnegie, P. R., Hee, K. P., & Bell, A. W. (1982). Ophidine (β‐alanyl‐L‐3‐methylhistidine,‘balenine’) and other histidine dipeptides in pig muscles and
tinned hams. Journal of the Science of Food and Agriculture, 33(8), 795-801.
Caron, A., Cornelis, D., Foggin, C., Hofmeyr, M., & de Garine-Wichatitsky, M. (2016).
African buffalo movement and zoonotic disease risk across Transfrontier
Conservation Areas, Southern Africa. Emerging infectious diseases, 22(2), 277.
Carrera, E., Terni, M., Montero, A., García, T., González, I., & Martín, R. (2014). ELISA-
based detection of mislabeled albacore (Thunnus alalunga) fresh and frozen fish
fillets. Food and Agricultural Immunology, 25(4), 569-577.
Castle, S. (2013). Nestlé Removes 2 Products in Horse Meat Scandal, The New York
Times. (Accessed March 04, 2017). Retrieved from http://www.nytimes.com/
2013/02/20/world/europe/nestle-pulls-2-products-in-horse-meat-scandal.html
Cawthorn, D.-M., Steinman, H. A., & Hoffman, L. C. (2013). A high incidence of species
substitution and mislabelling detected in meat products sold in South Africa. Food
Control, 32(2), 440-449.
Charlebois, S., & Haratifar, S. (2015). The perceived value of dairy product traceability
in modern society: An exploratory study. Journal of dairy science, 98(5), 3514-
3525.
Charlebois, S., Schwab, A., Henn, R., & Huck, C. W. (2016). Food fraud: An exploratory
study for measuring consumer perception towards mislabeled food products and
influence on selfauthentication intentions. Trends in food science & technology,
50, 211-218.
Che Man, Y. B., Mustafa, S., Khairil Mokhtar, N. F., Nordin, R., & Sazili, A. Q. (2012).
Porcine-specific polymerase chain reaction assay based on mitochondrial d-loop
gene for identification of pork in raw meat. International Journal of Food
Properties, 15(1), 134-144.
Checkoff, P. (2016). Top 10 Pork Producing Countries-Pork Checkoff. (Accessed on
January 10, 2017). Retrieved from http://www.pork.org/pork-quick-
facts/home/stats/u-s-pork-exports/top-10-pork-producing-countries/
Chen, F.-C., & Hsieh, Y. (2000). Detection of pork in heat-processed meat products by
monoclonal antibody-based ELISA. Journal of AOAC International, 83(1), 79-
85.
Chen, F. C., Hsieh, Y. H. P., & Bridgman, R. C. (1998). Monoclonal Antibodies to
Porcine Thermal‐Stable Muscle Protein for Detection of Pork in Raw and Cooked
Meats. Journal of Food Science, 63(2), 201-205.
Chen, S.-Y., Liu, Y.-P., & Yao, Y.-G. (2010). Species authentication of commercial beef
jerky based on PCR-RFLP analysis of the mitochondrial 12S rRNA gene. Journal
of Genetics and Genomics, 37(11), 763-769.
Page 240
216
Cheng, X., He, W., Huang, F., Huang, M., & Zhou, G. (2014). Multiplex real-time PCR
for the identification and quantification of DNA from duck, pig and chicken in
Chinese blood curds. Food Research International, 60, 30-37.
Chuah, L.-O., He, X. B., Effarizah, M. E., Syahariza, Z. A., Shamila-Syuhada, A. K., &
Rusul, G. (2016). Mislabelling of beef and poultry products sold in Malaysia.
Food Control, 62, 157-164.
Cleeland, B. (2009). The Bovine Spongiform Encephalopathy (BSE) Epidemic in the
United Kingdom. International Risk Governance Council, Geneva, Switzerland.
Codex Alimentarius Commission. (2010). Guidelines on performance criteria and
validation of methods for detection, identification and quantification of specific
DNA sequences and specific protiens in foods. CAC/GL, 74-2010.
Compassion. (2017). Pigs, Compassion USA. (Accessed on January 01, 2017).
Retrieved from http://www.ciwf.com/farmanimals/pigs/
Cooper, G. M. (2000). The Cell, A Molecular Approach, 2nd edition.
Covaci, A., Voorspoels, S., Schepens, P., Jorens, P., Blust, R., & Neels, H. (2008). The
Belgian PCB/dioxin crisis—8 years later: An overview. Environmental
Toxicology and Pharmacology, 25(2), 164-170.
Cruz, L. (2010). Recent Developments in the Buffalo Industry of Asia. Revista
Veterinaria, 21(1).
Department of Agriculture and Fisheries. (2016). Zoonoses are diseases that can spread
from animals to people, Queensland Government. (Accessed on December 22,
2016). Retrieved from https://www.daf.qld.gov.au/animal-industries/animal-
health-and-diseases/zoonoses
Dalmasso, A., Fontanella, E., Piatti, P., Civera, T., Rosati, S., & Bottero, M. (2004). A
multiplex PCR assay for the identification of animal species in feedstuffs.
Molecular and Cellular Probes, 18(2), 81-87.
Darling, J. A., & Blum, M. J. (2007). DNA-based methods for monitoring invasive
species: a review and prospectus. Biological Invasions, 9(7), 751-765.
Davidson, J. A. (2003). World Religions and the Vegetarian Diet. Journal of the Adventist
Theological Society, 14(2), 8.
Dewey, T., and Jessica Ng. (2017). ADW: Bos taurus: INFORMATION. (Accessed on
January 01, 2017). Retrieved from http://animaldiversity.org/accounts/
Bos_taurus/
Di Pinto, A., Forte, V., Conversano, M., & Tantillo, G. (2005). Duplex polymerase chain
reaction for detection of pork meat in horse meat fresh sausages from Italian retail
sources. Food Control, 16(5), 391-394.
Page 241
217
Dieffenbach, C., Lowe, T., & Dveksler, G. (1993). General concepts for PCR primer
design. PCR Methods and Applications, 3(3), S30-S37.
do Nascimento, C., de Albuquerque, R. F., Monesi, N., & Candido-Silva, J. A. (2010).
Alternative method for direct DNA probe labeling and detection using the
checkerboard hybridization format. Journal of clinical microbiology, 48(8), 3039-
3040.
Dooley j. j, Helen D. Sage, L., M.-A., Clarke, Helen M. Brown, & Garrett, S. D. (2005).
Fish Species Identification Using PCR-RFLP Analysis and Lab-on-a-Chip
Capillary Electrophoresis: Application to Detect White Fish Species in Food
Products and an Interlaboratory Study. Journal of Agricultural and Food
Chemistry, 53, 3348-3357.
Dooley, J. J., Paine, K. E., Garrett, S. D., & Brown, H. M. (2004). Detection of meat
species using TaqMan real-time PCR assays. Meat Science, 68(3), 431-438.
Doosti, A., Dehkordi, P. G., & Rahimi, E. (2014). Molecular assay to fraud identification
of meat products. Journal of food science and technology, 51(1), 148-152.
Druml, B., Grandits, S., Mayer, W., Hochegger, R., & Cichna-Markl, M. (2015).
Authenticity control of game meat products–A single method to detect and
quantify adulteration of fallow deer (Dama dama), red deer (Cervus elaphus) and
sika deer (Cervus nippon) by real-time PCR. Food Chemistry, 170, 508-517.
Druml, B., Mayer, W., Cichna-Markl, M., & Hochegger, R. (2015). Development and
validation of a TaqMan real-time PCR assay for the identification and
quantification of roe deer (Capreolus capreolus) in food to detect food
adulteration. Food Chemistry, 178, 319-326.
Drummond, M. G., Brasil, B. S. A. F., Dalsecco, L. S., Brasil, R. S. A. F., Teixeira, L.
V., & Oliveira, D. A. A. (2013). A versatile real-time PCR method to quantify
bovine contamination in buffalo products. Food Control, 29(1), 131-137.
EC. (2001). Regulation (EC) No 999/2001 of the European Parliament and of the Council
of 22 May 2001 laying down rules for the prevention, control and eradication of
certain transmissible spongiform encephalopathies. Official Journal of the
European Communities. Retrieved from http://eur-lex.europa.eu/legal-
content/EN/ALL/?uri=CELEX:32001R0999
EC. (2002). Regulation (EC) No 1774/2002 of the European Parliament and of the
Council of 3 October 2002 laying down health rules concerning animal by-
products not intended for human consumption. Official Journal of the European
Communities. Retrieved from http://eur-lex.europa.eu/legal-
content/EN/TXT/?uri=celex%3A32002R1774
EC. (2009). Commission Regulation (EC) No 152/2009 of 27 January 2009 laying down
the methods of sampling and analysis for the official control of feed. Official
Journal of the European Union. Retrieved from http://eur-lex.europa.eu/legal-
content/EN/TXT/?uri=CELEX%3A32009R0152
Page 242
218
Erwanto, Y., Abidin, M., & Rohman, A. (2012). Pig species identification in meatballs
using polymerase chain reaction-restriction fragment length polymorphism for
Halal authentication. International Food Research Journal, 19(3), 901-906.
Evans, A. (2015). The $4.5 billion UK halal food market opportunity. (Accessed on
January 19, 2017). Retrieved from http://www.salaamgateway.com/
en/food/story/the_45_billion_uk_halal_food_market_opportunity-
salaam17122015070748/
Fajardo, V., González, I., Martín, I., Rojas, M., Hernández, P. E., García, T., & Martín,
R. (2008). Real-time PCR for detection and quantification of red deer (Cervus
elaphus), fallow deer (Dama dama), and roe deer (Capreolus capreolus) in meat
mixtures. Meat Science, 79(2), 289-298.
Fajardo, V., González, I., Rojas, M., García, T., & Martín, R. (2010). A review of current
PCR-based methodologies for the authentication of meats from game animal
species. Trends in Food Science & Technology, 21(8), 408-421.
Fang, X., & Zhang, C. (2016). Detection of adulterated murine components in meat
products by TaqMan© real-time PCR. Food Chemistry, 192, 485-490.
FAO. (2014). Meat Consumption. FAO's Animal Production and Health Division: Meat
& Meat Products (Accessed on January 06, 2017) Retrieved from
http://www.fao.org/ag/againfo/themes/en/meat/background.html
FAO. (2015). FAO Statistical Pocketbook 2015, World food and agriculture, Rome:
FAO. (Accessed on January 31, 2017). Retrieved from http://www.fao.org/3/a-
i4691e.pdf
Farag, M., Alagawany, M., Abd El-Hack, M., Tiwari, R., & Dhama, K. (2015).
Identification of different animal species in meat and meat products: trends and
advances. Advances in Animal and Veterinary Sciences, 3(6), 334-346.
Ferri, G., Alu, M., Corradini, B., Licata, M., & Beduschi, G. (2009). Species identification
through DNA “barcodes”. Genetic Testing and Molecular Biomarkers, 13(3),
421-426.
Focke, F., Haase, I., & Fischer, M. (2010). DNA-based identification of spices: DNA
isolation, whole genome amplification, and polymerase chain reaction. Journal of
Agricultural and Food Chemistry, 59(2), 513-520.
FSA. (2004). Food Standard Agency. Denby illegal meat trial: lessons learned from
'Operation Aberdeen. Retrieved from http://tna.europarchive.org/
20130814101929/http://www.food.gov.uk/about-us/how-we-work/our-board/
boardmeetoccasionalpapers/2004/paperinfo03_12_02
FSN. (2015). NC Seafood Firm Sentenced for Mislabeling Imported Shrimp as
'WildCaught'. Food Safety News. (Accessed March 02, 2017) Retrieved from
http://www.foodsafetynews.com/2015/08/nc-seafood-company-sentenced-for-
mislabeling-imported-shrimp-as-wild-caught/#.WLgXIPl97IU
Page 243
219
FSW. (2015). Meat and Poultry Products Recalled for Misbranding, Labeling Problems.
Food Safety News. (Accessed Marct 02, 2017). Retrieved from
http://www.foodsafetynews.com/2015/10/co-firm-recalls-meat-and-poultry-
products-for-misbranding-labeling-problems/#.WLgQbfmGPIU
Garibyan, L., & Avashia, N. (2013). Polymerase chain reaction. Journal of Investigative
Dermatology, 133(3), 1-4.
Gelpí, E., de la Paz, M. P., Terracini, B., Abaitua, I., de la Cámara, A. G., Kilbourne, E.
M., . . . Soldevilla, L. (2002). The Spanish toxic oil syndrome 20 years after its
onset: a multidisciplinary review of scientific knowledge. Environmental health
perspectives, 110(5), 457.
Gentry, A., Clutton-Brock, J., & Groves, C. (2003). Opinion 2027. Usage of 17 specific
names based on wild species which are pre-dated by or contemporary with those
based on domestic animals (Lepidoptera, Osteichthyes, Mammalia): conserved.
Bulletin of Zoological Nomenclature, 60, 81-84.
Germini, A., Zanetti, A., Salati, C., Rossi, S., Forré, C., Schmid, S., & Marchelli, R.
(2004). Development of a seven-target multiplex PCR for the simultaneous
detection of transgenic soybean and maize in feeds and foods. Journal of
Agricultural and Food Chemistry, 52(11), 3275-3280.
GIE. (2016). State of the Global Islamic Economy 2016/17. (Accessed on January 18,
2017). Retrieved from http://www.salaamgateway.com/en/food/story/
report_state_of_the_global_islamic_economy_201617-salaam03102016111130/
Giometti, C. S., Anderson, N. G., & Anderson, N. L. (1979). Muscle protein analysis. I.
High-resolution two-dimensional electrophoresis of skeletal muscle proteins for
analysis of small biopsy samples. Clinical chemistry, 25(11), 1877-1884.
Girish, P., Anjaneyulu, A., Viswas, K., Anand, M., Rajkumar, N., Shivakumar, B., &
Bhaskar, S. (2004). Sequence analysis of mitochondrial 12S rRNA gene can
identify meat species. Meat Science, 66(3), 551-556.
Girish, P., Haunshi, S., Vaithiyanathan, S., Rajitha, R., & Ramakrishna, C. (2013). A
rapid method for authentication of Buffalo (Bubalus bubalis) meat by Alkaline
Lysis method of DNA extraction and species specific polymerase chain reaction.
Journal of food science and technology, 50(1), 141-146.
Girish, P. S., Anjaneyulu, A. S., Viswas, K. N., Shivakumar, B. M., Anand, M., Patel,
M., & Sharma, B. (2005). Meat species identification by polymerase chain
reaction-restriction fragment length polymorphism (PCR-RFLP) of mitochondrial
12S rRNA gene. Meat Sci, 70(1), 107-112.
Goffaux, F., China, B., Dams, L., Clinquart, A., & Daube, G. (2005). Development of a
genetic traceability test in pig based on single nucleotide polymorphism detection.
Forensic science international, 151(2), 239-247.
Page 244
220
GOV.UK. (2013). List of zoonotic diseases-GOV.UK, Public Health England. (Accessed
on January 23, 2017). Retrieved from https://www.gov.uk/government/
publications/list-of-zoonotic-diseases/list-of-zoonotic-diseases
Green, J. M. (1996). Peer reviewed: a practical guide to analytical method
validation. Analytical chemistry, 68(9), 305A-309A.
Green, J., & Giammona, C. (2016). How Halal Food Became a $20 Billion Hit in
America-Bloomberg. (Accessed on January 10, 2017). Retrieved from
https://www.bloomberg.com/news/articles/20160914/americalovesmuslimfoods
omuchforaclashofcivilizations
Griffiths, P. R., & De Haseth, J. A. (2007). Fourier transform infrared spectrometry (Vol.
171): John Wiley & Sons.
Guan, N., Fan, Q., Ding, J., Zhao, Y., Lu, J., Ai, Y., . . . Jiang, L. (2009). Melamine-
contaminated powdered formula and urolithiasis in young children. New England
Journal of Medicine, 360(11), 1067-1074.
Gudnason, H., Dufva, M., Bang, D. D., & Wolff, A. (2007). Comparison of multiple DNA
dyes for real-time PCR: effects of dye concentration and sequence composition
on DNA amplification and melting temperature. Nucleic acids research, 35(19),
e127.
Gupta, R., Rank, D., & Joshi, C. (2011). Single-nucleotide primer extension assay of
mtDNA to authenticate cattle and buffalo meat. Science Asia, 37, 170-173.
Gupta, R., Rank, D., & Joshi, C. (2012). Identification and differentiation of cattle and
buffalo processed meat by duplex-PCR. Buffalo Bulletin, 31(1), 6-11.
Gupta, R., Rank, D. N., & Joshi, C. G. (2011). Duplex-PCR for Identification and
Differentiation of Cattle and Buffalo Processed Meat. Journal of Advanced
Veterinary Research, 1, 13-16.
Gurav, Y. K., Raut, C. G., Yadav, P. D., Tandale, B. V., Sivaram, A., Pore, M. D., . . .
Mishra, A. C. (2011). Buffalopox outbreak in humans and animals in Western
Maharashtra, India. Preventive Veterinary Medicine, 100(3-4), 242-247.
doi:10.1016/j.prevetmed.2011.03.008
GVR. (2017). Halal Food Market Size & Share | Industry Report, 2022. (Accessed on
January 19, 2017). Retrieved from http://www.grandviewresearch.com/industry-
analysis/halal-food-market
Haba, M., Pierna, J. F., Fumière, O., Garrido-Varo, A., Guerrero, J., Pérez-Marín, D., . .
. Baeten, V. (2007). Discrimination of fish bones from other animal bones in the
sedimented fraction of compound feeds by near infrared microscopy. Journal of
Near Infrared Spectroscopy, 15(2), 81.
HAC. (2017). Halal Market Overview | Halal Accreditation Council. (Accessed on
January 20, 2017). Retrieved from http://www.hac.lk/node/2619
Page 245
221
Hadjinicolaou, A. V., Demetriou, V. L., Emmanuel, M. A., Kakoyiannis, C. K., &
Kostrikis, L. G. (2009). Molecular beacon-based real-time PCR detection of
primary isolates of Salmonella Typhimurium and Salmonella Enteritidis in
environmental and clinical samples. BMC microbiology, 9(1), 97.
Hadrys, H., Balick, M., & Schierwater, B. (1992). Applications of random amplified
polymorphic DNA (RAPD) in molecular ecology. Molecular ecology, 1(1), 55-
63.
Haider, N., Nabulsi, I., & Al-Safadi, B. (2012). Identification of meat species by PCR-
RFLP of the mitochondrial COI gene. Meat Science, 90(2), 490-493.
Hajibabaei, M., Smith, M., Janzen, D. H., Rodriguez, J. J., Whitfield, J. B., & Hebert, P.
D. (2006). A minimalist barcode can identify a specimen whose DNA is degraded.
Molecular Ecology Notes, 6(4), 959-964.
Halalce. (2017). Importance of Halal Diet-Halal Certification Europe. (Accessed on
January 14, 2017). Retrieved from http://www.tmfb.net/whatishalal/
importanceofhalaldiet
Halliday, J. E., Allan, K. J., Ekwem, D., Cleaveland, S., Kazwala, R. R., & Crump, J. A.
(2015). Endemic zoonoses in the tropics: a public health problem hiding in plain
sight. Veterinary Record, 176(9), 220-225.
Hanzaee, K. H., & Ramezani, M. R. (2011). Intention to halal products in the world
markets. Interdisciplinary Journal of Research in Business, 1(5), 1-7.
Haunshi, S., Basumatary, R., Girish, P., Doley, S., Bardoloi, R., & Kumar, A. (2009).
Identification of chicken, duck, pigeon and pig meat by species-specific markers
of mitochondrial origin. Meat Science, 83(3), 454-459.
He, H., Hong, X., Feng, Y., Wang, Y., Ying, J., Liu, Q., . . . Wang, D. (2015). Application
of Quadruple Multiplex PCR Detection for Beef, Duck, Mutton and Pork in Mixed
Meat. Journal of Food and Nutrition Research, 3(6), 392-398.
He, Q., Marjamäki, M., Soini, H., Mertsola, J., & Viljanen, M. (1994). Primers are
decisive for sensitivity of PCR. Biotechniques, 17(1), 82, 84, 86-87.
Herrero, B., Royo, L. J., Lago, F. C., Vieites, J. M., & Espiñeira, M. (2013).
Authentication of male beef by multiplex fast real-time PCR. Food Additives &
Contaminants: Part A, 30(2), 218-225.
HexaResearch. (2016). Halal Food Market Size, Share & Trends Analysis Report, 2014-
Hexa Research. (Accessed on January 10, 2017). Retrieved from
https://www.hexaresearch.com/research-report/global-halal-food-market
Hird, H., Chisholm, J., Sánchez, A., Hernandez, M., Goodier, R., Schneede, K., . . .
Popping, B. (2006). Effect of heat and pressure processing on DNA fragmentation
and implications for the detection of meat using a real-time polymerase chain
reaction. Food Additives and Contaminants, 23(7), 645-650.
Page 246
222
Hird, H., Lloyd, J., Goodier, R., Brown, J., & Reece, P. (2003). Detection of peanut using
real-time polymerase chain reaction. European Food Research and Technology,
217(3), 265-268.
HKTDC. (2014). Malaysia: marketing to Muslim consumers. (Accessed on February 08,
2017). Retrieved from http://economists-pick-research.hktdc.com/business-
news/article/Research-Articles/Malaysia-marketing-to-Muslim-consumers/rp/en/
1/1X000000/1X09XTD8.htm
Hou, B., Meng, X., Zhang, L., Guo, J., Li, S., & Jin, H. (2015). Development of a sensitive
and specific multiplex PCR method for the simultaneous detection of chicken,
duck and goose DNA in meat products. Meat Science, 101, 90-94.
Hsieh, Y.-H. P., & Bridgman, R. C. (2004). Monoclonal antibody–based sandwich
enzyme-linked immunosorbent assay for sensitive detection of prohibited
ruminant proteins in feedstuffs. Journal of Food Protection®, 67(3), 544-549.
Hsieh, Y.-H. P., Woodward, B. B., & Ho, S.-H. (1995). Detection of species substitution
in raw and cooked meats using immunoassays. Journal of food protection, 58(5),
555-559.
Hsieh, Y.-W., & Hwang, D.-F. (2004). Molecular phylogenetic relationships of puffer
fish inferred from partial sequences of cytochrome b gene and restriction fragment
length polymorphism analysis. Journal of Agricultural and Food Chemistry,
52(13), 4159-4165.
Hsu, Y. C., Pestka, J., & Smith, D. (1999). ELISA to quantify triose phosphate isomerase
to potentially determine processing adequacy in ground beef. Journal of Food
Science, 64(4), 623-628.
Huang, F., Haqshenas, G., Guenette, D., Halbur, P., Schommer, S., Pierson, F., . . . Meng,
X. (2002). Detection by reverse transcription-PCR and genetic characterization of
field isolates of swine hepatitis E virus from pigs in different geographic regions
of the United States. Journal of clinical microbiology, 40(4), 1326-1332.
Hulland, T. J. (1993). Muscle and tendon. Pathology of domestic animals, 1, 183-265.
Ilhak, O. I., & Arslan, A. (2007). Identification of meat species by polymerase chain
reaction (PCR) technique. Turkish Journal of Veterinary and Animal Sciences,
31(3), 159-163.
Iwobi, A., Sebah, D., Kraemer, I., Losher, C., Fischer, G., Busch, U., & Huber, I. (2015).
A multiplex real-time PCR method for the quantification of beef and pork
fractions in minced meat. Food Chemistry, 169, 305-313.
Jayalal, R. (2015). Kosher Certification Helps Increase Market Share-STAR-K.
(Accessed on January 13, 2017). Retrieved from http://www.stark.org/articles/
news/3304/koshercertificationhelpsincreasemarketshare/
Page 247
223
Jeddah. (2011). Opinion: Halal food products: Lucrative business amid strong demand.
(Accessed on November 21, 2016). Retrieved from http://halalfocus.net/
opinionhalalfoodproductslucrativebusinessamidstrongdemand/
Jeddah, M. (2005). Product Market Study: Marketing of Halal Products in Saudi Arabia.
(Accessed on January 19, 2017). Retrieved from
http://www.salaamgateway.com/en/food/story/product_market_study_marketing
_of_halal_products_in_saudi_arabia-salaam13092015081719/
Jia, C., & Jukes, D. (2013). The national food safety control system of China–a systematic
review. Food Control, 32(1), 236-245.
Journo, L. J., & Salmon, D. G. (2013). Halal Food Market France - GAIN reports.
(Accessed on January 19, 2017). Retrieved from https://gain.fas.usda.gov/
Recent%20GAIN%20Publications/Halal%20Food%20Market_Paris_France_11
-15-2013.pdf
Judaism. (2016). Judaism 101: Kashrut: Jewish Dietary Laws. (Accessed on January 12,
2017). Retrieved from http://www.jewfaq.org/kashrut.htm
Karabasanavar, N. S., Singh, S., Umapathi, V., Girish, P. S., Shebannavar, S. N., &
Kumar, D. (2011a). Authentication of carabeef (water buffalo, Bubalus bubalis)
using highly specific polymerase chain reaction. European Food Research and
Technology, 233(6), 985-989.
Karabasanavar, N. S., Singh, S., Umapathi, V., Kumar, D., Patil, G., & Shebannavar, S.
N. (2011b). A highly specific PCR assay for identification of raw and heat treated
mutton (Ovis aries). Small Ruminant Research, 100(2), 153-158.
Karabasanavar, N. S., Singh, S. P., Kumar, D., & Shebannavar, S. N. (2014). Detection
of pork adulteration by highly-specific PCR assay of mitochondrial D-loop. Food
Chemistry, 145, 530-534.
Kats-korner. (2017). Brucellosis, buffalo and lies from Montana. (Accessed on January
24, 2017). Retrieved from http://www.kats-korner.com/animals/buffalo/
brucellosis.html
Kennedy, J., Delaney, L., McGloin, A., & Wall, P. G. (2009). Public perceptions of the
dioxin crisis in Irish pork.
KhaleejTimes. (2014). Dubai to set up halal food accreditation centre-Khaleej Times.
(Accessed on January 19, 2017). Retrieved from http://www.khaleejtimes.com/
business/local/dubai-to-set-up-halal-food-accreditation-centre
KingCounty. (2016). Diseases from pigs-King County. (Accessed on January 25, 2017).
Retrieved from http://www.kingcounty.gov/depts/health/communicable-
diseases/zoonotic/facts-resources/diseases-by-animal/pigs.aspx
Kitpipit, T., Sittichan, K., & Thanakiatkrai, P. (2014). Direct-multiplex PCR assay for
meat species identification in food products. Food Chemistry, 163, 77-82.
Page 248
224
KLBD. (2017). Kosher market information brought to you by KLBD The kosher
certification experts. (Accessed on January 12, 2017). Retrieved from
http://www.in.klbdkosher.org/koshermarketfinancials.php
Koh, M., Lim, C., Chua, S., Chew, S., & Phang, S. (1998). Random amplified
polymorphic DNA (RAPD) fingerprints for identification of red meat animal
species. Meat Science, 48(3-4), 275-285.
Köppel, R., Daniels, M., Felderer, N., & Brünen-Nieweler, C. (2013). Multiplex real-time
PCR for the detection and quantification of DNA from duck, goose, chicken,
turkey and pork. European Food Research and Technology, 236(6), 1093-1098.
Köppel, R., Ruf, J., & Rentsch, J. (2011). Multiplex real-time PCR for the detection and
quantification of DNA from beef, pork, horse and sheep. European Food
Research and Technology, 232(1), 151-155.
Köppel, R., Ruf, J., Zimmerli, F., & Breitenmoser, A. (2008). Multiplex real-time PCR
for the detection and quantification of DNA from beef, pork, chicken and turkey.
European Food Research and Technology, 227(4), 1199-1203.
Kowitt, B. (2016). Analysis of Burger Market Finds Unwanted Ingredients: Rat and
Human DNA. Retrieved from http://fortune.com/2016/05/10/burger-market-
analysis-rat-human-dna/
Kramer, M. F., & Coen, D. M. (2001). Enzymatic amplification of DNA by PCR:
standard procedures and optimization. Current protocols in toxicology, A. 3C. 1-
A. 3C. 14.
Kreuz, G., Zagon, J., Broll, H., Bernhardt, C., Linke, B., & Lampen, A. (2012).
Immunological detection of osteocalcin in meat and bone meal: a novel heat stable
marker for the investigation of illegal feed adulteration. Food Additives &
Contaminants: Part A, 29(5), 716-726.
Krishnakumar, P. K., & Bureau, E. (2015). India to reign as the top buffalo meat exporter
in 2016: USDA report. (Accessed on January 08, 2017). Retrieved from
http://economictimes.indiatimes.com/industry/cons-products/food/india-to-reign
-as-the-top-buffalo-meat-exporter-in-2016-usda-report/articleshow/
49841561.cms
Kumar, D., Singh, S., Karabasanavar, N. S., Singh, R., & Umapathi, V. (2014).
Authentication of beef, carabeef, chevon, mutton and pork by a PCR-RFLP assay
of mitochondrial cytb gene. Journal of food science and technology, 51(11), 3458-
3463.
Kumar, D., Singh, S., Singh, R., & Karabasanavar, N. S. (2011a). A highly specific PCR
assay for identification of goat (Capra hircus) meat. Small Ruminant Research,
97(1), 76-78.
Kumar, N. S., & Gurusubramanian, G. (2011b). Random amplified polymorphic DNA
(RAPD) markers and its applications. Science Vision, 11(3), 116-124.
Page 249
225
Kunz, B. A., & Kohalmi, S. E. (1991). Modulation of mutagenesis by
deoxyribonucleotide levels. Annual review of genetics, 25(1), 339-359.
Kwok, S., Kellogg, D., McKinney, N., Spasic, D., Goda, L., Levenson, C., & Sninsky, J.
(1990). Effects of primer-template mismatches on the polymerase chain reaction:
human immunodeficiency virus type 1 model studies. Nucleic Acids Research,
18(4), 999-1005.
La Neve, F., Civera, T., Mucci, N., & Bottero, M. T. (2008). Authentication of meat from
game and domestic species by SNaPshot minisequencing analysis. Meat Science,
80(2), 216-224.
Labs, C. (2016). He Hamburger Report. Retrieved from https://www.clearlabs.com/
reports/the-hamburger-report
Lago, F. C., Herrero, B., Madriñán, M., Vieites, J. M., & Espiñeira, M. (2011).
Authentication of species in meat products by genetic techniques. European Food
Research and Technology, 232(3), 509-515.
Lau, C. H., Drinkwater, R. D., Yusoff, K., Tan, S. G., Hetzel, D. J., & Barker, J. S. F.
(1998). Genetic diversity of Asian water buffalo (Bubalus bubalis): mitochondrial
DNA D‐loop and cytochrome b sequence variation. Animal Genetics, 29(4), 253-
264.
Lee, P. Y., Costumbrado, J., Hsu, C.-Y., & Kim, Y. H. (2012). Agarose gel
electrophoresis for the separation of DNA fragments. Journal of Visualized
Experiments, (62), e3923-e3923.
Lever, J., Puig della Bellacasa, M., Miele, M., & Higgin, M. (2010). From the
slaughterhouse to the consumer: transparency and information in the distribution
of Halal and Kosher meat.
Liu, L., Chen, F. C., Dorsey, J. L., & Hsieh, Y. H. P. (2006). Sensitive Monoclonal
Antibody‐based Sandwich ELISA for the Detection of Porcine Skeletal Muscle in
Meat and Feed Products. Journal of Food Science, 71(1).
López-Calleja, I. M., de la Cruz, S., González, I., García, T., & Martín, R. (2016). Duplex
real-time PCR using TaqMan® for the detection of sunflower (Helianthus annuus)
and poppy (Papaver rhoeas) in commercial food products. LWT-Food Science and
Technology, 65, 999-1007.
Luo, A., Zhang, A., Ho, S. Y., Xu, W., Zhang, Y., Shi, W., . . . Zhu, C. (2011). Potential
efficacy of mitochondrial genes for animal DNA barcoding: a case study using
eutherian mammals. BMC genomics, 12(1), 84.
Luo, J.-Q., Wang, J.-Q., Bu, D.-P., Dan, L., Li, W., Wei, H.-Y., & Zhou, L.-Y. (2008).
Development and application of a PCR approach for detection of bovis, sheep,
pig, and chicken derived materials in feedstuff. Agricultural Sciences in China,
7(10), 1260-1266.
Page 250
226
Macedo-Silva, A., Barbosa, S., Alkmin, M., Vaz, A., Shimokomaki, M., & Tenuta-Filho,
A. (2000). Hamburger meat identification by dot-ELISA. Meat Science, 56(2),
189-192.
Maede, D. (2006). A strategy for molecular species detection in meat and meat products
by PCR-RFLP and DNA sequencing using mitochondrial and chromosomal
genetic sequences. European Food Research and Technology, 224(2), 209-217.
Mafra, I., Ferreira, I. M. P. L. V. O., & Oliveira, M. B. P. P. (2007). Food authentication
by PCR-based methods. European Food Research and Technology, 227(3), 649-
665.
Man, Y. C., Aida, A., Raha, A., & Son, R. (2007). Identification of pork derivatives in
food products by species-specific polymerase chain reaction (PCR) for halal
verification. Food Control, 18(7), 885-889.
Mane, B., Mendiratta, S., Tiwari, A., & Bhilegaokar, K. (2012). Detection of adulteration
of meat and meat products with buffalo meat employing polymerase chain
reaction assay. Food Analytical Methods, 5(2), 296-300.
Mane, B. G., Mendiratta, S. K., & Tiwari, A. K. (2012). Beef specific polymerase chain
reaction assay for authentication of meat and meat products. Food Control, 28(2),
246-249.
Markoulatos, P., Siafakas, N., & Moncany, M. (2002). Multiplex polymerase chain
reaction: a practical approach. Journal of clinical laboratory analysis, 16(1), 47-
51.
Marquer, P., Rabade, T., & Forti, R. (2015). Meat production statistics, Eurostate.
Retrieved from http://ec.europa.eu/eurostat/statisticsexplained/index.php/
Meat_production_statistics
Martin, D. R., Chan, J., & Chiu, J. Y. (1998). Quantitative evaluation of pork adulteration
in raw ground beef by radial immunodiffusion and enzyme-linked immunosorbent
assay. Journal of food protection, 61(12), 1686-1690.
Martín, R., Azcona, J. I., Casas, C., Hernández, P. E., & Sanz, B. (1988). Sandwich
ELISA for detection of pig meat in raw beef using antisera to muscle soluble
proteins. Journal of Food Protection, 51(10), 790-798.
Martinez, I., & Jakobsen Friis, T. (2004). Application of proteome analysis to seafood
authentication. Proteomics, 4(2), 347-354.
Martinez, I., & Yman, I. M. (1998). Species identification in meat products by RAPD
analysis. Food Research International, 31(6), 459-466.
Matsunaga, T., Chikuni, K., Tanabe, R., Muroya, S., Shibata, K., Yamada, J., &
Shinmura, Y. (1999). A quick and simple method for the identification of meat
species and meat products by PCR assay. Meat Science, 51(2), 143-148.
Page 251
227
Matthew, S. (2015). Father is beaten to death with bricks by Indian mob and his son is
left fighting for life after rumours circulate he’d eaten beef… but it was actually
lamb. Mail Online. (Accessed March 04, 2017). Retrieved from http://www.
dailymail.co.uk/news/article-3254623/Father-beaten-death-bricks-Indian-mob-
son-left-fighting-life-rumours-circulate-d-eaten-beef-actually-lamb.html
MBF. (2002). Misbranded Food. Retrieved Retrieved 24 Dec 2016, from Federal Food,
Drug, and Cosmetic Act, United State https://www.epw.senate.gov/FDA_001.pdf
McDaniel, C. J., Cardwell, D. M., Moeller, R. B., & Gray, G. C. (2014). Humans and
cattle: a review of bovine zoonoses. Vector-Borne and Zoonotic Diseases, 14(1),
1-19.
Meyer-Rochow, V. B. (2009). Food taboos: their origins and purposes. Journal of
Ethnobiology and Ethnomedicine, 5(1), 1.
MIHAS. (2013). Global Halal Traders Gather in Malaysia for MIHAS 2013. (Accessed
on November 21, 2016). Retrieved from http://halalfocus.net/
globalhalaltradersgatherinmalaysiaamidmuslimpopulationgrowth/
Mintel. (2009). 3 in 5 kosher food buyers purchase for food quality, not religion.
(Accessed on January 12, 2017). Retrieved from http://www.mintel.com/
presscentre/foodanddrink/3in5kosherfoodbuyerspurchaseforfoodqualitynotreligi
on
Mohamad, N. A., El Sheikha, A. F., Mustafa, S., & Mokhtar, N. F. K. (2013). Comparison
of gene nature used in real-time PCR for porcine identification and quantification:
A review. Food Research International, 50(1), 330-338.
Mohamed, Y. H., Rahim, A. R. A., Ma’ram, A. B., & Ghazli, M. (2016). Halal
Traceability in Enhancing Halal Integrity for Food Industry in Malaysia–A
Review. International Research Journal of Engineering and Technology, 3(03),
68-74.
Molenkamp, R., van der Ham, A., Schinkel, J., & Beld, M. (2007). Real-Time Multiplex
PCR of five Different DNA Targets Using the LightCycler® 480 System.
Biochemica-Mannheim, 3, 15.
Morin, P., Hedrick, N., Robertson, K., & Leduc, C. (2007). Comparative mitochondrial
and nuclear quantitative PCR of historical marine mammal tissue, bone, baleen,
and tooth samples. Molecular Ecology Resources, 7(3), 404-411.
Morrow, W. E. M., & Langley, R. (2017). Protecting Yourself from Pig Diseases, North
Carolina State University. (Accessed on January 25, 2017). Retrieved from
https://projects.ncsu.edu/project/swine_extension/healthyhogs/book1999/morro
w.htm
MS. (2009). Malaysian Standard, Halal Food - Production, Preparation, Handling and
Storage - General Guidelines (Second Revision), Department of Standards
Malaysia. (Accessed on January 12, 2017) Retrieved from
https://law.resource.org/pub/my/ibr/ ms.1500.2009.pdf
Page 252
228
Murugaiah, C., Noor, Z. M., Mastakim, M., Bilung, L. M., Selamat, J., & Radu, S. (2009).
Meat species identification and Halal authentication analysis using mitochondrial
DNA. Meat Science, 83(1), 57-61.
Mutalib, S. A., Nazri, W. S. W., Shahimi, S., Yaakob, N., Sani, N. A., Abdullah, A., . . .
Ghani, M. A. (2012). Comparison between pork and wild boar meat (Sus scrofa)
by polymerase chain reaction-restriction fragment length polymorphism (PCR-
RFLP). Sains Malaysiana, 41(2), 199-204.
Napolitano, F., Annicchiarico, G., Catillo, G., Crisà, A., Grandoni, F., Marchitelli, C., &
Moioli, B. (2014). Identification of Ovis aries Gelsolin isoform b, a candidate
gene for milk quality. Small Ruminant Research, 116(1), 21-27.
Natonek-Wiśniewska, M., Krzyścin, P., & Piestrzyńska-Kajtoch, A. (2013). The species
identification of bovine, porcine, ovine and chicken components in animal meals,
feeds and their ingredients, based on COX I analysis and ribosomal DNA
sequences. Food Control, 34(1), 69-78.
Nebola, M., Borilova, G., & Kasalova, J. (2010). PCR-RFLP analysis of DNA for the
differentiation of fish species in seafood samples. Bulletin of the Veterinary
Institute in Pulawy, 54, 49-53.
Nejad, F. P., Tafvizi, F., Ebrahimi, M. T., & Hosseni, S. E. (2014). Optimization of
multiplex PCR for the identification of animal species using mitochondrial genes
in sausages. European Food Research and Technology, 239(3), 533-541.
Newshalal. (2016). Halal market sector to reach 3.7 trn US Dollar by 2019: Islamic
Economy Report. (Accessed on January 18, 2017). Retrieved from
http://newshalal.com/article/261/market
Nikfarjam, A. (2016). Halal food An important issue in global food industry Azadeh
Nikfarjam. (Accessed on January 18, 2017). Retrieved from
http://docplayer.net/20856732-Halal-food-an-important-issue-in-global-food-
industry-azadeh-nikfarjam.html
North, R. (2013). EU Referendum, Horsemeat fraud: food fraud and the EU. Retrieved
from http://www.eureferendum.com/blogview.aspx?blogno=83616
OECD. (2017a). Meat-Organisation for Economic Cooperation and Development.
(Accessed on Jnuary 07, 2017). Retrieved from
http://www.agrioutlook.org/commodityanalysis/meat/
OECD. (2017b). Meat consumption (indicator). doi:10.1787/fa290fd0-en (Accessed on
03 January 2017). Retrieved from https://data.oecd.org/agroutput/meat-
consumption.htm
OECD/FAO. (2016). “Meat”, in OECD-FAO Agricultural Outlook 2016-2025, OECD
Publishing, Paris. (Accessed on January 26, 2017). Retrieved from
http://dx.doi.org/10.1787/agr_outlook-2016-10-en
Page 253
229
Okuma, T. A., & Hellberg, R. S. (2015). Identification of meat species in pet foods using
a real-time polymerase chain reaction (PCR) assay. Food Control, 50, 9-17.
Oliveira, C. F. d., Paim, T. G. d. S., Reiter, K. C., Rieger, A., & D'azevedo, P. A. (2014).
Evaluation of four different DNA extraction methods in coagulase-negative
Staphylococci clinical isolates. Revista do Instituto de Medicina Tropical de São
Paulo, 56(1), 29-33.
Park, J.-K., Shin, K.-H., Shin, S.-C., Chung, K.-Y., & Chung, E.-R. (2007). Identification
of meat species using species-specific PCR-RFLP fingerprint of mitochondrial
12S rRNA gene. Korean Journal for Food Science of Animal Resources, 27(2),
209-215.
Pereira, F., Carneiro, J., & Amorim, A. (2008). Identification of species with DNA-based
technology: current progress and challenges. Recent patents on DNA & gene
sequences, 2(3), 187-200.
Perestam, A. T., Fujisaki, K. K., Nava, O., & Hellberg, R. S. (2017). Comparison of real-
time PCR and ELISA-based methods for the detection of beef and pork in
processed meat products. Food Control, 71, 346-352.
PewResearch. (2011). The Future of the Global Muslim Population | Pew Research
Center. (Accessed on January 20, 2017). Retrieved from
http://www.pewforum.org/2011/01/27/the-future-of-the-global-muslim-
population/
Pimentel, D., & Pimentel, M. (2003). Sustainability of meat-based and plant-based diets
and the environment. The American journal of clinical nutrition, 78(3), 660S-
663S.
Pischetsrieder, M., & Baeuerlein, R. (2009). Proteome research in food science. Chemical
Society Reviews, 38(9), 2600-2608.
Pokhrel, P. (2015). ELISA- Principle, Types and Applications, Microbiology Note.
(Accessed on February, 2017). Retrieved from
http://www.microbiologynotes.com/elisa-principle-types-and-applications/
Przyrembel, H. (2004). Food labelling legislation in the EU and consumers information.
Trends in Food Science & Technology, 15(7), 360-365.
QLD.GOV. (2016). Brucellosis, Diseases and disorders of animals, Business and Industry
Portal, Queensland Government. (Accessed on January 24, 2017). Retrieved
from https://www.business.qld.gov.au/industry/agriculture/species/diseases-
disorders/animals/brucella-suis
Rahman, M. M. (2015a). Development of canine biomerker based detection and
quantification assays for determining food adulteration and halal authentication.
(Doctoral dissertation), University of Malaya, Kuala Lumpur, Malayasia.
Rahman, M. M., Ali, M. E., Hamid, S. B., Mustafa, S., Hashim, U., & Hanapi, U. K.
(2014). Polymerase chain reaction assay targeting cytochrome b gene for the
Page 254
230
detection of dog meat adulteration in meatball formulation. Meat Science, 97(4),
404-409.
Rahman, M. M., Ali, M. E., Hamid, S. B. A., Bhassu, S., Mustafa, S., Al Amin, M., &
Razzak, M. A. (2015b). Lab-on-a-chip PCR-RFLP assay for the detection of
canine DNA in burger formulations. Food Analytical Methods, 8(6), 1598-1606.
Ramadan, H. A. (2011). Sequence of specific mitochondrial 16S rRNA gene fragment
from Egyptian buffalo is used as a pattern for discrimination between river
buffaloes, cattle, sheep and goats. Molecular biology reports, 38(6), 3929-3934.
Rashid, N. R. (2015a). Development of short amplicon-length PCR-RFLP assay for the
detection of Macaca fascicularis meat under complex matrices/Nur Raifana binti
Abdul Rashid. (Master of Phyloshophy ), University of Malaya.
Rashid, N. R., Ali, M. E., Hamid, S. B., Rahman, M. M., Razzak, M. A., Asing, & Amin,
M. A. (2015b). A suitable method for the detection of a potential fraud of bringing
macaque monkey meat into the food chain. Food Addit Contam Part A Chem Anal
Control Expo Risk Assess, 32(7), 1013-1022.
Rasid, A. H. (2016). Global halal market growing bigger-New Straits Times-Malaysia
General Business Sports and Lifestyle News. (Accessed on January 10, 2017).
Retrieved from http://www.nst.com.my/news/2016/02/127261/
globalhalalmarketgrowingbigger
Razzak, M. (2015). Development of multiplex PCR assay for the detection of five non-
halal species in Islamic foods/Md. Abdur Razzak. (Master of Phyloshophy),
University of Malaya.
Razzak, M. A., Hamid, S. B. A., & Ali, M. E. (2015). A lab-on-a-chip-based multiplex
platform to detect potential fraud of introducing pig, dog, cat, rat and monkey
meat into the food chain. Food Additives & Contaminants: Part A, 32(11), 1902-
1913.
Rea, S., Chikuni, K., Branciari, R., Sangamayya, R. S., Ranucci, D., & Avellini, P. (2002).
Use of duplex polymerase chain reaction (duplex-PCR) technique to identify
bovine and water buffalo milk used in making mozzarella cheese. Journal of
Dairy Research, 68(04), 689-698.
Regenstein, J., Chaudry, M., & Regenstein, C. (2003). The kosher and halal food laws.
Comprehensive reviews in food science and food safety, 2(3), 111-127.
Reid, L. M., O'donnell, C. P., & Downey, G. (2006). Recent technological advances for
the determination of food authenticity. Trends in food science & technology,
17(7), 344-353.
Renčová, E., Svoboda, I., & Necidova, L. (2000). Identification by ELISA of poultry,
horse, kangaroo, and rat muscle specific proteins in heat-processed products.
Veterinarni Medicina, 45(12), 353-356.
Page 255
231
Reshanov, A. (2008). 2008 milk scandal: A new twist in China’s toxic tale. Retrieved
from http://earthsky.org/human-world/2008-milk-scandal-a-new-twist-in-chinas-
toxic-tale
Reubold, T. (2015). These maps show changes in global meat consumption by 2024.
Here’s why that matters. Ensia. Retrieved from https://ensia.com/articles/
thesemapsshowchangesinglobalmeatconsumptionby2024hereswhythatmatters/
Richardson, H. (2013). Horsemeat found in some school dinners. BBC News. Retrieved
from http://www.bbc.com/news/education-21475337
Rickard, G., & Book, I. (1999). Bovids:useful ruminants. In Investigating God's world
(3rd ed.). Pensacola, Fla.: A Beka Book.
Robert-Gangneux, F., & Dardé, M.-L. (2012). Epidemiology of and diagnostic strategies
for toxoplasmosis. Clinical microbiology reviews, 25(2), 264-296.
Rodríguez, M. A., García, T., González, I., Asensio, L., Hernández, P. E., & Martín, R.
(2004). PCR identification of beef, sheep, goat, and pork in raw and heat-treated
meat mixtures. Journal of Food Protection®, 67(1), 172-177.
Rohman, A., Erwanto, Y., & Man, Y. B. C. (2011). Analysis of pork adulteration in beef
meatball using Fourier transform infrared (FTIR) spectroscopy. Meat Science,
88(1), 91-95.
Rojas, M., González, I., García, T., Hernández, P. E., & Martín, R. (2012). Authentication
of meat and commercial meat products from common pigeon (Columba livia)
woodpigeon (Columba palumbus) and stock pigeon (Columba oenas) using a
TaqMan® real-time PCR assay. Food Control, 23(2), 369-376.
Rojas, M., González, I., Pavón, M. Á., Pegels, N., Hernández, P. E., García, T., & Martín,
R. (2011). Application of a real-time PCR assay for the detection of ostrich
(Struthio camelus) mislabelling in meat products from the retail market. Food
Control, 22(3), 523-531.
Rojas, M., González, I., Pavón, M. Á., Pegels, N., Lago, A., Hernandez, P. E., . . . Martín,
R. (2010). Novel TaqMan real-time polymerase chain reaction assay for verifying
the authenticity of meat and commercial meat products from game birds. Food
Additives and Contaminants, 27(6), 749-763.
Rokas, A., Ladoukakis, E., & Zouros, E. (2003). Animal mitochondrial DNA
recombination revisited. Trends in Ecology & Evolution, 18(8), 411-417.
Lopparelli, R. M., Cardazzo, B., Balzan, S., Giaccone, V., & Novelli, E. (2007). Real-
time TaqMan polymerase chain reaction detection and quantification of cow DNA
in pure water buffalo mozzarella cheese: method validation and its application on
commercial samples. Journal of agricultural and food chemistry, 55(9), 3429-
3434.
Page 256
232
Rousseau, O. (2016). Food trends: meat consumption up, beef declines, . Retrieved from
http://www.globalmeatnews.com/Analysis/Foodtrendsmeatconsumptionupbeefd
eclines
Rychlik, W., Spencer, W., & Rhoads, R. (1990). Optimization of the annealing
temperature for DNA amplification in vitro. Nucleic Acids Research, 18(21),
6409-6412.
Safdar, M., & Abasıyanık, M. F. (2013). Development of fast multiplex real-time PCR
assays based on EvaGreen fluorescence dye for identification of beef and soybean
origins in processed sausages. Food Research International, 54(2), 1652-1656.
Safdar, M., & Junejo, Y. (2015). A multiplex-conventional PCR assay for bovine, ovine,
caprine and fish species identification in feedstuffs: Highly sensitive and specific.
Food Control, 50, 190-194.
Safdar, M., Junejo, Y., Arman, K., & Abasıyanık, M. (2014). Rapid bovine and caprine
species identification in ruminant feeds by duplex real-time PCR melting curve
analysis using EvaGreen fluorescence dye. Molecular biotechnology, 56(8), 770-
776.
Safdar, M., Junejo, Y., Arman, K., & Abasiyanik, M. F. (2014). A highly sensitive and
specific tetraplex PCR assay for soybean, poultry, horse and pork species
identification in sausages: development and validation. Meat Science, 98(2), 296-
300.
Sakaridis, I., Ganopoulos, I., Argiriou, A., & Tsaftaris, A. (2013). A fast and accurate
method for controlling the correct labeling of products containing buffalo meat
using High Resolution Melting (HRM) analysis. Meat Science, 94(1), 84-88.
Salama. (2011). Opinion: Halal food products: Lucrative business amid strong demand.
(Accessed on November 21, 2016). Retrieved from http://halalfocus.net/
opinionhalalfoodproductslucrativebusinessamidstrongdemand/
Samori, Z., Ishak, A. H., & Kassan, N. H. (2014). Understanding the development of halal
food standard: suggestion for future research. International Journal of Social
Science and Humanity, 4(6), 482.
Schochetman, G., Ou, C.-Y., & Jones, W. K. (1988). Polymerase chain reaction. The
Journal of infectious diseases, 158(6), 1154-1157.
Schumm, L. (2014). Food Fraud: A Brief History of the Adulteration of Food. Retrieved
from http://www.history.com/news/hungry-history/food-fraud-a-brief-history-of-
the-adulteration-of-food
Sharma, N., Thind, S., Girish, P., & Sharma, D. (2008). PCR-RFLP of 12S rRNA gene
for meat speciation. Journal of Food Science and Technology-Mysore, 45(4), 353-
355.
Shears, P. (2010). Food fraud–a current issue but an old problem. British Food Journal,
112(2), 198-213.
Page 257
233
Singh, R., Hosamani, M., Balamurugan, V., Satheesh, C., Shingal, K., Tatwarti, S., . . .
Yadav, M. P. (2006). An outbreak of buffalopox in buffalo (Bubalus bubalis)
dairy herds in Aurangabad, India. Revue Scientifique et Technique-Office
International des Epizooties, 25(3), 981-988.
Singh, V., Pathak, V., Nayak, N., Verma, K., & Umaraw, P. (2014). Recent developments
in meat species speciation-a review. Journal of Livestock Science, 5, 49-64.
Smith, D., Desrocher, L., Booren, A., Wang, C., Abouzied, M., Pestka, J., & Veeramuthu,
G. (1996). Cooking temperature of turkey ham affects lactate dehydrogenase,
serum albumin and immunoglobulin G as determined by ELISA. Journal of Food
Science, 61(1), 209-212.
Soares, S., Amaral, J. S., Oliveira, M. B. P., & Mafra, I. (2013). A SYBR Green real-time
PCR assay to detect and quantify pork meat in processed poultry meat products.
Meat Science, 94(1), 115-120.
Solanki, S. (2016). Kosher Food Market : (2016 to 2022) - Current Challenges, Dynamics,
Size, Forecast and Segments. (Accessed on January 13, 2017). Retrieved from
https://www.linkedin.com/pulse/kosher-food-market-2016-2022-current-
challenges-dynamics-solanki
Dudek, S. G. (2013). Nutrition essentials for nursing practice. Lippincott Williams &
Wilkins. ISBN 978-1451186123, page 251.
Szabo, A., Febel, H., Sugar, L., & Romvari, R. (2007). Fatty acid regiodistribution
analysis of divergent animal triacylglycerol samples–a possible approach for
species differentiation. Journal of Food Lipids, 14(1), 62-77.
Taboada, L., Sanchez, A., Velasco, A., Santaclara, F. J., Pérez-Martín, R. I., & Sotelo, C.
G. (2014). Identification of Atlantic cod (Gadus morhua), ling (Molva molva),
and Alaska pollock (Gadus chalcogrammus) by PCR–ELISA using duplex PCR.
Journal of Agricultural and Food Chemistry, 62(24), 5699-5706.
Tähkäpää, S., Maijala, R., Korkeala, H., & Nevas, M. (2015). Patterns of food frauds and
adulterations reported in the EU rapid alert system for food and feed and in
Finland. Food Control, 47, 175-184.
Tamura, K., Peterson, D., Peterson, N., Stecher, G., Nei, M., & Kumar, S. (2011).
MEGA5: molecular evolutionary genetics analysis using maximum likelihood,
evolutionary distance, and maximum parsimony methods. Molecular Biology and
Evolution, 28(10), 2731-2739.
Tan, J. (2013). Chinese police seize more than 20,000kg of fake beef. Yahoo News.
(Accessed March 04, 2017). Retrieved from https://sg.news.yahoo.com/blogs/
what-is-buzzing/chinese-police-seize-more-20-000kg-fake-beef-035448883.html
Taverniers, I., De Loose, M., & Van Bockstaele, E. (2004). Trends in quality in the
analytical laboratory. II. Analytical method validation and quality assurance.
Trends in Analytical Chemistry, 23(8), 535-552.
Page 258
234
Tibda. (2016). Global halal food market estimated to grow 4,44% from 2012 – 2016 –
TIBDA. (Accessed on January 10, 2017). Retrieved from http://www.tibda.ie/
news-2/events/future-events/halal-expo-europe-2016
Times, N. S. (2015). Russia says wrong animal DNA found in Auchan minced meat. New
Straits Times. (Accessed on January 01, 2016). Retrieved from
http://www.nst.com.my/news/2015/09/russia-says-wrong-animal-dna-found-
auchan-minced-meat
Tinbergen, B., & Slump, P. (1976). The detection of chicken meat in meat products by
means of the anserine/carnosine ratio. Zeitschrift für Lebensmitteluntersuchung
und-Forschung A, 161(1), 7-11.
Todar, K. (2008). Control of Microbial Growth. Todar's Online Textbook of Bacteriology.
Ulca, P., Balta, H., Cagin, I., & Senyuva, H. Z. (2013). Meat species identification and
Halal authentication using PCR analysis of raw and cooked traditional Turkish
foods. Meat Science, 94(3), 280-284.
USDA. (2015). Zoonotic Diseases of Sheep and Goats, Animal and Plant Health
Inspection Service, United States Department of Agriculture. (Accessed January
04, 2016). Retrieved from https://www.aphis.usda.gov/aphis/ourfocus
/animalhealth/animal-disease-information/sheep-and-goat-health/national-
scrapie-eradication-program/ct_zoonotic_disease.
Vaithiyanathan, S., & Kulkarni, V. (2016). Species identification of cattle and buffalo fat
through PCR assay. Journal of food science and technology, 53(4), 2077-2082.
Verkaar, E. L. C., Nijman, I. J., Boutaga, K., & Lenstra, J. A. (2002). Differentiation of
cattle species in beef by PCR-RFLP of mitochondrial and satellite DNA. Meat
Science, 60(4), 365-369.
Vernooy, R., Haribabu, E., Muller, M. R., Vogel, J. H., Hebert, P. D., Schindel, D. E., . .
. Singer, G. A. (2010). Barcoding life to conserve biological diversity: beyond the
taxonomic imperative. PLoS Biology, 8(7), e1000417.
Vierstraete, A. (1999). Principle of the PCR. Εκδóσεις University of Ghent. http://users.
ugent. be/~ avierstr/principles/pcr. html.
von Bargen, C., Dojahn, J. r., Waidelich, D., Humpf, H.-U., & Brockmeyer, J. (2013).
New sensitive high-performance liquid chromatography–tandem mass
spectrometry method for the detection of horse and pork in halal beef. Journal of
Agricultural and Food Chemistry, 61(49), 11986-11994.
Walker, M. J., Burns, M., & Burns, D. T. (2013). Horse meat in beef products—species
substitution 2013. Journal of the Association of Public Analysts, 41, 67-106.
Wallace, R. B., Shaffer, J., Murphy, R., Bonner, J., Hirose, T., & Itakura, K. (1979).
Hybridization of synthetic oligodeoxyribonucleotides to ΦX 174 DNA: the effect
of single base pair mismatch. Nucleic Acids Research, 6(11), 3543-3558.
Page 259
235
Wanapat, M., & Chanthakhoun, V. (2015). Buffalo production for emerging market as a
potential animal protein source for global population. International Buffalo
Information Center (IBIC) Buffalo Bulletin, 34(2), 169.
Wilson, D.E.; Reeder, D.M., eds. (2005). "Bos taurus". Mammal Species of the World: A
Taxonomic and Geographic Reference (3rd ed.). Johns Hopkins University
Press. ISBN 978-0-8018-8221-0. OCLC 62265494
Wikipedia. (2016). Buffalo meat -Wikipedia (Accessed on January 04, 2017). Retrieved
from https://en.wikipedia.org/wiki/Buffalo_meat
Wong, C., Lim, A., & Chua, H. (2010). Detection of Meat Contaminants in Processed
Meats Using Polymerase Chain Reaction-Restriction Fragment Length
Polymorphism Analysis. Borneo Science, 27, 15-24.
Wong, E. H.-K., & Hanner, R. H. (2008). DNA barcoding detects market substitution in
North American seafood. Food Research International, 41(8), 828-837.
World Organization for Animal Health. (2009). Principles of validation of diagnostic
assays for infectious diseases. Manual of diagnostic tests and vaccines for
terrestrial animals.
Wu, D. Y., Ugozzoli, L., Pal, B. K., Qian, J., & Wallace, R. B. (1991). The effect of
temperature and oligonucleotide primer length on the specificity and efficiency of
amplification by the polymerase chain reaction. DNA and cell biology, 10(3), 233-
238.
Wu, J. H., Hong, P. Y., & Liu, W. T. (2009). Quantitative effects of position and type of
single mismatch on single base primer extension. Journal of Microbiological
Methods, 77(3), 267-275.
WWI. (2017). Global Meat Production and Consumption Continue to Rise, Wroldwatch
Institute. Retrieved from http://www.worldwatch.org/global-meat-production-
and-consumption-continue-rise
Yang, I., Kim, Y.-H., Byun, J.-Y., & Park, S.-R. (2005). Use of multiplex polymerase
chain reactions to indicate the accuracy of the annealing temperature of thermal
cycling. Analytical Biochemistry, 338(2), 192-200.
Yang, D. Y., Liu, L., Chen, X., Speller, C. F. (2008). Wild or domesticated: DNA analysis
of ancient water buffalo remains from north China. Journal of Archaeological
Science 35: 2778–2785.
Yeboah, G., & Maynard, L. J. (2004). The impact of BSE, FMD, and US export
promotion expenditures on Japanese meat demand. Paper presented at the annual
meeting of AAEA, Denver CO (pp. 1-4).
Yuryev, A. (2007). PCR primer design (Vol. 402): Springer Science & Business Media.
Page 260
236
Zha, D.-M., Xiu-Mei Xing , & Yang, F.-H. (2011). Rapid identification of deer products
by multiplex PCR assay. Food Chemistry, 129, 1904–1908.
Zha D, Xing X, & Yang F. (2010). A multiplex PCR assay for fraud identification of deer
products. Food Control, 21, 1402–1407.
Zha, D., Xing, X., & Yang, F. (2010). A multiplex PCR assay for fraud identification of
deer products. Food Control, 21(10), 1402-1407.
Zhang, C. (2013). Semi-nested multiplex PCR enhanced method sensitivity of spe- cies
detection in further-processed meats. Food Control, 31(2), 326e330
Page 261
237
LIST OF PUBLICATIONS
1. Hossain, M. M., Ali, M. E., Abd Hamid, S. B., Mustafa, S., Mohd Desa, M. N.,
& Zaidul, I. S. M. (2016). Double Gene Targeting Multiplex Polymerase Chain
Reaction–Restriction Fragment Length Polymorphism Assay Discriminates
Beef, Buffalo, and Pork Substitution in Frankfurter Products. Journal of
Agricultural and Food Chemistry, 64(32), 6343-6354.
2. Hossain, M. M., Ali, M. E., Hamid, S. B. A., Mustafa, S., Desa, M. N. M., &
Zaidul, I. S. M. (2017). Targeting double genes in multiplex PCR for
discriminating bovine, buffalo and porcine materials in food chain. Food
Control, 73, 175-184.
3. Hossain, M. M., Ali, M. E., Hamid, S. B. A., Hossain, S. A., Nizar, N. N. A.,
Uddin, M. N., ... & Akanda, M. J. H. (2017). Tetraplex PCR assay involving double
gene-sites discriminates beef and buffalo in Malaysian meat curry and burger
products. Food Chemistry, 224, 97-104.
4. Hossain, M. M., Ali, M. E., Sultana, S., Asing, Bonny, S. Q., Kader, M. A.,
& Rahman M. A. (2017). Quantitative Tetraplex Real-Time Polymerase Chain
Reaction Assay With Taqman Probes Discriminates Cattle, Buffalo And Porcine
Materials In Food Chain. Journal Of Agricultural And Food Chemistry, (Just
Accepted).
CONFERENCE PROCEEDING
1. Hossain, M. A. M., Ali M, E., Hamid, S. B. A. (2015). Design of Double Genes
Targeted Multiplex PCR; The International Conference on Purity, Utility
Reaction and Environmental Research – PURE2015 on the 9-11 November, 2015
in Kuala Lumpur, Malaysia.
2. Hossain, M. A. M., Bhassu, S., Hamid, S. B. A., Ali M, E. (2015). Step by step
development of double gene targeted multiplex PCR assay for the detection and
differentiation of beef and buffalo in food chain; The 20th Biological Science
Graduate Congress (20th BSGC) which will be held at Chulalongkorn University,
Bangkok, Thailand.
Page 262
238
PATENT
Dr. Md. Eaqub Ali, Professor Dr. Sharifah Bee Binti O.A Abd Hamid, M. A. Motalib
Hossain. (2016). Double Gene Targetet Multiplex PCR Kit For The Detection And
Differentiation Of Beef, Buffalo And Pork Derived Materials In Food Chain. Patent file
no. PI 2016701716 and reference PIC/P/777/16/UM/Eaqub/1139-DG.
INTERNATIONAL SCIENCE NEWS
ACS News Service Weekly PressPac: Wed Aug 10, 2016: Frankfurter fraud: Finding
out what’s in your hot dog. https://www.acs.org/content/acs/en/pressroom/presspacs/
2016/acs-presspac-august-10-2016/frankfurter-fraud-finding-out-whats-in-your-hot-
dog.html
Page 263
239
APPENDIX A
FRONT PAGES OF PUBLICATIONS
Page 267
243
APPENDIX B
CONFERENCE PROCEEDING
Page 269
245
APPENDIX C
PATENT
Page 270
246
INTERNATIONAL SCIENCE NEWS