Page 1
Development of a new Thomson parabola spectrometer
for analysis of laser accelerated ions
Thesis
Submitted to:
Douglass Schumacher
614-292-7035
[email protected]
Dr. Gregory Lafyatis
614-292-2286
[email protected]
Submitted by:
Connor Winter
440-321-7115
[email protected]
Page 2
2
Abstract
This thesis details my work on developing a new Thomson parabola spectrometer for use at the
SCARLET Laser Facility at The Ohio State University. The SCARLET laser facility is a 300
TW laser reaching peak intensities exceeding 1021 W/cm2. The laser is used to study laser-matter
interactions and plasma phenomena. The laser-matter interactions accelerate multiple types of
particles and to understand the interactions it is necessary to have diagnostic tools to characterize
the accelerated particles. In order to measure the charged particles a common device is a
Thomson parabola spectrometer. A Thomson parabola spectrometer uses parallel electric and
magnetic fields that are perpendicular to the incoming particles. This causes deflection of the
particles based on their charge-to-mass ratio and energy. Therefore, the Thomson parabola
spectrometer allows us to determine what particles are present and what their energy range is.
I designed a new spectrometer to replace the existing Thomson parabola spectrometer which had
problems during operation that reduced performance. Using a MATLAB code, I first modeled
the performance of the new design to determine physical dimensions and field strengths that
would allow for 1 MeV resolution of protons up to a maximum energy of 40 MeV. This resulted
in a 5 cm long magnetic field with a field strength of 0.12 T and 10 cm electrodes with a voltage
difference of 6 kV. These physical dimensions were used to create a SolidWorks model. As of
this writing, the newly designed Thomson parabola spectrometer has been built and is currently
being installed for use on future experiments.
Page 3
3
Introduction
The field of ultrafast high-intensity lasers has seen consistent growth and interest since the
development of Chirped Pulse Amplification in the 1980s. The interest is driven by the wide
variety of applications of high-intensity lasers in science and industry. Laser intensity has been
steadily increasing at about one order of magnitude every five years [1], with the maximum
intensity of 10 PW being reached at the High Power Laser System at the Extreme Light
Infrastructure – Nuclear Physics in Romania [11].
Increases in the intensity of lasers will allow for experiments in high energy density science,
typically defined as an energy density greater than 1 Mbar [9], and quantum electrodynamics.
Industrial applications include manufacturing of precision pieces of glass and automotive
components, and vision correction [7]. While the laser is directly utilized in some experiments
many others rely on the laser to accelerate particles. Laser-accelerated schemes may offer a more
cost-effective particle acceleration scheme while having a smaller footprint than conventional
cyclotron accelerators [8].
The use of laser-accelerated particles requires accurate measurement of the particles as it allows
the characterization of the types and energies of particles that come from different targets. Ions
and protons are of interest in many of the previously mentioned applications. So, there is a need
for accurate ion spectrometers to measure the ions and protons that result from laser-matter
interactions.
It is the purpose of this thesis and project to develop a Thomson parabola spectrometer for use at
the SCARLET Laser Facility at The Ohio State University. The following report will cover the
operational principle of a Thomson parabola spectrometer, the process by which the Thomson
Page 4
4
parabola spectrometer was designed, and lastly discuss the future work needed to implement the
spectrometer.
Technical Summary
In 1897 J.J. Thomson was testing the theory that cathode rays were streams of charged particles
as opposed to a form of electromagnetic radiation [3]. He passed the cathode rays through
electric and magnetic fields that where perpendicular to the incoming ray and mutually
perpendicular to each other. He compared the deflection of the two fields to find that the
deflections were consistent for every cathode, allowing for the measurement of a charge-to-mass
ratio based on the deflection. His cathode experiments verified the Lorentz force law for the
equations of motions for charged particles in a field.
𝑭 = 𝑞𝑬 + 𝑞𝒗 × 𝑩 (1)
In his later anode experiments he set the fields to be parallel to each other but still perpendicular
to the incoming beam. This resulted in the deflection of particles based on their charge-to-mass
ratio and energy resulting in parabolas for each unique charge-to-mass ratio.
Page 5
5
Figure 1:Top: Thomson's spectrum from 1913 which showed isotopes of Neon [3]. Bottom: Schematic of Thomson’s parabola
spectrograph [10]
The top image of fig. 1 shows the famous spectrum that first showed the isotopes of Neon. Each
individual trace shows a different isotope of various elements. As the traces extend towards the
edge of the image, the energy of the isotopes decreases with the most energetic of each isotope
remaining towards the center and the least energetic being deflected towards the edge of the
Page 6
6
image. This method of mass spectrometry lead to many developments and discoveries in the
field with ion spectrometers called Thomson parabola spectrometers (TPS) being standard tools
for gathering spectra of multiple ions at once. The bottom image of fig. 1 shows a schematic of
Thomson’s parabola spectrograph for canal rays or anode rays. Starting on the right with the
cathode labeled K, a small gap, F, between the gas discharge tube on the right and the
observation tube on the right, then A are the electric field plates and N and S are the magnets,
and finally S being the detection screen. Surrounding the apparatus is iron shielding labeled P.
Certain potential applications such as laser driven hadron-based cancer therapy rely on lasers to
provide an ion beam to either drive processes (eg. destroy cancer cells) or interact with a
secondary target to produce another beam of particles (eg. neutrons) to be used in therapy or
imaging. It is important that these ion beams be well characterized and produced consistently. To
characterize the beams and ensure a specific target produces the ions at the required energy, for a
given application, both the types of ions and the energy must be measured at once which is
facilitated by a TPS. This makes it the standard at many laser facilities with many groups
developing their own TPS design.
Before continuing discussing the current work on developing a TPS it is important to discuss the
working principle and components of a TPS. The TPS needs a source of particles, in the case of
this project the laser will produce the particles. In order to have a consistent beam a pinhole is
the only way particles can enter the TPS. A pinhole is a small hole, in this case 300 µm in
diameter, in a thick metal sheet so as to block the other particles so only a small beam is passed
into the TPS. The particles then pass through a magnetic field that is oriented perpendicular to
the particles incoming velocity. The particles then pass through an electric field that is oriented
in the same direction as the magnetic field. The magnetic field is to be produced by permanent
Page 7
7
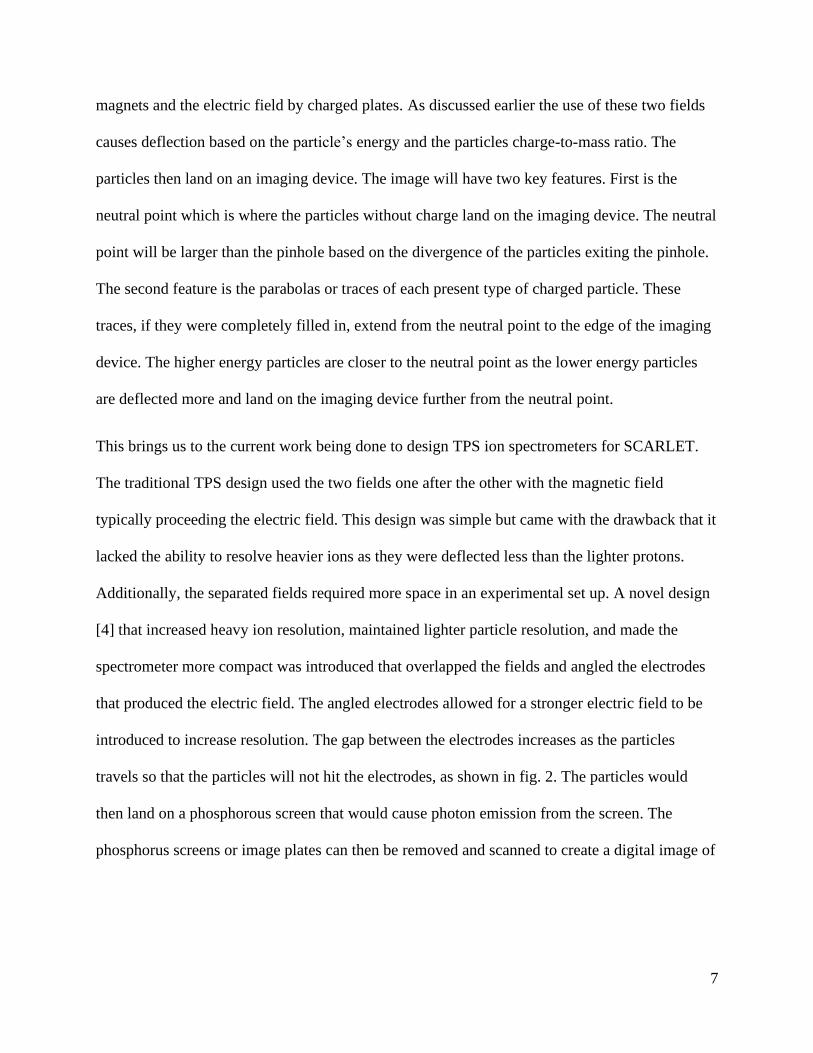
magnets and the electric field by charged plates. As discussed earlier the use of these two fields
causes deflection based on the particle’s energy and the particles charge-to-mass ratio. The
particles then land on an imaging device. The image will have two key features. First is the
neutral point which is where the particles without charge land on the imaging device. The neutral
point will be larger than the pinhole based on the divergence of the particles exiting the pinhole.
The second feature is the parabolas or traces of each present type of charged particle. These
traces, if they were completely filled in, extend from the neutral point to the edge of the imaging
device. The higher energy particles are closer to the neutral point as the lower energy particles
are deflected more and land on the imaging device further from the neutral point.
This brings us to the current work being done to design TPS ion spectrometers for SCARLET.
The traditional TPS design used the two fields one after the other with the magnetic field
typically proceeding the electric field. This design was simple but came with the drawback that it
lacked the ability to resolve heavier ions as they were deflected less than the lighter protons.
Additionally, the separated fields required more space in an experimental set up. A novel design
[4] that increased heavy ion resolution, maintained lighter particle resolution, and made the
spectrometer more compact was introduced that overlapped the fields and angled the electrodes
that produced the electric field. The angled electrodes allowed for a stronger electric field to be
introduced to increase resolution. The gap between the electrodes increases as the particles
travels so that the particles will not hit the electrodes, as shown in fig. 2. The particles would
then land on a phosphorous screen that would cause photon emission from the screen. The
phosphorus screens or image plates can then be removed and scanned to create a digital image of
Page 8
8
the detected particles.
Figure 2: TPS with angled electrodes where the angle increases as the particles travel in the z direction. From [5]. Top view: a
cross section side view of the magnets and electrodes with the blue line representing the deflection due to the electric field.
Bottom view: a top down view of the magnets and electrodes with the blue line representing the deflection due to the magnetic
field.
This ‘modified’, or ‘compact’ TPS design represents the current type of detector that many
groups use due to the previously described benefits,including the TPS currently available at the
SCARLET Laser Facility. In 2011 a compact TPS was designed and built by the group at
SCARLET to characterize multi-MeV heavy ions. In order to solve the operational problems of
the current TPS and provide other benefits it was decided I would design a new TPS using
Page 9
9
parametric modeling as the design method, in which the required performance of the device is
used to determine the required dimensions and characteristics of the TPS.
Results
Work on a new TPS for use at the SCARLET Laser Facility was motivated by the old compact
design having operational problems. The first problem is that electrical breakdown occurred at
voltages lower than initially expected. In order to be operated without breakdown the TPS had
weaker electric fields thus lowering the deflection of particles. This smaller deflection causes a
lower resolution in the images than desired. The second problem is that the imaging method, the
scanned digital image of the phosphor image plates shown in fig. 3, only allow four shots of the
laser to be taken before the target vacuum chamber has to be vented to atmosphere in order for
the plates to be retrieved and analyzed. This significantly slows the speed at which experiments
can be performed.
Figure 3: Image produced from the first-generation Thomson at SCARLET with predicted ion traces overlaid. From [5]
To solve these issues and improve the new TPS, several goals were outlined as follows. First,
simplify the design by returning to the traditional approach as this facilitates construction.
Additionally, it solves the electrical breakdown problem because the electrodes are not forced to
be in-between the magnets permitting the gap between the electrodes to be increased preventing
breakdown. Second, use Microchannel plates (MCP) as the imaging method. MCPs are plates
Page 10
10
with an array of small channels, typically between 5-25 µm. These plates are set to a high
voltage and upon being struck by incident radiation there is secondary electron emission. These
plates serve as amplification for the low particle flux through the TPS. Additionally, these plates
have a phosphorous screen at the end that capture the electrons and this screen can be captured
by a camera. This allows image acquisition while maintaining a vacuum and the MCPs can
image at the same rate that the laser can fire. Third, place the TPS in a separate vacuum chamber
from the target chamber, providing for more space so the TPS does not need to be compact.
Finally, use parametric modeling to determine the physical characteristics of the device.
Parametric modeling was performed using a code in MATLAB based on analytical solutions of
the particle deflections to determine the field strengths, length of the fields, and overall length of
the spectrometer necessary to resolve protons to within 1 MeV from a range of 40 MeV to 1
MeV. This code allowed for rapid modeling of expected ion traces until they were satisfactory.
The condition of being satisfactory was the ability to resolve protons to 1 MeV as mentioned
above while using fields that were reasonable to physically achieve. The final characteristics
were a magnetic field that is .12 T in the center of the magnets and 5 cm long, and a electric field
of 6 kV that is 10 cm long.
After the characteristics were established a second code, previously written by Nicholas Czapla a
fellow SCARLET researcher, based on a 4th order Runge-Kutta method to simulate the particles
passing through the fields. The electric field was assumed to be an ideal field due to the gap
distance increase and overall size of the electrodes. The magnetic field was simulated in
Mathematica by a plugin called RADIA [6].
Page 11
11
Figure 4: Left: The yoke (blue) and magnets (red) modeled in RADIA with mesh used to discretize the geometry to simulate the
magnetic field. Right: The magnetic field in the center of the gap between the magnets with the horizontal axis in mm and the
vertical axis in Tesla.
The simulated solution showed that the charateristics determined previously produced acceptable
traces after simulation. Shown in fig. 5.
Page 12
12
Figure 5: Analytic and Simulated Traces calculated using MATLAB with each species having an energy range from 40 MeV to 1
MeV. The black circle is the MCP imaging area and the black dot is neutral point where particles without a charge land
The MATLAB graphs also show that the ion species are separated enough to be uniquely
identified. Additionally, as the MCPs only have a certain active area for imaging, the code was
used to ensure that the particles landed on the imaging surface. The particles at lower energies
are deflected more and land outside the imaging area whereas the higher energy particles are
deflected less and land closer to the neutral point. The previous requirement of 1 MeV resolution
at higher energies was measured by taking the width of the neutral point in meters, centering it
around 35 MeV and finding the energy range from the left side of the neutral point to the right,
increasing magnetic field strength until the condition was met given that the pinhole size was
300µm.
Page 13
13
Figure 6: New Thomson parabola spectrometer design made in SolidWorks. The orange plates are the electrodes. The blue is the
magnetic yoke and the red is the magnets. The green disc is the pinhole disk.
Fig. 6. shows the new design produced in SolidWorks. The structure is mounted to an ISO 200
flange that can be placed into a vacuum chamber. The pinhole is offset from the center of the
flange to create the offset on the MCPs as seen in fig. 5. The pinhole is used to collimate the ions
produced from the laser-target interactions into a beam.
With the design finalized the parts were ordered and setup for the TPS began. The support
structure for the TPS vacuum chamber was completed and the TPS was assembled as shown in
fig. 7.
Page 14
14
Figure 7: Physical TPS and vacuum chamber
Parallel to the setup of the new TPS the first steps were taken in developing code to analyze the
images produced by the spectrometer. The code used to analyze data from the previous TPS was
reviewed to gain an understanding of how to use the code and how it functioned. This code will
later be adapted to analyze the data from the new TPS so understanding the operation and
contents of the code was necessary. This is the current state of my work on this project as of
writing this thesis.
Future Work
As of writing this thesis there is still tasks to be performed on this project. This section will detail
the known and discussed aspects of the project that remain. First some installation of the new
TPS is required before it can be used. This installation includes setting up the vacuum chamber
for the TPS, setting up the MCP, and aligning the pinhole to the center of the target chamber.
Page 15
15
After installation, the TPS can be calibrated by comparing its analyzed image to Radiochromic
film stacks to adjust the analysis code. Radiochromic film stacks are stacks that are comprised of
multiple layers of film that are sensitive to radiation. Depending on the energies of interest, some
other shielding metals may be inserted in between layers to filter different levels of energy and
particle types. By examining the radiation deposited into the stacks the energy of the particles
can be determined by the penetration depth into the stacks. The previously mentioned analysis
code needs to be altered from the code used on the previous TPS. The image processing needs to
be changed as the image given to the program is being changed from a scan of an image plate to
a camera image of the MCPs. Additionally, new simulations of the electrostatic fields are needed
as the fields are used to produce ion traces. These ion traces are overlaid on the images from the
experiment and show what energies are present in the data. The current solution assumes the
angled electrodes and a gradient field. A new solution must be created to match the new design.
Long term, the data from the new TPS will be analyzed and may be included in future papers
from the group at SCARLET.
Summary
A Thomson Parabola Spectrometer offers the ability to measure protons and multiple species of
ions on the multiple-MeV scale that are produced from laser-matter interactions. The current
TPS available at the SCARLET Laser Facility has significant operational issues motivating the
design of a new TPS. Modeling the new design through code to find the design characteristics
guaranteed the desired measurement capabilities. The design was finalized, and construction has
begun on the device and infrastructure for its implementation. The implementation of the TPS
will be completed early in the next semester allowing for time to develop code for data analysis.
Once the code is complete experimental results will be analyzed.
Page 16
16
References
1. National Academies of Sciences, Engineering, and Medicine 2018. Opportunities in
Intense Ultrafast Lasers: Reaching for the Brightest Light. Washington, DC: The
National Academies Press. https://doi.org/10.17226/24939
2. Gales, S, et al. “The Extreme Light Infrastructure—Nuclear Physics (ELI-NP) Facility:
New Horizons in Physics with 10 PW Ultra-Intense Lasers and 20 MeV Brilliant Gamma
Beams.” Reports on Progress in Physics, vol. 81, no. 9, 2018, p. 094301.,
doi:10.1088/1361-6633/aacfe8.
3. Münzenberg, G. “Development of Mass Spectrometers from Thomson and Aston to
Present.” International Journal of Mass Spectrometry, vol. 349-350, 2013, pp. 9–18.,
doi:10.1016/j.ijms.2013.03.009.
4. Carroll, D.C., et al. “The Design, Development and Use of a Novel Thomson
Spectrometer for High Resolution Ion Detection.” High Power Laser Science I Short
Pulse Plasma Physics, 2005.
5. Morrison, J. T., et al. “Design of and Data Reduction from Compact Thomson Parabola
Spectrometers.” Review of Scientific Instruments, vol. 82, no. 3, 2011, p. 033506.,
doi:10.1063/1.3556444.
6. “Radia.” European Synchrotron Radiation Facility (ESRF), 9 Jan. 2017,
www.esrf.eu/Accelerators/Groups/InsertionDevices/Software/Radia.
7. Hendow, Sami. “Femtosecond Lasers: From Inception to Industrial Applications.”
StackPath, 2019, www.laserfocusworld.com/lasers-
sources/article/14035380/femtosecond-lasers-from-inception-to-industrial-applications.
8. Dunne, Mike. “Laser-Driven Particle Accelerators.” Science, American Association for
the Advancement of Science, 21 Apr. 2006,
science.sciencemag.org/content/312/5772/374.
9. Research Areas, pls.llnl.gov/research-and-development/high-energy-density-
science/research-areas.
10. Wien, Karl. “100 Years of Ion Beams: Willy Wien's Canal Rays.” Brazilian Journal of
Physics, vol. 29, no. 3, 1999, pp. 401–414., doi:10.1590/s0103-97331999000300002.
11. “Laser Beam Delivery at ELI-NP.” LLNL-JRNL-721494.


![Untitled 2 [bednarskimath.weebly.com]...2. A parabola has x— intercepts at x = of symmetry for the parabola. 3. A parabola has x — intercepts at x = axis of symmetry for the parabola.](https://static.documents.pub/doc/80x56/5f083f2c7e708231d4210fb1/untitled-2-2-a-parabola-has-xa-intercepts-at-x-of-symmetry-for-the.jpg)


