114
PNNL- 28503 Development of Lost Energy Cost Savings for Energy Code Compliance in Commercial Buildings December 2020 R Hart M Rosenberg J Zhang Y Chen

PNNL- 28503
Development of Lost Energy Cost Savings for Energy Code Compliance in Commercial Buildings December 2020
R Hart M Rosenberg J Zhang Y Chen


PNNL- 28503
Development of Lost Energy Cost Savings for Energy Code Compliance in Commercial Buildings R Hart M Rosenberg J Zhang Y Chen December 2020 Prepared for the U.S. Department of Energy under Contract DE-AC05-76RL01830 Pacific Northwest National Laboratory Richland, Washington 99352
ii
Executive Summary
The U.S. Department of Energy (DOE) has developed two commercial energy code compliance methodologies:
• To support the American Recovery and Reinvestment Act of 2009, a checklist approach was applied to predetermined samples of buildings, with the results based on the percentage of measures in compliance.
• More recently, a pilot methodology was developed to quantify an estimate of lost savings and applied to a small, 9-building sample of office buildings with simple heating, ventilation, and air-conditioning (HVAC) systems.
This work enhances the second method, with the goal of answering the questions: What is the potential value of increasing compliance with the energy code and which code requirements should be emphasized during these studies? Ultimately, these are the questions that policy makers, funders, and program implementers care about. To answer them, a far more sophisticated approach is needed, one that addresses not only the question of value, but also the resource requirements to determine that value.
Determining Lost Energy Cost Savings
With the above in mind, the current research set out to expand a methodology capable of determining, for a sample of buildings, how much energy cost savings could potentially be gained through better compliance with the code. To estimate this, it is necessary to be able to assign a lost energy cost value to any condition likely to be encountered in such an assessment. The current research expanded from a pilot that considered only office buildings with simple HVAC systems in one climate zone (4C) to include the following:
• A retail prototype was added so two building types could be included, office and retail.
• Analysis was expanded to include climate zones 2A, 3B, and 5A.
• The measure list was expanded from 63 to 100 measures per building type, primarily due to the inclusion of more complex hydronic and variable air volume (VAV) HVAC systems in the office.
To accomplish the current work, several steps were undertaken:
• A feedback process was established to determine reasonable worst case conditions and field data collection protocols based on expert opinion.
• A sensitivity analysis of code measures was conducted using EnergyPlus1 to determine the worst possible lost energy savings, so that the number of measures evaluated in the field could be reduced by including only those with high potential lost energy savings impact.
• An expanded spreadsheet tool was created to capture field parameters that would drive estimates for lost energy savings when buildings did not meet requirements.
1 EnergyPlus Energy Simulation Software, Version 8.0, http://apps1.eere.energy.gov/buildings/EnergyPlus/.
iii
• A DOE funding opportunity announcement was brought forward to find a contractor to use the revised methodology and complete a broader field investigation in multiple climate zones.
• Working with the field study contractor, the spreadsheet tool and methodology were refined to ensure accurate data collection.
• The results from the field evaluation will be entered into a data collection spreadsheet tool and the estimated lost savings extracted for analysis of overall building sample energy code compliance impacts.
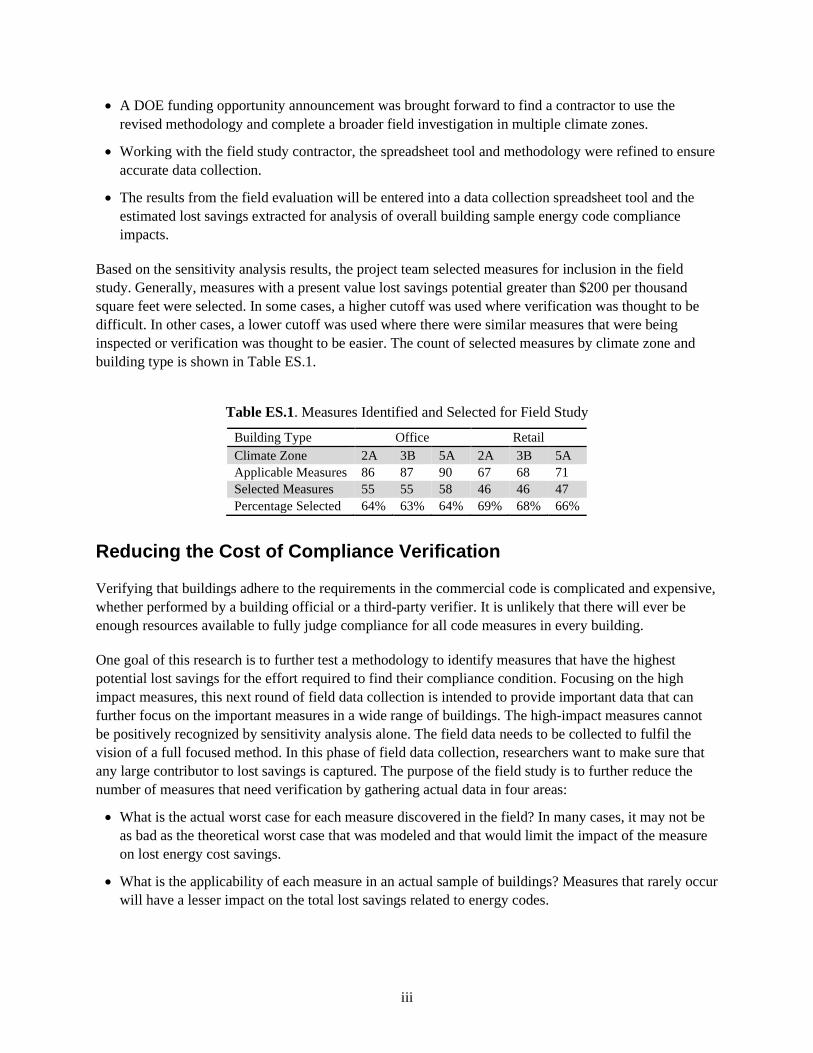
Based on the sensitivity analysis results, the project team selected measures for inclusion in the field study. Generally, measures with a present value lost savings potential greater than $200 per thousand square feet were selected. In some cases, a higher cutoff was used where verification was thought to be difficult. In other cases, a lower cutoff was used where there were similar measures that were being inspected or verification was thought to be easier. The count of selected measures by climate zone and building type is shown in Table ES.1.
Table ES.1. Measures Identified and Selected for Field Study
Building Type Office Retail Climate Zone 2A 3B 5A 2A 3B 5A Applicable Measures 86 87 90 67 68 71 Selected Measures 55 55 58 46 46 47 Percentage Selected 64% 63% 64% 69% 68% 66%
Reducing the Cost of Compliance Verification
Verifying that buildings adhere to the requirements in the commercial code is complicated and expensive, whether performed by a building official or a third-party verifier. It is unlikely that there will ever be enough resources available to fully judge compliance for all code measures in every building.
One goal of this research is to further test a methodology to identify measures that have the highest potential lost savings for the effort required to find their compliance condition. Focusing on the high impact measures, this next round of field data collection is intended to provide important data that can further focus on the important measures in a wide range of buildings. The high-impact measures cannot be positively recognized by sensitivity analysis alone. The field data needs to be collected to fulfil the vision of a full focused method. In this phase of field data collection, researchers want to make sure that any large contributor to lost savings is captured. The purpose of the field study is to further reduce the number of measures that need verification by gathering actual data in four areas:
• What is the actual worst case for each measure discovered in the field? In many cases, it may not be as bad as the theoretical worst case that was modeled and that would limit the impact of the measure on lost energy cost savings.
• What is the applicability of each measure in an actual sample of buildings? Measures that rarely occur will have a lesser impact on the total lost savings related to energy codes.

iv
• What is the typical condition for each measure found in the field? Understanding the typical distribution of as-found conditions can allow an expected value of lost savings to be assigned to each measure.
• What is the effort involved in verifying each measure? It may be more beneficial to focus on verifying measures that have a high lost savings per hour of inspection time.
Once that additional information is gathered for a valid sample of instances for each measure, then the expected lost savings relative to the verification cost can be identified. This is discussed further in the pilot study.1 Once measures are ranked in this way with more field data, then a much smaller set of measures can be included in the measure list for verification in future evaluations.
The results from the sensitivity analysis and field verification will be analyzed to develop a method for ranking the measures considering both their energy cost impact and the resources required to verify adherence with the code. This type of ranking can identify truly high-impact measures, which can inform the focus of evaluation efforts or energy code training in the future.
If future studies confirm this relationship holds true and a small fraction of the measures have a high impact on the lost energy savings, the following prioritized approach is proposed:
• Determine a set of high-impact lost energy savings measures that should always be verified in every building. These will likely vary by building type and climate zone. The number of measures could vary depending on the purpose of the verification and the complexity of the building type.
• Verify the remainder of the measures on a rotating or randomized basis to ensure all energy code requirements are met.
This approach will lead designers and contractors to pay the most attention to the most impactful requirements, while ignoring none. Such an approach has a significant efficiency advantage in that high-energy-impact measures are fully investigated, while less effort is applied to less impactful measures.
1 Rosenberg, M, R Hart, R Athalye, J Zhang, W Wang, and B Liu. 2016. An Approach to Assessing Potential Energy Cost Savings from Increased Energy Code Compliance in Commercial Buildings. PNNL 24979, Pacific Northwest National Laboratory, Richland, WA.

v
Table ES.2 shows the top 20 measures based on including the top 10 ranked measures (bolded) from each case of building type and climate zone combination. They are then ranked by the average of case rankings. This ranking is highly preliminary, as it does not include the important information that will come from the field studies: actual worst case in the field, actual field applicability, typical as found field condition, and effort required to verify each measure’s installed condition.
Table ES.2. Top 20 Measures Based on Worst Case Analysis*
Measure ID
Measure Name
Present Value of Lost Energy Cost Savings per 1,000 ft2 Office Retail Average
Impact 2A 3B 5A 2A 3B 5A 5012 Roofs insulated per CZ requirements $2,873 $3,330 $4,342 $9,526 $11,003 $15,114 $7,698 9037 Interior lighting power allowance $3,637 $3,615 $3,022 $6,588 $6,686 $5,447 $4,832 9009 Automatic time switch control $2,974 $2,887 $2,470 $6,295 $6,103 $5,413 $4,357 9047 Additional retail lighting power allowance NA NA NA $3,629 $3,609 $2,996 $3,411
5034 Window-to-wall ratio shall meet maximum limits $1,689 $1,807 $1,809 $2,594 $2,838 $3,005 $2,290
6019C Night fan control $2,065 $2,228 $1,814 $1,868 $2,033 $2,244 $2,042 5018A Frame walls insulated per CZ req'mt $1,149 $1,259 $1,664 $2,729 $3,209 $3,929 $2,323
6070 Multi-zone systems shall be VAV with VSD motors where required $1,405 $1,519 $1,150 NA NA NA $1,358
6109pAS Parking garage fan controls $1,225 $1,228 $1,150 $2,002 $2,006 $1,879 $1,582
5018B Above grade mass walls insulated per CZ and density requirements $606 $690 $2,618 $1,417 $1,588 $3,731 $1,775
6035 Exterior duct leakage requirement $1,204 $929 $1,845 $1,552 $1,334 $2,609 $1,579 6042B Hydronic piping insulation $1,407 $1,143 $774 NA NA NA $1,108 5036 Daylighting control when required $1,214 $1,212 $1,031 $1,629 $1,353 $1,444 $1,314 6046A Fan power limit for unitary AC $1,223 $1,376 $1,075 $1,306 $1,448 $1,045 $1,245 6005E WSHP efficiency $1,364 $1,132 $800 NA NA NA $1,099 5042B Windows meet SHGC requirements $1,275 $1,388 $714 $1,330 $1,479 $783 $1,162 6033p Exterior duct insulation requirement $905 $770 $258 $2,714 $2,310 $773 $1,288 6026p Snow and ice-melting system control NA $216 $529 NA $929 $2,271 $986 9003 Manual lighting control $1,499 $1,452 $1,242 $195 $189 $164 $790 6019A Thermostat setback, heating $350 $312 $327 $944 $924 $1,491 $725
* Equipment sizing measures were eliminated from the field study, as discussed in Section 4.1.3. CZ = climate zone; SHGC = solar gain heat coefficient; VSD = variable speed drive; WSHP = water source heat pump.

vi
Acknowledgments
This report was prepared by Pacific Northwest National Laboratory (PNNL) for the U.S. Department of Energy (DOE) Building Energy Codes Program. The authors would like to thank Jeremy Williams, DOE, for providing oversight, and the following who provided feedback on measures during the Delphi process:
• David Baylon, Ecotope
• Eric Makela, New Buildings Institute
• Duane Jonlin, City of Seattle
• Shaunna Mozingo, Mozingo Energy
• Mike Kennedy, Mike D. Kennedy, Inc.
• Jim Kelsey, kW Engineering
Reid Hart Pacific Northwest National Laboratory

vii
Acronyms and Abbreviations
AFUE annual fuel utilization efficiency ANSI American National Standards Institute ASHRAE American Society of Heating, Refrigerating and Air-Conditioning Engineers ARRA American Recovery and Reinvestment Act of 2009 BECP Building Energy Codes Program CBECS Commercial Buildings Energy Consumption Survey CHW chilled water COP coefficient of performance CZ climate zone DCV demand controlled ventilation DL daylighting DOE U.S. Department of Energy ECR energy cost rating EER energy efficiency ratio HSPF heating seasonal performance factor HVAC heating, ventilation, and air-conditioning HW heated water IECC International Energy Conservation Code IES Illuminating Engineering Society LCC life-cycle cost LPD lighting power density MBH thousands of British thermal units per hour PNNL Pacific Northwest National Laboratory PV present value R-value thermal resistance in h·ft2·°F/Btu SEER seasonal energy efficiency ratio SHGC solar heat gain coefficient SWH service water heating U-factor thermal resistance in Btu/h·ft2·°F UPV uniform present value VAV variable air volume VSD variable speed drive WSHP water source heat pump WWR window-to-wall ratio
viii
Contents
Executive Summary ...................................................................................................................................... ii Acknowledgments ........................................................................................................................................ vi Acronyms and Abbreviations ..................................................................................................................... vii 1.0 Background ........................................................................................................................................ 1.1
1.1 DOE’s Commercial Compliance Work ..................................................................................... 1.1 1.1.1 Initial Checklist Approach ............................................................................................. 1.1 1.1.2 Pilot Lost Savings Methodology .................................................................................... 1.2 1.1.3 Expanded Lost Savings Methodology ............................................................................ 1.3
1.2 Long-Term Compliance Evaluation Direction .......................................................................... 1.4 2.0 Energy Impact Estimation Approach ................................................................................................. 2.1
2.1 Analysis Scope .......................................................................................................................... 2.1 2.2 Methodology for Determining Energy Impact .......................................................................... 2.2
2.2.1 Identification of Applicable Code Requirements ........................................................... 2.3 2.2.2 Development of Range of Conditions ............................................................................ 2.4 2.2.3 Measure Conditions, Worst, Code, and Best .................................................................. 2.5 2.2.4 Delphi Group Review of Case Conditions ..................................................................... 2.5
3.0 Modeling Strategy ............................................................................................................................. 3.1 3.1 Determining Worst-Case Lost Savings ..................................................................................... 3.1
3.1.1 Use of Prototype Simulation Models ............................................................................. 3.1 3.1.2 Parametric Building Simulation ..................................................................................... 3.2 3.1.3 Manual Engineering Calculations .................................................................................. 3.2
3.2 Assigning Lost Savings to the Worst Case ............................................................................... 3.4 4.0 Energy Impact Results & Measure Selection .................................................................................... 4.1
4.1 Worst-Case Lost Energy Savings .............................................................................................. 4.1 4.1.1 A Life-Cycle Perspective: Present Value of Lost Savings ............................................. 4.1 4.1.2 Measure Selection for Field Study ................................................................................. 4.9 4.1.3 Field Study Adjustments .............................................................................................. 4.10
5.0 Application to Field Study ................................................................................................................. 5.1 5.1 Translating Prototype Impact to Field Impact ........................................................................... 5.1
5.1.1 Developing Regressions for Lost Savings Projection .................................................... 5.1 5.1.2 Applying Regression Results to Field Buildings............................................................ 5.2
5.2 Data Collection Forms .............................................................................................................. 5.3 5.2.1 Cost of Compliance Verification .................................................................................... 5.4
6.0 Conclusions ....................................................................................................................................... 6.1 7.0 References ......................................................................................................................................... 7.1 Appendix A 2012 IECC Code Measures and Associated Requirements .................................................. A.1 Appendix B Code Measures, Identified Conditions, and Input Parameters...............................................B.1 Appendix C Code Measures Ranked by LCC Energy Cost Impact ...........................................................C.1 Appendix D Sample Field Audit Form ..................................................................................................... D.1

ix
Tables
Table 2.1. Example of Code Measures and Identified Conditions............................................................. 2.5 Table 4.1. Energy Prices Used for Worst Case Analysis ........................................................................... 4.1 Table 4.2. Measure Lives for Simplified Present Value Savings Analysis................................................ 4.2 Table 4.3. Measure UPV for Simplified Present Value Savings Analysis ................................................ 4.2 Table 4.4. Measures with Lost Savings, Present Value $/1000 ft2 ............................................................ 4.2 Table 4.5. Measures Identified and Selected for Field Study .................................................................... 4.9 Table 6.1. Top 20 Measures based on Worst Case Analysis* ................................................................... 6.1
Figures
Figure 1.1. Distribution of Worst-Case Measure Impact ........................................................................... 1.3 Figure 4.1. Office Worst Case Energy Present Value of Lost Life-Cycle Cost Impact ............................. 4.7 Figure 4.2. Retail Worst Case Energy Present Value of Lost Life-Cycle Cost Impact ............................. 4.8

1.1
1.0 Background
The U.S. Department of Energy (DOE) Building Energy Codes Program (BECP) supports the development and implementation of building energy codes and standards (DOE 2018). This includes providing technical assistance to states to implement building energy codes, including identifying and quantifying opportunities to ensure consumer benefits. One key area in which BECP has worked over the past several years is providing resources and tools to assist states in evaluating compliance with building energy codes. The work described in this report expands on previous work in this area.
1.1 DOE’s Commercial Compliance Work
DOE has explored different approaches to rating energy code compliance, beginning with binary pass/fail metrics evolving into the current lost opportunities approach described in this report.
1.1.1 Initial Checklist Approach
In 2010, DOE developed a commercial methodology and associated tools focused on determining a percent compliance rating for states (DOE 2010) to support the American Recovery and Reinvestment Act of 2009 (ARRA 2009). Section 410 of ARRA requires states to develop “a plan for the jurisdiction achieving compliance with the building energy code or codes described in subparagraphs (A) and (B) within 8 years of the date of enactment of this Act in at least 90 percent of new and renovated residential and commercial building space.”
The tools that were developed and made available as part of DOE’s work include 1) the State Sample Generator, an online tool that generates a representative sample set distributed across building size and climate zone for each state; 2) compliance checklists; and 3) Score+Store, an online tool that collects checklist data, determines individual building scores, and calculates an average compliance score for the sample set. In the commercial compliance checklist, for each code requirement that was applicable to a particular building and observable, a binary decision was made regarding whether or not the requirement was met. The percentage of requirements that were met established the score for each individual building. Note that this approach does not distinguish between varying levels of non-compliance for individual requirements.
DOE worked with five Regional Energy Efficiency Organizations1 to select states in which to conduct pilot studies using this DOE methodology and tools. Ultimately, eight studies covering nine states2 were conducted. Details of this previous work are summarized in the report 90% Compliance Pilot Studies (DOE 2013). While effective in collecting information about the condition of recently constructed buildings, with its binary approach to compliance determination, the initial checklist approach failed to answer a critical question: What is the value of increasing compliance with the energy code?
1 Northeast Energy Efficiency Partnerships, the Southeast Energy Efficiency Alliance, the Midwest Energy Efficiency Alliance, the Southwest Energy Efficiency Project, and the Northwest Energy Efficiency Alliance. 2 Studies were completed for Georgia, Iowa, Massachusetts, Montana, Utah, Wisconsin, Northwest Commercial Lighting Study (Washington, Oregon, Idaho, Montana), and Northwest Jurisdictional Survey.

1.2
1.1.2 Pilot Lost Savings Methodology
To move past a binary assessment of compliance, DOE worked with Pacific Northwest National Laboratory (PNNL) to develop a pilot methodology with a goal of determining lost energy savings due to non-compliance in commercial buildings (Rosenberg et al. 2016). This research developed a new methodology capable of determining how much energy cost savings could potentially be gained through better adherence to the requirements in the energy code and included a pilot covering the lost savings impact for nine commercial buildings. It also compared the level of effort required to evaluate compliance with the potential cost savings for different code measures.1 The method was based on a combination of analysis and field investigation. The analysis used prototype building energy simulation to establish the range of energy impact that could result from different building parameters. The field investigation determined the installed condition of energy impactful measures and the time required to verify the installed condition. The pilot project focused on office buildings with simple unitary heating, ventilation, and air-conditioning (HVAC) systems and evaluated 63 measures related to energy codes. The PNNL small office building prototype was used to estimate the lost savings impact. Overall conclusions were as follows:
• For a sample of nine buildings, the present value of lost savings was $1,710 per thousand square feet.
• There was a wide range in savings for different measures, with 81% of the lost savings related to 14% of the measures.
• The field time required to verify measures relative to lost savings over the life of the buildings also had a wide range. Viewed as life-cycle cost (LCC) lost savings found per hour of investigation, it ranged from less than $1 per hour of investigation to as much $6,700 per hour.
• The sample was too small to get a good estimate of the worst case installation for each measure or the expected level of compliance for measures that were found to not meet code, but the methodology was validated as a reasonable approach for future research.
Based on the sensitivity analysis of a prototypical office building using simulation in the pilot study, the annual energy cost impact of the worst case for each measure was determined and a present value of lost savings calculated per thousand square feet of building area. In Figure 1.1, the frequency of these lost savings is organized into bins that double in value, from the highest potential lost savings to the lowest. The dashed line shows that less than 30% of the measures cover all individual measure’s worst-case impacts greater than $800 in life-cycle lost savings and more than 70% of the cumulative worst-case lost savings. This reinforces the Pareto principle concept of focusing on a limited number of high-impact measures to verify the majority of lost savings.
1 A code measure is a group of related code requirements, and they are described in more detail in Section 2.2.1.

1.3
Figure 1.1. Distribution of Worst-Case Measure Impact
1.1.3 Expanded Lost Savings Methodology
With the goal of further developing a method to determine the value of increasing adherence to the energy code, it was important to further define what measures were most impactful and what their impact is on energy use and cost. With that goal, the prototype simulation-based approach used in the pilot methodology test (Rosenberg et al. 2016) was expanded as follows:
• A retail prototype was added so two building types could be included, office and retail.
• Analysis was expanded to include climate zones 2A, 3B, and 5A.
• The measure list was expanded from 63 to 100 measures per building type, primarily due to the inclusion of more complex hydronic HVAC systems in the office.
• The office prototype used was switched from the small office to the medium office, and systems were modified to capture measure impacts for unitary systems, variable air volume (VAV) systems, air- and water-cooled chillers, and boilers.
• Potential measures were evaluated using EnergyPlus1 analysis to determine the worst possible lost energy savings, so that the number of measures evaluated in the field could be reduced by including only the most impactful.
• A DOE funding opportunity announcement was brought forward to find a contractor to use the revised methodology and complete a broader field investigation in multiple climate zones.
1 EnergyPlus Energy Simulation Software, Version 8.0; http://apps1.eere.energy.gov/buildings/EnergyPlus/.

1.4
• A feedback process was established to determine reasonable worst-case conditions and field data collection protocols based on expert opinion.
• An expanded spreadsheet tool was created to capture field parameters that would drive estimates for lost energy savings when buildings did not meet requirements.
• The results from the field evaluation will be entered into a data collection spreadsheet tool and the estimated lost savings extracted for analysis of overall building sample energy code impacts.
1.2 Long-Term Compliance Evaluation Direction
It should be emphasized that the sensitivity analysis that is documented here is only the first step in the development of a prioritization of measures for code compliance verification. There are several questions not answered by a simple analysis of theoretical lost savings. Further work is needed to get a true picture of the most important measures to evaluate. That will require field studies to gather more information. The purpose of those studies is to further reduce the number of measures that need verification by gathering actual data in four areas:
• What is the actual worst case for each measure discovered in the field? In many cases it may not be as bad as the theoretical worst case that was modeled and that would limit the impact of the measure on lost energy cost savings.
• What is the applicability of each measure in an actual sample of buildings? Measures that rarely occur will have a lesser impact on the total lost savings related to energy codes.
• What is the typical condition for each measure found in the field? Understanding the typical distribution of as-found conditions can allow an expected value of lost savings to be assigned to each measure.
• What is the effort involved in verifying each measure? It may be more beneficial to focus on verifying measures that have a high lost savings per hour of inspection time.
Once that additional information is gathered for a valid sample of instances for each measure, then the expected lost savings relative to the verification cost can be identified. This is discussed further in the pilot study (Rosenberg et al. 2016). Once measures are ranked in this way with more field data, then a much smaller set of measures can be included in the measure list for verification in future evaluations.
2.1
2.0 Energy Impact Estimation Approach
An important development from the pilot was the decision to collect data only for measures with the potential to have a large impact on building energy use. Given some uncertainty about the actual worst case that would be encountered in the field and which measures would be found to be regularly non-compliant, a broad range of measures was included for this analysis. It is expected that once adequate field information is collected on the range of measures included here, future studies will include fewer measures that will always require data collection.
2.1 Analysis Scope
The purpose of this technical support document is to record the method used to evaluate the lost energy savings of measures found to be non-compliant with energy codes in buildings. The approach used in the pilot methodology test (Rosenberg et al. 2016) was expanded to include more building types, climate zones, and measures. The current analysis was limited to new construction impacting two building types (office and retail buildings) with a range of HVAC systems in three climate zones (2A, 3B, 5A) looking at the requirements of the 2012 International Energy Conservation Code (IECC) (ICC 2012) and ASHRAE Standard 90.1-2010 (ASHRAE 2010). Future research will expand both the building types and climate zones. The rationale for these choices is as follows.
Office and retail buildings were selected because together they represent a large portion (31.3%) of the existing commercial building stock (EIA 2015).1 The 2012 IECC was chosen because 25 states have adopted it or the parallel version of ANSI/ASHRAE/IES Standard 90.1 (ASHRAE 2010) (DOE 2019), with additional states likely to adopt a more advanced code within the next several years. This code edition was common in the states targeted for this phase of the methodology study.
Limitations in the pilot study that have been resolved for this phase include the following:
• Both simple and complex HVAC systems were chosen to avoid limitations in sampling experienced in the pilot. The pilot was limited to simple systems.
• Projects complying via the performance approach are now accounted for. This does require securing the performance documentation so that performance conditions can be input as the “code required” baseline condition. One of the areas for the current field study is Florida, where many buildings use the performance approach. The pilot was limited to buildings using the prescriptive approach.
• To further develop the methodology, the sample size is expanded so that statistically valid results can be collected for all measures. This will allow better determination of expected compliance levels and actual worst cases for measures.
• Although the analysis was based on the 2012 IECC, some variation is experienced in local codes and is accommodated by indicating either measure applicability or a different base code requirement in the data collection tool.
Limitations that continue to apply include the following:
1 The Commercial Buildings Energy Consumption Survey (CBECS) defines commercial buildings as all buildings in which at least half of the floor space is used for a purpose that is not residential, industrial, or agricultural.
2.2
• The prototypes do not necessarily match the actual building configuration, so savings estimation may not be exact; however, the savings are expected to be accurate enough to get an overall impact of buildings in general in a particular state or climate zone.
• The lost savings results are non-interactive. This could be an issue if there is significant non-compliance in both lighting power and controls; however, a review of interactive issues in the pilot study found that there was not a large impact.
• The tool is currently only fully developed to generate results for two1 climate zones and two building types.
2.2 Methodology for Determining Energy Impact
This methodology operates at two levels. The meta level involves collection and analysis of results for a sample of buildings to project overall state or climate zone compliance impact. That overall method is discussed in the pilot study (Rosenberg et al. 2016), and is being further developed in the current field study. A subset of that overall methodology is development of lost savings estimation for measures in the field study and development of a tool to collect and process that data to be rolled up in a sample evaluation. The approach to assessing potential lost energy cost savings for a particular building instance can be summarized by the following steps:
1. Identify applicable code requirements for the building types, HVAC system types, and climate zones of interest.
2. Combine related requirements into measures that can be verified and evaluated.
3. Determine if each measure has a discrete or continuous input. Some measures have savings that are parametrically based, i.e., the input is a value related to field and requirement conditions, such as U-factor. Other measures have a discrete input, or are incrementally based, i.e., the input is a selection from a set of descriptions, like commissioning quality.
4. Determine the worst-case condition for non-compliance expected to be encountered in the field assessment. While total non-compliance seems easy to quantify, there are many cases where some minimal, though not fully compliant, installation is to be expected. For example, where a 6-inch wall with R-19 insulation is required, rather than a minimum of a single sheathing wall (theoretical worst case), an unfilled cavity wall may be the actual worst case likely ever to be encountered.
5. Identify a range of conditions for each measure covering the range of expected field conditions from worst to code-compliant to best, with intermediate conditions identified where appropriate. For many parametric measures, the impact is linear relative to the related parameter, so only a minimum and maximum value are needed.
1 While initial worst-case lost savings were developed for climate zones 2A, 3B, and 5A, once a field contractor was selected mid-way through the analysis process, it was determined that field work would be restricted to climate zones 2A and 5A. Hence, full range of savings analysis including worst, code, and best cases was not developed for climate zone 3B.

2.3
6. Perform energy simulation using prototype models of the identified conditions for each measure in each building type, HVAC system type, and climate zone of interest to estimate energy cost impacts.
7. Review the worst or expected case non-compliant results to determine which measures potentially have a strong impact on results and should be included in a field assessment tool.
2.2.1 Identification of Applicable Code Requirements
Before compliance could be assessed, it was first necessary to identify the code requirements that apply to the building type being studied. The first step in that process was to inventory all the requirements in the non-residential provisions of the 2012 IECC. The assessment for the pilot study (Rosenberg et al. 2016) was expanded to include the retail building type and climate zones analyzed: 2A, 3B, and 5A. In addition, since the 2012 IECC allows use of 90.1 as an optional path, several 90.1-2010 measures that were not in the IECC were included. A total of 413 individual requirements were identified. Next, requirements not applicable to this project or those that would not be verified were removed. This was done if:
1. There were no energy savings directly attributable to the requirement. For example, air barriers are permitted on the interior, exterior, or within the building envelope assembly. While the air barrier requirement itself affects energy use, the location of the air barrier does not. Administrative requirements also fall under this category.
2. The requirement does not apply to office or retail buildings with the HVAC systems to be analyzed. For example, requirements for laboratory exhaust or refrigeration systems are not applicable.
3. The requirement does not apply to the climate zones analyzed: 2A, 3B, and 5A. For example, cool roof requirements are not applicable in climate zone 5A.
4. The requirement is a parent requirement to a subset of more specific requirements. For example, there is a general requirement that thermal envelope components comply with the tables containing R-values and U-factors. However, there are also specific sub-requirements for wall, roof, door, and floor U-factors. There is no need for a separate verification of the general requirement.
After applying these filters to the requirements, 328 IECC requirements remained from the original 413 and 7 were added from 90.1, for a total of 335. Next, the 335 requirements were grouped into 96 “measures” containing related requirements. For example, the mass wall insulation measure contains requirements for the U-factor of the assembly and the weight and density of the wall, as well as requirements for how continuous insulation must be installed. These three requirements were grouped into a single “mass wall insulation” measure. There are related requirements that occupancy sensors be present in certain space types, that they shut lights off within 30 minutes, and that they automatically energize no more than 50% of the lights in a space upon detecting occupants. These three requirements were grouped into a single “occupancy sensor” measure. In several cases, after grouping into a single measure, two discrete sub-measures were analyzed. For example, cooling efficiency is analyzed separately for package systems and VAV multiple zone systems. These sub-measures use the same measure number with A & B appended. Table A.1 in Appendix A lists the 96 measures analyzed for the

2.4
“worst case lost savings impact” and the associated requirements. The assessment of compliance takes place at the measure level.
2.2.2 Development of Range of Conditions
For each of the 96 measures discussed in Section 2.2.1, a range of likely conditions was developed that could reasonably be expected to occur in a building. For each measure, the code-compliant condition was identified along with a reasonable best condition and a worst below-code condition. The worst condition is obviously needed to provide a range of impacts below code to understand the lost savings. Conditions better than minimum code were identified for each measure; they are not factored into the calculation of lost energy cost savings for the reasons discussed in Section 2.1. So, the “best” condition is needed for four reasons:
• The above-code analysis was used to provide energy impacts for a performance path building, where the proposed performance building becomes the code requirement. Above-code conditions may be included to trade off with below-code conditions for other measures.
• Having a regression or impact calculation process that includes “above-code” (above 90.1-2010) conditions allows the field tool to be adapted to local adoptions that have included measures with requirements above the national model code requirements.
• Developing a range of parameters both below and above code allows the tool to adapt to future editions of the energy code as they are adopted.
• The “above-code” range can be applied to a green or advanced code where the “requirement” may be above code.
To set the initial boundaries (best to worst), the authors’ professional judgment was used with input from other PNNL engineers and scientists as well as external energy code experts. The best and worst conditions selected are not the best and worst conditions possible, but rather the best and worst conditions expected in the field. If additional conditions are found outside of this range during field investigation, they may need to be added later. Initially, only code and worst conditions were used to determine the energy cost impact of worst-case condition. Then, once measures were prioritized by potential lost savings and selected for inclusion in the field study, a best condition was identified where appropriate. Generally, only the three conditions were identified, since a five-condition approach in the pilot study found that in most cases the relation of energy use to input parameters was linear. In some cases, only two conditions were identified:
• For HVAC efficiency equipment, efficiencies far below code are not available from manufacturers, so the worst condition is limited to the minimum requirements in the previous code edition, which in some cases means that only the code and best conditions are included. Above-code efficiencies are used in performance path applications.
• Window-wall ratios below 30% are not included, as performance paths do not currently allow this tradeoff.
• Other measures that are mandatory and cannot be used or are unlikely to be used in performance tradeoff only had the worst and code conditions. These are indicated in the tables in Appendix A.
2.5
In some cases, more than three conditions were identified where three data points did not produce a high enough coefficient of determination (R2) for acceptable accuracy; these include:
• Roof insulation (5012) and floor insulation (5023A & 5023B).
• Window U-factor (5042A).
• Heating and cooling temperature setback (6019A & 6019B).
The complete list of the measure input conditions is shown in Table B.1 and Table B.2 in Appendix B.
2.2.3 Measure Conditions, Worst, Code, and Best
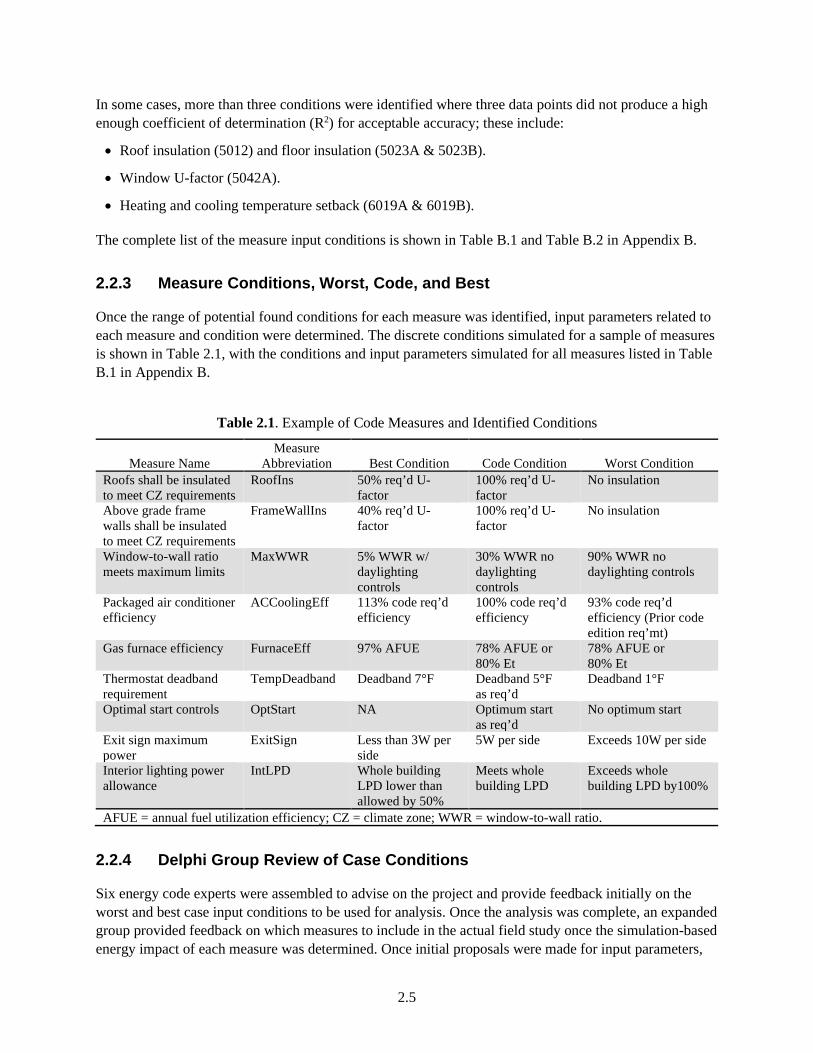
Once the range of potential found conditions for each measure was identified, input parameters related to each measure and condition were determined. The discrete conditions simulated for a sample of measures is shown in Table 2.1, with the conditions and input parameters simulated for all measures listed in Table B.1 in Appendix B.
Table 2.1. Example of Code Measures and Identified Conditions
Measure Name Measure
Abbreviation Best Condition Code Condition Worst Condition Roofs shall be insulated to meet CZ requirements
RoofIns
50% req’d U-factor
100% req’d U-factor
No insulation
Above grade frame walls shall be insulated to meet CZ requirements
FrameWallIns 40% req’d U-factor
100% req’d U-factor
No insulation
Window-to-wall ratio meets maximum limits
MaxWWR 5% WWR w/ daylighting controls
30% WWR no daylighting controls
90% WWR no daylighting controls
Packaged air conditioner efficiency
ACCoolingEff 113% code req’d efficiency
100% code req’d efficiency
93% code req’d efficiency (Prior code edition req’mt)
Gas furnace efficiency FurnaceEff 97% AFUE 78% AFUE or 80% Et
78% AFUE or 80% Et
Thermostat deadband requirement
TempDeadband Deadband 7°F Deadband 5°F as req’d
Deadband 1°F
Optimal start controls OptStart NA Optimum start as req’d
No optimum start
Exit sign maximum power
ExitSign Less than 3W per side
5W per side Exceeds 10W per side
Interior lighting power allowance
IntLPD Whole building LPD lower than allowed by 50%
Meets whole building LPD
Exceeds whole building LPD by100%
AFUE = annual fuel utilization efficiency; CZ = climate zone; WWR = window-to-wall ratio.
2.2.4 Delphi Group Review of Case Conditions
Six energy code experts were assembled to advise on the project and provide feedback initially on the worst and best case input conditions to be used for analysis. Once the analysis was complete, an expanded group provided feedback on which measures to include in the actual field study once the simulation-based energy impact of each measure was determined. Once initial proposals were made for input parameters,

2.6
the proposed input conditions were presented to the experts via a webinar in August 2016. The feedback was collected and applied. Appropriate adjustments were made to the input range of conditions, with final review completed in October 2016.

3.1
3.0 Modeling Strategy
3.1 Determining Worst-Case Lost Savings
The primary goal of this phase of work was to review the measures in the 2012 IECC commercial provisions and find the relative energy cost impact of each measure in a worst-case non-compliance situation. The worst-case energy impact results can be used in ranking measures to find which have the most potential for lost savings. Those measures with the highest potential will be evaluated in the field study to determine the actual lost cost due to non-compliant construction practices. These results combined with the time required to verify each measure will allow future evaluations to focus on measures that had a large impact on energy use over the life of the building and those that have the greatest savings recovery potential per verification hour. The general approach for the worst-case analysis was to simulate each measure for a code case and a worst case and compare the energy use impact.
3.1.1 Use of Prototype Simulation Models
As discussed previously, prototype building models were used to quantify lost energy cost savings for this research. PNNL has developed a suite of 16 prototype building models using EnergyPlus to analyze non-residential energy codes (Thornton et al. 2011). Code-compliant versions of each prototype in each of the 17 climate zones in the United States are available for each version of Standard 90.1 and the IECC since 2004 (DOE 2016). These prototype models are available for download (DOE 2016).
The current project used the PNNL medium office and standalone retail prototype models compliant with the 2012 IECC. Simulations were completed in climate zones 2A, 3B, and 5A to determine the energy impact of the worst case vs. code requirements.
While the prototypes include typical construction characteristics, some modification was required to capture as many of the code requirements as possible. For example, the medium office building prototype contains no skylights, but it is likely that they will be encountered if a large enough sample of offices is assessed. The following changes were made to the prototype models:
• Skylight Curb Insulation, Skylight-to-Roof Ratio, Skylight Solar Heat Gain Coefficient (SHGC) and U-factor. To capture the various requirements applicable to skylights, ten 4 ft by 4 ft skylights were added to the core zone, resulting in a 3.0% skylight-to-roof ratio.
• Exterior Floor Insulation. One of the perimeter zones was changed from slab-on-grade construction to exterior floor construction. This type of construction often occurs in commercial buildings when there is parking located under part of the building below a floor above.
• Opaque Door U-factor. Six 3 ft by 7 ft opaque swinging doors with a U-factor = 0.37 Btu/h·ft2 ·°F were added to the office and five 8 ft by 10 ft opaque roll up doors with a U-factor = 0.21 Btu/h·ft2 ·°F and eight 3 ft by 7 ft opaque swinging doors with a U-factor = 0.37 Btu/h·ft2 ·°F were added to the retail prototype.
• Other Office HVAC System Type Heating and Cooling Efficiency. The original medium office prototype includes a packaged VAV reheat system with direct expansion cooling and electric reheat. To capture system efficiency changes for other HVAC system types, parallel baseline and high-efficiency models were created with the following system types:

3.2
– Hydronic VAV with chilled water and hot water reheat.
– Packaged rooftop HVAC with heat pump heating.
– Water source heat pumps with a loop boiler and fluid cooler.
– Single zone fan coil units served by a hot water gas boiler and air cooled chiller.
– Single zone fan coil units served by a hot water gas boiler and water cooled chiller.
• Other Retail HVAC System Type Heating and Cooling Efficiency. The standalone retail prototype includes a packaged single zone HVAC system with direct expansion cooling and a gas furnace. To capture system efficiency changes for other HVAC system types, parallel baseline and high-efficiency models were created with a packaged air source heat pump system.
• Demand Control Ventilation and Energy Recovery. To trigger the code requirements for demand controlled ventilation and energy recovery, it was necessary to add a space with high occupant density requiring substantial outdoor air. One of the office perimeter zones was simulated as a conference room with peak occupancy of 46 people per thousand square feet. Specific conference room occupancy schedules were added for this zone. Prorated savings from the office analysis were used for the retail conference/training room.
3.1.2 Parametric Building Simulation
Once the range of potential found conditions for each measure was identified, input parameters related to each measure and condition were determined. The conditions and input parameters simulated for all measures are listed in Table B.1 and Table B.2 in Appendix B. The baseline prototype buildings followed the code case parametric inputs, while best (where applicable) and worst cases are modeled with appropriate input parameters for those conditions. Then, results from the worst condition are compared to the code results to find potential lost savings from non-compliance. Where needed for above code performance path approaches, the best condition parameters provide a result that can be compared to the baseline as discussed in Section 5.0.
3.1.3 Manual Engineering Calculations
In most cases, EnergyPlus simulation of the prototype models was the basis for worst-case potential lost energy savings. The parametric inputs used in the analysis of each case are shown in Appendix B. In several situations, manual calculations, or results from the pilot study were used rather than attempting to model results with EnergyPlus. These included:
• Below-Grade Wall Insulation (5021p). The pilot included a 724 ft2 conditioned basement zone added to the small office. Below-grade wall insulation was modeled and the results transferred on a prorated wall area basis to this study.
• Snow and Ice Melting System Control (6026p). Snow and ice melting system control impacts energy used outside the building envelope and does not require energy simulation. The original savings calculations developed when this requirement was added to Standard 90.1 were used on a heated area basis.
• Duct Insulation (6033p). A temperature bin analysis for outside exposed ducts and non-conditioned area ducts was completed as a basis for savings.

3.3
• HVAC & Lighting Commissioning (6045p & 9099p). For this analysis, commissioning is estimated as a percentage of total building energy usage, based on the results of a composite review of several field evaluation reports of new building commissioning (Mills et al. 2004). This meta review showed new building commissioning saved 11.7% of building energy cost overall. To be conservative on commissioning savings that are difficult to analyze, this was reduced to 8% for this study and allocated to lighting and HVAC based on end use proportion. Conditions between code-required commissioning and no commissioning were based on the overall quality of the commissioning effort, and if it was different from the energy code requirements, then commissioning was adjusted.
• Water Economizer Capacity (6066p). The impact for the worst case of this rarely encountered measure was estimated at 75% of typical airside economizer savings.
• Water Economizer Precooling Coil Pressure Drop (6067p). Energy impact is based on the design coil pressure drop from 25 ft for worst to 15 ft for code, based on total chilled water flow.
• Boiler Load Sequencing (6075p). The energy impact is based on the additional standby losses if both boilers are on during heating period use, vs. sequencing the boilers to avoid standby losses from the second boiler when not needed. Standby losses are estimated at 2% of total boiler capacity.
• Multiple Chiller Flow Reduction (6091p). The primary savings here is due to reduced pump energy use when only one chiller is required to meet the cooling load. The impact is based on a two chiller plant with a primary / secondary pumping strategy. For the reduced (code) case, the second primary pump is off when cooling load is below 50% design cooling load.
• Multiple Boiler Flow Reduction (6093p). Similar to 6091p, the primary pump for the second boiler can be off with the proper controls.
• Hot Gas Bypass Restriction (6105p). Based on a temperature bin analysis, in the worst case without staged cooling output, hot gas bypass is expected to increase cooling energy by 40% during part load conditions that are experienced when outside air temperatures are between 65°F and 80°F.
• Parking Garage Fan Control (6109pAS). Based on typical associated parking garage sizes, a continuous airflow scenario is compared to one with carbon monoxide control, where the airflow will be relative to the adjacent retail building occupancy schedule.
• Lavatory Hot Water Temperature Limit (7004). The pilot results from the small office were prorated on a service water heating basis to this study.
• Service Hot Water Heat Trap (7005p). The pilot results from the small office were prorated on a service water heating basis to this study.
• Non-general Light Fixture Control (9029). The pilot results were prorated on a lighting power density (LPD) basis to this study.
• Light Fixture Tandem Wiring (9034). The pilot results were prorated on an LPD basis to this study.
3.4
3.2 Assigning Lost Savings to the Worst Case
Once the range of potential found conditions for each measure was identified, a sensitivity analysis was performed to determine the potential lost energy cost savings associated with the worst-case condition. This was accomplished using energy simulation of the prototype models or engineering calculation for the code and worst case. The measure name, reference number, identified conditions for each case, and parameters simulated are shown in Table B.1 (office) and Table B.2 (retail) in Appendix B.
The identified code and worst conditions for each of the 96 measures were simulated and the energy cost for the building was determined under each condition. For each identified condition, the annual energy cost increase compared to the code value was determined and normalized to square feet of conditioned building area and, where appropriate, to a different metric quantifying the building system to which the condition applies. For example, an exterior wall insulation measure is normalized to the area of exterior wall to which the condition applies. An occupancy sensor measure is normalized to the floor area controlled by (or required to be controlled by) occupancy sensors. A cooling equipment efficiency measure is normalized to the cooling capacity (tons) that the measure impacts. These normalized metrics are used to prorate the energy impact determined for the prototypes to actual buildings evaluated in the field studies.

4.1
4.0 Energy Impact Results & Measure Selection
4.1 Worst-Case Lost Energy Savings
To estimate the energy cost, PNNL used annual average commercial building energy prices for states associated with the region where anticipated field work would be completed, as shown in Table 4.1. The prices are based on Energy Information Administration statistics for 2015.1
Table 4.1. Energy Prices Used for Worst-Case Analysis
Climate Zone Representative State $/kWh $/therm 2A Florida $0.0950 $1.053 3B Nevada $0.0892 $0.835 5A Iowa $0.0952 $0.627
4.1.1 A Life-Cycle Perspective: Present Value of Lost Savings
The results from the simulation or calculation provide the annual energy cost impact from the perspective of the first year of building operation. From a codes perspective, the impact on a building related to the life of improvements made as a result of code provisions is important. The value of lost savings for the life of the building or the life of the component that is primarily affected is considered. To account for the time value of money, future savings are discounted using a real discount rate of 3.0% with a factor accounting for escalation of energy prices faster than general inflation. Using a simplified method of projecting life-cycle value of savings, a uniform present value (UPV) factor2 is applied to the annual savings to reflect the discounted value of savings over the measure life. This approach generally follows the methodology established by the Federal Energy Management Program for federal building energy projects (Lavappa et al. 2017).
This analysis ignores replacement costs and in general uses the life of the components. For example, lighting fixtures may last 40 years and have multiple lamp and ballast replacements, or one can simply look at the 15-year ballast life, as when ballasts or electronics are replaced and an opportunity for higher efficiency technology can be used. A longer life than 30 years could be used for some envelope components; however, standard energy escalation rates are not available past 30 years. The different types of measures are listed in Table 4.2 along with their lifetimes. The UPV factors by life and fuel are shown in Table 4.3. These factors are applied to the annual lost energy cost savings previously calculated to find the long-term savings that could accrue from better adherence to the energy code.
1 These prices are from the EIA for 2015 commercial retail prices and are listed in the State Energy Data Systems, https://www.eia.gov/state/seds/. 2 UPV factors are precalculated factors used to project the present value of annually recurring energy costs based on measure life, current DOE discount rates, and projected energy price escalation rates that are variable during the measure life, as determined by DOE’s Energy Information Administration.

4.2
Table 4.2. Measure Lives for Simplified Present Value Savings Analysis
Measure Type Life HVAC controls 15 Lighting controls 15 Building envelope 30 Light fixture (ballasts) 15 HVAC equipment (gas heat) 15 Service hot water (gas) 15 HVAC equipment (heat pump) 15 Service hot water (electric) 15
Table 4.3. Measure UPV for Simplified Present Value Savings Analysis
Life UPV Elec UPV Gas 15 12.81 15.5 18 14.82 18.11 20 16.07 19.76 23 17.8 22.09 30 21.27 26.88
NIST 2017 supplement, FEMP UPV*, 3% discount rate
4.1.1.1 Present Value of Worst-Case Lost Savings
The measures and the lost energy savings of the worst-case condition compared to code requirements are shown in Table 4.4. For each measure, the potential present lost savings value per thousand square feet of applicable floor area is shown. Where a measure is not applicable in the building type by climate zone “NA” is listed. The table also includes information about which measures were selected for inclusion in the field study. An “x” in the right two columns indicates selection by building type. When the measure is selected for only one climate zone, the zone number is included (e.g., “x,5”). The measure selection process is further described in Section 4.1.2.
Table 4.4. Measures with Lost Savings, Present Value $/1000 ft2
Measure Number
Measure Name
Present Value of Lost Energy Cost Savings per 1,000 ft2 Selected for Field Study
Office Retail for Office
for Retail CZ 2A CZ 3B CZ 5A CZ 2A CZ 3B CZ 5A
5012 Roofs shall be insulated to meet CZ requirements $ 2,873 $ 3,330 $ 4,342 $ 9,526 $11,003 $15,114 x x
5013 Skylight curbs shall be insulated $ 26 $ 29 $ 40 $ 45 $ 43 $ 123
5014 Low slope roofs in CZ 1-3 shall be cool roofs $ 311 $ 339 NA $ 707 $ 597 NA x x
5018A Above grade frame walls shall be insulated to meet CZ requirements
$ 1,149 $ 1,259 $ 1,664 $ 2,729 $ 3,209 $ 3,929 x x
5018B
Above grade mass walls shall be insulated to meet CZ and density requirements
$ 606 $ 690 $ 2,618 $ 1,417 $ 1,588 $ 3,731 x x
5021p Below grade wall insulation requirements and protection
NA NA $ 105 NA NA $ 57

4.3
Measure Number
Measure Name
Present Value of Lost Energy Cost Savings per 1,000 ft2 Selected for Field Study
Office Retail for Office
for Retail CZ 2A CZ 3B CZ 5A CZ 2A CZ 3B CZ 5A
5023A Exterior frame floors shall meet the insulation requirements
$ 181 $ 229 $ 665 NA NA NA x,5
5023B
Exterior mass floors shall meet the minimum R-value or U-factor by assembly type
$ 111 $ 156 $ 555 NA NA NA x
5025
Slab-on-grade floors shall meet insulation requirements and be protected
NA NA $ 15 NA NA $ 78
5029A Opaque swing doors shall meet U-factor requirements
$ 1 $ 1 $ 8 $ 4 $ 4 $ 21
5029B Opaque rollup doors shall meet U-factor requirements
NA NA NA $ 94 $ 93 $ 136 x
5034 Window-to-wall ratio shall meet maximum limits
$ 1,689 $ 1,807 $ 1,809 $ 2,594 $ 2,838 $ 3,005 x x
5035 Skylight to roof ratio shall meet maximum limits
$ 467 $ 493 $ 385 $ 1,232 $ 1,314 $ 1,091 x x
5036 Daylighting control when required $ 1,214 $ 1,212 $ 1,031 $ 1,629 $ 1,353 $ 1,444 x x
5038
For large, high-bay spaces total daylight zone under skylights at least 1/2 of floor area
$ 236 $ 216 $ 195 $ 568 $ 472 $ 504 x x
5042A Windows shall meet U-factor requirements $ 324 $ 340 $ 786 $ 448 $ 527 $ 1,274 x x
5042B Windows shall meet SHGC requirements $ 1,275 $ 1,388 $ 714 $ 1,330 $ 1,479 $ 783 x x
5043A Skylights shall meet U-factor requirements $ 281 $ 334 $ 489 $ 593 $ 645 $ 1,262 x x
5043B Skylights shall meet SHGC requirements $ 533 $ 582 $ 267 $ 641 $ 728 $ 237 x x
5056 Building shall meet continuous air barrier requirements
$ 173 $ 111 $ 842 $ 170 $ 150 $ 659 x,5 x
5063 Recessed lighting shall be sealed, rated and labeled $ 8 $ 5 $ 27 $ 39 $ 33 $ 157
5075 Fenestration assemblies shall meet air leakage requirements
$ 229 $ 166 $ 530 $ 103 $ 74 $ 223
5077 Stair and shaft vent leakage $ 126 $ 40 $ 140 $ 193 $ 143 $ 367 x,5
5082 Loading dock doors shall be equipped with weather seals
$ (0) $ - $ 0 $ 0 $ 0 $ 1
5083 Building entrances shall be protected with an enclosed vestibule
NA $ 17 $ 38 NA $ 374 $ 689 x x
5089 Fenestration orientation $ 263 $ 261 $ 509 $ 450 $ 525 $ 1,189 x x
6004A Equipment sizing req’mt for packaged AC $ 2,458 $ 2,713 $ 2,057 $ 2,636 $ 2,997 $ 2,300 x x

4.4
Measure Number
Measure Name
Present Value of Lost Energy Cost Savings per 1,000 ft2 Selected for Field Study
Office Retail for Office
for Retail CZ 2A CZ 3B CZ 5A CZ 2A CZ 3B CZ 5A
6004B Equipment sizing requirement for VAV with electric reheat
$ 2,615 $ 2,467 $ 2,418 NA NA NA x
6005A Packaged air conditioner efficiency $ 769 $ 547 $ 330 $ 351 $ 233 $ 130 x x
6005B Packaged heat pump efficiency $ 352 $ 254 $ 206 $ 337 $ 216 $ 129 x x
6005C Gas furnace efficiency $ 14 $ 12 $ 88 $ 98 $ 85 $ 342 x x 6005D Boiler efficiency $ 78 $ 59 $ 266 NA NA NA x 6005E WSHP efficiency $ 1,364 $ 1,132 $ 800 NA NA NA x
6007A Air-cooled chiller efficiency $ 1,212 $ 694 $ 317 NA NA NA x
6007B Water-cooled chiller efficiency $ 961 $ 481 $ 301 NA NA NA x
6014 Thermostatic control is used for individual zones $ 54 $ 84 $ 60 $ 497 $ 304 $ 245
6016 Humidity control device for each humidity system $ 149 NA $ 206 $ 527 NA $ 407
6017 Heat pump supplementary heat control
$ 26 $ 40 $ 438 $ 84 $ 174 $ 1,326 x,5 x
6018 Thermostat deadband requirement $ 428 $ 334 $ 341 $ 1,127 $ 802 $ 841 x x
6019A Thermostat setback $ 350 $ 312 $ 327 $ 944 $ 924 $ 1,491 x x 6019C Night fan control $ 2,065 $ 2,228 $ 1,814 $ 1,868 $ 2,033 $ 2,244 x x 6023 Optimal start controls $ 51 $ 47 $ 28 $ 227 $ 236 $ 260 x
6025 Damper control when space is unoccupied NA NA $ 49 NA NA $ 219
6026p Snow and ice-melting system control NA $ 216 $ 529 NA $ 929 $ 2,271 x x
6029 Demand control ventilation $ 97 $ 48 $ 129 $ 7 $ 3 $ 9 x
6030 Energy recovery requirement $ 109 $ (0) $ 114 $ 350 $ 124 $ 784 x
6033p Duct insulation requirement $ 905 $ 770 $ 258 $ 2,714 $ 2,310 $ 773 x x
6035 Duct leakage requirement $ 1,204 $ 929 $ 1,845 $ 1,552 $ 1,334 $ 2,609 x x
6042A Hydronic piping insulation requirement CHW
$ (17) $ (7) $ (3) NA NA NA
6042B Hydronic piping insulation requirement HW
$ 1,407 $ 1,143 $ 774 NA NA NA x
6045p Commissioning requirement $ 128 $ 116 $ 113 $ 246 $ 212 $ 236 x x
6046A Fan power limit requirement for package AC and heat pumps
$ 1,223 $ 1,376 $ 1,075 $ 1,306 $ 1,448 $ 1,045 x x
6046B Fan power limit requirement for VAV $ 372 $ 382 $ 284 NA NA NA x
6051 Outdoor heating shall be radiant and controlled with occupancy sensor
NA NA NA $ 494 $ 495 $ 464 x
6056 Economizer supplies 100% design supply air $ 286 $ 434 $ 365 $ 141 $ 202 $ 166 x x

4.5
Measure Number
Measure Name
Present Value of Lost Energy Cost Savings per 1,000 ft2 Selected for Field Study
Office Retail for Office
for Retail CZ 2A CZ 3B CZ 5A CZ 2A CZ 3B CZ 5A
6058
Economizers should have appropriate high-limit shutoff control and be integrated
$ 139 $ 309 $ 194 $ 41 $ 188 $ 76
6066P Water economizer capacity meets requirements
$ 350 $ 530 $ 447 NA NA NA x
6067P Pre-cooling coils have low pressure drop $ 17 $ 36 $ 39 NA NA NA
6070
Multi-zone systems shall be VAV and fans with motors ≥threshold hp shall have variable speed, variable pitch axial, or fan demand reduction
$ 1,405 $ 1,519 $ 1,150 NA NA NA x
6071 Static pressure sensors used to control VAV fans shall be properly placed
$ 464 $ 500 $ 384 NA NA NA x
6075P Multiple boiler systems must include sequencing controls
$ 37 $ 31 $ 101 NA NA NA
6082 WSHP shall have a deadband between heat rejection and addition
$ (188) $ (290) $ (140) NA NA NA
6089
Each WSHP in a system exceeding 10 hp pump shall have a two-position valve
$ 618 $ 619 $ 580 NA NA NA x
6090
Hydronic systems > 300 MBH shall reset supply water temp or reduce system flow
$ 163 $ 119 $ 129 NA NA NA
6091P Multiple chiller shall reduce flow when a chiller is shut down
$ 411 $ 222 $ 238 NA NA NA x
6093P Multiple boilers plants shall reduce flow when a boiler is shut down
$ 43 $ 38 $ 123 NA NA NA
6094 Tower fans ≥ 75 hp shall have variable speed control
$ 8 $ 33 $ 14 NA NA NA
6101
Multiple zone HVAC systems shall have supply-air temperature reset controls
$ 161 $ 241 $ 307 NA NA NA x
6105p
Hot gas bypass only allowed with multiple steps of unloading or capacity modulation
$ 28 $ 20 $ 11 $ 33 $ 22 $ 11
6106AS Dynamic ventilation reset for MZ systems $ 730 $ 241 $ 500 NA NA NA x
6108AS Single zone VAV $ 802 $ 1,061 $ 943 $ 663 $ 860 $ 785 x x
6109PAS Parking garage fan controls $ 1,225 $ 1,228 $ 1,150 $ 2,002 $ 2,006 $ 1,879 x x
6110PAS Zone Isolation $ 345 $ 380 $ 376 NA NA NA x
7002A Water heater efficiency, gas $ 14 $ - $ 12 $ 24 $ 20 $ 18

4.6
Measure Number
Measure Name
Present Value of Lost Energy Cost Savings per 1,000 ft2 Selected for Field Study
Office Retail for Office
for Retail CZ 2A CZ 3B CZ 5A CZ 2A CZ 3B CZ 5A
7002B Water heater efficiency, electric $ 31 $ 31 $ 28 $ 43 $ 43 $ 37
7004
Outlet temperature of lavatories in public facility rest rooms is limited to 110°F (43°C)
$ 24 $ 19 $ 13 $ 10 $ 8 $ 6
7005p SWH heat trap $ 1 $ 0 $ 0 $ 1 $ 1 $ 1
7006 SWH pipe insulation - recirculated $ 325 $ 258 $ 194 $ 745 $ 591 $ 444 x x
7007 SWH pipe insulation - non-recirculated $ 2 $ 1 $ 1 $ 3 $ 3 $ 2
7008
Circulating hot water system pumps and heat trace must have readily-accessible controls to turn them off when not needed
$ 39 $ 31 $ 24 $ 90 $ 72 $ 55
9003 Manual lighting control $ 1,499 $ 1,452 $ 1,242 $ 195 $ 189 $ 164 x
9009 Automatic time switch control $ 2,974 $ 2,887 $ 2,470 $ 6,295 $ 6,103 $ 5,413 x x
9011 Occupancy sensor control $ 422 $ 408 $ 351 $ 377 $ 367 $ 316 x x 9025 Display lighting control NA NA NA $ 282 $ 272 $ 236 x 9028 Task lighting control $ 189 $ 183 $ 157 $ 19 $ 19 $ 16
9029 Lighting for nonvisual applications shall be controlled separately
NA NA NA $ 395 $ 389 $ 331 x
9031 Exterior lighting control $ 779 $ 781 $ 733 $ 991 $ 993 $ 931 x x 9034 Tandem wiring $ 79 $ 79 $ 66 $ 133 $ 146 $ 119
9035 Exit sign maximum power $ 32 $ 31 $ 26 $ 28 $ 29 $ 23
9037 Interior lighting power allowance $ 3,637 $ 3,615 $ 3,022 $ 6,588 $ 6,686 $ 5,447 x x
9047 Additional retail lighting power allowance NA NA NA $ 3,629 $ 3,609 $ 2,996 x
9048 Exterior lighting power allowance $ 774 $ 776 $ 726 $ 986 $ 987 $ 925 x x
9049pAS Electric feeder and branch circuit maximum voltage drop
$ 26 $ 25 $ 21 $ 40 $ 38 $ 32
9054AS Parking garage lighting controls $ 363 $ 363 $ 340 $ 581 $ 582 $ 546 x x
9055pAS Plug load controls $ 455 $ 456 $ 427 $ 16 $ 16 $ 15 15007 Optional onsite renewable $ 436 $ 533 $ 373 $ 868 $ 1,060 $ 741 x x CHW = chilled water; HW = heated water; MBH = thousands of British thermal units per hour; MZ = multi-zone; SWH = service water heating; WSHP = water source heat pump.
4.7
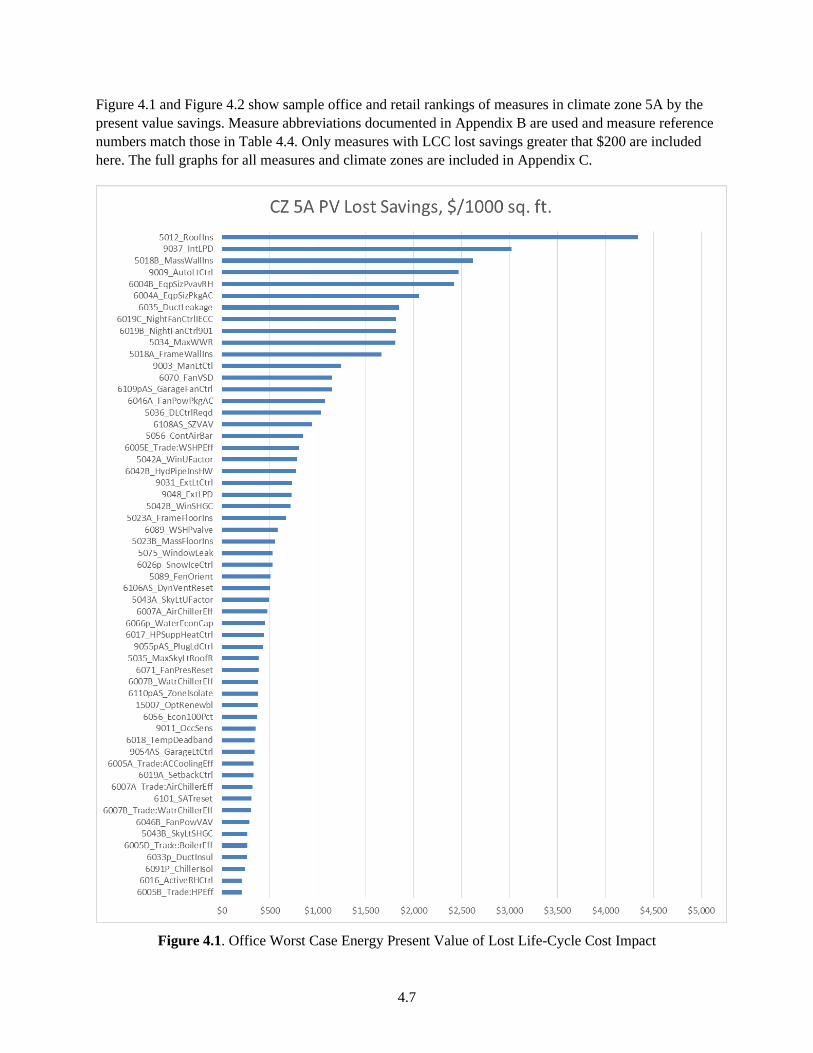
Figure 4.1 and Figure 4.2 show sample office and retail rankings of measures in climate zone 5A by the present value savings. Measure abbreviations documented in Appendix B are used and measure reference numbers match those in Table 4.4. Only measures with LCC lost savings greater that $200 are included here. The full graphs for all measures and climate zones are included in Appendix C.
Figure 4.1. Office Worst Case Energy Present Value of Lost Life-Cycle Cost Impact

4.8
Figure 4.2. Retail Worst Case Energy Present Value of Lost Life-Cycle Cost Impact

4.9
4.1.2 Measure Selection for Field Study
Commercial code compliance verification requires a great deal of field time and can be costly. To reduce the cost of verification, the pilot method (Rosenberg et al. 2016) recommended a Pareto principle approach—looking at the measures likely to have the largest impact if compliance is poor. To this end, the measures were identified as discussed in Section 2.0, then evaluated using energy simulation or calculation to identify the largest potential contributors to lost savings. The results of this analysis are shown in a present cost basis in Table 4.4.
Based on these results, the project team selected measures for inclusion in the field study. Generally, measures with a present value lost savings potential greater than $200 were selected. In some cases, a higher cutoff was used where verification was thought to be difficult. In other cases, a lower cutoff was used where there were similar measures that were being inspected or verification was thought to be easier. The count of selected measures by climate zone and building type is shown in Table 4.5.
Table 4.5. Measures Identified and Selected for Field Study
Building Type Office Retail Climate Zone 2A 3B 5A 2A 3B 5A Applicable Measures 86 87 90 67 68 71 Selected Measures 55 55 58 46 46 47 Percentage Selected 64% 63% 64% 69% 68% 66%
The results of individual measure selection are shown in Table 4.4, where an X in the selection columns to the right indicates that the measure is included in the next phase of field studies for office and retail. If a measure was selected for only one climate zone, that is shown in the selection columns. The summary of selected measures in Table 4.5 indicates a high percentage of measures were selected for the next phase of field study. The reason was to make sure that any potentially large contributor to lost savings was captured. The purpose of the field study is to further reduce the number of measures that need verification by gathering actual data in four areas:
• What is the actual worst case for each measure discovered in the field? In many cases it may not be as bad as the theoretical worst case that was modeled and that would limit the impact of the measure on lost energy cost savings.
• What is the applicability of each measure in an actual sample of buildings? Measures that rarely occur will have a lesser impact on the total lost savings related to energy codes.
• What is the typical condition for each measure found in the field? Understanding the typical distribution of as-found conditions can allow an expected value of lost savings to be assigned to each measure.
• What is the effort involved in verifying each measure? It may be more beneficial to focus on verifying measures that have a high lost savings per hour of inspection time.
Once that additional information is gathered for a valid sample of instances for each measure, then the expected lost savings relative to the verification cost can be identified. This is discussed further in the pilot study (Rosenberg et al. 2016). Once measures are ranked in this way with more field data, then a much smaller set of measures can be included in the measure list for verification in future evaluations.

4.10
4.1.3 Field Study Adjustments
As the field study was launched, several changes were made in the field data collection tool:
• It was determined that only climate zones 2A and 5A would be included in the actual field work, so final measure analysis results for climate zone 3A were not developed.
• Measures 6004A and 6004B were dropped. These measures were based on requirements that HVAC systems not be oversized. The analyzed lost savings were fairly large for these measures due to fan savings on oversized constant volume systems and high minimum box positions on oversized VAV systems. However, there was no way to actually determine what a reasonable “code” system size should be. There is extensive latitude for the designer to consider future internal load growth, change of occupancy, and even higher loads due to climate change. So, after much consideration, it was decided that a code sizing condition cannot readily be determined and the measure was dropped.
• Night fan control measure 6019C was initially modeled separately for ASHRAE 90.1 and IECC for retail to reflect differences in outside air damper requirements. These were consolidated into one measure, as results were very close.
• Thermostat setback was originally one measure, and was split into two – 6019A for heating and 6019B for cooling – to facilitate correct entry of separate setbacks.
• There were several other adjustments in the field tool to clarify exactly what inputs were needed, more clearly define discrete inputs, or allow for metric inputs for special cases.

5.1
5.0 Application to Field Study
5.1 Translating Prototype Impact to Field Impact
To convert the found field condition for each measure to lost energy cost savings, mathematical relationships were developed based on the simulations of measure conditions discussed in Section 4.0.
5.1.1 Developing Regressions for Lost Savings Projection
Three types of input for field measures are expected:
• Direct Parameter Input is a case where the parametric values used in the simulation model can be matched with input verified on the plans or in the field. These have two types:
– Straight parameters – the code required, design, or field parameter matches the simulated parameter, such as U-factor, LPD, or brake horse power limit.
– Field parameters are adjusted to modeled parameters. There are three general cases:
○ One type of efficiency metric is modeled but another is found in the actual building; for example, cooling coefficient of performance (COP) without fan energy is modeled for packaged equipment, so accommodations are made to adjust energy efficiency ratio (EER) to COP. A similar approach is used to adjust rated AFUE to modeled Et for furnaces or heating seasonal performance factor (HSPF) to COP for heat pumps.
○ R-value is input for duct or pipe insulation, then adjusted to U-factor by adding air surface resistance.
○ Input field takeoff adjusted to match modeled scalar parameters such as input lighting watts and area adjusted to LPD and input of water economizer capacity required and actual transformed to percent of provided capacity.
• Quality Adjusted Direct Parameter Input – use code or calculated input parameter, then adjust input based on quality, e.g., insulation installation quality adjusts the input U-factor.
• Select; user selects from a list of discrete code and field conditions.
Separate regressions were developed for each energy type (gas and electric). In all cases, the regressions were non-interactive and restricted to the measure parameters, so they were simple with one parametric input value and results normalized to a metric in the simulation model. Two types of regression calculations were used:
• First order linear regression was applied for most cases. In almost all cases, there were at least three data points (worst, code, and best), so the validity of linearity could be observed.
• Second order regression is used when the curve fit was non-linear, indicated by a linear regression with a coefficient of determination (R2) lower than 0.98. This primarily applied to floor, roof and door insulation, fenestration factors, cool roof, air barrier, LPD, and setback control temperature. For many of the second order regressions, a fourth “below code” case between worst and code was added to improve the curve accuracy.

5.2
5.1.2 Applying Regression Results to Field Buildings
Section 4.0 presents the lost energy cost savings from code to worst as determined from the sensitivity analysis. Using these results and the developed regressions, requirements and actual found conditions can be documented for a building and lost energy cost savings can then be attributed to a similar building based on the quantity of each metric to which a given condition applies. Two approaches were used to capture the field condition where inputs are either parametric or discrete.
5.1.2.1 Parametric Field Inputs
For most measures, an infinite number of conditions could occur between the best and worst conditions. An example is LPD. While it would be impossible to simulate every LPD that may be found in a building, by capturing the endpoints (range) of possibilities and some intermediate conditions, application of a regression formula can be used when conditions in the field do not exactly correspond to a simulated condition. Other examples include envelope assembly U-factors, system efficiencies, and thermostat setback/setup. Direct parameters can be input for the required (or performance), plan takeoff, and as-found conditions. Good examples of this type of input are building envelope assembly U-factor or equipment efficiencies. In some cases, particularly for insulation, a discrete installation quality condition is selected and a quality multiplier is applied to the parametric input.
5.1.2.2 Discrete Field Inputs
About 45% of the measures are better captured with a discrete condition input rather than a scalar parameter. Examples include vestibules, demand controlled ventilation, control of outdoor heat, and commissioning quality. Some measures that could be characterized with a parameter are set up as discrete inputs to facilitate field data capture where the exact parameter was difficult to obtain. A prime example is air barrier evaluation. While the actual tested envelope leakage seems a reasonable input, that value is not available unless envelope testing is completed, which is not a code requirement. If not, then air barrier results must be determined by qualitative assessment, so a discrete range of options that covers both inspections and testing was appropriate. To accommodate these measures, each discrete condition is assigned a point rating. To aid in that process, each condition was assigned an energy cost rating (ECR) from +10 for the best condition (exceeding code) to -10 for the worst condition (below code). Conditions meeting code were assigned a rating of 0. Conditions in between were scored by the ratio of their cost savings or loss compared to the savings and loss of the best and worst conditions.
𝐸𝐸𝐸𝐸𝐸𝐸𝑎𝑎𝑎𝑎𝑎𝑎𝑎𝑎𝑎𝑎 = 10 × (𝑐𝑐𝑎𝑎𝑐𝑐𝑐𝑐𝑐𝑐𝑐𝑐𝑐𝑐𝑎𝑎𝑐𝑐 𝑐𝑐𝑎𝑎𝑐𝑐𝑐𝑐−𝑎𝑎𝑎𝑎𝑐𝑐𝑎𝑎𝑏𝑏𝑐𝑐𝑐𝑐𝑎𝑎 𝑐𝑐𝑎𝑎𝑐𝑐𝑐𝑐)(𝑎𝑎𝑎𝑎𝑐𝑐𝑐𝑐 𝑐𝑐𝑎𝑎𝑐𝑐𝑐𝑐𝑐𝑐𝑐𝑐𝑐𝑐𝑎𝑎𝑐𝑐 𝑐𝑐𝑎𝑎𝑐𝑐𝑐𝑐−𝑎𝑎𝑎𝑎𝑐𝑐𝑎𝑎𝑏𝑏𝑐𝑐𝑐𝑐𝑎𝑎 𝑐𝑐𝑎𝑎𝑐𝑐𝑐𝑐) (5.1)
𝐸𝐸𝐸𝐸𝐸𝐸𝑎𝑎𝑎𝑎𝑏𝑏𝑎𝑎𝑏𝑏 = 10 × (𝑎𝑎𝑎𝑎𝑐𝑐𝑎𝑎𝑏𝑏𝑐𝑐𝑐𝑐𝑎𝑎 𝑐𝑐𝑎𝑎𝑐𝑐𝑐𝑐−𝑐𝑐𝑎𝑎𝑐𝑐𝑐𝑐𝑐𝑐𝑐𝑐𝑐𝑐𝑎𝑎𝑐𝑐 𝑐𝑐𝑎𝑎𝑐𝑐𝑐𝑐)(𝑏𝑏𝑎𝑎𝑤𝑤𝑐𝑐𝑐𝑐 𝑐𝑐𝑎𝑎𝑐𝑐𝑐𝑐𝑐𝑐𝑐𝑐𝑐𝑐𝑎𝑎𝑐𝑐 𝑐𝑐𝑎𝑎𝑐𝑐𝑐𝑐−𝑎𝑎𝑎𝑎𝑐𝑐𝑎𝑎𝑏𝑏𝑐𝑐𝑐𝑐𝑎𝑎 𝑐𝑐𝑎𝑎𝑐𝑐𝑐𝑐) (5.2)
Where: ECRabove = energy cost rating of conditions above code
ECRbelow = energy cost rating of conditions below code Condition cost = annual utility cost of a building given a single measure not equal to code Baseline cost = annual utility cost of a building given all measures equal to code

5.3
5.2 Data Collection Forms
To ensure field data will be collected consistently and all needed information is collected, forms were given to field verification teams to complete for each building and training was provided. The intent is to make the results as consistent and unbiased as possible by determining conditions for each measure in an objective and repeatable way. In general, the forms collect descriptive information about the building (size, location, occupancy type, area, etc.) and specific information regarding the conditions encountered for each code measure. In addition, the field team was asked to record the amount of time spent verifying each measure during plan review and in the field. Time for general activities (meeting with the owner’s representatives, collecting plans, travel to site, etc.) was also collected. Parts of a sample data collection form are shown in Appendix D. The forms include the following data fields to be completed by the field verification team.
General Building Information The following fields are completed for each building in the field study.
Conditioned Floor Area: Conditioned floor area Building type: Office or Retail ASHRAE Climate Zone: 2A or 5A Number of Floors: Number of floors, both above and below grade Scope Full building; Part of building; Shell/fill; Second infill Option Path: IECC C406 extra efficiency option used Compliance Path: Prescriptive; Envelope Tradeoff; Performance (Section C407). Building Identifier: A unique number given to each building to anonymize the
results. City/State: City and state location of the audited building. Actual Code: Specific energy code project was permitted under. HVAC System Type: Identify main system type serving the building. Occupancy: For mixed occupancies, percent of floor area for main and other
types is noted. General Comments: Any special comments the auditor thinks might be pertinent. Equipment in building: Check off which of 8 types of HVAC equipment are in the
building. Time Accounting: The contractor is asked to record the time spent for the
categories of general activities, travel and indirect, envelope, lighting power, lighting controls, mechanical and SWH equipment, and mechanical and SWH controls.
Measure Specific Information The following fields are collected for each of the 96 measures that were applicable to each building.
Applies to Building: Indicate whether specific measure applies to the building. Factor Units: Where more than one type of unit could apply, select; e.g., EER
vs. SEER. Plan: Indicate whether compliance was verified in building plans.

5.4
Condition or Input Factor: Select the measure condition closest to that observed from pull down menu or input the condition parameter. These are input separately for the code requirement; plan takeoff; and as-found condition. Examples include EER, U-factor, LPD, window-to-wall ratio.
Field Verification Level: Indicate whether compliance was verified by actual in-field inspection; inferred or unknown.
Applicable Quantity Affected: The quantity of systems or components to which the specific condition applies. Examples include cfm, tons, MBH, ft2, watts, etc.
Measure Specific Comments: Any comments pertaining to the measure, particularly, variations from the condition chosen from the pull down menu.
Measure Time: Auditor enters the estimated time in hours spent verifying the measure during plan review.
Surveyed Floor Area: If less or more than the conditioned area is surveyed for this measure, overwrite the default building value.
5.2.1 Cost of Compliance Verification
One goal of the field work is to further test a methodology to identify measures that have the highest potential of lost savings for the effort required to find their compliance condition. During the plan reviews and site inspections, the reviewer will identify hours spent specifically verifying individual measures. This allows the lost savings cost to be calculated in dollars per verification hour. In other words, what possible savings could occur through better compliance per hour spent on the verification process based on this field study?

6.1
6.0 Conclusions
The following conclusions can be made at this phase of the overall investigation into energy code compliance.
• About two-thirds of energy code measures have worst-case potential LCC savings greater than $200 and are included for phase two field investigation.
• Both parametric and discrete inputs are required to cover the range of measures included.
• Simple first and second order regressions based on simulations allow a reasonable estimate of lost savings to be made when measures do not meet code or performance requirements.
Table 6.1 shows the top 20 measures based on including the top 10 measures (bolded) from each case of building type and climate zone combination. They are then ranked by the average of case rankings. This ranking is highly preliminary, as it does not include the important information that will come from the field studies as discussed in Section 4.1.2: actual worst case in the field, actual field applicability, typical as found field condition, and effort required to verify each measure’s condition.
Table 6.1. Top 20 Measures Based on Worst Case Analysis*
Measure ID
Measure Name
Present Value of Lost Energy Cost Savings per 1,000 ft2 Office Retail Average
2A 3B 5A 2A 3B 5A Impact 5012 Roofs insulated per CZ requirements $2,873 $3,330 $4,342 $9,526 $11,003 $15,114 $7,698 9037 Interior lighting power allowance $3,637 $3,615 $3,022 $6,588 $6,686 $5,447 $4,832 9009 Automatic time switch control $2,974 $2,887 $2,470 $6,295 $6,103 $5,413 $4,357 9047 Additional retail lighting power allowance NA NA NA $3,629 $3,609 $2,996 $3,411
5034 Window-to-wall ratio shall meet maximum limits $1,689 $1,807 $1,809 $2,594 $2,838 $3,005 $2,290
6019C Night fan control $2,065 $2,228 $1,814 $1,868 $2,033 $2,244 $2,042 5018A Frame walls insulated per CZ req'mt $1,149 $1,259 $1,664 $2,729 $3,209 $3,929 $2,323
6070 Multi-zone systems shall be VAV with VSD motors where required $1,405 $1,519 $1,150 NA NA NA $1,358
6109pAS Parking garage fan controls $1,225 $1,228 $1,150 $2,002 $2,006 $1,879 $1,582
5018B Above grade mass walls insulated per CZ and density requirements $606 $690 $2,618 $1,417 $1,588 $3,731 $1,775
6035 Exterior duct leakage requirement $1,204 $929 $1,845 $1,552 $1,334 $2,609 $1,579 6042B Hydronic piping insulation $1,407 $1,143 $774 NA NA NA $1,108 5036 Daylighting control when required $1,214 $1,212 $1,031 $1,629 $1,353 $1,444 $1,314 6046A Fan power limit for unitary AC $1,223 $1,376 $1,075 $1,306 $1,448 $1,045 $1,245 6005E WSHP efficiency $1,364 $1,132 $800 NA NA NA $1,099 5042B Windows meet SHGC requirements $1,275 $1,388 $714 $1,330 $1,479 $783 $1,162 6033p Exterior duct insulation requirement $905 $770 $258 $2,714 $2,310 $773 $1,288 6026p Snow and ice-melting system control NA $216 $529 NA $929 $2,271 $986 9003 Manual lighting control $1,499 $1,452 $1,242 $195 $189 $164 $790 6019A Thermostat setback, heating $350 $312 $327 $944 $924 $1,491 $725 * Equipment sizing measures were eliminated from the field study, as discussed in Section 4.1.3. VSD = variable speed drive.

7.1
7.0 References
ARRA. 2009. American Recovery and Reinvestment Act of 2009. Available at http://www.gpo.gov/fdsys/pkg/BILLS-111hr1enr/pdf/BILLS-111hr1enr.pdf.
ASHRAE. 2010. Energy Standard for Buildings Except Low-Rise Residential Buildings. ANSI/ASHRAE/IES Standard 90.1-2010, American Society of Heating, Refrigerating, and Air-Conditioning Engineers, Atlanta, GA.
DOE. 2010. Measuring State Energy Code Performance. U.S. Department of Energy, Washington, D.C. Accessed September 10, 2015, at https://www.energycodes.gov/sites/default/files/documents/MeasuringStateCompliance.pdf.
DOE. 2013. 90% Compliance Pilot Studies. U.S. Department of Energy, Washington, D.C.
DOE. 2018. About Building Energy Codes. U.S. Department of Energy, Washington, D.C. https://www.energycodes.gov/about.
DOE. 2019. Building Energy Codes Program, Status of State Energy Code Adoption. Washington, D.C. http://www.energycodes.gov/adoption/states.
DOE. 2016. Commercial Prototype Building Models. U.S. Department of Energy, Washington, D.C. https://www.energycodes.gov/commercial-prototype-building-models.
EIA. 2015. Commercial Buildings Energy Consumption Survey 2012. Energy Information Administration of the U.S. Department of Energy, Washington, D.C. https://www.eia.gov/consumption/commercial/data/2012/#b1-b2.
ICC. 2012. 2012 International Energy Conservation Code. International Code Council, Washington, D.C.
Lavappa, P, JD Kneifel and EG O’Rear. 2017. Energy Price Indices and Discount Factors for Life-Cycle Cost Analysis-2017: Annual Supplement to NIST Handbook 135. NISTIR 85-3273-32, National Institute of Standards and Technology, Washington, D.C. Available at https://nvlpubs.nist.gov/nistpubs/ir/2017/NIST.IR.85-3273-32.pdf.
Mills E, H Friedman, T Powell, N Bourassa, D Claridge, T Haasl, and MA Piette. 2004. The Cost-Effectiveness of Commercial-Buildings Commissioning: A Meta-Analysis of Energy and Non-Energy Impacts in Existing Buildings and New Construction in the United States. Report 56637, Lawrence Berkeley National Laboratory, Berkeley, CA.
Rosenberg, M, R Hart, R Athalye, J Zhang, W Wang, and B Liu. 2016. An Approach to Assessing Potential Energy Cost Savings from Increased Energy Code Compliance in Commercial Buildings. PNNL-24979, Pacific Northwest National Laboratory, Richland, WA.

7.2
Thornton B, M Rosenberg, E Richman, W Wang, Y Xie, J Zhang, H Cho, V Mendon, R Athalye, and B Liu. 2011. Achieving the 30% Goal: Energy and Cost Savings Analysis of ASHRAE Standard 90.1-2010. PNNL-20405, Pacific Northwest National Laboratory, Richland, WA.

Appendix A
2012 IECC Code Measures and Associated Requirements

A.1
Appendix A
Code Measures and Associated Requirements
Table A.1. Code Requirements and Measures from the 2012 IECC
Standard 90.1-2013 measures are shown with red section numbers
Measure ID Measure name
2012 IECC or 90.1-2010 Section Requirement Summary
Envelope 5012 Roofs shall be insulated to
meet CZ requirements C402.2.1 Roofs shall meet minimum R-value or U-factor by assembly
type.
C303.1.1 Insulation shall have an R-value identification mark.
C303.1.1 Blown or sprayed insulation shall have a certification letter.
C303.1.1 Spray polyurethane foam shall have a certification letter.
C303.1.1 The insulation installer shall sign, date, and post the certification.
C303.1.1.1 Blown-in or sprayed roof/ceiling insulation shall have thickness markers.
C303.1.1.1 The thickness markers shall be affixed to the trusses or joists.
C303.1.1.1 Markers shall face the attic access opening.
C303.1.1.1 Spray foam thickness and installed R shall be on the
certification.
C303.1.2 Manufacturer's R-value marks must be observable.
C402.2 Multiple layers of continuous insulation must be overlapped properly.
C303.1.4 R-value of insulation shall be determined in accordance with FTC rules.
5013 Skylight curbs shall be insulated
C402.2.1 Skylight curbs shall be insulated to the level of roofs with insulation entirely above deck or R-5, whichever is less.
5014 Low slope roofs in CZ 1-3 shall be cool roofs
C402.2.1.1 Low-sloped roofs in climate zones 1-3 shall be cool roofs (various exceptions).
5018A Above grade frame walls shall be insulated to meet CZ requirements
C402.2.3 Above grade walls shall meet minimum R-value or U-factor by assembly type.
C402.2 Multiple layers of continuous insulation must be overlapped properly.
C402.2 If manufacturer’s instructions for continuous insulation do not address multiple layers, edges shall be staggered.
C303.1.1 Insulation shall have an R-value identification mark.
C303.1.1 Blown or sprayed insulation shall have a certification letter.
C303.1.1 Spray polyurethane foam shall have a certification letter.
C303.1.1 The insulation installer shall sign, date, and post the
certification.
C303.1.2 Manufacturer's R-value marks must be observable.
C303.1.4 R-value of insulation shall be determined in accordance with FTC rules.
5018B Above grade mass walls shall be insulated to meet CZ and density requirements
C402.2.3 Above grade walls shall meet minimum R-value or U-factor by assembly type.

A.2
Measure ID Measure name
2012 IECC or 90.1-2010 Section Requirement Summary
C402.2 Multiple layers of continuous insulation must be overlapped properly.
C402.2 If manufacturer’s instructions for continuous insulation do not address multiple layers, edges shall be staggered.
C402.2.3 Mass walls meet specified pound per square foot of surface area and may require a specified density.
C303.1.1 Insulation shall have an R-value identification mark.
C303.1.1 Blown or sprayed insulation shall have a certification letter.
C303.1.1 Spray polyurethane foam shall have a certification letter.
C303.1.1 The insulation installer shall sign, date, and post the
certification.
C303.1.2 Manufacturer's R-value marks must be observable.
C303.1.4 R-value of insulation shall be determined in accordance with FTC rules.
5021p Below grade walls shall meet insulation requirements and be protected
C402.2.4 Below grade walls shall meet minimum R-value or C-value.
C402.2.4 Below-grade wall insulation shall extend to the level of the floor or 10' whichever is less.
C303.1.1 Insulation shall have an R-value identification mark.
C303.1.1 Blown or sprayed insulation shall have a certification letter.
C303.1.1 Spray polyurethane foam shall have a certification letter.
C303.1.1 The insulation installer shall sign, date, and post the
certification.
C303.1.2 Manufacturer's R-value marks must be observable.
C303.1.4 R-value of insulation shall be determined in accordance with FTC rules.
C303.2.1 Exterior insulation for SOG and basement walls shall have ridged protective covering extending at least 6" below grade.
5023 Exterior floors shall meet the minimum R-value or U-factor by assembly type
C402.2.5 Exterior floors shall meet minimum R-value or U-factor by assembly type.
C402.2.5 Mass floors must have a specified pound per square foot of wall area and may require a specified density.
C303.1.1 Insulation shall have an R-value identification mark.
C303.1.1 Blown or sprayed insulation shall have a certification letter.
C303.1.1 Spray polyurethane foam shall have a certification letter.
C303.1.1 The insulation installer shall sign, date, and post the
certification.
C303.1.2 Manufacturer's R-value marks must be observable.
C303.1.4 R-value of insulation shall be determined in accordance with FTC rules.
5025 Slab-on-grade floors shall meet insulation requirements and be protected
C402.2.6 Slab-on-grade floors shall meet minimum R-value or F-factor requirements.
C402.2.6 Slab-on-grade insulation shall be positioned and of the appropriate length, by assembly type.
C402.2.6 Exterior slab-on-grade insulation extending horizontally shall be protected by soil or paving.
C303.1.1 Insulation shall have an R-value identification mark.
C303.1.1 Blown or sprayed insulation shall have a certification letter.
C303.1.1 Spray polyurethane foam shall have a certification letter.

A.3
Measure ID Measure name
2012 IECC or 90.1-2010 Section Requirement Summary
C303.1.1 The insulation installer shall sign, date, and post the certification.
C303.1.2 Manufacturer's R-value marks must be observable.
C303.1.4 R-value of insulation shall be determined in accordance with
FTC rules.
C303.2.1 Exterior insulation for SOG and basement walls shall have
ridged protective covering extending at least 6" below grade.
5029 Opaque doors shall meet U-factor requirements
C402.2.7 Opaque doors shall meet maximum U-factor requirements by door type.
5034 Window-to-wall ratio shall meet maximum limits
C402.3.1 Vertical fenestration area shall not exceed 30% of gross above-grade wall area.
5035 Skylight area shall meet maximum limits
C402.3.1 Skylight area shall not exceed 3% of gross roof area.
C402.3.1.2 Up to 5% of roof area in skylights is allowed if daylighting controls are provided.
9014A Automatic daylighting controls when required
C402.3.1.1 In climate zones 1-6, up to 40% of gross above-grade wall area is allowed for vertical fenestration if >50% floor is daylit and daylighting controls are provided.
C405.2.2.3 Daylight zone lights shall be controlled independently of general area lighting.
C402.3.2.1 Lighting in daylight zones from skylights shall be controlled by multilevel lighting controls.
C405.2.2.3 Daylight control zones shall be smaller than 2,500 square feet.
C405.2.2.3 Contiguous daylight zones by vertical fenestration may be controlled by a single controlling device.
C405.2.2.3 Daylight zones under skylights shall be controlled separately from daylight zones adjacent to vertical fenestration.
C405.2.2.3.1 Manual controls shall be installed in daylight zones unless automatic controls are installed.
C405.2.2.3.2 Set-point and other controls for calibrating the lighting control device shall be readily accessible.
C405.2.2.3.2 Daylighting controls shall be continuous dimming or step dimming.
C405.2.2.3.2 Daylighting controls shall provide at least two control channels per zone and a minimum of three controls steps.
C405.2.2.3.3 When multi-level controls are required, general lighting in daylight zones shall be controlled by multi-level lighting controls.
C405.2.2.3.3 When daylit illuminance is greater than rated illuminance of general lighting, the power of the general lighting shall be reduced.
9014B Total daylight zone under skylights at least 1/2 of floor area
C402.3.2 In large spaces >10,000 ft2 with >15' ceilings of certain space types, the total daylight zone under skylights shall be no less than the half the floor area.
C402.3.2 In large spaces >10,000 ft2 with >15' ceilings of certain space types, shall have a minimum skylight area equal to not less than 3% of roof with a VT of at least 0.40 or an effective aperture of at least 1%.
C402.3.2.2 Skylights in some spaces must have skylights with diffuse lighting characteristics.
C405.2.2.3 Daylight zone lights shall be controlled independently of general area lighting.
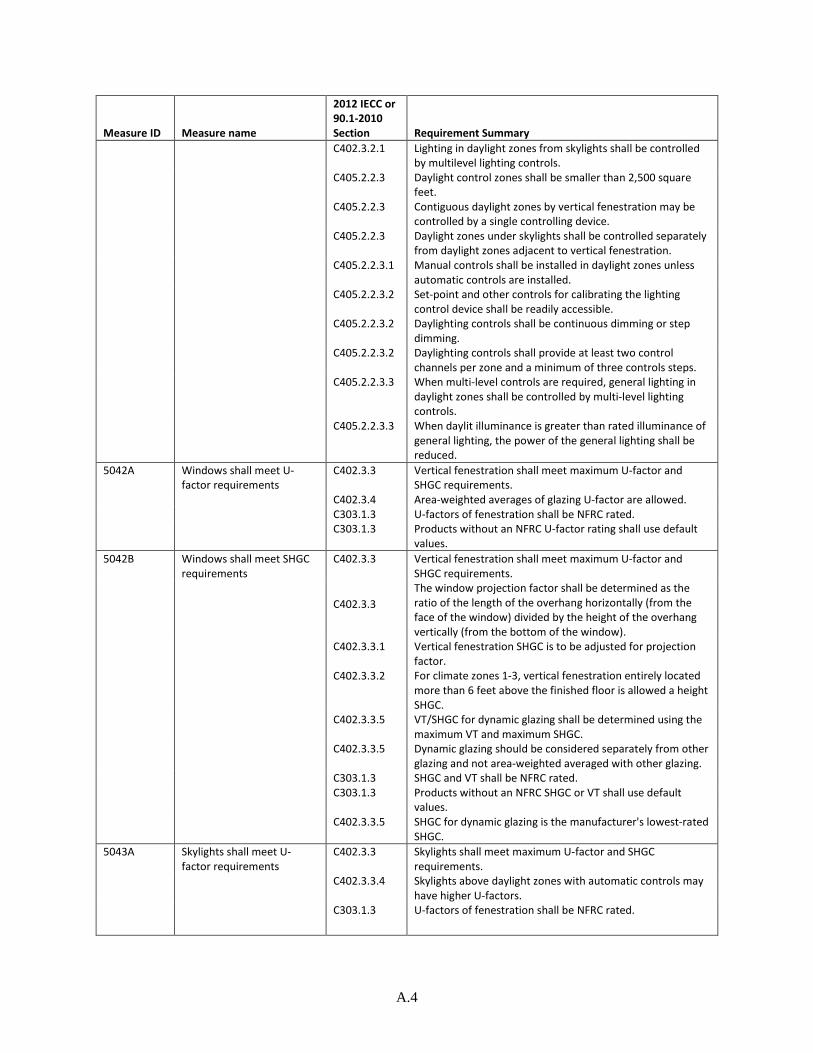
A.4
Measure ID Measure name
2012 IECC or 90.1-2010 Section Requirement Summary
C402.3.2.1 Lighting in daylight zones from skylights shall be controlled by multilevel lighting controls.
C405.2.2.3 Daylight control zones shall be smaller than 2,500 square feet.
C405.2.2.3 Contiguous daylight zones by vertical fenestration may be controlled by a single controlling device.
C405.2.2.3 Daylight zones under skylights shall be controlled separately from daylight zones adjacent to vertical fenestration.
C405.2.2.3.1 Manual controls shall be installed in daylight zones unless automatic controls are installed.
C405.2.2.3.2 Set-point and other controls for calibrating the lighting control device shall be readily accessible.
C405.2.2.3.2 Daylighting controls shall be continuous dimming or step dimming.
C405.2.2.3.2 Daylighting controls shall provide at least two control channels per zone and a minimum of three controls steps.
C405.2.2.3.3 When multi-level controls are required, general lighting in daylight zones shall be controlled by multi-level lighting controls.
C405.2.2.3.3 When daylit illuminance is greater than rated illuminance of general lighting, the power of the general lighting shall be reduced.
5042A Windows shall meet U-factor requirements
C402.3.3 Vertical fenestration shall meet maximum U-factor and SHGC requirements.
C402.3.4 Area-weighted averages of glazing U-factor are allowed.
C303.1.3 U-factors of fenestration shall be NFRC rated.
C303.1.3 Products without an NFRC U-factor rating shall use default values.
5042B Windows shall meet SHGC requirements
C402.3.3 Vertical fenestration shall meet maximum U-factor and SHGC requirements.
C402.3.3 The window projection factor shall be determined as the ratio of the length of the overhang horizontally (from the face of the window) divided by the height of the overhang vertically (from the bottom of the window).
C402.3.3.1 Vertical fenestration SHGC is to be adjusted for projection factor.
C402.3.3.2 For climate zones 1-3, vertical fenestration entirely located more than 6 feet above the finished floor is allowed a height SHGC.
C402.3.3.5 VT/SHGC for dynamic glazing shall be determined using the maximum VT and maximum SHGC.
C402.3.3.5 Dynamic glazing should be considered separately from other glazing and not area-weighted averaged with other glazing.
C303.1.3 SHGC and VT shall be NFRC rated.
C303.1.3 Products without an NFRC SHGC or VT shall use default
values.
C402.3.3.5 SHGC for dynamic glazing is the manufacturer's lowest-rated
SHGC. 5043A Skylights shall meet U-
factor requirements C402.3.3 Skylights shall meet maximum U-factor and SHGC
requirements.
C402.3.3.4 Skylights above daylight zones with automatic controls may
have higher U-factors.
C303.1.3 U-factors of fenestration shall be NFRC rated.

A.5
Measure ID Measure name
2012 IECC or 90.1-2010 Section Requirement Summary
C303.1.3 Products without an NFRC U-factor rating shall use default values.
5043B Skylights shall meet SHGC requirements
C402.3.3 Skylights shall meet maximum U-factor and SHGC requirements.
C402.3.3.3 In climate Zones 1 through 6, skylights shall be permitted a maximum SHGC of 0.60 where located above daylight zones provided with automated daylighting controls.
C303.1.3 U-factors of fenestration shall be NFRC rated.
C303.1.3 SHGC and VT shall be NFRC rated.
C303.1.3 Products without an NFRC SHGC or VT shall use default values.
C402.3.3.5 SHGC for dynamic glazing is the manufacturer's lowest-rated SHGC.
5056 Building shall meet continuous air barrier requirements
C402.4.1 A continuous air barrier shall be provided throughout the building thermal envelope.
C402.4.1.1 Air barriers shall be continuous across all assemblies in the thermal envelope of the building and across the joints and assemblies.
C402.4.1.1 Air barrier joints and seams shall be sealed, including sealing transitions in places and changes in materials.
C402.4.1.1 Air barrier penetrations shall be sealed.
C402.4.1.1 Joints and seals should be installed securely to resist positive
and negative pressure.
C402.4.1.1 The air barrier must be maintained around penetrations.
C402.4.2 Air barrier penetrations shall be caulked, gasketed, or sealed.
C402.4.2 Joints and seams shall be caulked, gasketed, or sealed.
C402.4.2 Sealing materials shall be appropriate to the construction
materials being sealed.
C402.4.2 Joints and seals should be installed securely to resist positive
and negative pressure.
C402.4.1.2 The continuous air barrier must comply with one of three
options - materials, assemblies, or testing.
C402.4.1.2.1 Materials with low air permeability are acceptable air
barriers.
C402.4.1.2.1 Fifteen specific low permeability materials are listed.
C402.4.1.2.2 Assemblies with low air leakage are acceptable as air barriers.
C402.4.1.2.2 Coated concrete masonry walls and Portland cement/sand purge, stucco or plaster are acceptable as air barriers.
C402.4.1.2.3 A completed building with a low tested air leakage rate is acceptable for air barrier requirements.
5063 Recessed lighting shall be sealed, rated and labeled
C402.4.1.1 Recessed lighting fixtures shall be sealed and IC-rated and labeled.
C402.4.8 Recessed lighting shall be sealed.
C402.4.8 Recessed luminaires shall be IC-rated and labelled.
C402.4.8 Recessed luminaires shall be sealed between housing and wall or ceiling covering.
5075 Fenestration assemblies shall meet air leakage requirements
C402.4.3 The air leakage of fenestration assemblies shall meet maximum values by assembly type.
C402.4.3 Fenestration air leakage testing shall use the applicable reference standard and be done by an accredited independent testing laboratory.

A.6
Measure ID Measure name
2012 IECC or 90.1-2010 Section Requirement Summary
5077 Building openings to shafts, chutes, stairways, and elevator lobbies shall meet air leakage requirements
C402.4.4 Doors and access openings to shafts, chutes, stairways, and elevator lobbies shall be labeled for leakage or gasketed, weather-stripped or sealed.
5079 Stairway and shaft vents shall be provided with Class I motorized dampers
C402.4.5.1 Stairway and shaft vents shall be provided with Class I motorized dampers
C402.4.5 Stairway enclosures and elevator shaft vents and other outdoor air intakes and exhaust openings integral to the building envelope shall be provided with dampers
C402.4.5.1 Stairway and shaft vent dampers shall be installed with automatic controls and normally closed.
5082 Loading dock doors shall be equipped with weather seals
C402.4.6 Cargo doors and loading dock doors shall be equipped with weather seals
5083 Building entrances shall be protected with an enclosed vestibule
C402.4.7 All building entrances shall be protected with an enclosed vestibule
C402.4.7 Vestibules shall be designed so that it is not necessary for the interior and exterior doors to open at the same time.
C402.4.7 The installation of revolving doors shall not eliminate the requirement that a vestibule be provided on any doors adjacent to revolving doors.
5089 Fenestration orientation 90.1: 5.5.4.5
The area of vertical fenestration on the south must be greater than the area of vertical fenestration on the east and on the west.
Mechanical Systems 6004 Equipment sizing
requirement C403.2.2 Heating and cooling equipment and systems shall not be
oversized.
C403.2.1 Design loads must be calculated in accordance with
ANSI/ASHRAE/ACCA Standard 183 or approved alternative.
C302.1 Interior design temperatures are set by this code.
6005A Packaged air conditioner efficiency
C403.2.3 Heating and cooling equipment shall meet minimum efficiency requirements by equipment type.
C403.2.3 If the designer combines components from different manufacturers, it is the designer's responsibility to show that equipment meets requirements.
6005B Packaged heat pump efficiency
C403.2.3 Heating and cooling equipment shall meet minimum efficiency requirements by equipment type.
C403.2.3 If the designer combines components from different manufacturers, it is the designer's responsibility to show that equipment meets requirements.
6005C Gas furnace efficiency C403.2.3 Heating and cooling equipment shall meet minimum efficiency requirements by equipment type.
6005D Boiler efficiency C403.2.3 Heating and cooling equipment shall meet minimum efficiency requirements by equipment type.
6005E Water Source Heat Pump Efficiency
C403.2.3 Heating and cooling equipment shall meet minimum efficiency requirements by equipment type.
6007 Chiller efficiency C403.2.3 Equipment efficiency shall be verified through an approved verification program or if no program exists, by information supplied by manufacturer.
Where multiple rating conditions or performance requirements are provided, the equipment shall satisfy all stated requirements.

A.7
Measure ID Measure name
2012 IECC or 90.1-2010 Section Requirement Summary
Water-cooled centrifugal chilling packages not designed for operation at AHRI Standard 550/590 test conditions shall have maximum full-load KW-ton and NPLV ratings adjusted.
The adjustments shall only be used for centrifugal chillers that meet 3 specified design ranges.
Positive displacement chilling packages with a leaving temperature greater than 32°F shall meet minimum efficiency requirements.
6014 Thermostatic control is used for individual zones
C403.2.4 Heating and cooling systems shall have thermostatic controls.
C403.2.4.1 Individual heating and cooling zones shall have individual thermostatic controls.
6016 Humidity control device for each humidity system
C403.2.4.1 At least one humidity control device shall be supplied for each humidity control system.
6017 Heat pump supplementary heat control
C403.2.4.1.1 Heat pumps with supplementary heat shall have controls that lock out resistance heat when heat pump can meet heating load; e.g. OA lockout <= 40F or ramped startup setpoint.
6018 Thermostat dead band requirement
C403.2.4.2 Thermostatic controls shall have a 5°F dead band.
6019 Thermostat setback and start/stop controls
C403.2.4.3 Each zone shall have thermostatic setback controls.
C403.2.4.3.1 Thermostatic setback controls shall have capability to set back or operate system to maintained higher or lower setpoints.
C403.2.4.3.2 Thermostatic setback controls shall start & stop system on seven daily schedules and retain programming during power loss.
C403.2.4.3.2 Thermostatic setback controls shall have a manual override. 6023 Optimal start controls C403.2.4.3.3 HVAC systems shall have optimal start controls.
C403.2.4.3.3 Automatic start controls shall adjust the HVAC start time to
bring spaces to desired occupied temperature immediately prior to scheduled occupancy.
6025 Damper control when space is unoccupied
C403.2.4.4 Outdoor air supply and exhaust ducts shall have motorized dampers.
C403.2.5 Mechanical ventilation systems shall have the capability to reduce outdoor air supply to the minimum required in Chapter 4 of the IMC.
C402.4.5.2 Outdoor air supply and exhaust openings shall be provided with Class IA motorized dampers.
6026 Snow and ice-melting system control
C403.2.4.5 Snow and ice-melting systems shall have automatic controls.
6029 Demand control ventilation C403.2.5.1 Demand control ventilation is required for spaces > 500 sf with >= 25 p/sf. Ex: ERV; des OA < 1200 cfm; or process.
6030 Energy recovery requirement
C403.2.6 Fan systems with large supply airflow and OA rates (Table C403.2.6) shall include an energy recovery system.
C403.2.6 The energy recovery system shall provide a change in the enthalpy of the outdoor air supply of not less than 50 percent of the difference between outdoor air and return air.
C403.2.6 Energy recovery systems shall have bypass and controls to work with economizers, where required.
6033 Duct insulation requirement
C403.2.7 Supply and return air ducts and plenums shall be insulated.

A.8
Measure ID Measure name
2012 IECC or 90.1-2010 Section Requirement Summary
C403.2.7.1.2 Duct and plenums operating at medium pressure shall be insulated and sealed.
6035 Duct leakage requirement C403.2.7.1.1 Longitudinal and transverse joints, seams, and connections in low-pressure ducts shall be fastened and sealed.
C403.2.7.1.1 Pressure classification of duct systems shall be marked on construction documents in accordance with the IMC.
C403.2.7.1.2 Duct and plenums operating at medium pressure shall be insulated and sealed.
C403.2.7.1.2 Pressure classification of duct systems shall be marked on construction documents in accordance with the IMC.
C403.2.7.1.3 High-pressure ducts shall be insulated and sealed.
C403.2.7.1.3 Duct and plenums shall be leak tested.
C403.2.7.1.3 Documentation that at least 25% of duct area has been leak tested shall be furnished by the designer.
C403.2.8.1 Adhesive tape is not permitted as a duct seal. 6042 Piping insulation
Requirement C403.2.8 Piping in a heating or cooling system shall be insulated.
C403.2.8.1 Piping insulation exposed to weather shall be protected. 6045 Commissioning
requirement C403.2.9 Mechanical systems shall be commissioned.
C408.2 Registered design professional shall provide evidence of mechanical systems commissioning.
C408.2.1 A commissioning plan must be developed.
C408.2.2 HVAC systems shall be balanced.
C408.2.2.1 Supply air outlets and zone terminal devices shall have means for air balancing.
C408.2.2.2 Hydronic heating and cooling coils shall have means for balancing.
C408.2.3.1 Equipment functional performance testing is required.
C408.2.3.2 HVAC control system testing is required.
C408.2.3.3 Air economizer functional testing is required.
C408.2.4 A preliminary commissioning report is required.
C408.2.4.1 The building owner must acknowledge receipt of the preliminary commissioning report.
C408.2.5.2 Operating and maintenance manuals shall be provided.
C303.3 Maintenance instructions shall be furnished.
C303.3 Regular maintenance actions shall be on an accessible label.
C303.3 The label shall refer to the maintenance manual.
C408.2.5.3 A written report on testing and balancing is required.
C408.2.5.4 A final commissioning report is required.
C408.3.1 Lighting control hardware and software shall be calibrated, adjusted, and in proper working condition.
6046 Fan power limit requirement
C403.2.10 HVAC systems with total fan system motor nameplate hp greater than 5 hp shall be properly sized.
C403.2.10.1 Fan system motor nameplate hp or fan system bhp shall be limited.
C403.2.10.1 Single zone VAV systems shall comply with constant volume fan power limitations.
C403.2.10.2 The fan motor shall be no larger than the first available motor size greater than the bhp.
C403.2.10.2 The bhp shall be indicated on design documents. 6051 Outdoor heating shall be
radiant C403.2.11 Radiant systems must be used for outdoor heating.
C403.2.11 Outdoor heating systems shall be controlled to turn it off when no occupants are present.
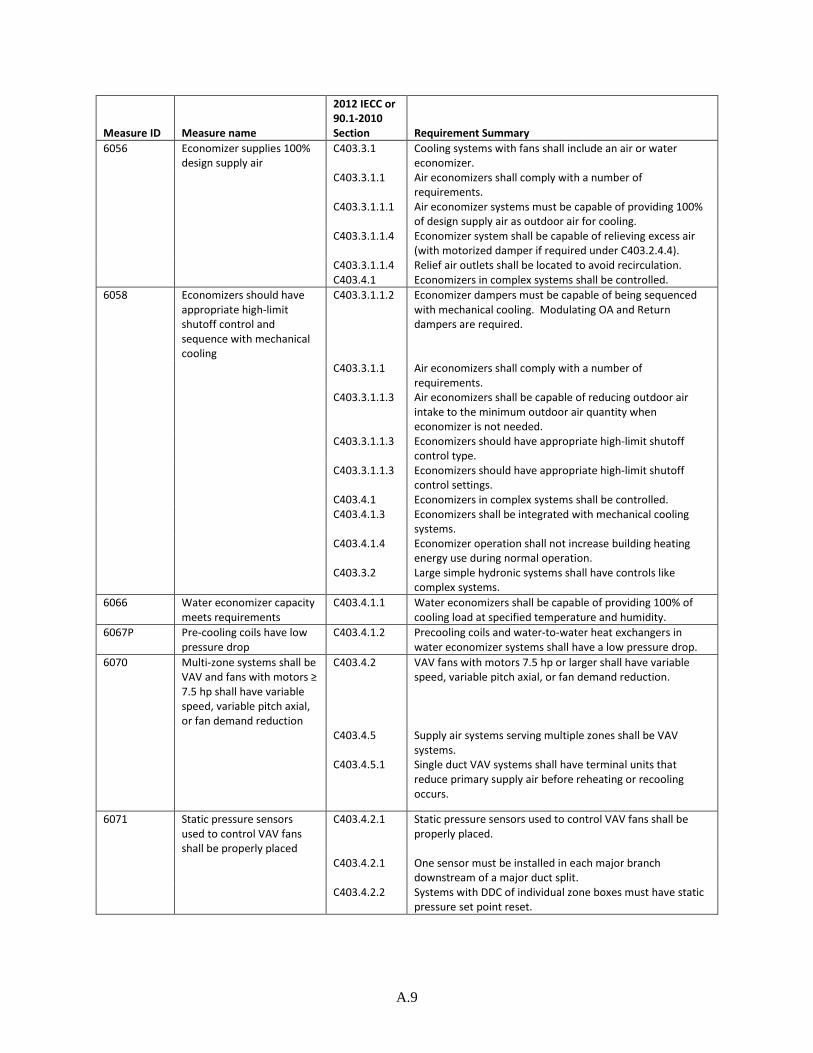
A.9
Measure ID Measure name
2012 IECC or 90.1-2010 Section Requirement Summary
6056 Economizer supplies 100% design supply air
C403.3.1 Cooling systems with fans shall include an air or water economizer.
C403.3.1.1 Air economizers shall comply with a number of requirements.
C403.3.1.1.1 Air economizer systems must be capable of providing 100% of design supply air as outdoor air for cooling.
C403.3.1.1.4 Economizer system shall be capable of relieving excess air (with motorized damper if required under C403.2.4.4).
C403.3.1.1.4 Relief air outlets shall be located to avoid recirculation.
C403.4.1 Economizers in complex systems shall be controlled.
6058 Economizers should have appropriate high-limit shutoff control and sequence with mechanical cooling
C403.3.1.1.2 Economizer dampers must be capable of being sequenced with mechanical cooling. Modulating OA and Return dampers are required.
C403.3.1.1 Air economizers shall comply with a number of requirements.
C403.3.1.1.3 Air economizers shall be capable of reducing outdoor air intake to the minimum outdoor air quantity when economizer is not needed.
C403.3.1.1.3 Economizers should have appropriate high-limit shutoff control type.
C403.3.1.1.3 Economizers should have appropriate high-limit shutoff control settings.
C403.4.1 Economizers in complex systems shall be controlled.
C403.4.1.3 Economizers shall be integrated with mechanical cooling
systems.
C403.4.1.4 Economizer operation shall not increase building heating
energy use during normal operation.
C403.3.2 Large simple hydronic systems shall have controls like
complex systems. 6066 Water economizer capacity
meets requirements C403.4.1.1 Water economizers shall be capable of providing 100% of
cooling load at specified temperature and humidity. 6067P Pre-cooling coils have low
pressure drop C403.4.1.2 Precooling coils and water-to-water heat exchangers in
water economizer systems shall have a low pressure drop. 6070 Multi-zone systems shall be
VAV and fans with motors ≥ 7.5 hp shall have variable speed, variable pitch axial, or fan demand reduction
C403.4.2 VAV fans with motors 7.5 hp or larger shall have variable speed, variable pitch axial, or fan demand reduction.
C403.4.5 Supply air systems serving multiple zones shall be VAV systems.
C403.4.5.1 Single duct VAV systems shall have terminal units that reduce primary supply air before reheating or recooling occurs.
6071 Static pressure sensors used to control VAV fans shall be properly placed
C403.4.2.1 Static pressure sensors used to control VAV fans shall be properly placed.
C403.4.2.1 One sensor must be installed in each major branch downstream of a major duct split.
C403.4.2.2 Systems with DDC of individual zone boxes must have static pressure set point reset.
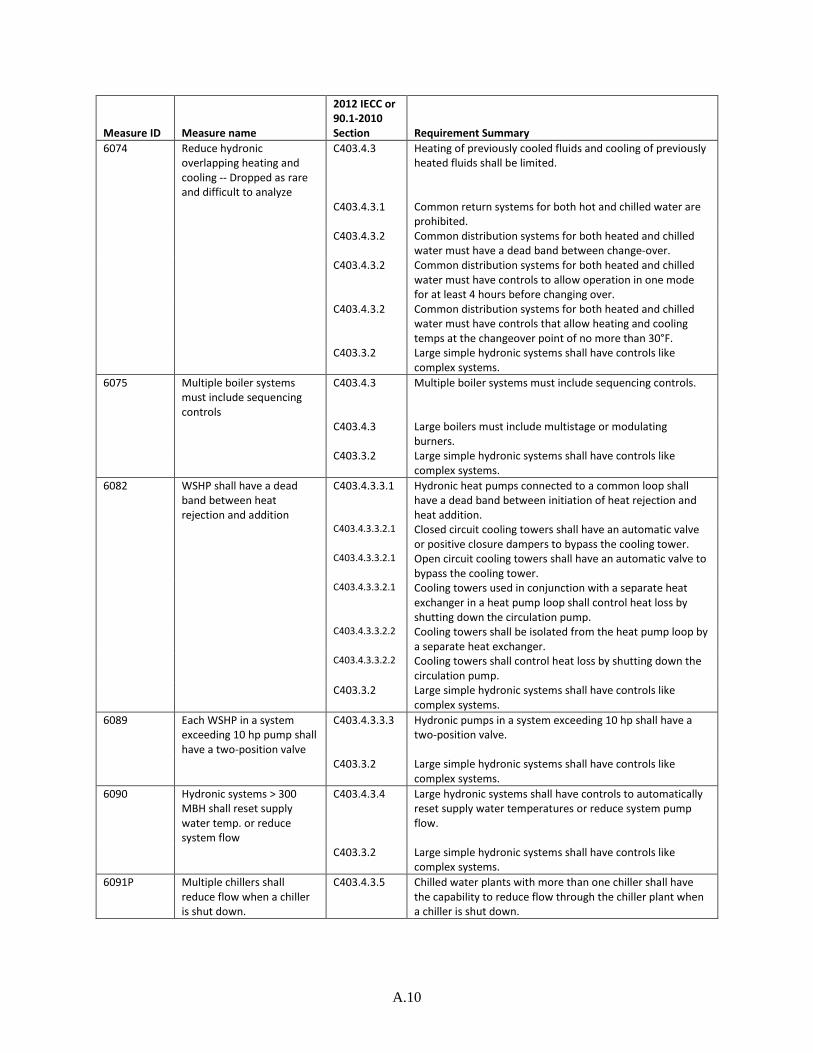
A.10
Measure ID Measure name
2012 IECC or 90.1-2010 Section Requirement Summary
6074 Reduce hydronic overlapping heating and cooling -- Dropped as rare and difficult to analyze
C403.4.3 Heating of previously cooled fluids and cooling of previously heated fluids shall be limited.
C403.4.3.1 Common return systems for both hot and chilled water are prohibited.
C403.4.3.2 Common distribution systems for both heated and chilled water must have a dead band between change-over.
C403.4.3.2 Common distribution systems for both heated and chilled water must have controls to allow operation in one mode for at least 4 hours before changing over.
C403.4.3.2 Common distribution systems for both heated and chilled water must have controls that allow heating and cooling temps at the changeover point of no more than 30°F.
C403.3.2 Large simple hydronic systems shall have controls like complex systems.
6075 Multiple boiler systems must include sequencing controls
C403.4.3 Multiple boiler systems must include sequencing controls.
C403.4.3 Large boilers must include multistage or modulating burners.
C403.3.2 Large simple hydronic systems shall have controls like complex systems.
6082 WSHP shall have a dead band between heat rejection and addition
C403.4.3.3.1 Hydronic heat pumps connected to a common loop shall have a dead band between initiation of heat rejection and heat addition.
C403.4.3.3.2.1 Closed circuit cooling towers shall have an automatic valve or positive closure dampers to bypass the cooling tower.
C403.4.3.3.2.1 Open circuit cooling towers shall have an automatic valve to bypass the cooling tower.
C403.4.3.3.2.1 Cooling towers used in conjunction with a separate heat exchanger in a heat pump loop shall control heat loss by shutting down the circulation pump.
C403.4.3.3.2.2 Cooling towers shall be isolated from the heat pump loop by a separate heat exchanger.
C403.4.3.3.2.2 Cooling towers shall control heat loss by shutting down the circulation pump.
C403.3.2 Large simple hydronic systems shall have controls like complex systems.
6089 Each WSHP in a system exceeding 10 hp pump shall have a two-position valve
C403.4.3.3.3 Hydronic pumps in a system exceeding 10 hp shall have a two-position valve.
C403.3.2 Large simple hydronic systems shall have controls like complex systems.
6090 Hydronic systems > 300 MBH shall reset supply water temp. or reduce system flow
C403.4.3.4 Large hydronic systems shall have controls to automatically reset supply water temperatures or reduce system pump flow.
C403.3.2 Large simple hydronic systems shall have controls like complex systems.
6091P Multiple chillers shall reduce flow when a chiller is shut down.
C403.4.3.5 Chilled water plants with more than one chiller shall have the capability to reduce flow through the chiller plant when a chiller is shut down.

A.11
Measure ID Measure name
2012 IECC or 90.1-2010 Section Requirement Summary
6093 Multiple boiler plants shall reduce flow when a boiler is shut down
C403.4.3.5 Boiler plants with more than one boiler shall have the capability to reduce flow through the boiler plant when a boiler is shut down.
C403.3.2 Large simple hydronic systems shall have controls like complex systems.
6094 Tower Fans ≥ 7.5 hp shall have variable speed control
C403.4.4 Tower Fans ≥ 7.5 hp shall have variable speed control.
C403.4.4 Fans with a motor of 7.5 hp or greater shall have controls that change the fan speed to control leaving fluid temperatures.
6101 Multiple zone HVAC systems shall have supply-air temperature reset controls
C403.4.5.4 Multiple zone HVAC systems shall have supply-air temperature reset controls.
C403.4.5.4 Supply-air temperature reset controls shall reset the temperature to at least 25% of the difference between design supply-air and design room air temperatures.
6105 Hot gas bypass only allowed with multiple steps of unloading or capacity modulation
C403.4.7 Cooling systems shall not use hot gas bypass unless system is designed with multiple steps of unloading or capacity modulation.
C403.4.7 Capacity of hot gas bypass is limited. 6106AS Dynamic ventilation reset
for MZ systems 90.1: 6.5.3.3
Multizone VAV systems with DDC must dynamically reset OA intake in response to ventilation system efficiency.
6108PAS Single zone VAV 90.1: 6.4.3.10
AHUs and FCUs with fan motors 5 hp or larger and chilled water coils must be 2-speed or VAV with VFD. Fan speed is limited at 50% cooling to the greater of 50% flow or minimum OA requirements. Single zone systems with dx cooling 110,000 Btu or greater must also be 2-speed or VFD with fan speed limited to 2/3 full speed at 50% cooling demand.
6109PAS Parking garage fan controls 90.1: 6.4.3.4.5
Enclosed parking garage ventilation fans must reduce airflow to at least 50% based on contaminants.
6110AS Zone isolation 90.1: 6.4.3.5
HVAC systems serving zones that are not intended to operate or be occupied at the same time must be able to automatically shut off the supply of conditioned, outdoor air, and exhaust air to any zone that is not occupied. Zones that do simultaneously operate cannot be grouped into a single isolation zone >25,000 ft2 and cannot span more than one floor.
7002A Gas water heater efficiency C404.2 Water-heating equipment and hot water storage tanks must meet minimum efficiency standards.
7002B Electric water heater efficiency
C404.2 Water-heating equipment and hot water storage tanks must meet minimum efficiency standards.
7003 Service water-heating equipment shall be provided with temperature setpoint controls
C404.3 Service water-heating equipment shall be provided with temperature setpoint controls.
7004 Outlet temperature of lavatories in public facility rest rooms is limited to 110°F (43°C)
C404.3 Outlet temperature of lavatories in public facility rest rooms is limited to 110°F (43°C).
7005 SWH heat trap C404.4 Water-heating equipment must have a heat trap.
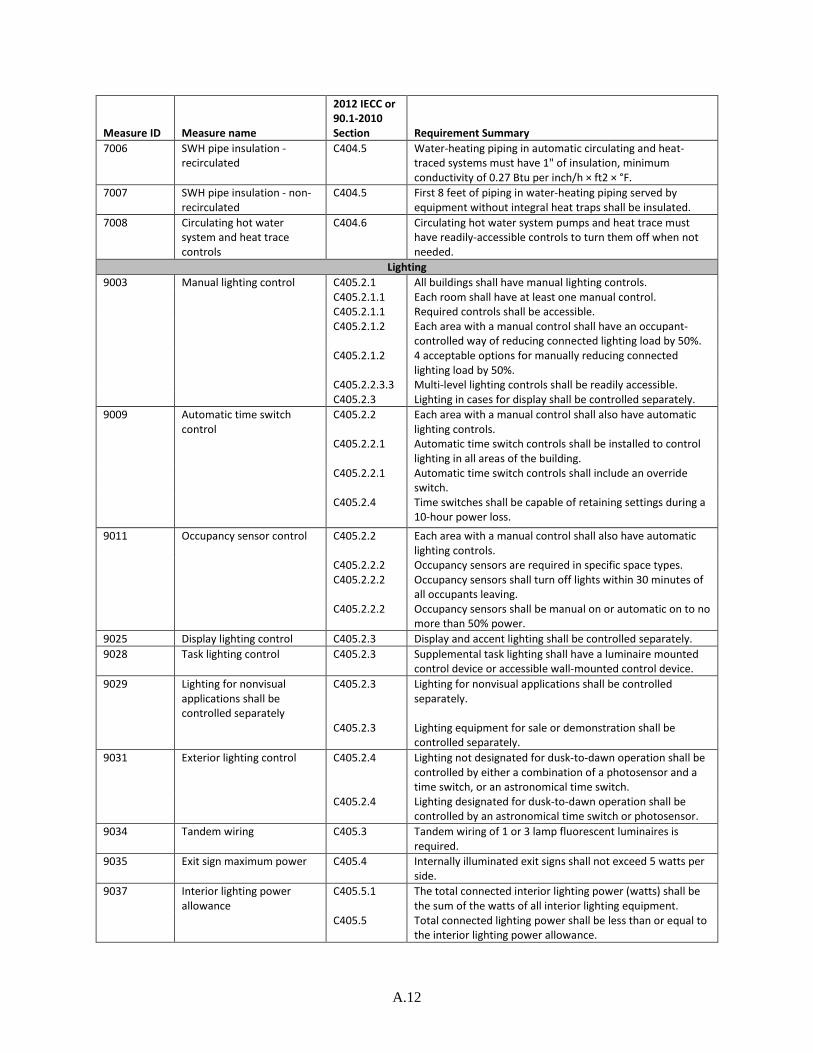
A.12
Measure ID Measure name
2012 IECC or 90.1-2010 Section Requirement Summary
7006 SWH pipe insulation - recirculated
C404.5 Water-heating piping in automatic circulating and heat-traced systems must have 1" of insulation, minimum conductivity of 0.27 Btu per inch/h × ft2 × °F.
7007 SWH pipe insulation - non-recirculated
C404.5 First 8 feet of piping in water-heating piping served by equipment without integral heat traps shall be insulated.
7008 Circulating hot water system and heat trace controls
C404.6 Circulating hot water system pumps and heat trace must have readily-accessible controls to turn them off when not needed.
Lighting 9003 Manual lighting control C405.2.1 All buildings shall have manual lighting controls.
C405.2.1.1 Each room shall have at least one manual control.
C405.2.1.1 Required controls shall be accessible.
C405.2.1.2 Each area with a manual control shall have an occupant-
controlled way of reducing connected lighting load by 50%.
C405.2.1.2 4 acceptable options for manually reducing connected
lighting load by 50%.
C405.2.2.3.3 Multi-level lighting controls shall be readily accessible.
C405.2.3 Lighting in cases for display shall be controlled separately. 9009 Automatic time switch
control C405.2.2 Each area with a manual control shall also have automatic
lighting controls.
C405.2.2.1 Automatic time switch controls shall be installed to control
lighting in all areas of the building.
C405.2.2.1 Automatic time switch controls shall include an override
switch.
C405.2.4 Time switches shall be capable of retaining settings during a
10-hour power loss.
9011 Occupancy sensor control C405.2.2 Each area with a manual control shall also have automatic lighting controls.
C405.2.2.2 Occupancy sensors are required in specific space types.
C405.2.2.2 Occupancy sensors shall turn off lights within 30 minutes of
all occupants leaving.
C405.2.2.2 Occupancy sensors shall be manual on or automatic on to no
more than 50% power. 9025 Display lighting control C405.2.3 Display and accent lighting shall be controlled separately. 9028 Task lighting control C405.2.3 Supplemental task lighting shall have a luminaire mounted
control device or accessible wall-mounted control device. 9029 Lighting for nonvisual
applications shall be controlled separately
C405.2.3 Lighting for nonvisual applications shall be controlled separately.
C405.2.3 Lighting equipment for sale or demonstration shall be controlled separately.
9031 Exterior lighting control C405.2.4 Lighting not designated for dusk-to-dawn operation shall be controlled by either a combination of a photosensor and a time switch, or an astronomical time switch.
C405.2.4 Lighting designated for dusk-to-dawn operation shall be controlled by an astronomical time switch or photosensor.
9034 Tandem wiring C405.3 Tandem wiring of 1 or 3 lamp fluorescent luminaires is required.
9035 Exit sign maximum power C405.4 Internally illuminated exit signs shall not exceed 5 watts per side.
9037 Interior lighting power allowance
C405.5.1 The total connected interior lighting power (watts) shall be the sum of the watts of all interior lighting equipment.
C405.5 Total connected lighting power shall be less than or equal to the interior lighting power allowance.
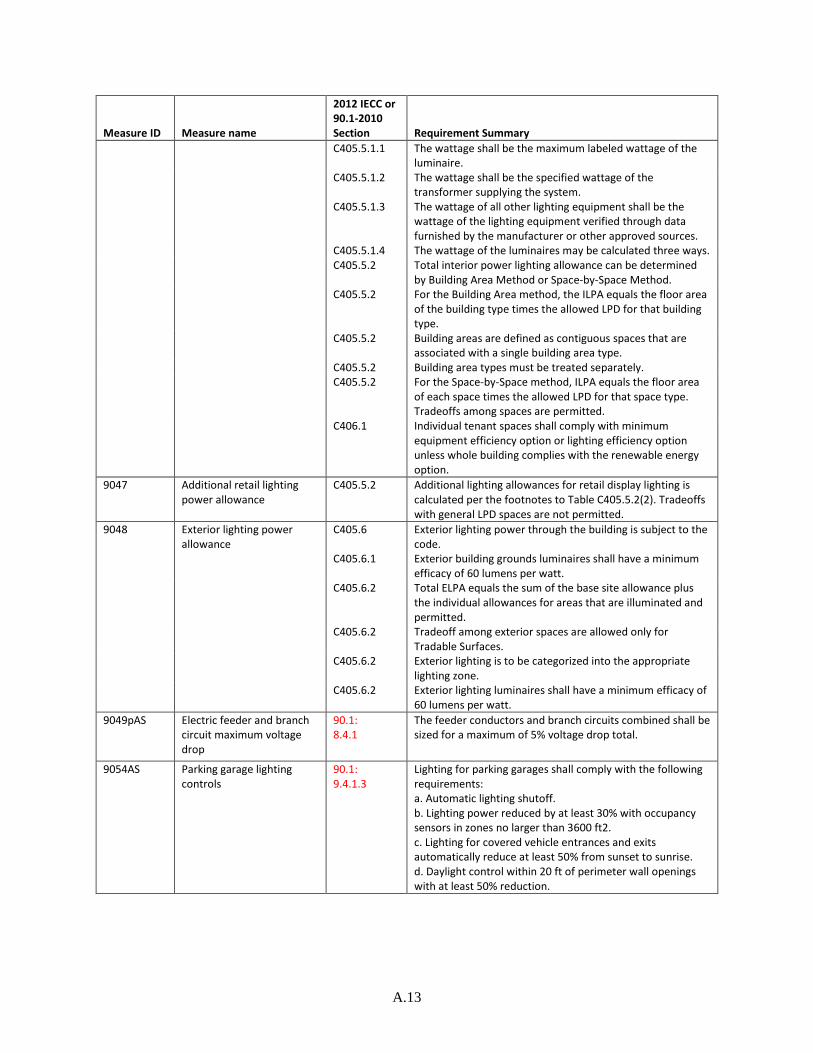
A.13
Measure ID Measure name
2012 IECC or 90.1-2010 Section Requirement Summary
C405.5.1.1 The wattage shall be the maximum labeled wattage of the luminaire.
C405.5.1.2 The wattage shall be the specified wattage of the transformer supplying the system.
C405.5.1.3 The wattage of all other lighting equipment shall be the wattage of the lighting equipment verified through data furnished by the manufacturer or other approved sources.
C405.5.1.4 The wattage of the luminaires may be calculated three ways.
C405.5.2 Total interior power lighting allowance can be determined
by Building Area Method or Space-by-Space Method.
C405.5.2 For the Building Area method, the ILPA equals the floor area
of the building type times the allowed LPD for that building type.
C405.5.2 Building areas are defined as contiguous spaces that are associated with a single building area type.
C405.5.2 Building area types must be treated separately.
C405.5.2 For the Space-by-Space method, ILPA equals the floor area
of each space times the allowed LPD for that space type. Tradeoffs among spaces are permitted.
C406.1 Individual tenant spaces shall comply with minimum equipment efficiency option or lighting efficiency option unless whole building complies with the renewable energy option.
9047 Additional retail lighting power allowance
C405.5.2 Additional lighting allowances for retail display lighting is calculated per the footnotes to Table C405.5.2(2). Tradeoffs with general LPD spaces are not permitted.
9048 Exterior lighting power allowance
C405.6 Exterior lighting power through the building is subject to the code.
C405.6.1 Exterior building grounds luminaires shall have a minimum efficacy of 60 lumens per watt.
C405.6.2 Total ELPA equals the sum of the base site allowance plus the individual allowances for areas that are illuminated and permitted.
C405.6.2 Tradeoff among exterior spaces are allowed only for Tradable Surfaces.
C405.6.2 Exterior lighting is to be categorized into the appropriate lighting zone.
C405.6.2 Exterior lighting luminaires shall have a minimum efficacy of 60 lumens per watt.
9049pAS Electric feeder and branch circuit maximum voltage drop
90.1: 8.4.1
The feeder conductors and branch circuits combined shall be sized for a maximum of 5% voltage drop total.
9054AS Parking garage lighting controls
90.1: 9.4.1.3
Lighting for parking garages shall comply with the following requirements: a. Automatic lighting shutoff. b. Lighting power reduced by at least 30% with occupancy sensors in zones no larger than 3600 ft2. c. Lighting for covered vehicle entrances and exits automatically reduce at least 50% from sunset to sunrise. d. Daylight control within 20 ft of perimeter wall openings with at least 50% reduction.

A.14
Measure ID Measure name
2012 IECC or 90.1-2010 Section Requirement Summary
9055pAS Plug load controls 90.1: 8.4.2
Automatically schedule or occupancy control of: a. At least 50% of all 125 V, 15 and 20 amp receptacles in all private offices, conference rooms, rooms used primarily for printing and/or copying functions, break rooms, classrooms, and individual workstations. b. At least 25% of branch circuits for modular furniture not shown on the construction documents. Controlled areas no more than 5000 ft2 and not more than one floor. Schedule control has 2-hour manual override. Controlled receptacles permanently marked and uniformly distributed throughout the space.
Options 15007 Optional onsite renewable C406.4 The renewable energy option requires either 0.5 watts per
square foot or 3% of the energy used for regulated loads.
C406.1 Buildings shall comply with one of 3 additional efficiency
options.

Appendix B
Code Measures, Identified Conditions, and Input Parameters

B.1
Appendix B
Code Measures, Identified Conditions, and Input Parameters
Table B.1. Code Measures, Conditions, and Input Parameters – Office Building Measure ID Abbrev.
Measure Name Life (yr)
Case Case conditions by climate zones Input Units (modeled)
Case Input Parameters 2A 3B 5A 2A 3B 5A
15007 Optional onsite renewable
15 Worst No option installed No option installed No option installed Peak design W/sf
0 0 0
OptRenewbl Code Min requirement for renewable energy option
Min requirement for renewable energy option
Min requirement for renewable energy option
0.5 0.5 0.5
Best Double the minimum requirement
Double the minimum requirement
Double the minimum requirement
1 1 1
5012 Roofs shall be insulated to meet CZ requirements
30 Worst No insulation No insulation No insulation U-factor 0.89 0.89 0.89
RoofIns Code Insulated per code Insulated per code Insulated per code 0.048 0.048 0.039
Best Double the minimum requirement
Double the minimum requirement
Double the minimum requirement
0.024 0.024 0.0195
5013 Skylight curbs shall be insulated
30 Worst No insulation No insulation No insulation Insulation R-value
R-0 R-0 R-0
SkylCurbIns Code Insulated per code Insulated per code Insulated per code R-5 R-5 R-5 Best Insulated to 75% of
roof U Insulated to 75% of roof U
Insulated to 75% of roof U
R-28 R-28 R-28
5014 Low slope roofs in CZ 1-3 shall be cool roofs
30 Worst Asphalt roof Asphalt roof NA Solar Reflectance
0.1 0.1 NA
CoolRoof Code Code reflective roof Code reflective roof NA 0.55 0.55 NA

B.2
Measure ID Abbrev.
Measure Name Life (yr)
Case Case conditions by climate zones Input Units (modeled)
Case Input Parameters 2A 3B 5A 2A 3B 5A
Best Highly reflective roof membrane, clean
Highly reflective roof membrane, clean
NA 0.87 0.87 NA
5018A Above grade frame walls shall be insulated to meet CZ requirements
30 Worst No insulation No insulation No insulation U-factor 0.459 0.459 0.459
FrameWallIns Code Insulated per code Insulated per code Insulated per code 0.077 0.064 0.064
Best Insulated to 2.4 times code requirement
Insulated to 2.4 times code requirement
Insulated to 2.4 times code requirement
0.032 0.026 0.026
5018B Above grade mass walls shall be insulated to meet CZ and density requirements
30 Worst No insulation No insulation No insulation U-factor 0.555 0.555 0.555
MassWallIns Code Insulated per code Insulated per code Insulated per code 0.142 0.11 0.078
Best Double the minimum requirement
Double the minimum requirement
Double the minimum requirement
0.071 0.055 0.039
5021p Below grade wall insulation requirements and protection
30 Worst No insulation No insulation No insulation Wall C-Factor
1.140 1.140 0.119
BelowGradeIns Code No insulation (per code)
No insulation (per code)
Insulated per code 1.140 1.140 0.119
Best NA NA NA NA NA NA 5023A Exterior frame
floors shall meet the insulation requirements
30 Worst No insulation No insulation No insulation U-factor 0.32 0.32 0.32
FrameFloorIns Code Insulated per code Insulated per code Insulated per code 0.033 0.033 0.033
Best Double the minimum requirement
Double the minimum requirement
Double the minimum requirement
0.0165 0.0165 0.0165
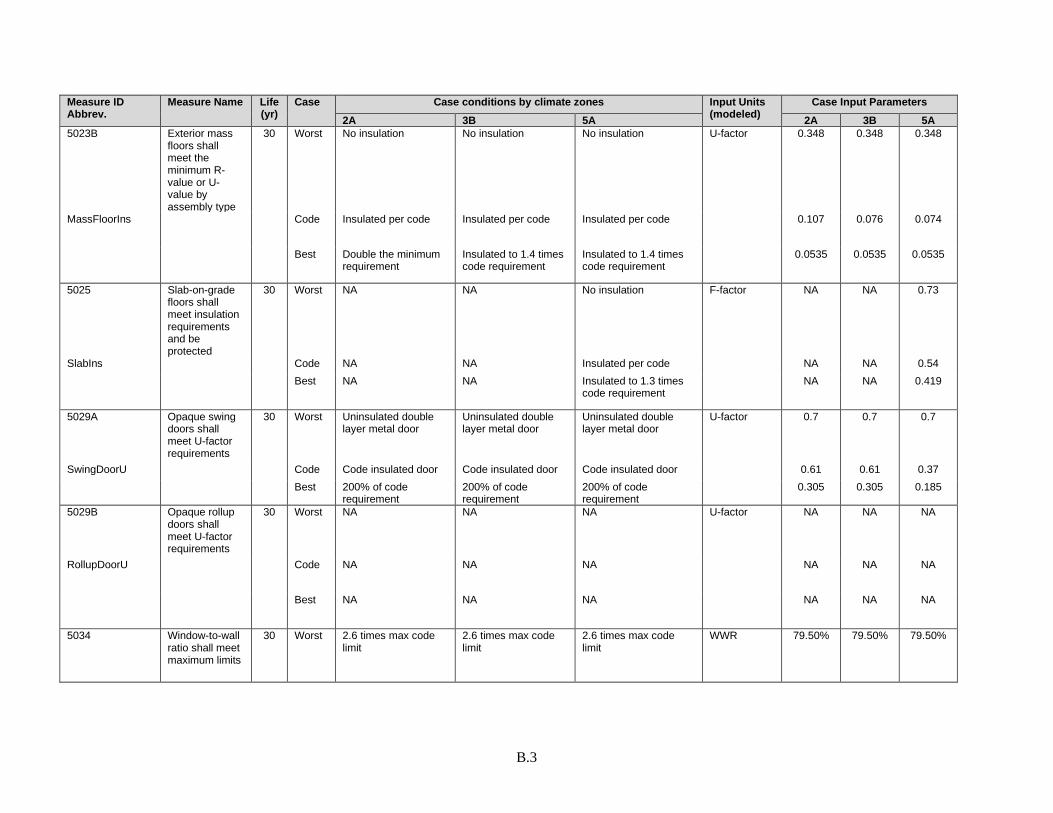
B.3
Measure ID Abbrev.
Measure Name Life (yr)
Case Case conditions by climate zones Input Units (modeled)
Case Input Parameters 2A 3B 5A 2A 3B 5A
5023B Exterior mass floors shall meet the minimum R-value or U-value by assembly type
30 Worst No insulation No insulation No insulation U-factor 0.348 0.348 0.348
MassFloorIns Code Insulated per code Insulated per code Insulated per code 0.107 0.076 0.074
Best Double the minimum requirement
Insulated to 1.4 times code requirement
Insulated to 1.4 times code requirement
0.0535 0.0535 0.0535
5025 Slab-on-grade floors shall meet insulation requirements and be protected
30 Worst NA NA No insulation F-factor NA NA 0.73
SlabIns Code NA NA Insulated per code NA NA 0.54 Best NA NA Insulated to 1.3 times
code requirement NA NA 0.419
5029A Opaque swing doors shall meet U-factor requirements
30 Worst Uninsulated double layer metal door
Uninsulated double layer metal door
Uninsulated double layer metal door
U-factor 0.7 0.7 0.7
SwingDoorU Code Code insulated door Code insulated door Code insulated door 0.61 0.61 0.37 Best 200% of code
requirement 200% of code requirement
200% of code requirement
0.305 0.305 0.185
5029B Opaque rollup doors shall meet U-factor requirements
30 Worst NA NA NA U-factor NA NA NA
RollupDoorU Code NA NA NA NA NA NA
Best NA NA NA NA NA NA
5034 Window-to-wall ratio shall meet maximum limits
30 Worst 2.6 times max code limit
2.6 times max code limit
2.6 times max code limit
WWR 79.50% 79.50% 79.50%

B.4
Measure ID Abbrev.
Measure Name Life (yr)
Case Case conditions by climate zones Input Units (modeled)
Case Input Parameters 2A 3B 5A 2A 3B 5A
MaxWWR Code Max WWR per code Max WWR per code Max WWR per code 30% 30% 30%
Best NA NA NA NA NA NA
5035 Skylight to roof ratio shall meet maximum limits
30 Worst 2.3 times max code limit
2.3 times max code limit
2.3 times max code limit
SRR 7% 7% 7%
MaxSkyLtRoofR Code Max per code Max per code Max per code 3% 3% 3%
Best NA NA NA NA NA NA
5042A Windows shall meet U-factor requirements
30 Worst Single pane, fixed, thermally unbroken metal frame
Single pane, fixed, thermally unbroken metal frame
Single pane, fixed, thermally unbroken metal frame
U-factor 1.25 1.25 1.25
WinUFactor Code Code U-factor Code U-factor Code U-factor 0.5 0.46 0.38
Best 250% of code requirement
250% of code requirement
250% of code requirement
0.2 0.2 0.2
5042B Windows shall meet SHGC requirements
30 Worst Single pane, clear Single pane, clear Single pane, clear SHGC 0.82 0.82 0.82
WinSHGC Code Code SHGC Code SHGC Code SHGC 0.25 0.25 0.4
Best Low-e coating on tint Low-e coating on tint Low-e coating on tint 0.2 0.2 0.2
5043A Skylights shall meet U-factor requirements
30 Worst Single pane clear, w/metal thermally unbroken frame
Single pane clear, w/metal thermally unbroken frame
Single pane clear, w/metal thermally unbroken frame
U-factor 1.98 1.98 1.98
SkyLtUFactor Code Code U-factor Code U-factor Code U-factor 0.65 0.55 0.5
Best 210% of code requirement
210% of code requirement
210% of code requirement
0.31 0.31 0.31
5043B Skylights shall meet SHGC requirements
30 Worst Clear, 1/8" glass, metal frame w/o thermal break
Clear, 1/8" glass, metal frame w/o thermal break
Clear, 1/8" glass, metal frame w/o thermal break
SHGC 0.82 0.82 0.82
SkyLtSHGC Code Code SHGC Code SHGC Code SHGC 0.35 0.35 0.4

B.5
Measure ID Abbrev.
Measure Name Life (yr)
Case Case conditions by climate zones Input Units (modeled)
Case Input Parameters 2A 3B 5A 2A 3B 5A
Best Low-e coating on tint Low-e coating on tint Low-e coating on tint 0.2 0.2 0.2
5056 Building shall meet continuous air barrier requirements
30 Worst 3 x base leakage 3 x base leakage 3 x base leakage cfm/ft2 exterior surface at 75Pa
3.00 3.00 3.00
ContAirBar Code equivalent to a CAB as required
equivalent to a CAB as required
equivalent to a CAB as required
1.00 1.00 1.00
Best 1/4 x code leakage 1/4 x code leakage 1/4 x code leakage 0.25 0.25 0.25
5063 Recessed lighting shall be sealed, rated and labeled
15 Worst 30 cfm at 75 Pa per fixture, Unsealed recessed lights
30 cfm at 75 Pa per fixture, Unsealed recessed lights
30 cfm at 75 Pa per fixture, Unsealed recessed lights
cfm per fixture @ 75 Pa
30 30 30
RecsLtgLeak Code 2 cfm at 75 Pa per fixture
2 cfm at 75 Pa per fixture
2 cfm at 75 Pa per fixture
2 2 2
Best NA NA NA NA NA NA 5075 Fenestration
assemblies shall meet air leakage requirements
30 Worst Leaky windows 5x code requirement
Leaky windows 5x code requirement
Leaky windows 5x code requirement
cfm/ft2 at 75 Pa
1.5 1.5 1.5
WindowLeak Code Code requirement for window leakage
Code requirement for window leakage
Code requirement for window leakage
0.3 0.3 0.3
Best 66% less leakage for windows
66% less leakage for windows
66% less leakage for windows
0.1 0.1 0.1
5077 Stair and shaft vent leakage
30 Worst Open damper, leaky door
Open damper, leaky door
Open damper, leaky door
Leakage High High High
StairShaftLeak Code Damper closed, doors sealed
Damper closed, doors sealed
Damper closed, doors sealed
Low Low Low
Best NA NA NA NA NA NA
5082 Loading dock doors shall be equipped with weather seals
15 Worst doors not weatherstripped or sealed
doors not weatherstripped or sealed
doors not weatherstripped or sealed
Actual condition
doors not
weatherstripped
or sealed
doors not
weatherstripped
or sealed
doors not
weatherstripped
or sealed

B.6
Measure ID Abbrev.
Measure Name Life (yr)
Case Case conditions by climate zones Input Units (modeled)
Case Input Parameters 2A 3B 5A 2A 3B 5A
LoadDockSeal Code doors weatherstripped and sealed
doors weatherstripped and sealed
doors weatherstripped and sealed
doors weatherstripped
and sealed
doors weatherstripped
and sealed
doors weatherstripped
and sealed
Best NA NA NA NA NA NA 5083 Building
entrances shall be protected with an enclosed vestibule
30 Worst NA No vestibule No vestibule door infiltration rate, cfm with off-peak fraction
NA 2210 cfm;
0.144 off-peak
2210 cfm;
0.144 off-peak
Vestibule Code NA Yes vestibule Yes vestibule NA 1438 cfm;
0.131 Off-peak
1438 cfm;
0.131 Off-peak
Best NA NA NA NA NA NA
5089 Fenestration orientation
30 Worst All windows on E/W orientation
All windows on E/W orientation
All windows on E/W orientation
ft2 of E windows exceeding S windows + ft2 of W windows exceeding S windows
6,387
6,387
6,387
FenOrient Code Separate baseline, average of the base building EUI from facing 4 orientations
Separate baseline, average of the base building EUI from facing 4 orientations
Separate baseline, average of the base building EUI from facing 4 orientations
0 0 0
Best NA NA NA NA NA NA
6004A Equipment sizing requirement for PkgAC
15 Worst 250% for heating and 230% for cooling
250% for heating and 230% for cooling
250% for heating and 230% for cooling
Cooling size as % of load
230% 230% 230%
EqpSizPkgAC Code 125% for heating and 115% for cooling
125% for heating and 115% for cooling
125% for heating and 115% for cooling
115% 115% 115%
Best NA NA NA NA NA NA
6004B Equipment sizing requirement for PkgVAV-RH
15 Worst 250% for heating and 230% for cooling
250% for heating and 230% for cooling
250% for heating and 230% for cooling
Cooling size as % of load
230% 230% 230%
EqpSizPvavRH Code 125% for heating and 115% for cooling
125% for heating and 115% for cooling
125% for heating and 115% for cooling
115% 115% 115%

B.7
Measure ID Abbrev.
Measure Name Life (yr)
Case Case conditions by climate zones Input Units (modeled)
Case Input Parameters 2A 3B 5A 2A 3B 5A
Best NA NA NA NA NA NA
6005A Packaged air conditioner efficiency
15 Worst 94% of code efficiency
94% of code efficiency
94% of code efficiency EER 10.3 10.3 10.3
ACCoolingEff Code Code minimum required efficiency
Code minimum required efficiency
Code minimum required efficiency
11 11 11
Best 113% of code efficiency
113% of code efficiency
113% of code efficiency 12.4 12.4 12.4
6005B Packaged heat pump efficiency
15 Worst Code efficiency when high performance tradeoff is used
NA NA Rated Heating COP
NA NA NA
HPEff Code Code minimum required efficiency
Code minimum required efficiency
Code minimum required efficiency
3.29 3.29 3.29
Best 116% of code heating efficiency
116% of code heating efficiency
116% of code heating efficiency
3.8 3.8 3.8
6005C Gas furnace efficiency
15 Worst Code efficiency when high performance tradeoff is used
NA NA AFUE NA NA NA
FurnaceEff Code Code minimum required efficiency
Code minimum required efficiency
Code minimum required efficiency
78% 78% 78%
Best 124% of code heating efficiency
124% of code heating efficiency
124% of code heating efficiency
97% 97% 97%
6005D Boiler efficiency 15 Worst Code efficiency when high performance tradeoff is used
NA NA ET NA NA NA
BoilerEff Code Code minimum required efficiency
Code minimum required efficiency
Code minimum required efficiency
80% 80% 80%
Best 121% of code heating efficiency
121% of code heating efficiency
121% of code heating efficiency
97% 97% 97%
6005E WSHP efficiency
15 Worst Code efficiency when high performance tradeoff is used
NA NA Heating COP (cooling EER is a match)
NA NA NA
WSHPEff Code Code minimum required efficiency
Code minimum required efficiency
Code minimum required efficiency
3.7 3.7 3.7
Best 159% of code heating efficiency
159% of code heating efficiency
159% of code heating efficiency
5.9 5.9 5.9

B.8
Measure ID Abbrev.
Measure Name Life (yr)
Case Case conditions by climate zones Input Units (modeled)
Case Input Parameters 2A 3B 5A 2A 3B 5A
6007A Air-cooled Chiller efficiency
15 Worst 80% of code efficiency
80% of code efficiency
80% of code efficiency EER 7.65 7.65 7.65
AirChillerEff Code Code minimum required efficiency
Code minimum required efficiency
Code minimum required efficiency
9.562 9.562 9.562
Best 120% of code efficiency
120% of code efficiency
120% of code efficiency 11.47 11.47 11.47
6007B Water-cooled Chiller efficiency
23 Worst 120% of code kW/ton 120% of code kW/ton 120% of code kW/ton kW/Ton 0.816 0.816 0.816
WatrChillerEff Code Code minimum required efficiency
Code minimum required efficiency
Code minimum required efficiency
0.68 0.68 0.68
Best 84% of code kW/ton 84% of code kW/ton 84% of code kW/ton 0.57 0.57 0.57
6014 Thermostatic control is used for individual zones
15 Worst 1 Tstat per floor 1 Tstat per floor 1 Tstat per floor Thermostats for each
Floor Floor Floor
TstatZone Code 1 Tstat per zone 1 Tstat per zone 1 Tstat per zone Zone Zone Zone Best NA NA NA NA NA NA 6016 Humidity control
device for each humidity system
15 Worst No humidistat. Constant subcooling and reheat. SAT of 52 F
No humidistat. Constant subcooling and reheat. SAT of 52 F
No humidistat. Constant subcooling and reheat. SAT of 52 F
Max SAT reset
52 F 52 F 52 F
ActiveRHCtrl Code 60% RH control. SAT down to 52F when dehumidification, OA-based SAT reset to 60F
60% RH control. SAT down to 52F when dehumidification, OA-based SAT reset to 60F
60% RH control. SAT down to 52F when dehumidification, OA-based SAT reset to 60F
60% RH control. SAT up to 60F
60% RH control. SAT up to 60F
60% RH control. SAT up to 60F
Best NA NA NA NA NA NA 6017 Heat pump
supplementary heat control
15 Worst OA lockout 70°F. Compressor lockout 35°F
OA lockout 70°F. Compressor lockout 35°F
OA lockout 70°F. Compressor lockout 35°F
Score -10 -10 -10
HPSuppHeatCtrl Code OA lockout 40°F. Compressor lockout 10°F
OA lockout 40°F. Compressor lockout 10°F
OA lockout 40°F. Compressor lockout 10°F
0 0 0
Best OA lockout 30°F Compressor lockout -4°F
OA lockout 30°F Compressor lockout -4°F
OA lockout 30°F Compressor lockout -4°F
2.3 2.3 2.3
6018 Thermostat deadband requirement
15 Worst Heating 72F, Cooling 73F
Heating 72F, Cooling 73F
Heating 72F, Cooling 73F
°F difference between heat & cool
1 1 1

B.9
Measure ID Abbrev.
Measure Name Life (yr)
Case Case conditions by climate zones Input Units (modeled)
Case Input Parameters 2A 3B 5A 2A 3B 5A
TempDeadband Code Heating 70F, Cooling 75F
Heating 70F, Cooling 75F
Heating 70F, Cooling 75F
5 5 5
Best Heating 67F, Cooling 76F
Heating 67F, Cooling 76F
Heating 67F, Cooling 76F
9 9 9
6019A Thermostat heating setback
15 Worst No heat setback; Heating 70F, Cooling 85F
No heat setback; Heating 70F, Cooling 85F
No heat setback; Heating 70F, Cooling 85F
°F setpoint for heating setback
70 70 70
SetbackCtrl Code Setback: Heating 60F, Cooling 85F
Setback: Heating 60F, Cooling 85F
Setback: Heating 60F, Cooling 85F
60 60 60
Best Setback: Heating 50F, Cooling 85F
Setback: Heating 50F, Cooling 85F
Setback: Heating 50F, Cooling 85F
50 50 50
6019B Thermostat cooling setback
15 Worst No cooling setback; Heating 60F, Cooling 75F
No cooling setback; Heating 60F, Cooling 75F
No cooling setback; Heating 60F, Cooling 75F
°F setpoint for cooling setback
75 75 75
SetCoolCtrl Code Setback: Heating 60F, Cooling 85F
Setback: Heating 60F, Cooling 85F
Setback: Heating 60F, Cooling 85F
85 85 85
Best Setback: Heating 60F, Cooling 90F
Setback: Heating 60F, Cooling 90F
Setback: Heating 60F, Cooling 90F
90 90 90
6019C Night fan control
15 Worst Fan runs during unoccupied hours
Fan runs during unoccupied hours
Fan runs during unoccupied hours
Fan operation during unoccupied hours
Runs continuo
us
Runs continuo
us
Runs continuo
us
NightFanCtrlIECC Code Fan cycles during unoccupied hours
Fan cycles during unoccupied hours
Fan cycles during unoccupied hours
cycles cycles cycles
Best NA NA NA NA NA NA 6023 Optimal start
controls 15 Worst No optimal start No optimal start No optimal start Optimal
Start? No No No
OptStart Code Optimal start as required
Optimal start as required
Optimal start as required
Yes Yes Yes
Best NA NA NA NA NA NA
6025 Damper control when space is unoccupied
15 Worst NA NA Gravity damper open during night cycle and optimum start
Damper type; operation
NA NA Gravity; open night cycle and
warmup

B.10
Measure ID Abbrev.
Measure Name Life (yr)
Case Case conditions by climate zones Input Units (modeled)
Case Input Parameters 2A 3B 5A 2A 3B 5A
OADamperCtrl Code Gravity damper open during night cycle and optimum start
Gravity damper open during night cycle and optimum start
Motorized damper closed during warmup and night cycle hours
Gravity; open night cycle and
warmup
Gravity; open night cycle and
warmup
Motorized; closed
night cycle and
warmup Best NA NA NA NA NA NA 6026p Snow and ice-
melting system control
15 Worst NA Manual Seasonal shutoff
Manual Seasonal shutoff
Score NA -10 -10
SnowIceCtrl Code NA Automatic off at >40F OA or >50F pavement temp
Automatic off at >40F OA or >50F pavement temp
NA 0 0
Best NA Automatic off at >35F OA or >35F pavement temp
Automatic off at >40F OA or >50F pavement temp
NA 7.34 7.34
6029 Demand control ventilation
15 Worst No DCV No DCV No DCV Actual condition
No DCV No DCV No DCV
DCV Code DCV in conference room
DCV in conference room
DCV in conference room
DCV in conference room
DCV in conference room
DCV in conference room
Best NA NA NA NA NA NA
6030 Energy recovery requirement
15 Worst No energy recovery system
No energy recovery system
No energy recovery system
ERV system No No No
ERVUse Code Yes, for all AC except for conference room with DCV
Yes, for all AC except for conference room with DCV
Yes, for all AC except for conference room with DCV
Yes, except
for DCV
Yes, except
for DCV
Yes, except
for DCV
Best NA NA NA NA NA NA
6033p Exterior (outside building) Duct insulation
30 Worst Ignore the inside heat/cool loss, only calculate the exterior ducts. Non-insulation , i.e., OutDuctLossCoeffDiff=1/(0.17*2)*5.678263
Ignore the inside heat/cool loss, only calculate the exterior ducts. Non-insulation , i.e., OutDuctLossCoeffDiff=1/(0.17*2)*5.678263
Ignore the inside heat/cool loss, only calculate the exterior ducts. Non-insulation , i.e., OutDuctLossCoeffDiff=1/(0.17*2)*5.678263
% required Insul R-value
0% 0% 0%

B.11
Measure ID Abbrev.
Measure Name Life (yr)
Case Case conditions by climate zones Input Units (modeled)
Case Input Parameters 2A 3B 5A 2A 3B 5A
DuctInsul Code Ignore the inside heat/cool loss, only calculate the exterior ducts R8 insulation i.e., OutDuctLossCoeffDiff=1/(0.17*2+8)*5.678263
Ignore the inside heat/cool loss, only calculate the exterior ducts R8 insulation i.e., OutDuctLossCoeffDiff=1/(0.17*2+8)*5.678263
Ignore the inside heat/cool loss, only calculate the exterior ducts R8 insulation i.e., OutDuctLossCoeffDiff=1/(0.17*2+8)*5.678263
100% 100% 100%
Best NA NA NA NA NA NA
6035 Duct leakage requirement
20 Worst Duct leakage is 30% of the supply airflow
Duct leakage is 30% of the supply airflow
Duct leakage is 30% of the supply airflow
Duct Leakage of SA cfm
30% 30% 30%
DuctLeakage Code Duct leakage is 10% of the supply airflow for all the RTUs
Duct leakage is 10% of the supply airflow for all the RTUs
Duct leakage is 10% of the supply airflow for all the RTUs
10% 10% 10%
Best NA NA NA NA NA NA
6042A Hydronic Piping CHW Insulation Requirement
20 Worst No insulation No insulation No insulation Insulation R-value
No insulatio
n
No insulatio
n
No insulatio
n HydPipeInsCHW Code Insulated to code Insulated to code Insulated to code Insulated
to code Insulated to code
Insulated to code
Best postponed postponed postponed postponed
postponed
postponed
6042B Hydronic Piping HW Insulation Requirement
20 Worst No insulation No insulation No insulation % Req'd Insul Thickness
0% 0% 0%
HydPipeInsHW Code Insulated as required Insulated as required Insulated as required 100% 100% 100%
Best NA NA NA NA NA NA
6045p Mechanical Commissioning
15 Worst No commissioning No commissioning No commissioning Score -10 -10 -10
MechCx Code Commissioning per code; satisfactory
Commissioning per code; satisfactory
Commissioning per code; satisfactory
0 0 0
Best Commissioning above code; excellent
Commissioning above code; excellent
Commissioning above code; excellent
3 3 3
6046A Fan power limit requirement for PkgAC
15 Worst 150% of limit 150% of limit 150% of limit bHP (not SP) 35.5 37.7
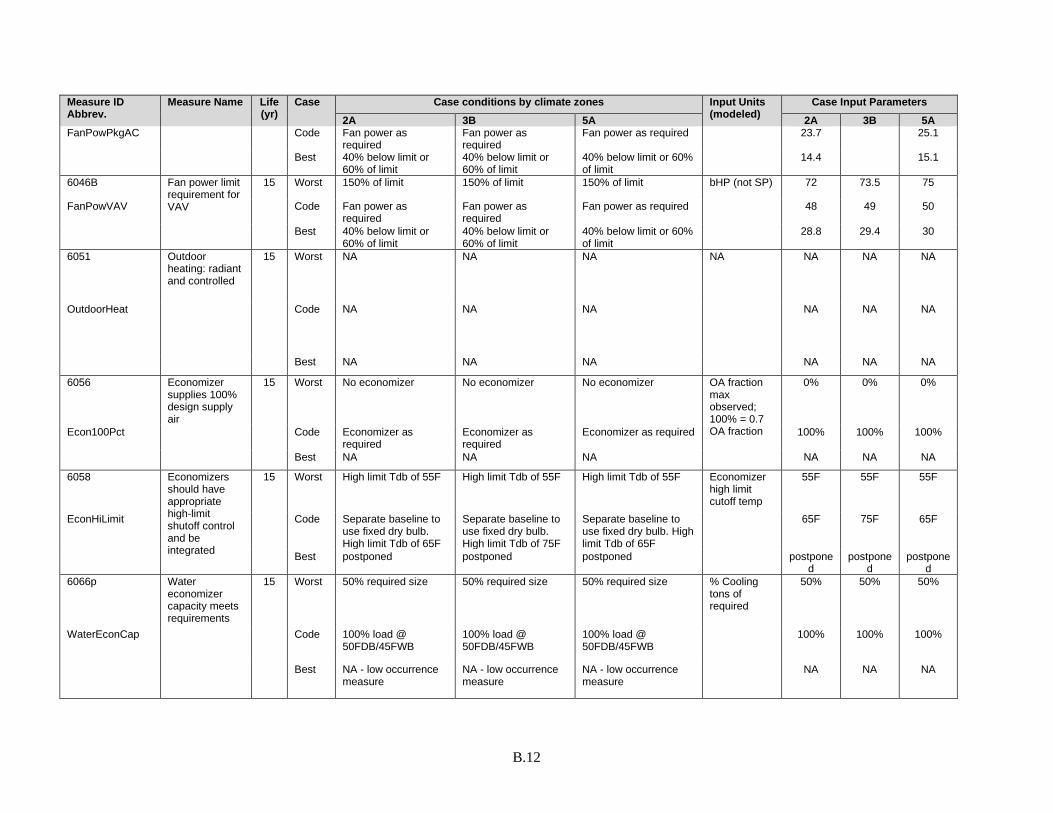
B.12
Measure ID Abbrev.
Measure Name Life (yr)
Case Case conditions by climate zones Input Units (modeled)
Case Input Parameters 2A 3B 5A 2A 3B 5A
FanPowPkgAC Code Fan power as required
Fan power as required
Fan power as required 23.7 25.1
Best 40% below limit or 60% of limit
40% below limit or 60% of limit
40% below limit or 60% of limit
14.4 15.1
6046B Fan power limit requirement for VAV
15 Worst 150% of limit 150% of limit 150% of limit bHP (not SP) 72 73.5 75
FanPowVAV Code Fan power as required
Fan power as required
Fan power as required 48 49 50
Best 40% below limit or 60% of limit
40% below limit or 60% of limit
40% below limit or 60% of limit
28.8 29.4 30
6051 Outdoor heating: radiant and controlled
15 Worst NA NA NA NA NA NA NA
OutdoorHeat Code NA NA NA NA NA NA
Best NA NA NA NA NA NA
6056 Economizer supplies 100% design supply air
15 Worst No economizer No economizer No economizer OA fraction max observed; 100% = 0.7 OA fraction
0% 0% 0%
Econ100Pct Code Economizer as required
Economizer as required
Economizer as required 100% 100% 100%
Best NA NA NA NA NA NA
6058 Economizers should have appropriate high-limit shutoff control and be integrated
15 Worst High limit Tdb of 55F High limit Tdb of 55F High limit Tdb of 55F Economizer high limit cutoff temp
55F 55F 55F
EconHiLimit Code Separate baseline to use fixed dry bulb. High limit Tdb of 65F
Separate baseline to use fixed dry bulb. High limit Tdb of 75F
Separate baseline to use fixed dry bulb. High limit Tdb of 65F
65F 75F 65F
Best postponed postponed postponed postponed
postponed
postponed
6066p Water economizer capacity meets requirements
15 Worst 50% required size 50% required size 50% required size % Cooling tons of required
50% 50% 50%
WaterEconCap Code 100% load @ 50FDB/45FWB
100% load @ 50FDB/45FWB
100% load @ 50FDB/45FWB
100% 100% 100%
Best NA - low occurrence measure
NA - low occurrence measure
NA - low occurrence measure
NA NA NA

B.13
Measure ID Abbrev.
Measure Name Life (yr)
Case Case conditions by climate zones Input Units (modeled)
Case Input Parameters 2A 3B 5A 2A 3B 5A
6067p Pre-cooling coils have low pressure drop
15 Worst 25 ft coil max 25 ft coil max 25 ft coil max Feet of pressure drop in coil
25 25 25
WaterEconDP Code 15 ft water side coil max pressure drop
15 ft water side coil max pressure drop
15 ft water side coil max pressure drop
15 15 15
Best NA NA NA NA NA NA 6070 Multi-zone
systems shall be VAV and fans with motors ≥threshold hp shall have variable speed, variable pitch axial, or fan demand reduction
15 Worst Inlet vane control Inlet vane control Inlet vane control Fan curve type
Inlet vane
Inlet vane
Inlet vane
FanVSD Code Fan curve for VSD with static pressure reset
Fan curve for VSD with static pressure reset
Fan curve for VSD with static pressure reset
VSD; SP reset
VSD; SP reset
VSD; SP reset
Best NA NA NA NA NA NA
6071 Static pressure reset for multi-zone VAV fans
15 Worst No reset No reset No reset Fan curve type
No reset No reset No reset
FanPresReset Code Fan curve for VSD with static pressure reset
Fan curve for VSD with static pressure reset
Fan curve for VSD with static pressure reset
VSD static
pressure reset
VSD static
pressure reset
VSD static
pressure reset
Best NA NA NA NA NA NA
6075p Multiple boiler systems must include sequencing controls
20 Worst Uniform loading Uniform loading Uniform loading Boiler Loading
Uniform Uniform Uniform
BoilerLoadDistr Code Sequenced with base loss when the boiler is in use
Sequenced with base loss when the boiler is in use
Sequenced with base loss when the boiler is in use
Sequenced
Sequenced
Sequenced
Best Postponed Postponed Postponed Postponed
Postponed
Postponed
6082 WSHP shall have a deadband between heat rejection and addition
15 Worst 79.5/74.5, 5°F deadband
79.5/74.5 79.5/74.5 °F 79.5/74.5
79.5/74.5
79.5/74.5
WSHPDeadband Code 87/67, 20°F deadband per code
87/67, 20°F deadband per code
87/67, 20°F deadband per code
87/67 87/67 87/67
Best Postponed Postponed Postponed Postponed
Postponed
Postponed

B.14
Measure ID Abbrev.
Measure Name Life (yr)
Case Case conditions by climate zones Input Units (modeled)
Case Input Parameters 2A 3B 5A 2A 3B 5A
6089 Each WSHP in a system exceeding 10 hp pump shall have a two-position valve
15 Worst Constant flow Constant flow Constant flow Score relative to code and worst condition
-10 -10 -10
Below Variable flow pump - pump ride on the curve
Variable flow pump - pump ride on the curve
Variable flow pump - pump ride on the curve
-2 -2 -2
WSHPvalve Code Variable flow pump - VSD without pressure reset curve
Variable flow pump - VSD without pressure reset curve
Variable flow pump - VSD without pressure reset curve
0 0 0
Best NA NA NA NA NA NA
6090 Hydronic systems > 300 MBH shall reset supply water temp or reduce system flow
15 Worst Constant flow, no reset
Constant flow, no reset
Constant flow, no reset Minimum Pump Speed
100% 100% 100%
HydRstTmpFlow Code variable flow pump for chilled water and hot water. This should be the primary baseline.
variable flow pump for chilled water and hot water. This should be the primary baseline.
variable flow pump for chilled water and hot water. This should be the primary baseline.
50% 50% 50%
Best NA NA NA NA NA NA 6091p Multiple chillers
shall reduce flow when a chiller is shut down
20 Worst No isolation No isolation No isolation NA No isolation
No isolation
No isolation
ChillerIsol Code Isolation Isolation Isolation Isolation Isolation Isolation
Best NA NA NA NA NA NA
6093p Multiple boilers shall reduce flow when a boiler is shut down
20 Worst No isolation No isolation No isolation NA No isolation
No isolation
No isolation
BoilerIsol Code Sequenced with base loss when the boiler is in use
Sequenced with base loss when the boiler is in use
Sequenced with base loss when the boiler is in use
Boiler staging control
Sequential
Sequential
Sequential
Best NA NA NA NA NA NA
6094 Tower Fans ≥ 75 hp shall have variable speed control
20 Worst Constant speed Constant speed Constant speed NA Constant speed
Constant speed
Constant speed

B.15
Measure ID Abbrev.
Measure Name Life (yr)
Case Case conditions by climate zones Input Units (modeled)
Case Input Parameters 2A 3B 5A 2A 3B 5A
TwrFanVSD Code Variable speed cooling tower
Variable speed cooling tower
Variable speed cooling tower
Variable speed
Variable speed
Variable speed
Best 6101 Multiple zone
HVAC systems shall have supply-air temperature reset controls
15 Worst Fixed SA setpoint Fixed SA setpoint Fixed SA setpoint Score -10 -10 -10
SATreset Code OA Based SAT Reset OA Based SAT Reset OA Based SAT Reset 0 0 0
Best NA NA NA NA NA NA
6105p Hot gas bypass only allowed with multiple steps of unloading or capacity modulation
15 Worst Single compressor no staging
Single compressor no staging
Single compressor no staging
% waste of modeled cooling load
10.9% 10.9% 10.9%
HotGasBypass Code Multistage Compressor
Multistage Compressor
Multistage Compressor 0% 0% 0%
Best NA NA NA NA NA NA
6106AS VAV ventilation optimization
15 Worst No reset of outdoor air intake flow
No reset of outdoor air intake flow
No reset of outdoor air intake flow
Sys OSA Optimization
No reset No reset No reset
DynVentReset Code Separate baseline to include reset for three VAV systems
Separate baseline to include reset for three VAV systems
Separate baseline to include reset for three VAV systems
OA reset for VAV systems
OA reset for VAV systems
OA reset for VAV systems
Best NA NA NA NA NA NA
6108AS Single zone VAV
15 Worst Constant Volume fan Constant Volume fan Constant Volume fan Min VAV or multi-speed fan%
100% 100% 100%
SZVAV Code SZVAV or two speed fan; code minimum speed
SZVAV or two speed fan; code minimum speed
SZVAV or two speed fan; code minimum speed
67% 67% 67%
Best SZVAV or two speed fan; low minimum speed
SZVAV or two speed fan; low minimum speed
SZVAV or two speed fan; low minimum speed
25% 25% 25%
6109pAS Parking garage fan controls
15 Worst Fans run full during occupied hours
Fans run full during occupied hours
Fans run full during occupied hours
Minimum fan speed
100% 100% 100%
GarageFanCtrl Code Controlled by CO sensors, 50% minimum fan speed
Controlled by CO sensors, 50% minimum fan speed
Controlled by CO sensors, 50% minimum fan speed
50% 50% 50%

B.16
Measure ID Abbrev.
Measure Name Life (yr)
Case Case conditions by climate zones Input Units (modeled)
Case Input Parameters 2A 3B 5A 2A 3B 5A
Best Controlled by CO sensors, 33% minimum fan speed
Controlled by CO sensors, 33% minimum fan speed
Controlled by CO sensors, 33% minimum fan speed
33% 33% 33%
6110pAS Zone Isolation 15 Worst No isolation, 1/3 of building has minimum damper position of 30% during unoccupied
No isolation, 1/3 of building has minimum damper position of 30% during unoccupied
No isolation, 1/3 of building has minimum damper position of 30% during unoccupied
Percent of building area operating unnecessarily
23.90% 23.90% 23.90%
ZoneIsolate Code Core zone on the top floor runs 24/7. Other zones have night setback and reduced minimum damper position.
Core zone on the top floor runs 24/7. Other zones have night setback and reduced minimum damper position.
Core zone on the top floor runs 24/7. Other zones have night setback and reduced minimum damper position.
0.00% 0.00% 0.00%
Best NA NA NA NA NA NA
7002A Water heater efficiency, Gas
18 Worst No worst case No worst case No worst case NA NA NA
SwhGasEff Code Code efficiency Code efficiency Code efficiency Thermal Efficiency, Et
78%Et 78%Et 78%Et
Best Enhanced efficiency Enhanced efficiency Enhanced efficiency 92% Et 92% Et 92% Et
7002B Water heater efficiency, Electric
18 Worst 2009 IECC efficiency 2009 IECC efficiency 2009 IECC efficiency Efficiency factor, EF
EF= 0.8772
EF= 0.8772
EF= 0.8772
SwhEleEff Code Code efficiency Code efficiency Code efficiency EF = 0.9172
EF = 0.9172
EF = 0.9172
Best NA NA NA NA NA NA 7004 Outlet
temperature of lavatories in public facility rest rooms is limited to 110°F (43°C)
15 Worst Higher outlet temperature
Higher outlet temperature
Higher outlet temperature
°F, Lavatory Outlet temp
120°F 120°F 120°F
LavTempLmt Code SWH Tank temperature setpoint 130F, restroom outlet temperature at 110
SWH Tank temperature setpoint 130F, restroom outlet temperature at 110
SWH Tank temperature setpoint 130F, restroom outlet temperature at 110
110°F 110°F 110°F
Best NA NA NA NA NA NA
7005p SWH Heat Trap 15 Worst No heat trap No heat trap No heat trap NA No heat trap
No heat trap
No heat trap
SwhHeatTrap Code Heat trap as required Heat trap as required Heat trap as required Heat trap as
required
Heat trap as
required
Heat trap as
required Best NA NA NA NA NA NA

B.17
Measure ID Abbrev.
Measure Name Life (yr)
Case Case conditions by climate zones Input Units (modeled)
Case Input Parameters 2A 3B 5A 2A 3B 5A
7006 SWH Pipe Insulation - Recirculated
15 Worst No pipe insulation No pipe insulation No pipe insulation Insulation level
0% 0% 0%
SwhRecPipIns Code Insulate as required Insulate as required Insulate as required 100% 100% 100%
Best NA NA NA NA NA NA
7007 SWH Pipe Insulation - Non-recirculated
15 Worst NA NA NA NA NA NA NA
SwhNonPipIns Code NA NA NA NA NA NA
Best NA NA NA NA NA NA 7008 Circulating hot
water system pumps and heat trace must have readily-accessible controls to turn them off when not needed
15 Worst Pumps run continuously
Pumps run continuously
Pumps run continuously
Pipe Heat Loss, W
1732 W 1732 W 1732 W
SwhRecCtrl Code Pumps run intermittently
Pumps run intermittently
Pumps run intermittently
1301 W 1301 W 1301 W
Best NA NA NA NA NA NA
9003 Manual lighting control
20 Worst Lights full on during all occupied hours
Lights full on during all occupied hours
Lights full on during all occupied hours
Score -10 -10 -10
ManLtCtl Code Original lighting schedule in IECC 2012
Original lighting schedule in IECC 2012
Original lighting schedule in IECC 2012
0 0 0
Best NA NA NA NA NA NA
9009 Automatic time switch control
15 Worst All lights on all night All lights on all night All lights on all night Lights on unoccupied
Yes Yes Yes
AutoLtCtrl Code Original lighting schedule in IECC 2012
Original lighting schedule in IECC 2012
Original lighting schedule in IECC 2012
No No No
Best NA NA NA NA NA NA
9011 Occupancy sensor control
15 Worst No occupancy sensors where required
No occupancy sensors where required
No occupancy sensors where required
Score -5 -5 -5
OccSens Code Occupancy sensors installed where required per code
Occupancy sensors installed where required per code
Occupancy sensors installed where required per code
0 0 0
Best More savings than code baseline
More savings than code baseline
More savings than code baseline
10 10 10

B.18
Measure ID Abbrev.
Measure Name Life (yr)
Case Case conditions by climate zones Input Units (modeled)
Case Input Parameters 2A 3B 5A 2A 3B 5A
9014A Daylighting control
15 Worst No automatic daylighting controls
No automatic daylighting controls
No automatic daylighting controls
Score -10 -10 -10
DLCtrlReqd Code Separate baseline: 40% WWR, 3% SRR, DL control to 50% of total floor
Separate baseline: 40% WWR, 3% SRR, DL control to 50% of total floor
Separate baseline: 40% WWR, 3% SRR, DL control to 50% of total floor
0 0 0
Best 40% WWR, 3% SSR, DL control to 60% of total floor. All daylightable area is controlled.
40% WWR, 3% SSR, DL control to 60% of total floor. All daylightable area is controlled.
40% WWR, 3% SSR, DL control to 60% of total floor. All daylightable area is controlled.
2.8 2.8 2.8
9014B For large, high-bay spaces total daylight zone under skylights at least 1/2 of floor area
15 Worst No automatic daylighting controls
No automatic daylighting controls
No automatic daylighting controls
% Skylit area controlled
0% 0% 0%
DLCtrlHiBay Code 50% of DL area with automatic daylighting controls
50% of DL area with automatic daylighting controls
50% of DL area with automatic daylighting controls
50% 50% 50%
Best All daylightable area is controlled.
All daylightable area is controlled.
All daylightable area is controlled.
100% 100% 100%
9025 Display lighting control
15 Worst NA NA NA NA NA NA NA
DispLtCtrl Code NA NA NA NA NA NA
Best NA NA NA NA NA NA
9028 Task lighting control
15 Worst No manual task lighting controls where required. All task lighting is on.
No manual task lighting controls where required. All task lighting is on.
No manual task lighting controls where required. All task lighting is on.
$task_ltg_ctrl_multiplier
1.0719 1.0719 1.0719
TskLtCtrl Code Task lighting controls where required.
Task lighting controls where required.
Task lighting controls where required.
1 1 1
Best NA NA NA NA NA NA

B.19
Measure ID Abbrev.
Measure Name Life (yr)
Case Case conditions by climate zones Input Units (modeled)
Case Input Parameters 2A 3B 5A 2A 3B 5A
9029 Lighting for nonvisual applications shall be controlled separately
15 Worst NA NA NA NA NA NA NA
NonVisLtCtrl Code NA NA NA NA NA NA
Best NA NA NA NA NA NA
9031 Exterior lighting control
15 Worst Exterior lighting is always on
Exterior lighting is always on
Exterior lighting is always on
Score -10 -10 -10
ExtLtCtrl Code Astronomical clock Astronomical clock Astronomical clock 0 0 0
Best Photocell plus all lights reduced 30% after midnight to 6 am
Photocell plus all lights reduced 30% after midnight to 6 am
Photocell plus all lights reduced 30% after midnight to 6 am
1.5 1.5 1.5
9034 Tandem wiring 20 Worst 2 ballasts per fixture 2 ballasts per fixture 2 ballasts per fixture Lamps per ballast
1.5 1.5 1.5
TandWire Code 1.5 ballasts per fixture 1.5 ballasts per fixture 1.5 ballasts per fixture 2 2 2 Best NA NA NA NA NA NA 9035 Exit sign
maximum power
15 Worst 10 W per side of the exit sign (Each sign has two sides)
10 W per side of the exit sign (Each sign has two sides)
10 W per side of the exit sign (Each sign has two sides)
Watts per each of two sides of exit sign
10 10 10
ExitSign Code 5 W per side of the exit sign (Each sign has two sides)
5 W per side of the exit sign (Each sign has two sides)
5 W per side of the exit sign (Each sign has two sides)
5 5 5
Best 2.5 W per side of the exit sign (Each sign has two sides)
2.5 W per side of the exit sign (Each sign has two sides)
2.5 W per side of the exit sign (Each sign has two sides)
2.5 2.5 2.5
9037 Interior lighting power allowance
15 Worst 200% code requirement
200% code requirement
200% code requirement
LPD, W/sf 1.8 1.8 1.8
IntLPD Code Code requirement Code requirement Code requirement 0.9 0.9 0.9
Best 50% code requirement
50% code requirement
50% code requirement 0.45 0.45 0.45
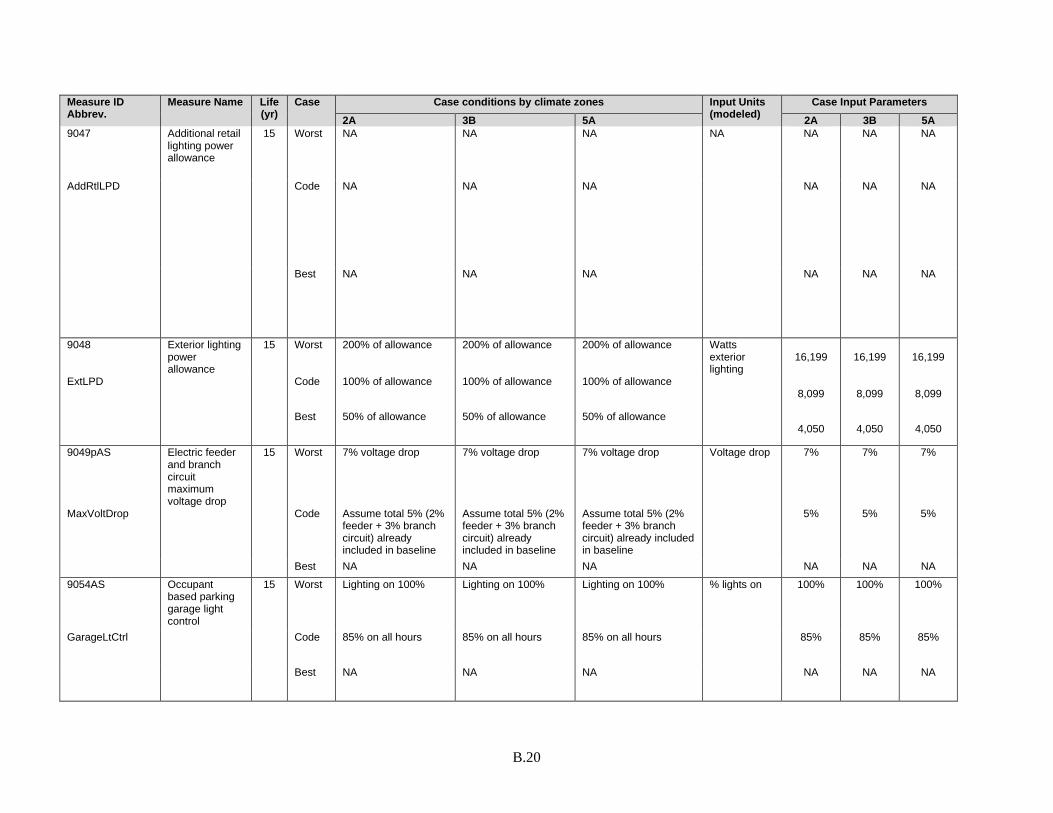
B.20
Measure ID Abbrev.
Measure Name Life (yr)
Case Case conditions by climate zones Input Units (modeled)
Case Input Parameters 2A 3B 5A 2A 3B 5A
9047 Additional retail lighting power allowance
15 Worst NA NA NA NA NA NA NA
AddRtlLPD Code NA NA NA NA NA NA
Best NA NA NA NA NA NA
9048 Exterior lighting power allowance
15 Worst 200% of allowance 200% of allowance 200% of allowance Watts exterior lighting
16,199
16,199
16,199
ExtLPD Code 100% of allowance 100% of allowance 100% of allowance 8,099
8,099
8,099
Best 50% of allowance 50% of allowance 50% of allowance 4,050
4,050
4,050
9049pAS Electric feeder and branch circuit maximum voltage drop
15 Worst 7% voltage drop 7% voltage drop 7% voltage drop Voltage drop 7% 7% 7%
MaxVoltDrop Code Assume total 5% (2% feeder + 3% branch circuit) already included in baseline
Assume total 5% (2% feeder + 3% branch circuit) already included in baseline
Assume total 5% (2% feeder + 3% branch circuit) already included in baseline
5% 5% 5%
Best NA NA NA NA NA NA 9054AS Occupant
based parking garage light control
15 Worst Lighting on 100% Lighting on 100% Lighting on 100% % lights on 100% 100% 100%
GarageLtCtrl Code 85% on all hours 85% on all hours 85% on all hours 85% 85% 85%
Best NA NA NA NA NA NA

B.21
Measure ID Abbrev.
Measure Name Life (yr)
Case Case conditions by climate zones Input Units (modeled)
Case Input Parameters 2A 3B 5A 2A 3B 5A
9055pAS Plug load controls
15 Worst No plug load control No plug load control No plug load control NA No plug load
control
No plug load
control
No plug load
control PlugLdCtrl Code Plug load control per
code Plug load control per code
Plug load control per code
Plug load
control per code
Plug load
control per code
Plug load
control per code
Best NA NA NA NA NA NA 9099p Lighting Testing
or Commissioning
15 Worst No commissioning No commissioning No commissioning Score -10 -10 -10
LightCx Code General commissioning and functional testing as required
General commissioning and functional testing as required
General commissioning and functional testing as required
0 0 0
Best High quality comprehensive commissioning
High quality comprehensive commissioning
High quality comprehensive commissioning
3 3 3

B.22
Table B.2. Code Measures, Conditions, and Input Parameters – Retail Building Measure ID Abbrev.
Measure Name Life (yr)
Case Case Conditions by Climate Zone Input Units (modeled)
Case Input Parameters 2A 3B 5A 2A 3B 5A
15007 Optional onsite renewable
15 Worst No option installed No option installed No option installed Peak design W/sf
0 0 0
OptRenewbl Code Min requirement for renewable energy option
Min requirement for renewable energy option
Min requirement for renewable energy option
0.5 0.5 0.5
Best Double the minimum requirement
Double the minimum requirement
Double the minimum requirement
1 1 1
5012 Roofs shall be insulated to meet CZ requirements
30 Worst No insulation No insulation No insulation U-factor 0.89 0.89 0.89
RoofIns Code Insulated per code Insulated per code Insulated per code 0.048 0.048 0.039
Best Double the minimum requirement
Double the minimum requirement
Double the minimum requirement
0.024 0.024 0.0195
5013 Skylight curbs shall be insulated
30 Worst No insulation No insulation No insulation Insulation R-value
R-0 R-0 R-0
SkylCurbIns Code Insulated per code Insulated per code Insulated per code R-5 R-5 R-5 Best Insulated to 75% of
roof U Insulated to 75% of roof U
Insulated to 75% of roof U
R-28 R-28 R-28
5014 Low slope roofs in CZ 1-3 shall be cool roofs
30 Worst Asphalt roof Asphalt roof NA Solar Reflectance
0.1 0.1 NA
CoolRoof Code Code reflective roof Code reflective roof NA 0.55 0.55 NA
Best Highly reflective roof membrane, clean
Highly reflective roof membrane, clean
NA 0.87 0.87 NA
5018A Above grade frame walls shall be insulated to meet CZ requirements
30 Worst No insulation No insulation No insulation U-factor 0.459 0.459 0.459
FrameWallIns Code Insulated per code Insulated per code Insulated per code 0.077 0.064 0.064
Best Insulated to 2.4 times code requirement
Insulated to 2.4 times code requirement
Insulated to 2.4 times code requirement
0.032 0.026 0.026
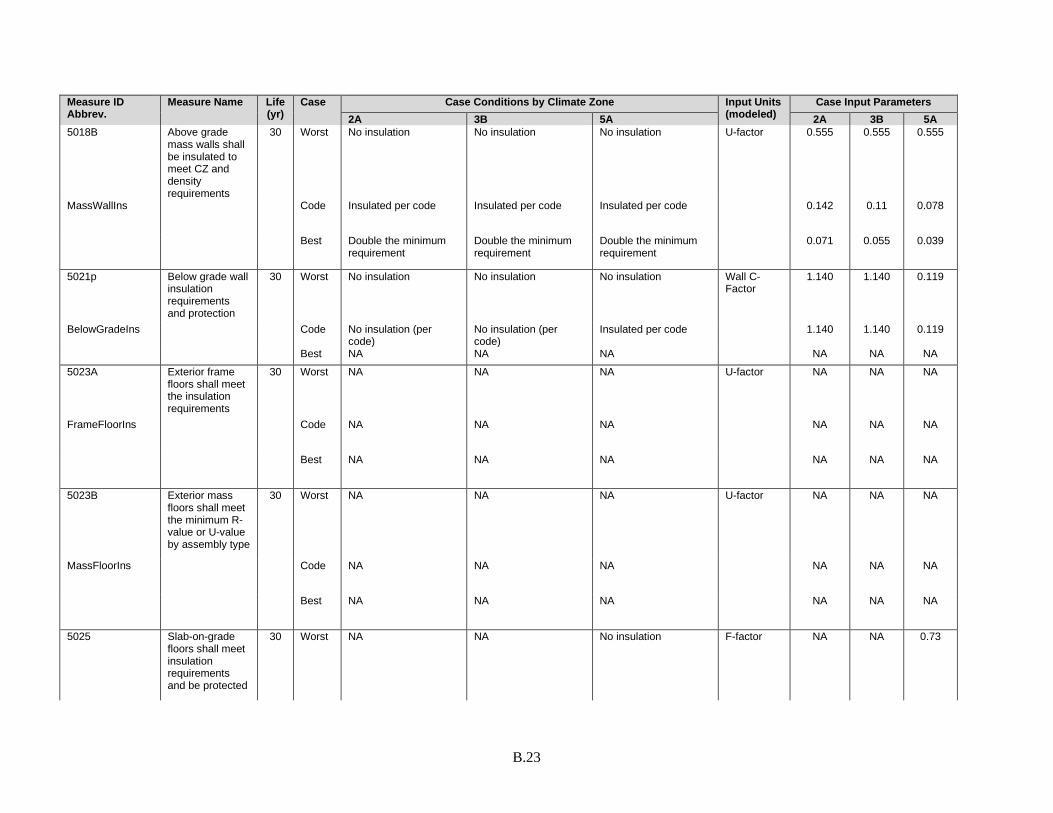
B.23
Measure ID Abbrev.
Measure Name Life (yr)
Case Case Conditions by Climate Zone Input Units (modeled)
Case Input Parameters 2A 3B 5A 2A 3B 5A
5018B Above grade mass walls shall be insulated to meet CZ and density requirements
30 Worst No insulation No insulation No insulation U-factor 0.555 0.555 0.555
MassWallIns Code Insulated per code Insulated per code Insulated per code 0.142 0.11 0.078
Best Double the minimum requirement
Double the minimum requirement
Double the minimum requirement
0.071 0.055 0.039
5021p Below grade wall insulation requirements and protection
30 Worst No insulation No insulation No insulation Wall C-Factor
1.140 1.140 0.119
BelowGradeIns Code No insulation (per code)
No insulation (per code)
Insulated per code 1.140 1.140 0.119
Best NA NA NA NA NA NA 5023A Exterior frame
floors shall meet the insulation requirements
30 Worst NA NA NA U-factor NA NA NA
FrameFloorIns Code NA NA NA NA NA NA
Best NA NA NA NA NA NA
5023B Exterior mass floors shall meet the minimum R-value or U-value by assembly type
30 Worst NA NA NA U-factor NA NA NA
MassFloorIns Code NA NA NA NA NA NA
Best NA NA NA NA NA NA
5025 Slab-on-grade floors shall meet insulation requirements and be protected
30 Worst NA NA No insulation F-factor NA NA 0.73

B.24
Measure ID Abbrev.
Measure Name Life (yr)
Case Case Conditions by Climate Zone Input Units (modeled)
Case Input Parameters 2A 3B 5A 2A 3B 5A
SlabIns Code NA NA Insulated per code NA NA 0.54 Best NA NA Insulated to 1.3 times
code requirement NA NA 0.419
5029A Opaque swing doors shall meet U-factor requirements
30 Worst Uninsulated double layer metal door
Uninsulated double layer metal door
Uninsulated double layer metal door
U-factor 0.7 0.7 0.7
SwingDoorU Code Code insulated door Code insulated door Code insulated door 0.61 0.61 0.37 Best 200% of code
requirement 200% of code requirement
200% of code requirement
0.305 0.305 0.185
5029B Opaque rollup doors shall meet U-factor requirements
30 Worst Uninsulated single layer metal door
Uninsulated single layer metal door
Uninsulated single layer metal door
U-factor 1.45 1.45 1.45
RollupDoorU Code Code insulated door Code insulated door Code insulated door 0.21 0.21 0.21
Best Insulated to 4.6 times code requirement
Insulated to 4.6 times code requirement
Insulated to 4.6 times code requirement
0.045 0.045 0.045
5034 Window-to-wall ratio shall meet maximum limits
30 Worst 2.9 times max code limit
2.9 times max code limit
2.9 times max code limit
WWR 87.70% 87.70% 87.70%
MaxWWR Code Max WWR per code Max WWR per code Max WWR per code 30% 30% 30%
Best NA NA NA NA NA NA
5035 Skylight to roof ratio shall meet maximum limits
30 Worst 2.3 times max code limit
2.3 times max code limit
2.3 times max code limit
SRR 6.93% 6.93% 6.93%
MaxSkyLtRoofR Code Max per code Max per code Max per code 2.95% 2.95% 2.95%
Best NA NA NA NA NA NA
5042A Windows shall meet U-factor requirements
30 Worst Single pane, fixed, thermally unbroken metal frame
Single pane, fixed, thermally unbroken metal frame
Single pane, fixed, thermally unbroken metal frame
U-factor 1.25 1.25 1.25
WinUFactor Code Code U-factor Code U-factor Code U-factor 0.5 0.46 0.38

B.25
Measure ID Abbrev.
Measure Name Life (yr)
Case Case Conditions by Climate Zone Input Units (modeled)
Case Input Parameters 2A 3B 5A 2A 3B 5A
Best 250% of code requirement
250% of code requirement
250% of code requirement
0.2 0.2 0.2
5042B Windows shall meet SHGC requirements
30 Worst Single pane, clear Single pane, clear Single pane, clear SHGC 0.82 0.82 0.82
WinSHGC Code Code SHGC Code SHGC Code SHGC 0.25 0.25 0.4
Best Low-e coating on tint Low-e coating on tint Low-e coating on tint 0.2 0.2 0.2
5043A Skylights shall meet U-factor requirements
30 Worst Single pane clear, w/metal thermally unbroken frame
Single pane clear, w/metal thermally unbroken frame
Single pane clear, w/metal thermally unbroken frame
U-factor 1.98 1.98 1.98
SkyLtUFactor Code Code U-factor Code U-factor Code U-factor 0.65 0.55 0.5
Best 210% of code requirement
210% of code requirement
210% of code requirement
0.31 0.31 0.31
5043B Skylights shall meet SHGC requirements
30 Worst Clear, 1/8" glass, metal frame w/o thermal break
Clear, 1/8" glass, metal frame w/o thermal break
Clear, 1/8" glass, metal frame w/o thermal break
SHGC 0.82 0.82 0.82
SkyLtSHGC Code Code SHGC Code SHGC Code SHGC 0.35 0.35 0.4
Best Low-e coating on tint Low-e coating on tint Low-e coating on tint 0.2 0.2 0.2
5056 Building shall meet continuous air barrier requirements
30 Worst 3 x base leakage 3 x base leakage 3 x base leakage cfm/ft2 exterior surface at 75Pa
3.00 3.00 3.00
ContAirBar Code equivalent to a CAB as required
equivalent to a CAB as required
equivalent to a CAB as required
1.00 1.00 1.00
Best 1/4 x code leakage 1/4 x code leakage 1/4 x code leakage 0.25 0.25 0.25
5063 Recessed lighting shall be sealed, rated and labeled
15 Worst 30 cfm at 75 Pa per fixture, Unsealed recessed lights
30 cfm at 75 Pa per fixture, Unsealed recessed lights
30 cfm at 75 Pa per fixture, Unsealed recessed lights
cfm per fixture @ 4 Pa
30 30 30
RecsLtgLeak Code 2 cfm at 75 Pa per fixture
2 cfm at 75 Pa per fixture
2 cfm at 75 Pa per fixture
2 2 2
Best NA NA NA NA NA NA

B.26
Measure ID Abbrev.
Measure Name Life (yr)
Case Case Conditions by Climate Zone Input Units (modeled)
Case Input Parameters 2A 3B 5A 2A 3B 5A
5075 Fenestration assemblies shall meet air leakage requirements
30 Worst Leaky windows 5x code requirement
Leaky windows 5x code requirement
Leaky windows 5x code requirement
1.5 1.5 1.5
WindowLeak Code Code requirement for window leakage
Code requirement for window leakage
Code requirement for window leakage
0.3 0.3 0.3
Best 66% less leakage for windows
66% less leakage for windows
66% less leakage for windows
0.1 0.1 0.1
5077 Stair and shaft vent leakage
30 Worst Open damper, leaky door
Open damper, leaky door
Open damper, leaky door
Leakage High High High
StairShaftLeak Code Damper closed, doors sealed
Damper closed, doors sealed
Damper closed, doors sealed
Low Low Low
Best NA NA NA NA NA NA
5082 Loading dock doors shall be equipped with weather seals
15 Worst doors not weatherstripped or sealed
doors not weatherstripped or sealed
doors not weatherstripped or sealed
Actual condition
doors not weatherstripped or
sealed
doors not
weatherstripped
or sealed
doors not
weatherstripped
or sealed
LoadDockSeal Code doors weatherstripped and sealed
doors weatherstripped and sealed
doors weatherstripped and sealed
doors weatherstripped
and sealed
doors weatherstripped
and sealed
doors weatherstripped
and sealed
Best NA NA NA NA NA NA 5083 Building
entrances shall be protected with an enclosed vestibule
30 Worst NA No vestibule No vestibule Added door infiltration rate, cfm
NA 1020 cfm
1020 cfm
Vestibule Code NA Has vestibule Has vestibule NA 0 cfm 0 cfm
Best NA NA NA NA NA NA
5089 Fenestration orientation
30 Worst All windows on E/W orientation
All windows on E/W orientation
All windows on E/W orientation
ft2 of E windows
3,801
3,801
3,801
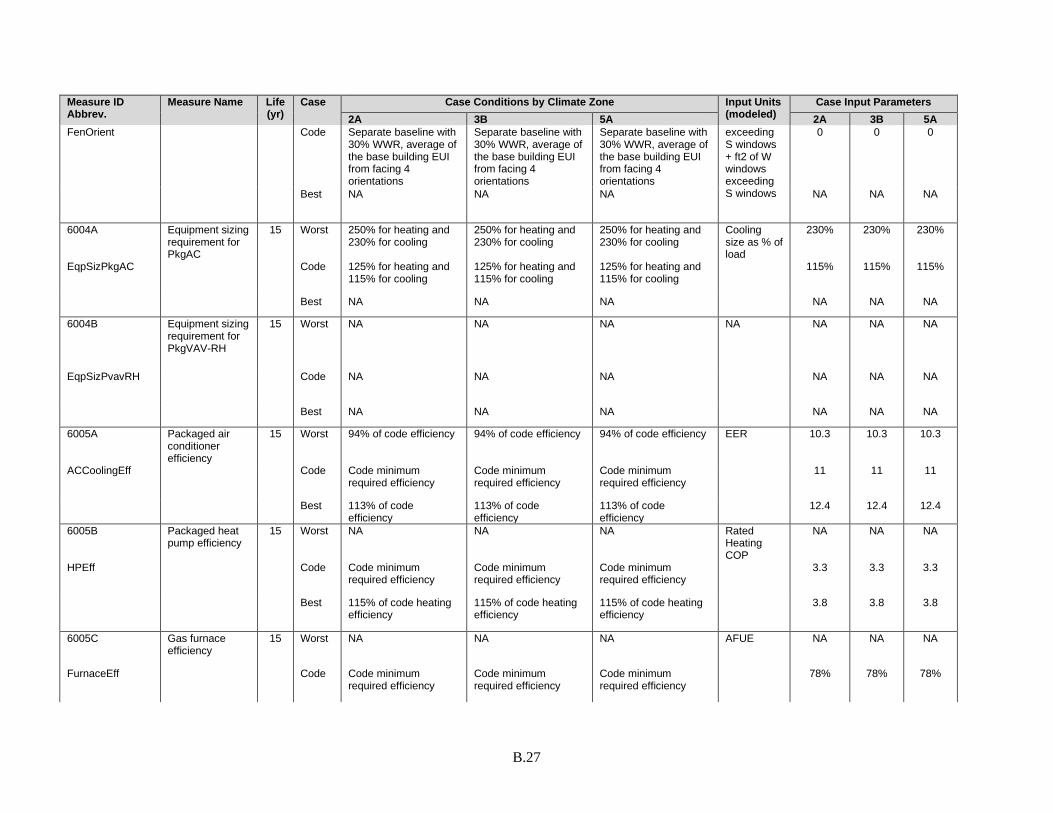
B.27
Measure ID Abbrev.
Measure Name Life (yr)
Case Case Conditions by Climate Zone Input Units (modeled)
Case Input Parameters 2A 3B 5A 2A 3B 5A
FenOrient Code Separate baseline with 30% WWR, average of the base building EUI from facing 4 orientations
Separate baseline with 30% WWR, average of the base building EUI from facing 4 orientations
Separate baseline with 30% WWR, average of the base building EUI from facing 4 orientations
exceeding S windows + ft2 of W windows exceeding S windows
0 0 0
Best NA NA NA NA NA NA
6004A Equipment sizing requirement for PkgAC
15 Worst 250% for heating and 230% for cooling
250% for heating and 230% for cooling
250% for heating and 230% for cooling
Cooling size as % of load
230% 230% 230%
EqpSizPkgAC Code 125% for heating and 115% for cooling
125% for heating and 115% for cooling
125% for heating and 115% for cooling
115% 115% 115%
Best NA NA NA NA NA NA
6004B Equipment sizing requirement for PkgVAV-RH
15 Worst NA NA NA NA NA NA NA
EqpSizPvavRH Code NA NA NA NA NA NA
Best NA NA NA NA NA NA
6005A Packaged air conditioner efficiency
15 Worst 94% of code efficiency 94% of code efficiency 94% of code efficiency EER 10.3 10.3 10.3
ACCoolingEff Code Code minimum required efficiency
Code minimum required efficiency
Code minimum required efficiency
11 11 11
Best 113% of code efficiency
113% of code efficiency
113% of code efficiency
12.4 12.4 12.4
6005B Packaged heat pump efficiency
15 Worst NA NA NA Rated Heating COP
NA NA NA
HPEff Code Code minimum required efficiency
Code minimum required efficiency
Code minimum required efficiency
3.3 3.3 3.3
Best 115% of code heating efficiency
115% of code heating efficiency
115% of code heating efficiency
3.8 3.8 3.8
6005C Gas furnace efficiency
15 Worst NA NA NA AFUE NA NA NA
FurnaceEff Code Code minimum required efficiency
Code minimum required efficiency
Code minimum required efficiency
78% 78% 78%

B.28
Measure ID Abbrev.
Measure Name Life (yr)
Case Case Conditions by Climate Zone Input Units (modeled)
Case Input Parameters 2A 3B 5A 2A 3B 5A
Best 124% of code heating efficiency
124% of code heating efficiency
124% of code heating efficiency
97% 97% 97%
6005D Boiler efficiency 15 Worst NA NA NA ET NA NA NA
BoilerEff Code NA NA NA NA NA NA
Best NA NA NA NA NA NA
6005E WSHP efficiency 15 Worst NA NA NA Heating COP (cooling EER is a match)
NA NA NA
WSHPEff Code NA NA NA NA NA NA
Best NA NA NA NA NA NA
6007A Air-cooled Chiller efficiency
15 Worst NA NA NA EER NA NA NA
AirChillerEff Code NA NA NA NA NA NA
Best NA NA NA NA NA NA
6007B Water-cooled Chiller efficiency
23 Worst NA NA NA kW/Ton NA NA NA
WatrChillerEff Code NA NA NA NA NA NA
Best NA NA NA NA NA NA
6014 Thermostatic control is used for individual zones
15 Worst 1 Tstat per floor or per building
1 Tstat per floor or per building
1 Tstat per floor or per building
Thermostats for each
Floor Floor Floor
TstatZone Code One thermostat per zone
One thermostat per zone
One thermostat per zone
Zone Zone Zone
Best NA NA NA NA NA NA

B.29
Measure ID Abbrev.
Measure Name Life (yr)
Case Case Conditions by Climate Zone Input Units (modeled)
Case Input Parameters 2A 3B 5A 2A 3B 5A
6016 Humidity control device for each humidity system
15 Worst 73 F cooling setpoint during occupied hours all year
73 F cooling setpoint during occupied hours all year
73 F cooling setpoint during occupied hours all year
Occupied Cooling Setpoint
73 F 73 F 73 F
ActiveRHCtrl Code 73F RH>60%, 75F RH<=60% (occupied hours RH control only)
73F RH>60%, 75F RH<=60% (occupied hours RH control only)
73F RH>60%, 75F RH<=60% (occupied hours RH control only)
73F RH>60%
, 75F RH<=60
%
73F RH>60%, 75F RH<=60
%
73F RH>60%, 75F RH<=6
0%
Best NA NA NA NA NA NA
6017 Heat pump supplementary heat control
15 Worst OA lockout 70°F. Compressor lockout 35°F
OA lockout 70°F. Compressor lockout 35°F
OA lockout 70°F. Compressor lockout 35°F
Score -10 -10 -10
HPSuppHeatCtrl Code OA lockout 40°F. Compressor lockout 10°F
OA lockout 40°F. Compressor lockout 10°F
OA lockout 40°F. Compressor lockout 10°F
0 0 0
Best OA lockout 30°F. Compressor lockout -4°F
OA lockout 30°F. Compressor lockout -4°F
OA lockout 30°F. Compressor lockout -4°F
1.3 1.3 1.3
6018 Thermostat deadband requirement
15 Worst Heating 72F, Cooling 73F
Heating 72F, Cooling 73F
Heating 72F, Cooling 73F
°F difference between heat & cool
1 1 1
TempDeadband Code Heating 70F, Cooling 75F
Heating 70F, Cooling 75F
Heating 70F, Cooling 75F
5 5 5
Best Heating 67F, Cooling 76F
Heating 67F, Cooling 76F
Heating 67F, Cooling 76F
9 9 9
6019A Thermostat heating setback
15 Worst No heat setback; Heating 70F, Cooling 85F
No heat setback; Heating 70F, Cooling 85F
No heat setback; Heating 70F, Cooling 85F
°F setpoint for heating setback
70 70 70
SetbackCtrl Code Setback: Heating 60F, Cooling 85F
Setback: Heating 60F, Cooling 85F
Setback: Heating 60F, Cooling 85F
60 60 60
Best Setback: Heating 50F, Cooling 90F
Setback: Heating 50F, Cooling 90F
Setback: Heating 50F, Cooling 90F
50 50 50
6019B Thermostat cooling setback
15 Worst No setback No setback No setback °F setpoint for cooling setback
75 75 75
SetCoolCtrl Code Setback: Heating 60F, Cooling 85F
Setback: Heating 60F, Cooling 85F
Setback: Heating 60F, Cooling 85F
85 85 85
Best Setback: Heating 50F, Cooling 90F
Setback: Heating 50F, Cooling 90F
Setback: Heating 50F, Cooling 90F
90 90 90

B.30
Measure ID Abbrev.
Measure Name Life (yr)
Case Case Conditions by Climate Zone Input Units (modeled)
Case Input Parameters 2A 3B 5A 2A 3B 5A
6019C Night fan control 15 Worst Fan runs during unoccupied hours
Fan runs during unoccupied hours
Fan runs during unoccupied hours
Fan operation during unoccupied hours
Runs continuo
us
Runs continu
ous
Runs continu
ous
NightFanCtrlIECC Code Fan cycles during unoccupied hours
Fan cycles during unoccupied hours
Fan cycles during unoccupied hours
cycles cycles cycles
Best NA NA NA NA NA NA 6023 Optimal start
controls 15 Worst No optimal start No optimal start No optimal start Optimal
Start? No No No
OptStart Code Optimal start as required
Optimal start as required
Optimal start as required
Yes Yes Yes
Best NA NA NA NA NA NA
6025 Damper control when space is unoccupied
15 Worst NA NA Gravity damper open during night cycle and optimum start
Damper type; operation
NA NA Gravity; open night cycle and
warmup OADamperCtrl Code Gravity damper open
during night cycle and optimum start
Gravity damper open during night cycle and optimum start
Motorized damper closed during warmup and night cycle hours
Gravity; open night
cycle and warmup
Gravity; open night cycle and
warmup
Motorized;
closed night cycle and
warmup Best NA NA NA NA NA NA 6026p Snow and ice-
melting system control
15 Worst NA Manual Seasonal shutoff
Manual Seasonal shutoff
Score NA -10 -10
SnowIceCtrl Code NA Automatic off at >40F OA or >50F pavement temp
Automatic off at >40F OA or >50F pavement temp
NA 0 0
Best NA Automatic off at >35F OA or >35F pavement temp
Automatic off at >40F OA or >50F pavement temp
NA 7.34 7.34
6029 Demand control ventilation
15 Worst Manual Calc from prior Manual Calc from prior Manual Calc from prior Actual condition
Manual Calc from prior
Manual Calc from prior
Manual Calc from prior
DCV Code NA NA NA NA NA NA

B.31
Measure ID Abbrev.
Measure Name Life (yr)
Case Case Conditions by Climate Zone Input Units (modeled)
Case Input Parameters 2A 3B 5A 2A 3B 5A
Best NA NA NA NA NA NA
6030 Energy recovery requirement
15 Worst No energy recovery system
No energy recovery system
No energy recovery system
ERV system
No No No
ERVUse Code Yes, core retail only Yes, core retail only Yes, core retail only Yes, core retail only
Yes, core retail only
Yes, core retail only
Best NA NA NA NA NA NA
6033p Exterior (outside building) Duct insulation
30 Worst Ignore the inside heat/cool loss, only calculate the exterior ducts. Non-insulation , i.e., OutDuctLossCoeffDiff=1/(0.17*2)*5.678263
Ignore the inside heat/cool loss, only calculate the exterior ducts. Non-insulation , i.e., OutDuctLossCoeffDiff=1/(0.17*2)*5.678263
Ignore the inside heat/cool loss, only calculate the exterior ducts. Non-insulation , i.e., OutDuctLossCoeffDiff=1/(0.17*2)*5.678263
% required Insul R-value
0% 0% 0%
DuctInsul Code Ignore the inside heat/cool loss, only calculate the exterior ducts. R8 insulation i.e., OutDuctLossCoeffDiff=1/(0.17*2+8)*5.678263
Ignore the inside heat/cool loss, only calculate the exterior ducts. R8 insulation i.e., OutDuctLossCoeffDiff=1/(0.17*2+8)*5.678263
Ignore the inside heat/cool loss, only calculate the exterior ducts. R8 insulation i.e., OutDuctLossCoeffDiff=1/(0.17*2+8)*5.678263
100% 100% 100%
Best NA NA NA NA NA NA
6035 Duct leakage requirement
20 Worst Duct leakage is 30% of the supply airflow
Duct leakage is 30% of the supply airflow
Duct leakage is 30% of the supply airflow
Duct Leakage of SA cfm
30% 30% 30%
DuctLeakage Code Duct leakage is 10% of the supply airflow for all the RTUs
Duct leakage is 10% of the supply airflow for all the RTUs
Duct leakage is 10% of the supply airflow for all the RTUs
10% 10% 10%
Best NA NA NA NA NA NA
6042A Hydronic Piping CHW Insulation Requirement
20 Worst NA NA NA NA NA NA NA
HydPipeInsCHW Code NA NA NA NA NA NA
Best NA NA NA NA NA NA

B.32
Measure ID Abbrev.
Measure Name Life (yr)
Case Case Conditions by Climate Zone Input Units (modeled)
Case Input Parameters 2A 3B 5A 2A 3B 5A
6042B Hydronic Piping HW Insulation Requirement
20 Worst NA NA NA % Req'd Insul Thickness
NA NA NA
HydPipeInsHW Code NA NA NA NA NA NA
Best NA NA NA NA NA NA
6045p Mechanical Commissioning
15 Worst No commissioning No commissioning No commissioning Score -10 -10 -10
MechCx Code Commissioning per code; satisfactory
Commissioning per code; satisfactory
Commissioning per code; satisfactory
0 0 0
Best Commissioning above code; excellent
Commissioning above code; excellent
Commissioning above code; excellent
3 3 3
6046A Fan power limit requirement for PkgAC
15 Worst 150% of limit 150% of limit 150% of limit bHP (not SP)
17.9 18.1
FanPowPkgAC Code Fan power as required Fan power as required Fan power as required 12 12.1
Best 40% below limit or 60% of limit
40% below limit or 60% of limit
40% below limit or 60% of limit
7.2 7.2
6046B Fan power limit requirement for VAV
15 Worst NA NA NA bHP (not SP)
NA NA NA
FanPowVAV Code NA NA NA NA NA NA
Best NA NA NA NA NA NA
6051 Outdoor heating: radiant and controlled
15 Worst 24/7 during Winter months, 5 kW design power
24/7 during Winter months, 5 kW design power
24/7 during Winter months, 5 kW design power
Heat Schedule; Average output
24/7 during Winter; 100%
24/7 during Winter; 100%
24/7 during Winter; 100%
OutdoorHeat Code Schedule based on building occupancy schedule, 2.5 kW design power
Schedule based on building occupancy schedule, 2.5 kW design power
Schedule based on building occupancy schedule, 2.5 kW design power
Match occupancy; 50%
Match occupa
ncy; 50%
Match occupa
ncy; 50%
Best NA NA NA NA NA NA
6056 Economizer supplies 100% design supply air
15 Worst No economizer No economizer No economizer OA fraction max observed; 100% = 0.7 OA fraction
0% 0% 0%
Econ100Pct Code Economizer as required
Economizer as required
Economizer as required
100% 100% 100%
Best NA NA NA NA NA NA
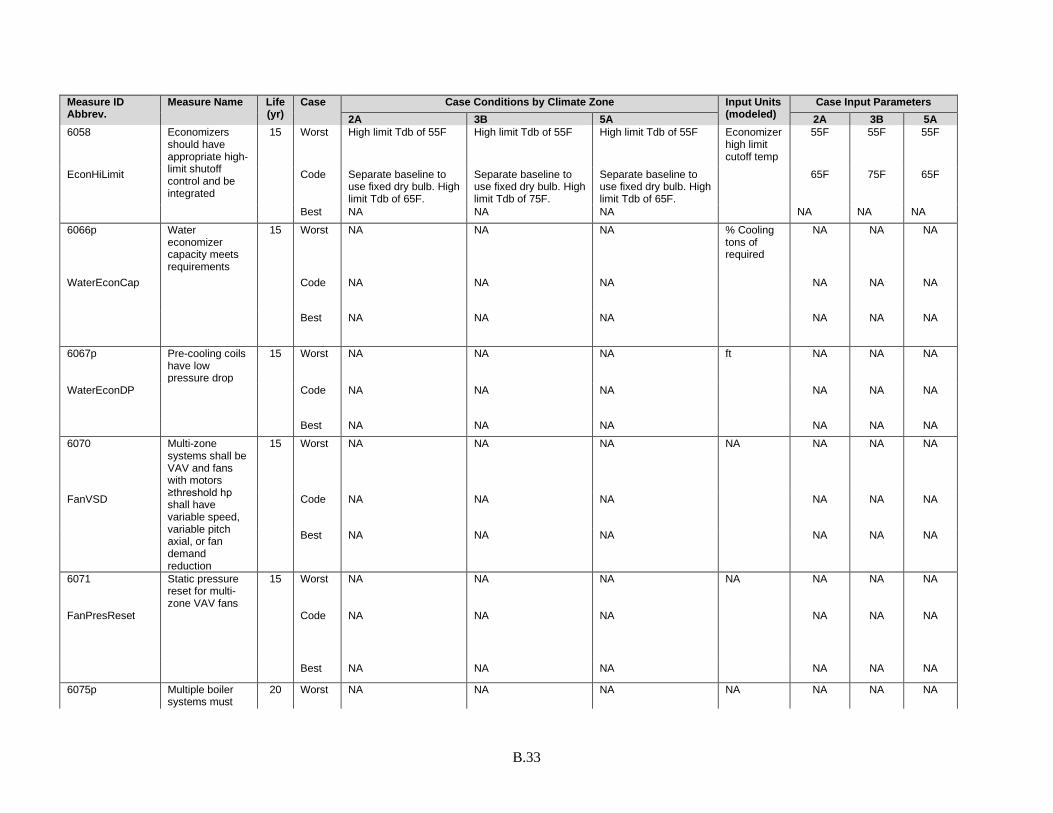
B.33
Measure ID Abbrev.
Measure Name Life (yr)
Case Case Conditions by Climate Zone Input Units (modeled)
Case Input Parameters 2A 3B 5A 2A 3B 5A
6058 Economizers should have appropriate high-limit shutoff control and be integrated
15 Worst High limit Tdb of 55F High limit Tdb of 55F High limit Tdb of 55F Economizer high limit cutoff temp
55F 55F 55F
EconHiLimit Code Separate baseline to use fixed dry bulb. High limit Tdb of 65F.
Separate baseline to use fixed dry bulb. High limit Tdb of 75F.
Separate baseline to use fixed dry bulb. High limit Tdb of 65F.
65F 75F 65F
Best NA NA NA NA NA NA 6066p Water
economizer capacity meets requirements
15 Worst NA NA NA % Cooling tons of required
NA NA NA
WaterEconCap Code NA NA NA NA NA NA
Best NA NA NA NA NA NA
6067p Pre-cooling coils have low pressure drop
15 Worst NA NA NA ft NA NA NA
WaterEconDP Code NA NA NA NA NA NA
Best NA NA NA NA NA NA 6070 Multi-zone
systems shall be VAV and fans with motors ≥threshold hp shall have variable speed, variable pitch axial, or fan demand reduction
15 Worst NA NA NA NA NA NA NA
FanVSD Code NA NA NA NA NA NA
Best NA NA NA NA NA NA
6071 Static pressure reset for multi-zone VAV fans
15 Worst NA NA NA NA NA NA NA
FanPresReset Code NA NA NA NA NA NA
Best NA NA NA NA NA NA
6075p Multiple boiler systems must
20 Worst NA NA NA NA NA NA NA

B.34
Measure ID Abbrev.
Measure Name Life (yr)
Case Case Conditions by Climate Zone Input Units (modeled)
Case Input Parameters 2A 3B 5A 2A 3B 5A
BoilerLoadDistr include sequencing controls
Code NA NA NA NA NA NA
Best NA NA NA NA NA NA
6082 WSHP shall have a deadband between heat rejection and addition
15 Worst NA NA NA °F NA NA NA
WSHPDeadband Code NA NA NA NA NA NA
Best NA NA NA NA NA NA 6089 Each WSHP in a
system exceeding 10 hp pump shall have a two-position valve
15 Worst NA NA NA NA NA NA NA
Below NA NA NA NA NA NA
WSHPvalve Code NA NA NA NA NA NA
Best NA NA NA NA NA NA
6090 Hydronic systems > 300 MBH shall reset supply water temp or reduce system flow
15 Worst NA NA NA NA NA NA NA
HydRstTmpFlow Code NA NA NA NA NA NA
Best NA NA NA NA NA NA
6091p Multiple chiller shall reduce flow when a chiller is shut down
20 Worst NA NA NA NA NA NA NA
ChillerIsol Code NA NA NA NA NA NA
Best NA NA NA NA NA NA

B.35
Measure ID Abbrev.
Measure Name Life (yr)
Case Case Conditions by Climate Zone Input Units (modeled)
Case Input Parameters 2A 3B 5A 2A 3B 5A
6093p Multiple Boilers plants shall reduce flow when a boiler is shut down
20 Worst NA NA NA NA NA NA NA
BoilerIsol Code NA NA NA NA NA NA
Best NA NA NA NA NA NA 6094 Tower Fans ≥ 75
hp shall have variable speed control
20 Worst NA NA NA NA NA NA NA
TwrFanVSD Code NA NA NA NA NA NA
Best NA NA NA NA NA NA 6101 Multiple zone
HVAC systems shall have supply-air temperature reset controls
15 Worst NA NA NA NA NA NA NA
SATreset Code NA NA NA NA NA NA
Best NA NA NA NA NA NA
6105p Hot gas bypass only allowed with multiple steps of unloading or capacity modulation
15 Worst Single compressor no staging
Single compressor no staging
Single compressor no staging
% waste of modeled cooling load
10.9% 10.9% 10.9%
HotGasBypass Code Multistage Compressor Multistage Compressor Multistage Compressor 0% 0% 0%
Best
6106AS VAV ventilation optimization
15 Worst NA NA NA NA NA NA NA
DynVentReset Code NA NA NA NA NA NA
Best NA NA NA NA NA NA
6108AS Single zone VAV 15 Worst Constant Volume fan Constant Volume fan Constant Volume fan Min VAV or multi-speed fan%
100% 100% 100%
SZVAV Code SZVAV or two speed fan; code minimum speed
SZVAV or two speed fan; code minimum speed
SZVAV or two speed fan; code minimum speed
67% 67% 67%
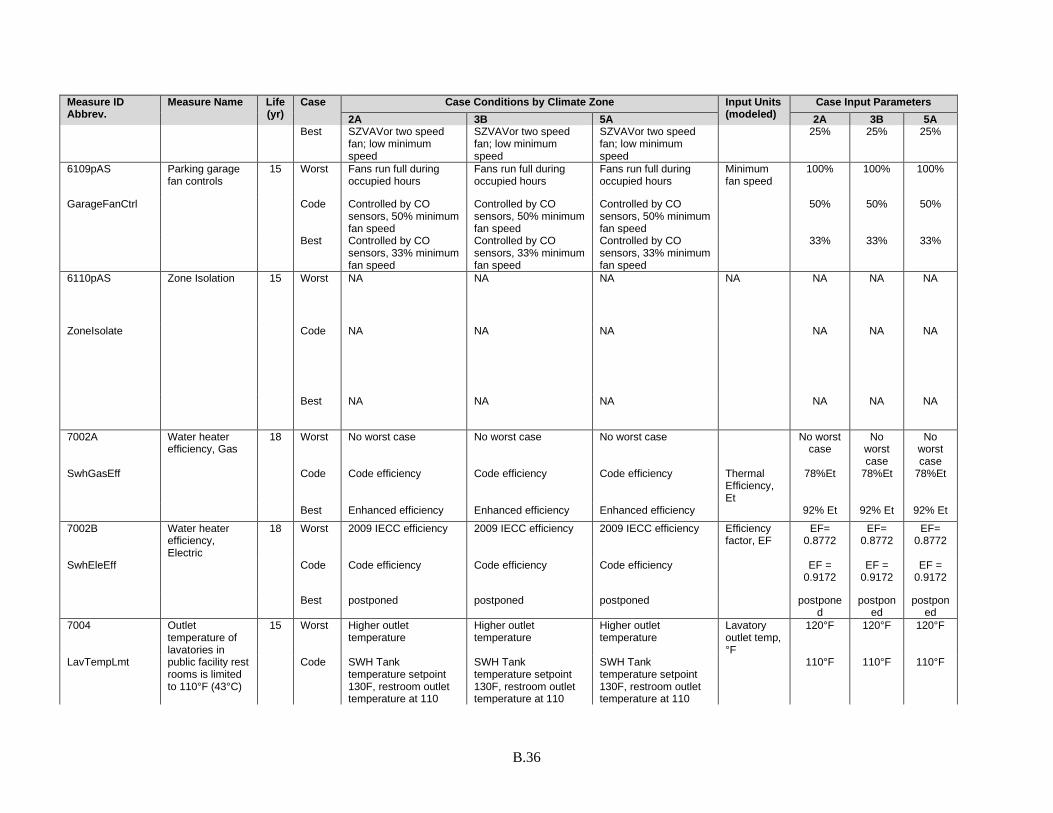
B.36
Measure ID Abbrev.
Measure Name Life (yr)
Case Case Conditions by Climate Zone Input Units (modeled)
Case Input Parameters 2A 3B 5A 2A 3B 5A
Best SZVAVor two speed fan; low minimum speed
SZVAVor two speed fan; low minimum speed
SZVAVor two speed fan; low minimum speed
25% 25% 25%
6109pAS Parking garage fan controls
15 Worst Fans run full during occupied hours
Fans run full during occupied hours
Fans run full during occupied hours
Minimum fan speed
100% 100% 100%
GarageFanCtrl Code Controlled by CO sensors, 50% minimum fan speed
Controlled by CO sensors, 50% minimum fan speed
Controlled by CO sensors, 50% minimum fan speed
50% 50% 50%
Best Controlled by CO sensors, 33% minimum fan speed
Controlled by CO sensors, 33% minimum fan speed
Controlled by CO sensors, 33% minimum fan speed
33% 33% 33%
6110pAS Zone Isolation 15 Worst NA NA NA NA NA NA NA
ZoneIsolate Code NA NA NA NA NA NA
Best NA NA NA NA NA NA
7002A Water heater efficiency, Gas
18 Worst No worst case No worst case No worst case No worst case
No worst case
No worst case
SwhGasEff Code Code efficiency Code efficiency Code efficiency Thermal Efficiency, Et
78%Et 78%Et 78%Et
Best Enhanced efficiency Enhanced efficiency Enhanced efficiency 92% Et 92% Et 92% Et 7002B Water heater
efficiency, Electric
18 Worst 2009 IECC efficiency 2009 IECC efficiency 2009 IECC efficiency Efficiency factor, EF
EF= 0.8772
EF= 0.8772
EF= 0.8772
SwhEleEff Code Code efficiency Code efficiency Code efficiency EF = 0.9172
EF = 0.9172
EF = 0.9172
Best postponed postponed postponed postponed
postponed
postponed
7004 Outlet temperature of lavatories in public facility rest rooms is limited to 110°F (43°C)
15 Worst Higher outlet temperature
Higher outlet temperature
Higher outlet temperature
Lavatory outlet temp, °F
120°F 120°F 120°F
LavTempLmt Code SWH Tank temperature setpoint 130F, restroom outlet temperature at 110
SWH Tank temperature setpoint 130F, restroom outlet temperature at 110
SWH Tank temperature setpoint 130F, restroom outlet temperature at 110
110°F 110°F 110°F

B.37
Measure ID Abbrev.
Measure Name Life (yr)
Case Case Conditions by Climate Zone Input Units (modeled)
Case Input Parameters 2A 3B 5A 2A 3B 5A
Best NA NA NA NA NA NA 7005p SWH Heat Trap 15 Worst No heat trap No heat trap No heat trap NA No heat
trap No heat
trap No heat
trap SwhHeatTrap Code Heat trap as required Heat trap as required Heat trap as required Heat trap
as required
Heat trap as
required
Heat trap as require
d Best NA NA NA NA NA NA
7006 SWH Pipe Insulation - Recirculated
15 Worst NA NA NA Insulation level
NA NA NA
SwhRecPipIns Code NA NA NA NA NA NA
Best NA NA NA NA NA NA
7007 SWH Pipe Insulation - Non-recirculated
15 Worst No pipe insulation No pipe insulation No pipe insulation Pipe heat loss (W)
1879 1879 1879
SwhNonPipIns Code Non-recirculation pipe insulated
Non-recirculation pipe insulated
Non-recirculation pipe insulated
1862 1862 1862
Best NA NA NA NA NA NA 7008 Circulating hot
water system pumps and heat trace must have readily-accessible controls to turn them off when not needed
15 Worst NA NA NA NA NA NA NA
SwhRecCtrl Code NA NA NA NA NA NA
Best NA NA NA NA NA NA
9003 Manual lighting control
20 Worst NA NA NA NA NA NA NA
ManLtCtl Code NA NA NA NA NA NA
Best NA NA NA NA NA NA
9009 Automatic time switch control
15 Worst All lights on all night All lights on all night All lights on all night Lights on unoccupied
Yes Yes Yes
AutoLtCtrl Code Original lighting schedule in IECC 2012
Original lighting schedule in IECC 2012
Original lighting schedule in IECC 2012
No No No
Best NA NA NA NA NA NA

B.38
Measure ID Abbrev.
Measure Name Life (yr)
Case Case Conditions by Climate Zone Input Units (modeled)
Case Input Parameters 2A 3B 5A 2A 3B 5A
9011 Occupancy sensor control
15 Worst No occupancy sensors where required
No occupancy sensors where required
No occupancy sensors where required
Score -10 -10 -10
OccSens Code Occupancy sensors installed where required per code
Occupancy sensors installed where required per code
Occupancy sensors installed where required per code
0 0 0
Best More savings than code baseline
More savings than code baseline
More savings than code baseline
5 5 5
9014A Daylighting control
15 Worst No automatic daylighting controls
No automatic daylighting controls
No automatic daylighting controls
Score -10 -10 -10
DLCtrlReqd Code Required automatic daylight controls in all daylight zones
Required automatic daylight controls in all daylight zones
Required automatic daylight controls in all daylight zones
0 0 0
Best All daylightable area is controlled.
All daylightable area is controlled.
All daylightable area is controlled.
2.8 2.8 2.8
9014B For large, high-bay spaces total daylight zone under skylights at least 1/2 of floor area
15 Worst No automatic daylighting controls
No automatic daylighting controls
No automatic daylighting controls
% Skylit area controlled
0% 0% 0%
DLCtrlHiBay Code 50% of high bay space in daylight zone. 100% of DL area with automatic daylighting controls.
50% of high bay space in daylight zone. 100% of DL area with automatic daylighting controls.
50% of high bay space in daylight zone. 100% of DL area with automatic daylighting controls.
50% 50% 50%
Best 100% of high bay space in daylight zone. 100% of DL area with automatic daylighting controls
100% of high bay space in daylight zone. 100% of DL area with automatic daylighting controls
100% of high bay space in daylight zone. 100% of DL area with automatic daylighting controls
100% 100% 100%
9025 Display lighting control
15 Worst No separate controls. On during occupancy
No separate controls. On during occupancy
No separate controls. On during occupancy
% of display lighting controlled
0% 0% 0%
DispLtCtrl Code Display lighting controlled based on a fraction schedule during the day.
Display lighting controlled based on a fraction schedule during the day.
Display lighting controlled based on a fraction schedule during the day.
100% 100% 100%
Best NA NA NA NA NA NA
9028 Task lighting control
15 Worst No manual task lighting controls where required. All task lighting is on.
No manual task lighting controls where required. All task lighting is on.
No manual task lighting controls where required. All task lighting is on.
$task_ltg_ctrl_multiplier
1.0206 1.0206 1.0206

B.39
Measure ID Abbrev.
Measure Name Life (yr)
Case Case Conditions by Climate Zone Input Units (modeled)
Case Input Parameters 2A 3B 5A 2A 3B 5A
TskLtCtrl Code Task lighting controls where required.
Task lighting controls where required.
Task lighting controls where required.
1 1 1
Best NA NA NA NA NA NA 9029 Lighting for
nonvisual applications shall be controlled separately
15 Worst Lighting is on continuously (24/7)
Lighting is on continuously (24/7)
Lighting is on continuously (24/7)
Operating hours per day
24 24 24
NonVisLtCtrl Code Model 1000 W controlled to be on 4hr per day.
Model 1000 W controlled to be on 4hr per day.
Model 1000 W controlled to be on 4hr per day.
4 4 4
Best NA NA NA NA NA NA
9031 Exterior lighting control
15 Worst Exterior lighting is always on
Exterior lighting is always on
Exterior lighting is always on
Score -10 -10 -10
ExtLtCtrl Code Astronomical clock Astronomical clock Astronomical clock 0 0 0
Best Photocell plus all lights reduced 30% after midnight to 6 am
Photocell plus all lights reduced 30% after midnight to 6 am
Photocell plus all lights reduced 30% after midnight to 6 am
1.5 1.5 1.5
9034 Tandem wiring 20 Worst 2 ballasts per fixture 2 ballasts per fixture 2 ballasts per fixture Lamps per ballast
1.5 1.5 1.5
TandWire Code 1.5 ballasts per fixture 1.5 ballasts per fixture 1.5 ballasts per fixture 2 2 2 Best NA NA NA NA NA NA
9035 Exit sign maximum power
15 Worst 10 W per side of the exit sign (Each sign has two sides)
10 W per side of the exit sign (Each sign has two sides)
10 W per side of the exit sign (Each sign has two sides)
Watts per each of two sides of exit sign
10 10 10
ExitSign Code 5 W per side of the exit sign (Each sign has two sides)
5 W per side of the exit sign (Each sign has two sides)
5 W per side of the exit sign (Each sign has two sides)
5 5 5
Best 2.5 W per side of the exit sign (Each sign has two sides)
2.5 W per side of the exit sign (Each sign has two sides)
2.5 W per side of the exit sign (Each sign has two sides)
2.5 2.5 2.5
9037 Interior lighting power allowance
15 Worst 200% code requirement
200% code requirement
200% code requirement
LPD, W/sf 2.8 2.8 2.8
IntLPD Code Code requirement Code requirement Code requirement 1.4 1.4 1.4
Best 50% code requirement 50% code requirement 50% code requirement 0.7 0.7 0.7

B.40
Measure ID Abbrev.
Measure Name Life (yr)
Case Case Conditions by Climate Zone Input Units (modeled)
Case Input Parameters 2A 3B 5A 2A 3B 5A
9047 Additional retail lighting power allowance
15 Worst ~3x code allowed extra lighting = 1.29 w/sf for core zone adder = 22,173 W
~3x code allowed extra lighting = 1.29 w/sf for core zone adder = 22,173 W
~3x code allowed extra lighting = 1.29 w/sf for core zone adder = 22,173 W
Watts of added retail lighting
22,173 22,173 22,173
AddRtlLPD Code 40% core space; 0.6 & 1.4 average; 1w/sf + 500W = 7,391W ~ 0.429 W/sf; 0.43 w/sf for core zone adder on 17,227 sf
40% core space; 0.6 & 1.4 average; 1w/sf + 500W = 7,391W ~ 0.429 W/sf; 0.43 w/sf for core zone adder on 17,227 sf
40% core space; 0.6 & 1.4 average; 1w/sf + 500W = 7,391W ~ 0.429 W/sf; 0.43 w/sf for core zone adder on 17,227 sf
7,391 7,391 7,391
Best 10% of 0.6 & 1.4 average; 1w/sf + 500W; 0.043 for core zone adder on 17,227 sf = 739 W
10% of 0.6 & 1.4 average; 1w/sf + 500W; 0.043 for core zone adder on 17,227 sf = 739 W
10% of 0.6 & 1.4 average; 1w/sf + 500W; 0.043 for core zone adder on 17,227 sf = 739 W
739 739 739
9048 Exterior lighting power allowance
15 Worst 200% of allowance 200% of allowance 200% of allowance Watts exterior lighting
9,489
9,489
9,489
ExtLPD Code 100% of allowance 100% of allowance 100% of allowance 4,745
4,745
4,745
Best 25% of allowance 25% of allowance 25% of allowance 1,186
1,186
1,186
9049pAS Electric feeder and branch circuit maximum voltage drop
15 Worst 7% voltage drop 7% voltage drop 7% voltage drop Voltage drop
7% 7% 7%
MaxVoltDrop Code Total 5% included in baseline
Total 5% included in baseline
Total 5% included in baseline
5% 5% 5%
Best NA NA NA NA NA NA 9054AS Occupant based
parking garage light control
15 Worst Lighting on 100% Lighting on 100% Lighting on 100% % lights on 100% 100% 100%
GarageLtCtrl Code 85% on all hours 85% on all hours 85% on all hours 85% 85% 85%
Best NA NA NA NA NA NA

B.41
Measure ID Abbrev.
Measure Name Life (yr)
Case Case Conditions by Climate Zone Input Units (modeled)
Case Input Parameters 2A 3B 5A 2A 3B 5A
9055pAS Plug load controls
15 Worst NA NA NA NA NA NA
PlugLdCtrl Code NA NA NA NA NA NA
Best NA NA NA NA NA NA
9099p Lighting Testing or Commissioning
15 Worst No commissioning No commissioning No commissioning NA -10 -10 -10
LightCx Code General commissioning and functional testing as required
General commissioning and functional testing as required
General commissioning and functional testing as required
0 0 0
Best High quality comprehensive commissioning
High quality comprehensive commissioning
High quality comprehensive commissioning
3 3 3

Appendix C
Code Measures Ranked by LCC Energy Cost Impact

C.1
Appendix C
Code Measures Ranked by LCC Cost Impact
Graphs are shown on the following pages, ranking the measures by simulated or calculated present value life-cycle cost (LCC) energy savings. Separate graphs are provided by building type and climate zone. Measure abbreviations and numbers can be found in Appendix B. The values used in the graphs can be found in Table 4.4, sorted by measure reference number.
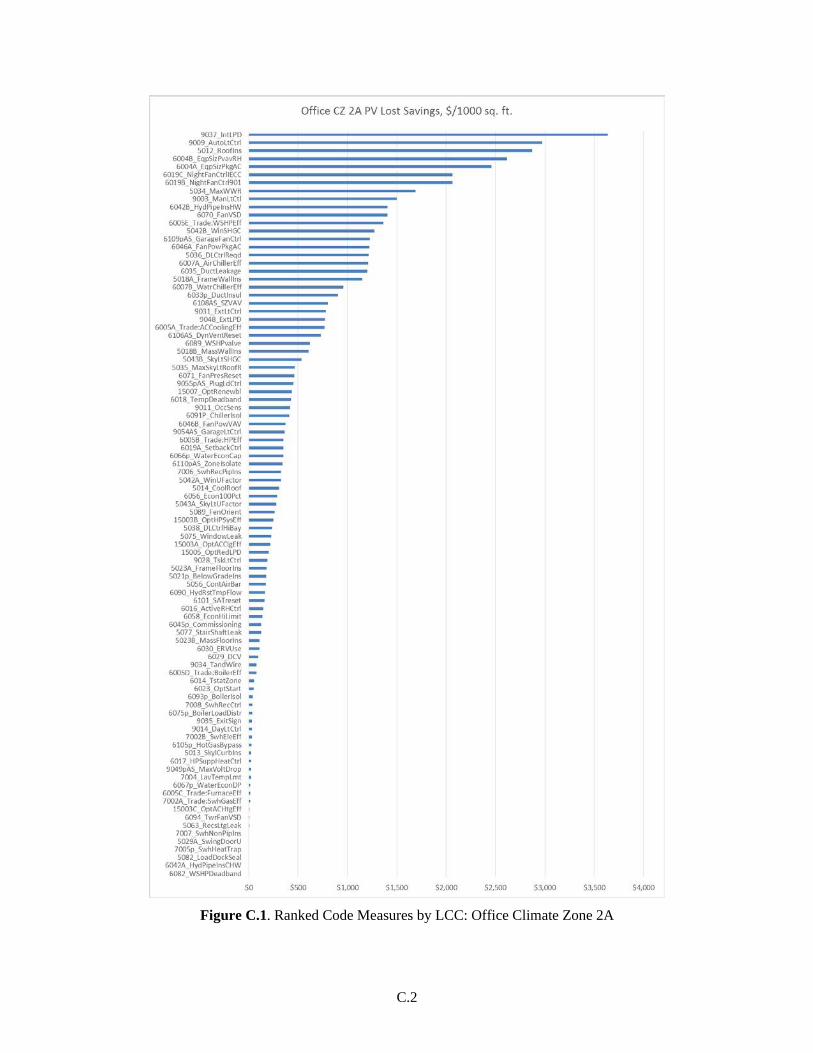
C.2
Figure C.1. Ranked Code Measures by LCC: Office Climate Zone 2A

C.3
Figure C.2. Ranked Code Measures by LCC: Office Climate Zone 3B

C.4
Figure C.3. Ranked Code Measures by LCC: Office Climate Zone 5A
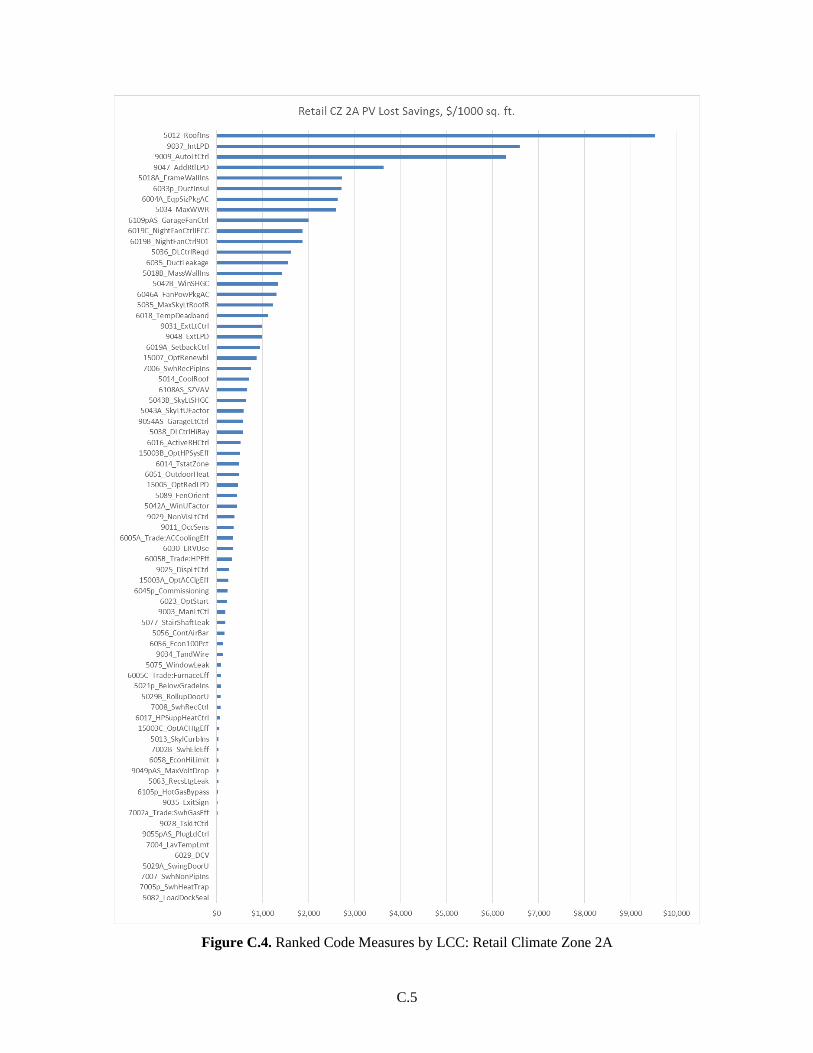
C.5
Figure C.4. Ranked Code Measures by LCC: Retail Climate Zone 2A

C.6
Figure C.5. Ranked Code Measures by LCC: Retail Climate Zone 3B

C.7
Figure C.6. Ranked Code Measures by LCC: Retail Climate Zone 5A

Appendix D
Sample Field Audit Form

D.1
Table D.1. Sample Data Collection Form
*Cells colored in ivory are user inputs. When Measures are not applicable or not included for the building type, rows are greyed out.

D.2
Table D.2. Sample Data Collection Form, Continued
*Cells colored in ivory are user inputs. When Measures are not applicable or not included for the building type, rows are greyed out.

D.3
Table D.3. Sample Data Collection Form, Continued
*Cells colored in ivory are user inputs. When Measures are not applicable or not included for the building type, rows are greyed out.

D.4
Table D.4. Sample Data Collection Form, Continued
*Cells colored in ivory are user inputs. When Measures are not applicable or not included for the building type, rows are greyed out.

D.5
Table D.5. Sample Data Collection Form, Continued
*Cells colored in ivory are user inputs. When Measures are not applicable or not included for the building type, rows are greyed out.


