JST-JICA 2011 Technical Cooperation Project UTM, IRDA, MGTC and JPBD Malaysia Kyoto U, Okayama U and NiES Japan Development of Low Carbon Society Scenarios for Iskandar Malaysia and Putrajaya. LCS RESEARCH WORKSHOP July 5, 2011 FAB, UTM, Johor HO CHIN SIONG
Transcript
JST-JICA 2011 Technical Cooperation Project
UTM, IRDA, MGTC and JPBD Malaysia Kyoto U, Okayama U and NiES Japan
Development of Low Carbon Society Scenarios for
Iskandar Malaysia and Putrajaya.
LCS RESEARCH WORKSHOP
July 5, 2011 FAB, UTM, Johor
HO CHIN SIONG
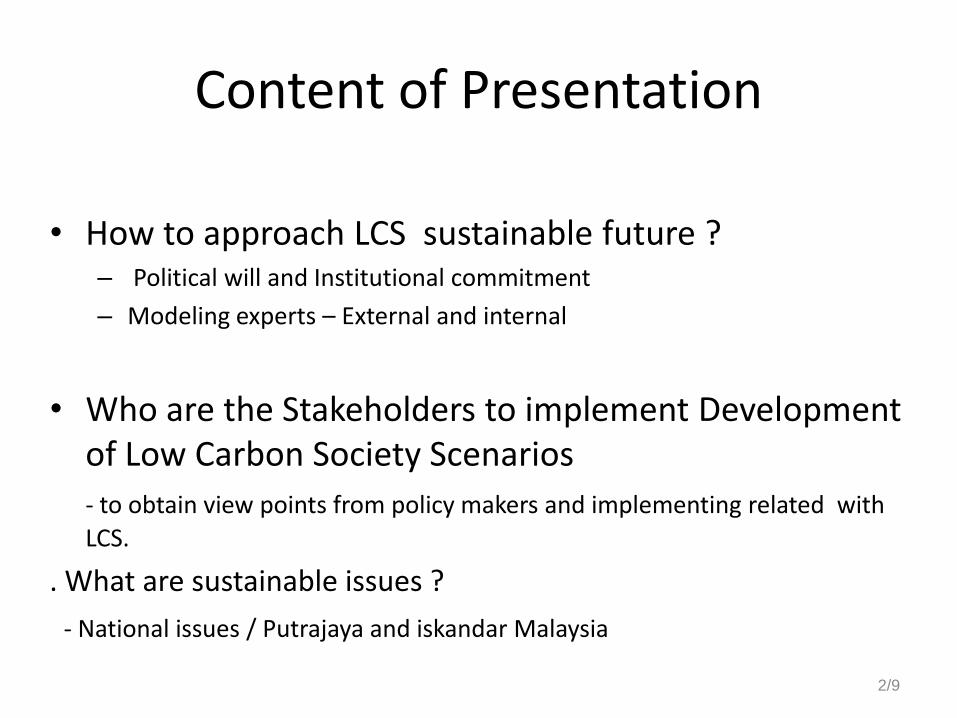
Content of Presentation
• How to approach LCS sustainable future ?– Political will and Institutional commitment
– Modeling experts – External and internal
• Who are the Stakeholders to implement Development of Low Carbon Society Scenarios
- to obtain view points from policy makers and implementing related with
LCS.
. What are sustainable issues ?
- National issues / Putrajaya and iskandar Malaysia
2/9
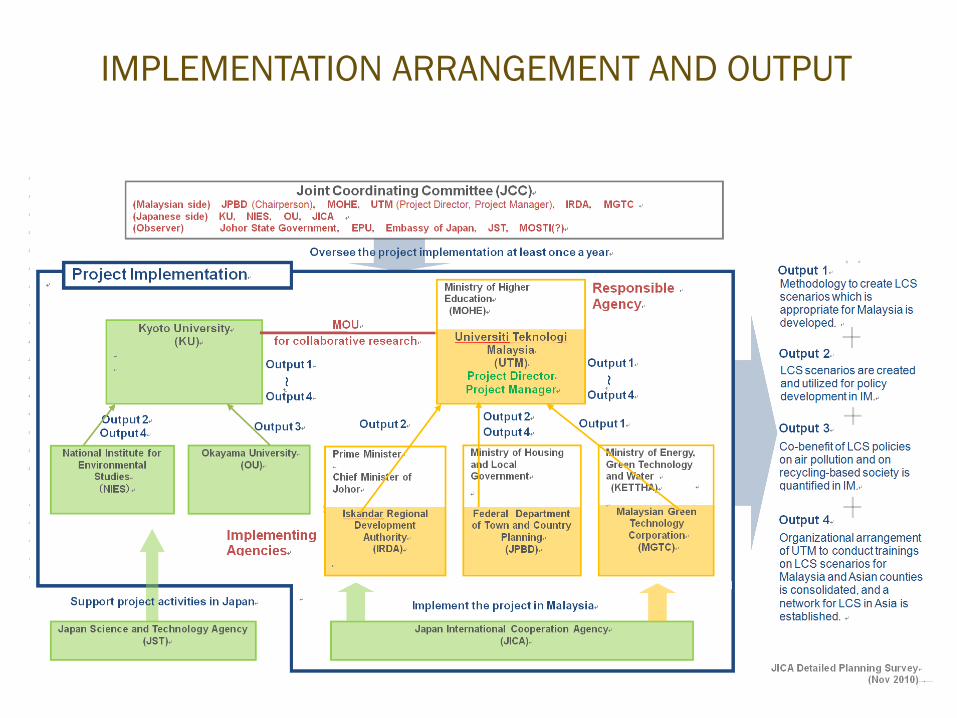
IMPLEMENTATION ARRANGEMENT AND OUTPUT
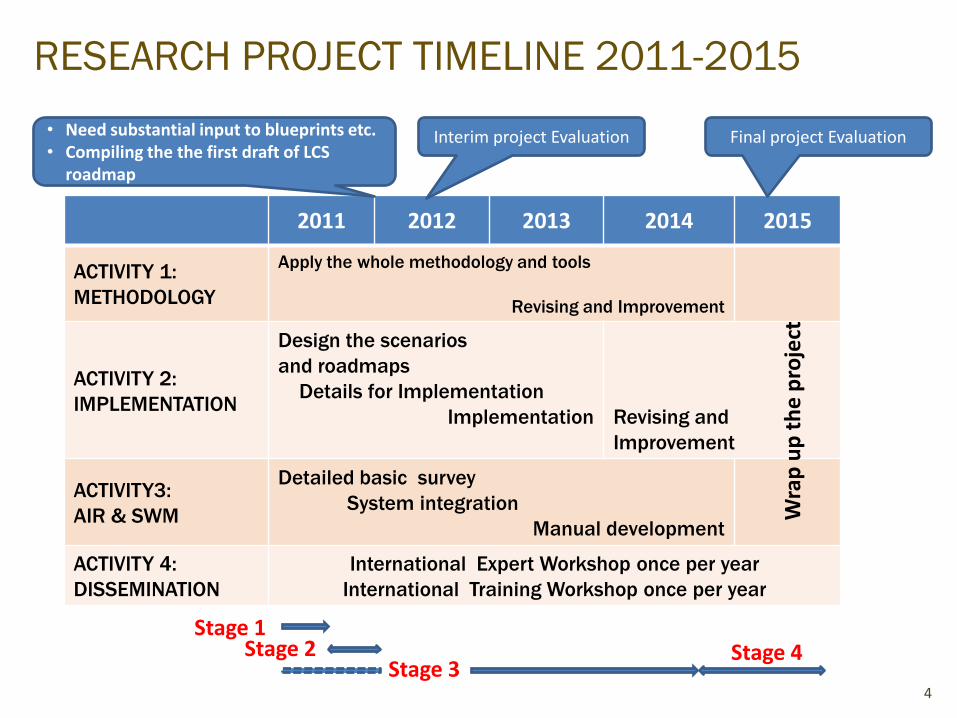
RESEARCH PROJECT TIMELINE 2011-2015
4
2011 2012 2013 2014 2015
ACTIVITY 1:
METHODOLOGY
Apply the whole methodology and tools
Revising and Improvement
ACTIVITY 2:
IMPLEMENTATION
Design the scenarios
and roadmaps
Details for Implementation
Implementation Revising and
Improvement
ACTIVITY3:
AIR & SWM
Detailed basic survey
System integration
Manual development
ACTIVITY 4:
DISSEMINATION
International Expert Workshop once per year
International Training Workshop once per year
Wra
p u
p t
he
pro
ject
Interim project Evaluation• Need substantial input to blueprints etc.• Compiling the the first draft of LCS
roadmap
Final project Evaluation
Stage 1Stage 2 Stage 4
Stage 3
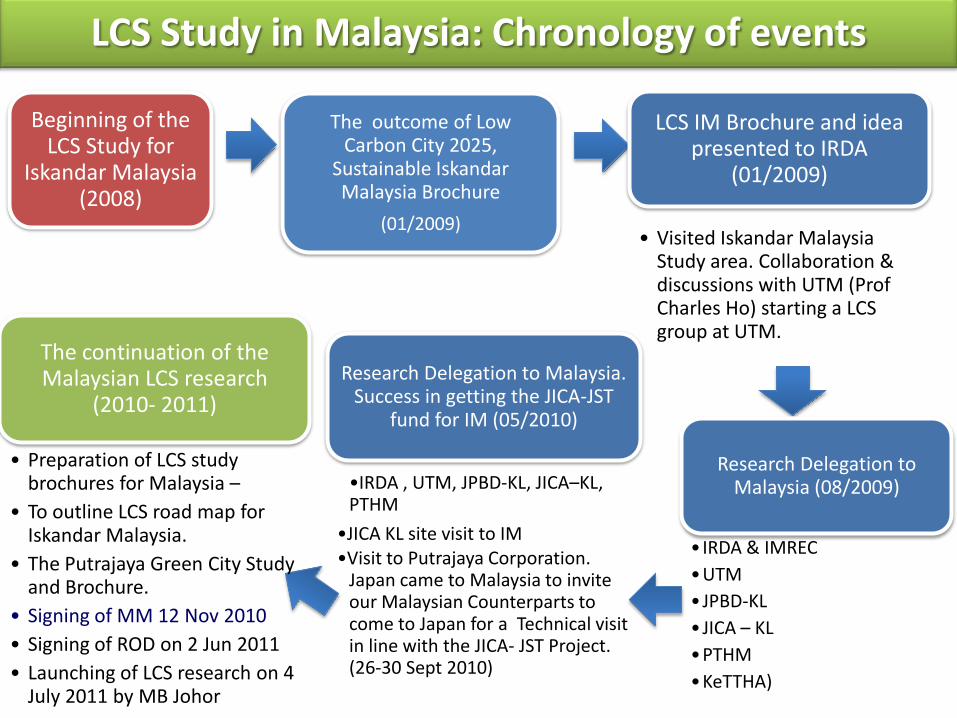
LCS Study in Malaysia: Chronology of events
Beginning of the LCS Study for
Iskandar Malaysia (2008)
The outcome of Low Carbon City 2025,
Sustainable Iskandar Malaysia Brochure
(01/2009)
LCS IM Brochure and idea presented to IRDA
(01/2009)
• Visited Iskandar Malaysia Study area. Collaboration & discussions with UTM (Prof Charles Ho) starting a LCS group at UTM.
Research Delegation to Iskandar Malaysia
Research Delegation to Malaysia (08/2009)
• IRDA & IMREC
•UTM
• JPBD-KL
• JICA – KL
•PTHM
•KeTTHA)
Research Delegation to Malaysia. Success in getting the JICA-JST
fund for IM (05/2010)
•IRDA , UTM, JPBD-KL, JICA–KL, PTHM
•JICA KL site visit to IM•Visit to Putrajaya Corporation.
Japan came to Malaysia to invite our Malaysian Counterparts to come to Japan for a Technical visit in line with the JICA- JST Project. (26-30 Sept 2010)
The continuation of the Malaysian LCS research
(2010- 2011)
• Preparation of LCS study brochures for Malaysia –
• To outline LCS road map for Iskandar Malaysia.
• The Putrajaya Green City Study and Brochure.
• Signing of MM 12 Nov 2010
• Signing of ROD on 2 Jun 2011
• Launching of LCS research on 4 July 2011 by MB Johor
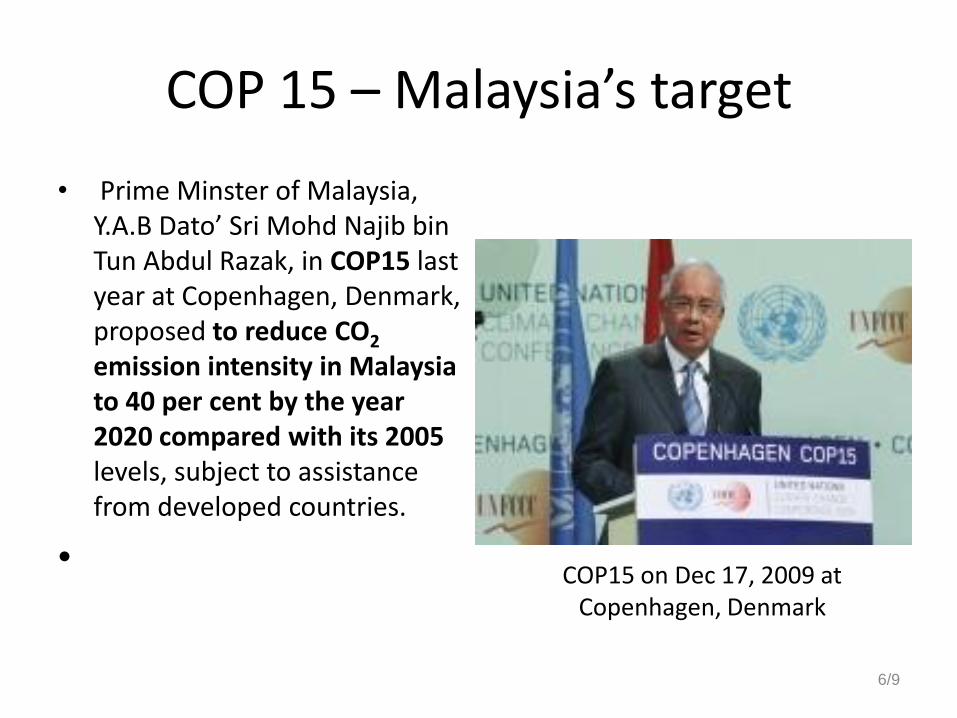
COP 15 – Malaysia’s target
• Prime Minster of Malaysia, Y.A.B Dato’ Sri Mohd Najib bin Tun Abdul Razak, in COP15 last year at Copenhagen, Denmark, proposed to reduce CO2
emission intensity in Malaysia to 40 per cent by the year 2020 compared with its 2005 levels, subject to assistance from developed countries.
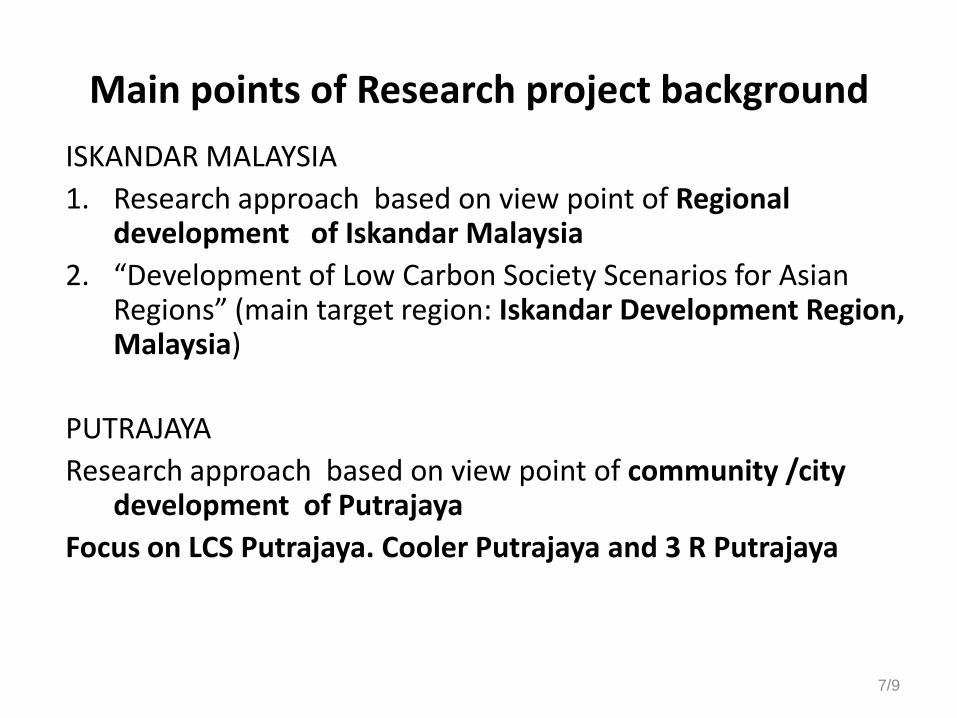
1. Research approach based on view point of Regional development of Iskandar Malaysia
2. “Development of Low Carbon Society Scenarios for Asian Regions” (main target region: Iskandar Development Region, Malaysia)
PUTRAJAYA
Research approach based on view point of community /city development of Putrajaya
Focus on LCS Putrajaya. Cooler Putrajaya and 3 R Putrajaya
7/9
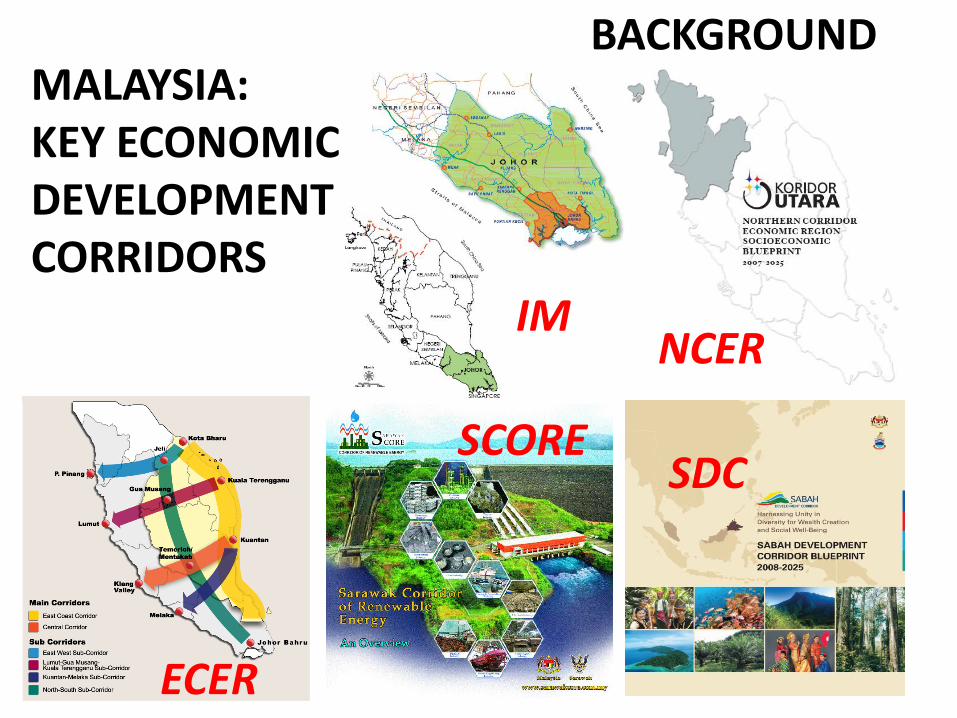
MALAYSIA:KEY ECONOMIC DEVELOPMENT CORRIDORS
IMNCER
ECER
SCORESDC
BACKGROUND
9
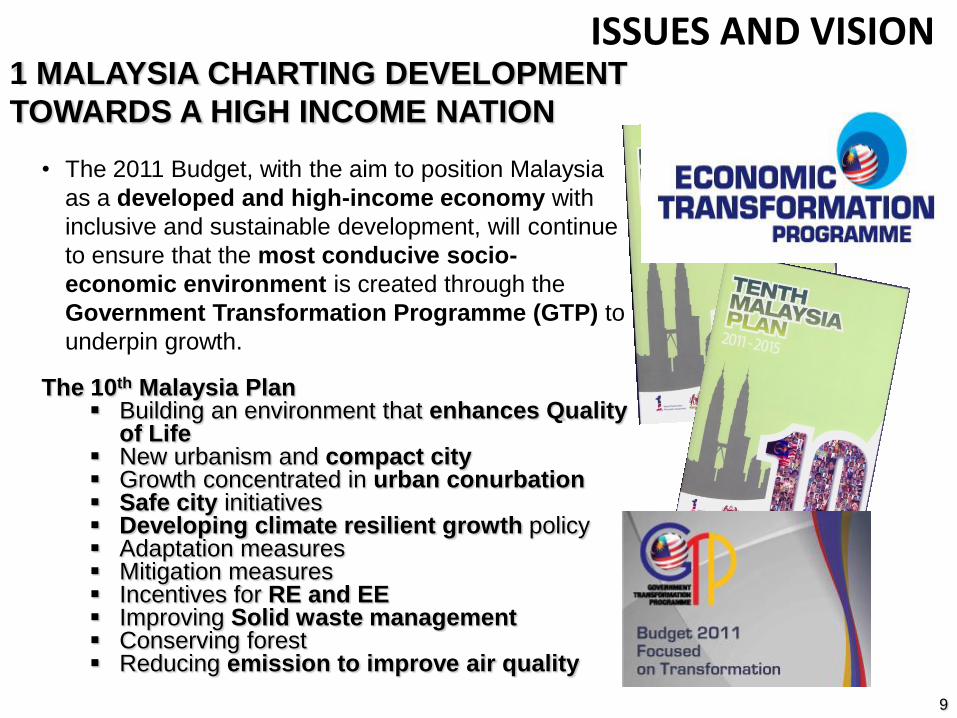
• The 2011 Budget, with the aim to position Malaysia
as a developed and high-income economy with
inclusive and sustainable development, will continue
to ensure that the most conducive socio-
economic environment is created through the
Government Transformation Programme (GTP) to
underpin growth.
The 10th Malaysia Plan Building an environment that enhances Quality
of Life New urbanism and compact city Growth concentrated in urban conurbation Safe city initiatives Developing climate resilient growth policy Adaptation measures Mitigation measures Incentives for RE and EE Improving Solid waste management Conserving forest Reducing emission to improve air quality
1 MALAYSIA CHARTING DEVELOPMENT
TOWARDS A HIGH INCOME NATION
ISSUES AND VISION
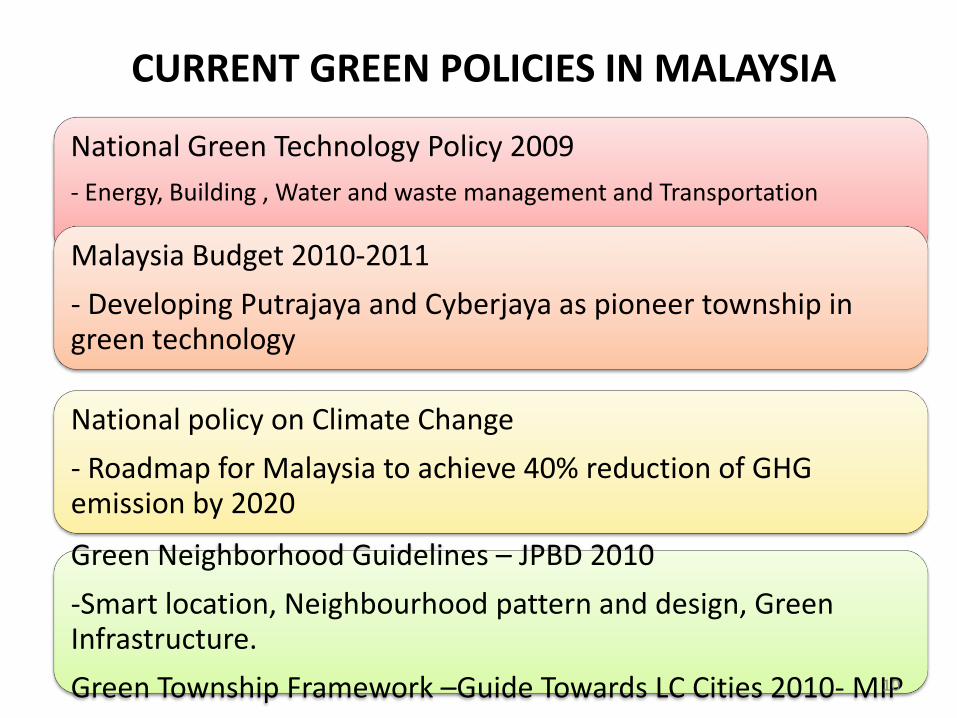
CURRENT GREEN POLICIES IN MALAYSIA
National Green Technology Policy 2009
- Energy, Building , Water and waste management and Transportation
Malaysia Budget 2010-2011
- Developing Putrajaya and Cyberjaya as pioneer township in green technology
National policy on Climate Change
- Roadmap for Malaysia to achieve 40% reduction of GHG emission by 2020
Green Neighborhood Guidelines – JPBD 2010
-Smart location, Neighbourhood pattern and design, Green Infrastructure.
Green Township Framework –Guide Towards LC Cities 2010- MIP10
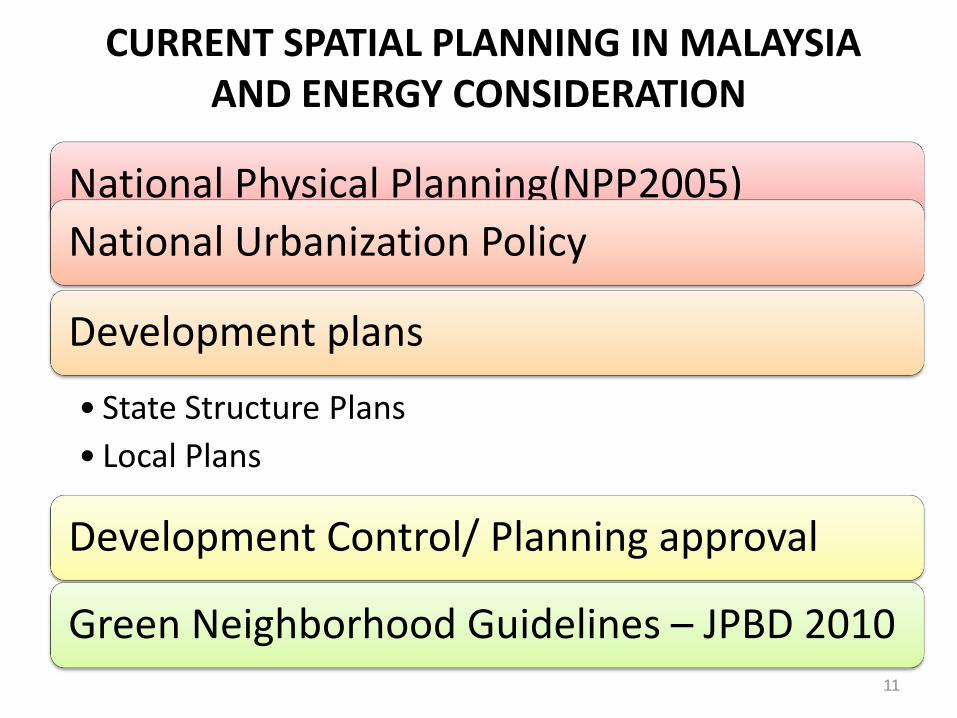
CURRENT SPATIAL PLANNING IN MALAYSIA AND ENERGY CONSIDERATION
National Physical Planning(NPP2005)
National Urbanization Policy
Development plans
• State Structure Plans
• Local Plans
Development Control/ Planning approval
Green Neighborhood Guidelines – JPBD 201011
Iskandar
Development
Region
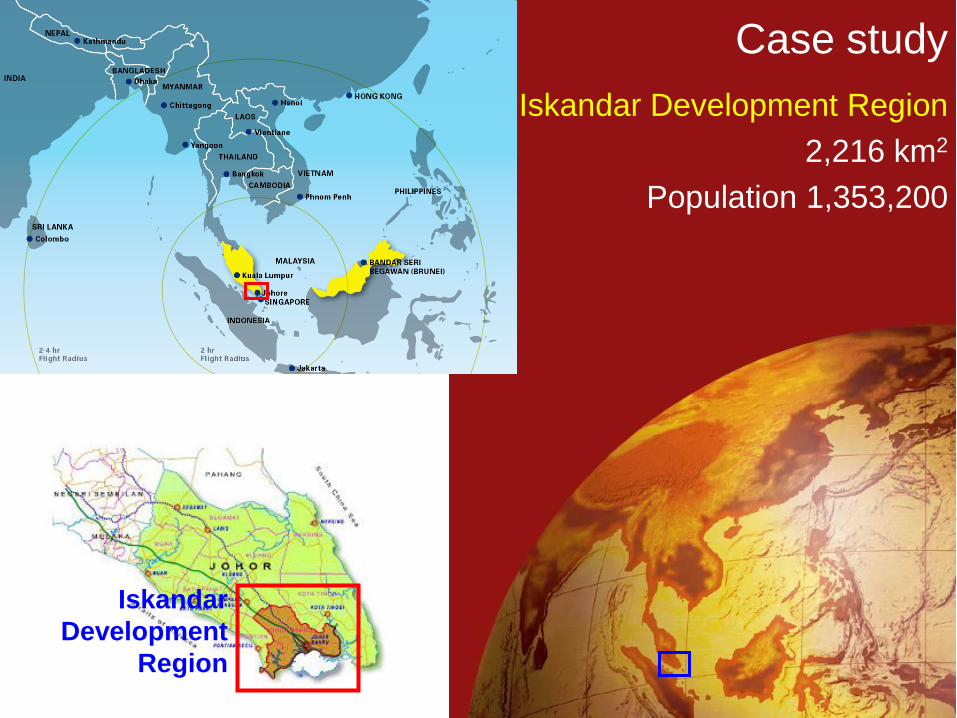
Case study
Iskandar Development Region
2,216 km2
Population 1,353,200
13
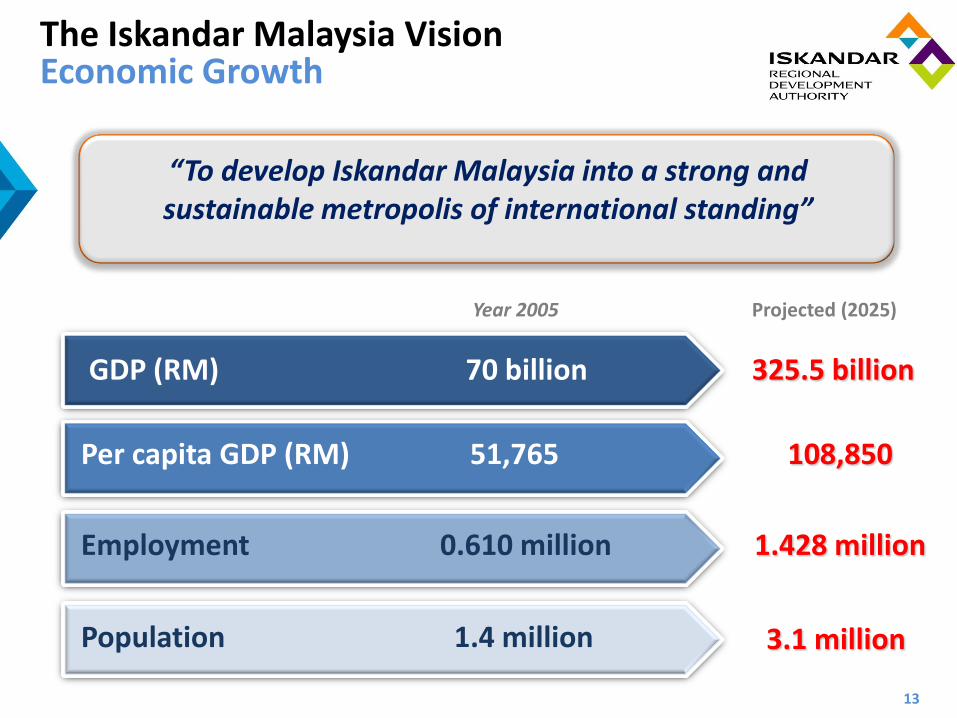
The Iskandar Malaysia VisionEconomic Growth
“To develop Iskandar Malaysia into a strong and sustainable metropolis of international standing”
Population 1.4 million 3.1 million
Per capita GDP (RM) 51,765 108,850
GDP (RM) 70 billion 325.5 billion
Employment 0.610 million 1.428 million
Year 2005 Projected (2025)
232%
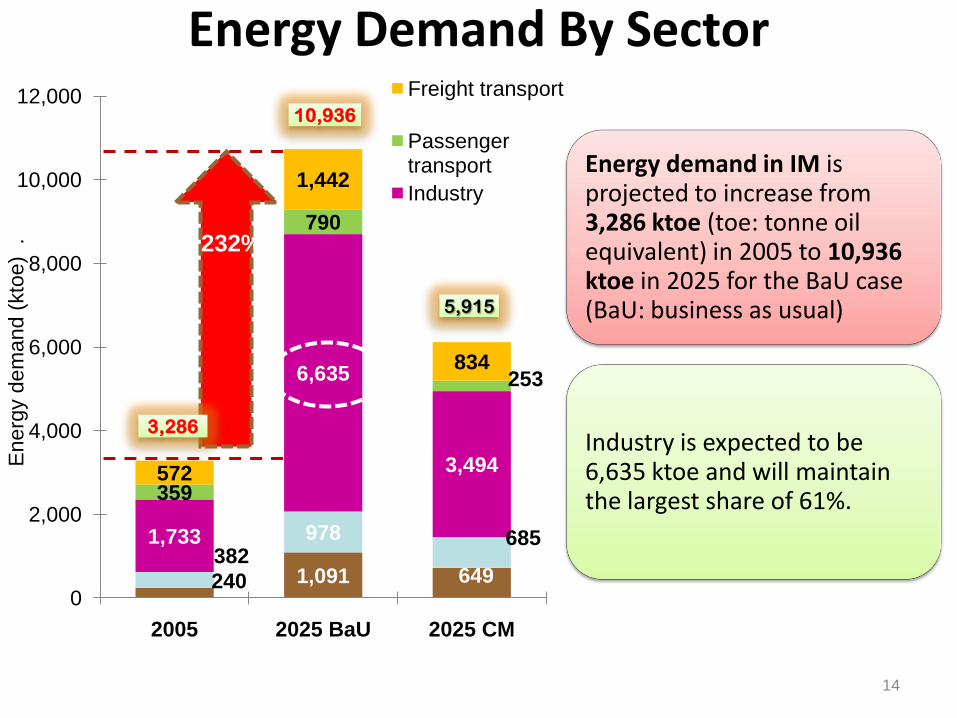
Energy Demand By Sector
Energy demand in IM is projected to increase from 3,286 ktoe (toe: tonne oil equivalent) in 2005 to 10,936 ktoe in 2025 for the BaU case (BaU: business as usual)
Industry is expected to be 6,635 ktoe and will maintain the largest share of 61%.
14
240 1,091 649 382
978 6851,733
6,635
3,494
359
790
253
572
1,442
834
0
2,000
4,000
6,000
8,000
10,000
12,000
2005 2025 BaU 2025 CM
Energ
y d
em
an
d (
kto
e)
.
Freight transport
Passenger transport
Industry
10,936
5,915
3,286
Potential Mitigation in IM
15
12552
45483
19162
4463
10831
777 3510
5521
623
0
5,000
10,000
15,000
20,000
25,000
30,000
35,000
40,000
45,000
50,000
2005 2025 BaU 2025 CM
GH
G e
mis
sio
ns
/re
du
cti
on
s (
kt-
CO
2)
Transport demand management
Fuel shifting
Efficiency improvement (buildings)
Efficiency improvement (transport)
Efficiency improvement (industry)
Efficiency improvement (power sector)
GHG emissions
Em
issio
n R
ed
uctio
ns
57%
262%
52%
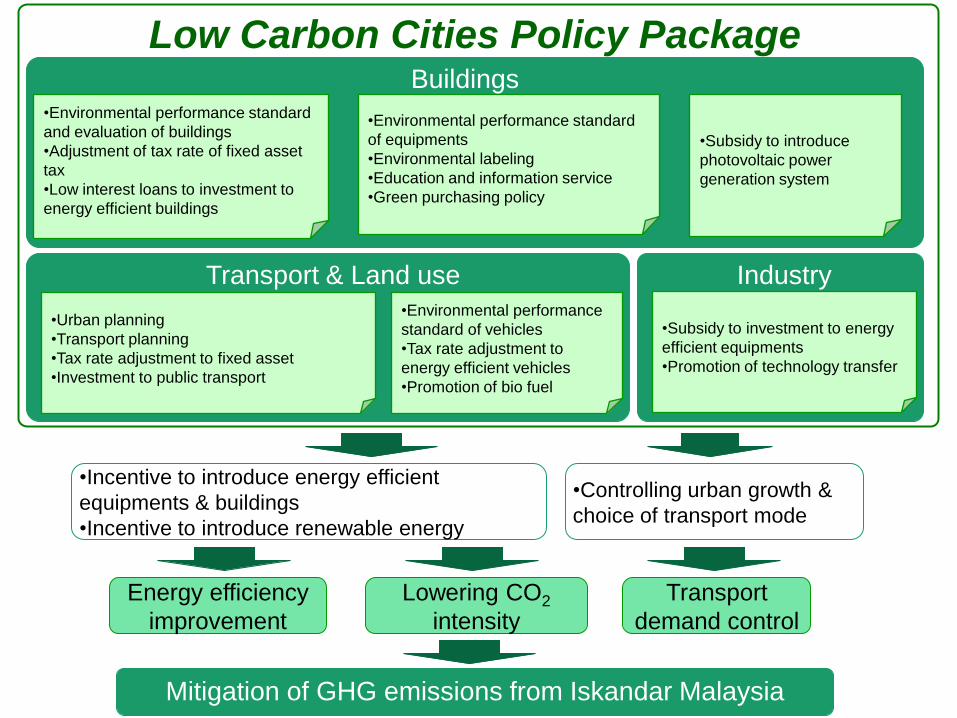
Mitigation of GHG emissions from Iskandar Malaysia
Energy efficiency
improvement
Lowering CO2
intensity
Transport
demand control
•Incentive to introduce energy efficient
equipments & buildings
•Incentive to introduce renewable energy
•Environmental performance standard
and evaluation of buildings
•Adjustment of tax rate of fixed asset
tax
•Low interest loans to investment to
energy efficient buildings
•Environmental performance standard
of equipments
•Environmental labeling
•Education and information service
•Green purchasing policy
•Subsidy to introduce
photovoltaic power
generation system
•Urban planning
•Transport planning
•Tax rate adjustment to fixed asset
•Investment to public transport
•Environmental performance
standard of vehicles
•Tax rate adjustment to
energy efficient vehicles
•Promotion of bio fuel
•Subsidy to investment to energy
efficient equipments
•Promotion of technology transfer
Buildings
Transport & Land use Industry
Low Carbon Cities Policy Package
•Controlling urban growth &
choice of transport mode
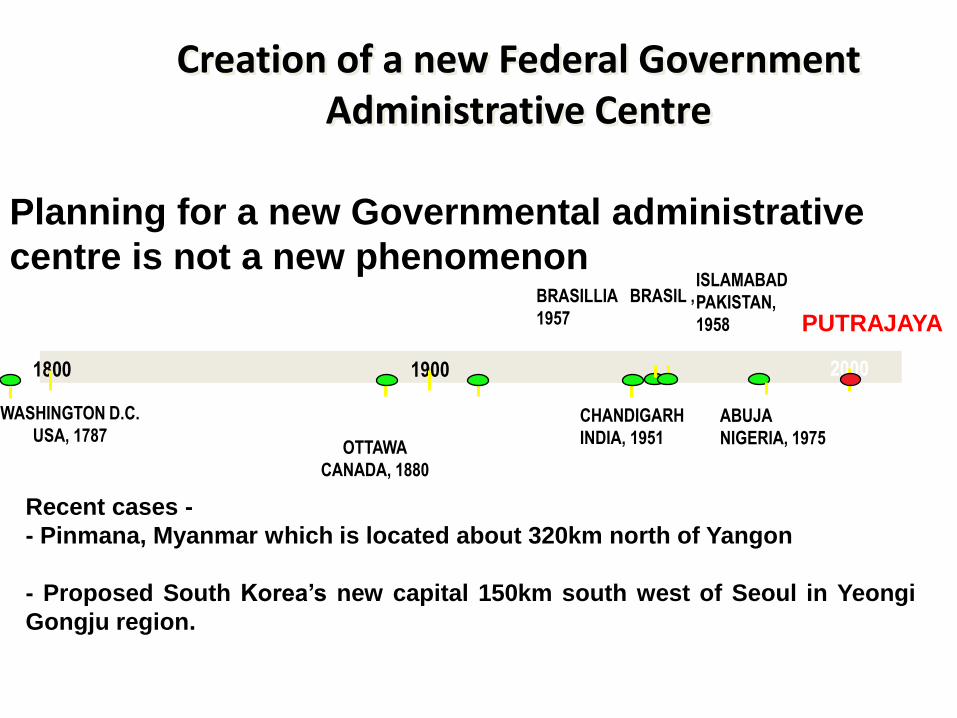
Planning for a new Governmental administrative
centre is not a new phenomenon
WASHINGTON D.C.
USA, 1787OTTAWA
CANADA, 1880
CANBERRA
AUSTRALIA, 1912CHANDIGARH
INDIA, 1951
BRASILLIA BRASIL ,
1957
1800 1900 2000
PUTRAJAYA
ISLAMABAD
PAKISTAN,
1958
ABUJA
NIGERIA, 1975
Creation of a new Federal Government Administrative Centre
Recent cases -
- Pinmana, Myanmar which is located about 320km north of Yangon
- Proposed South Korea’s new capital 150km south west of Seoul in Yeongi
Gongju region.
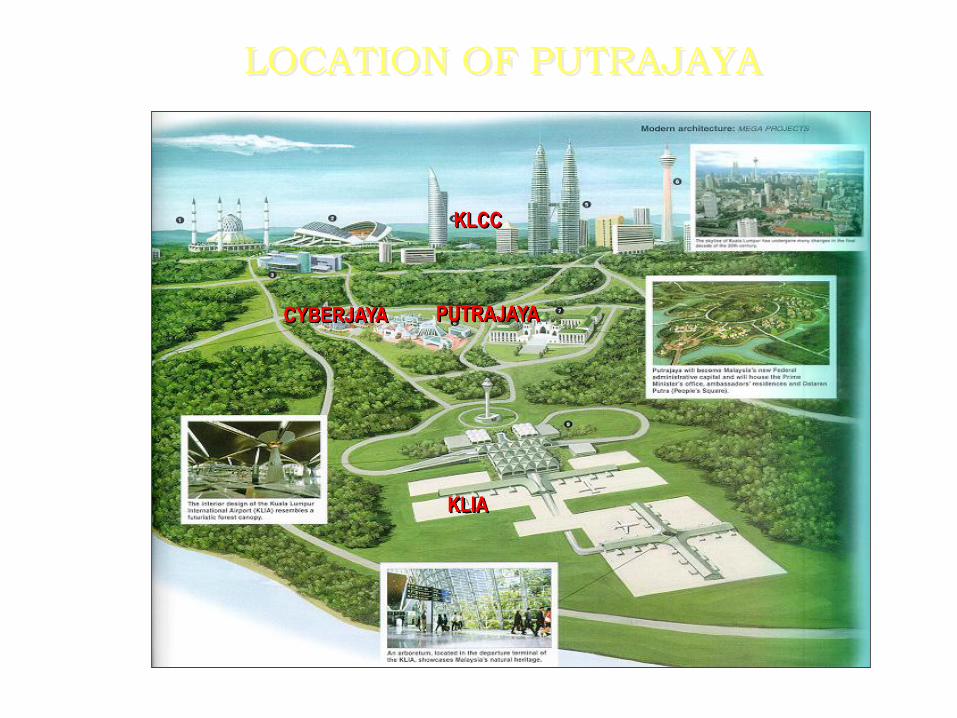
LOCATION OF PUTRAJAYA
PUTRAJAYACYBERJAYA
KLIA
KLCC
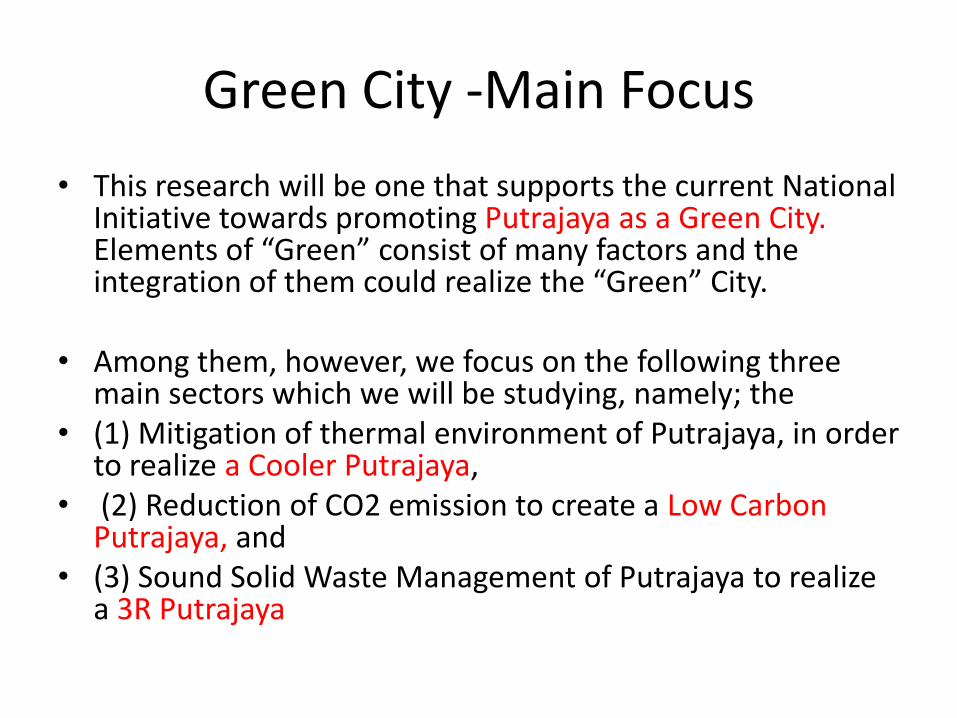
Green City -Main Focus
• This research will be one that supports the current National Initiative towards promoting Putrajaya as a Green City. Elements of “Green” consist of many factors and the integration of them could realize the “Green” City.
• Among them, however, we focus on the following three main sectors which we will be studying, namely; the
• (1) Mitigation of thermal environment of Putrajaya, in order to realize a Cooler Putrajaya,
• (2) Reduction of CO2 emission to create a Low Carbon Putrajaya, and
• (3) Sound Solid Waste Management of Putrajaya to realize a 3R Putrajaya
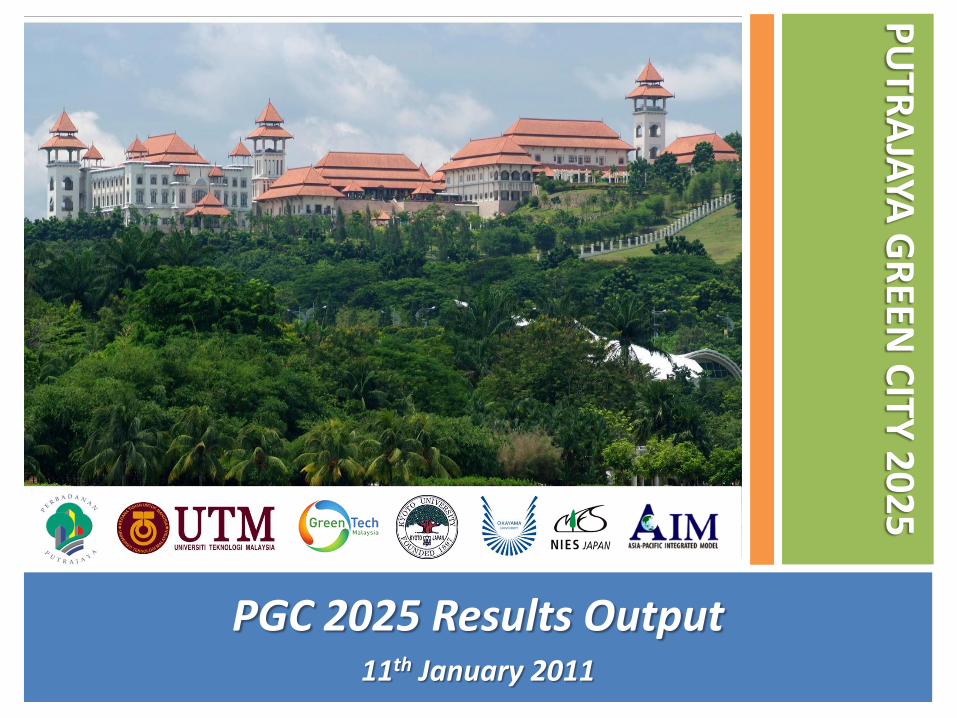
PGC 2025 Results Output11th January 2011
PU
TRA
JAYA
GR
EEN C
ITY 2
02
5
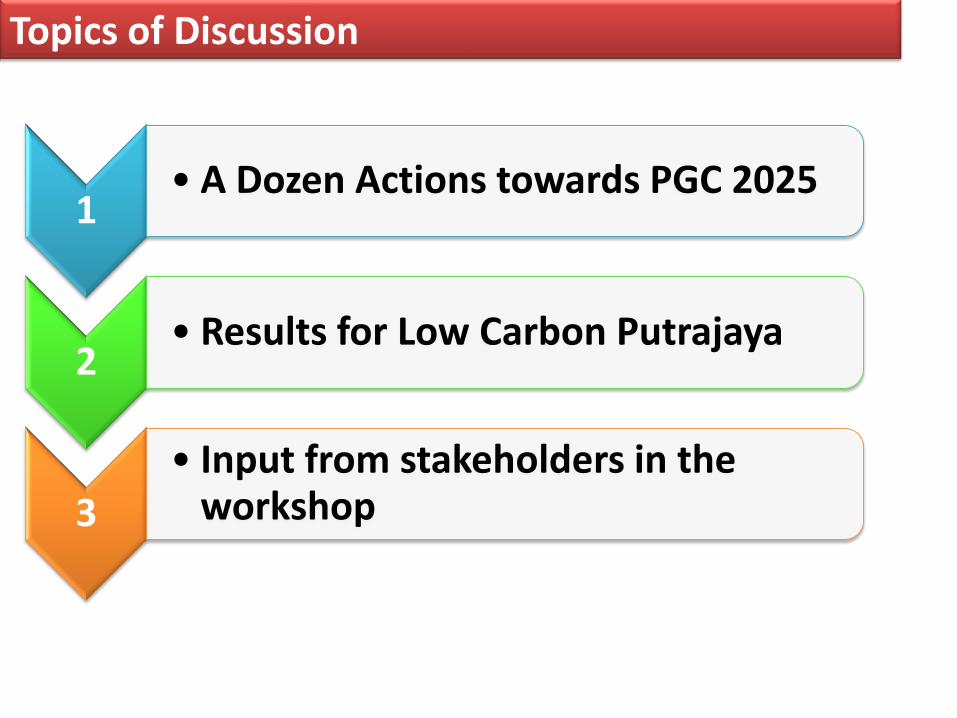
Topics of Discussion
1• A Dozen Actions towards PGC 2025
2• Results for Low Carbon Putrajaya
3
• Input from stakeholders in the workshop
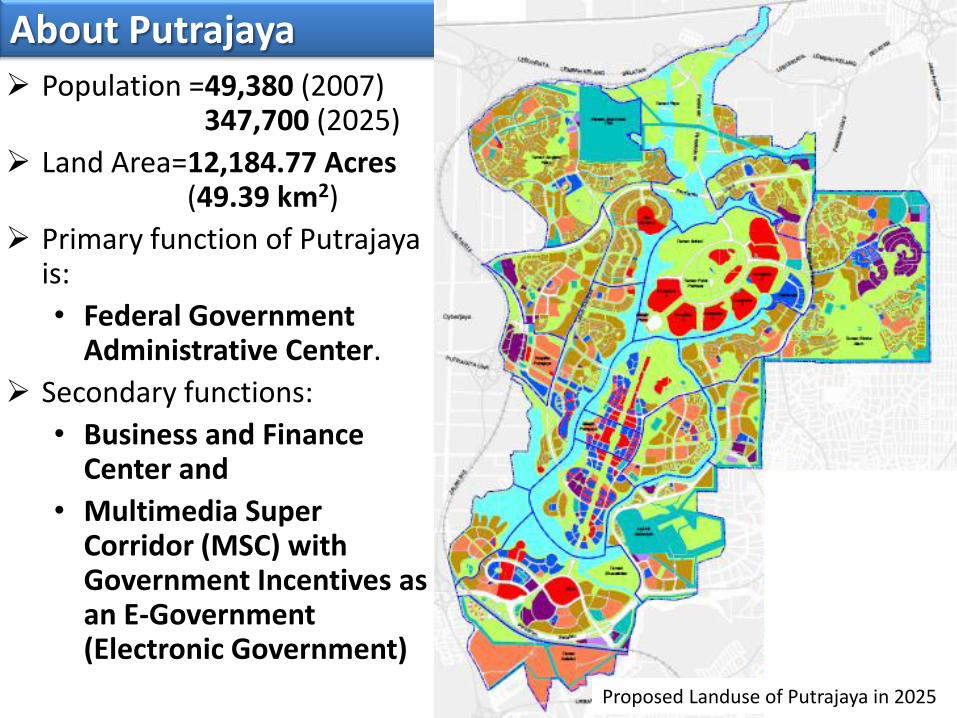
About Putrajaya Population =49,380 (2007)
347,700 (2025)
Land Area=12,184.77 Acres(49.39 km2)
Primary function of Putrajaya is:
• Federal Government Administrative Center.
Secondary functions:
• Business and Finance Center and
• Multimedia Super Corridor (MSC) with Government Incentives as an E-Government (Electronic Government)
Proposed Landuse of Putrajaya in 2025
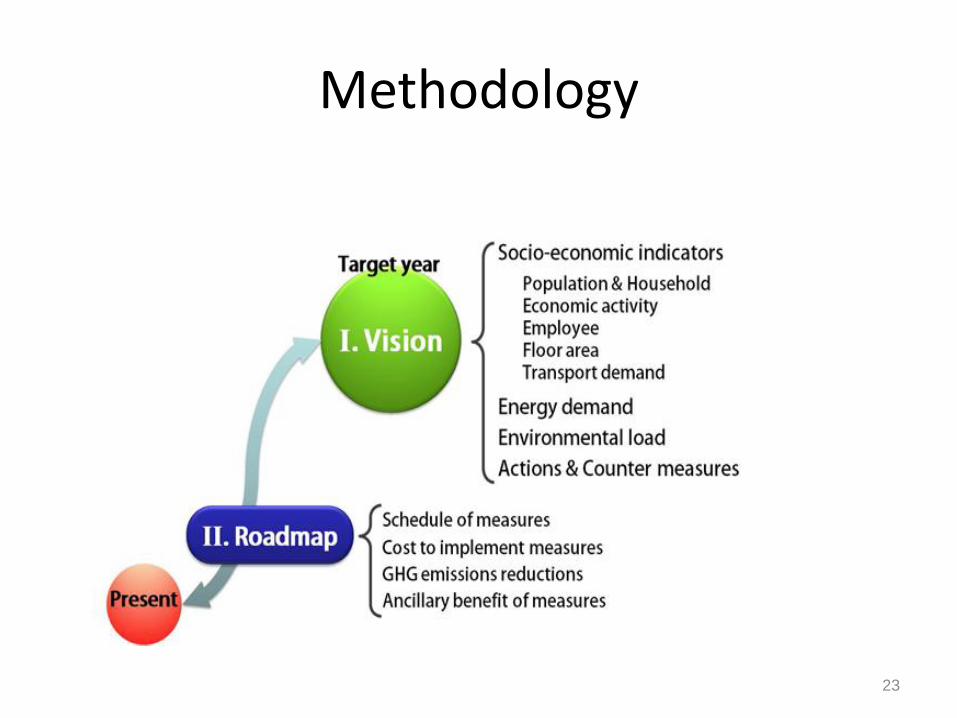
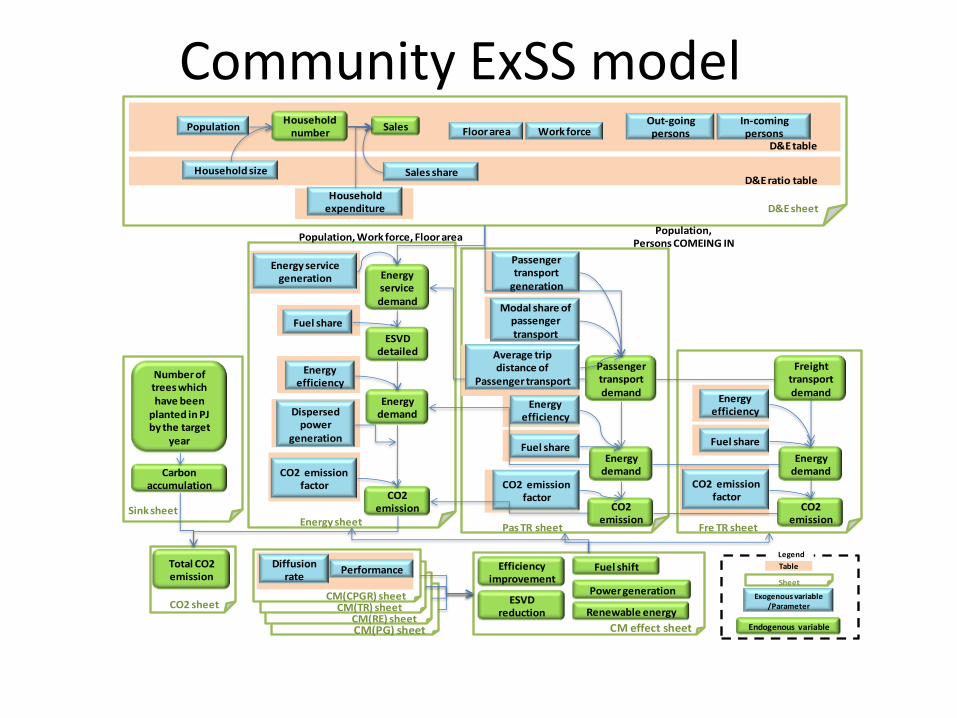
Methodology
23
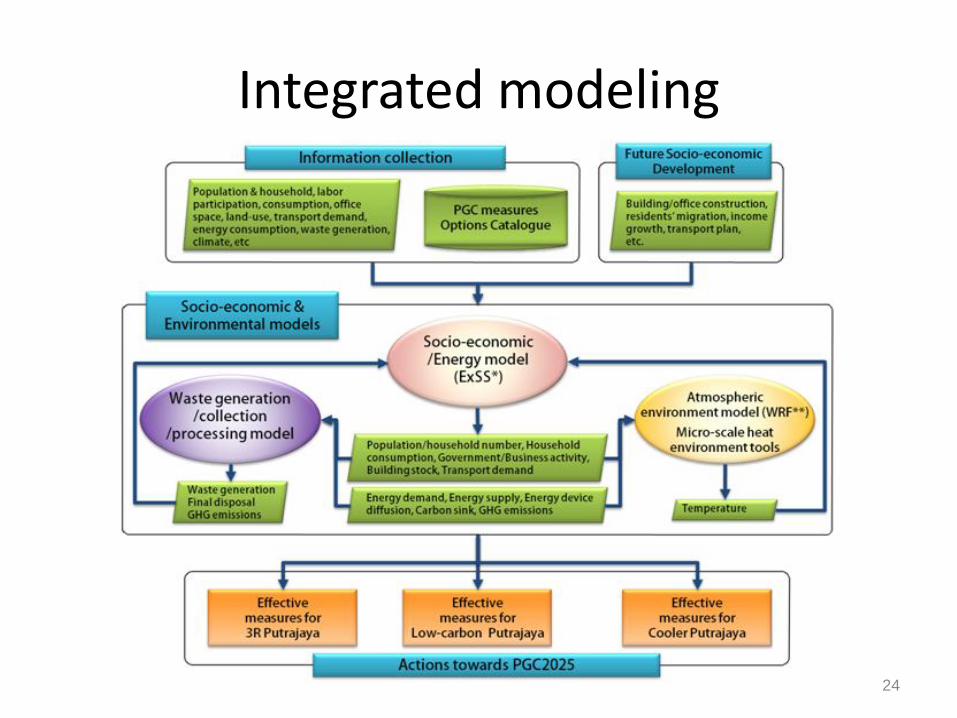
Integrated modeling
24
Community ExSS modelPopulation
Household size
Household number
Household expenditure
Sales
Sales share
Floor area Work force
Energy demand
Passenger transport demand
Energy efficiency
Fuel share
Passenger transport
generation
Modal share of passenger transport
Energy demand
Freight transport demand
Energy efficiency
Fuel share
Population, Work force, Floor areaPopulation,
Persons COMEING IN
Efficiency improvement
ESVD reduction
Power generation
Renewable energy
Fuel shift
Average trip distance of
Passenger transport
D&E sheet
Fre TR sheetPas TR sheetEnergy sheet
D&E ratio table
D&E table
Energy demand
CO2 emission
Energy service demand
Energy efficiency
Fuel share
Energy service generation
CO2 emission factor
Dispersed power
generation
ESVD detailed
Diffusion rate
Performance
In-coming persons
Out-going persons
Carbon accumulation
Total CO2 emission
CO2 sheet
CM effect sheet
Exogenous variable/Parameter
Endogenous variable
Sheet
Table
CM(PG) sheetCM(RE) sheet
CM(TR) sheetCM(CPGR) sheet
CO2 emission
CO2 emission factor
CO2 emission
CO2 emission factor
Number of trees which have been
planted in PJ by the target
year
Sink sheet
Legend
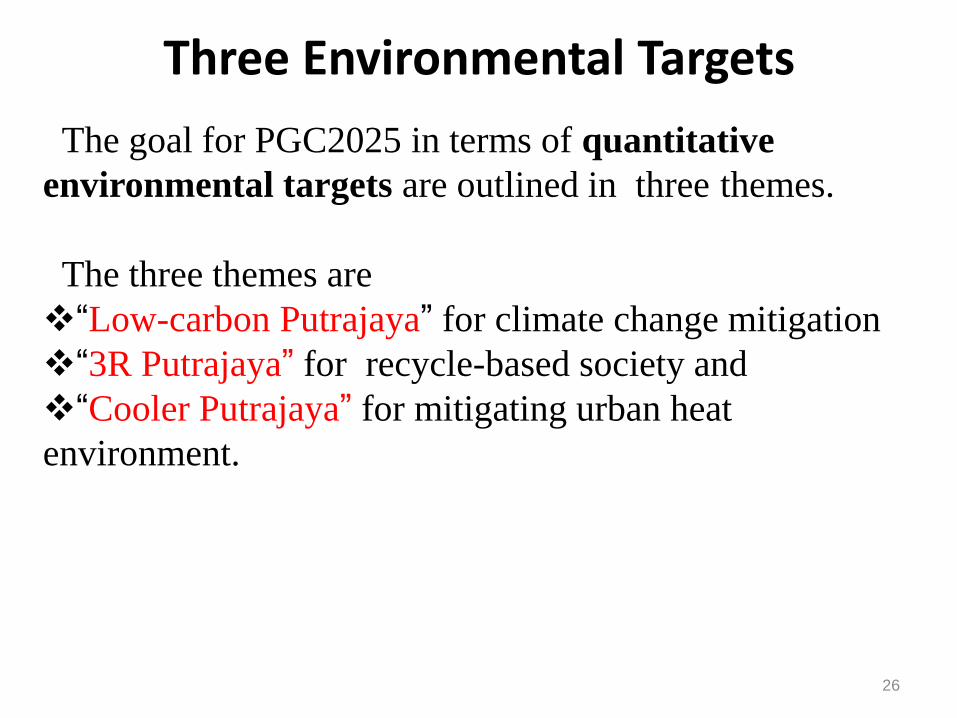
Three Environmental Targets
26
The goal for PGC2025 in terms of quantitative
environmental targets are outlined in three themes.
The three themes are
“Low-carbon Putrajaya” for climate change mitigation
“3R Putrajaya” for recycle-based society and
“Cooler Putrajaya” for mitigating urban heat
environment.
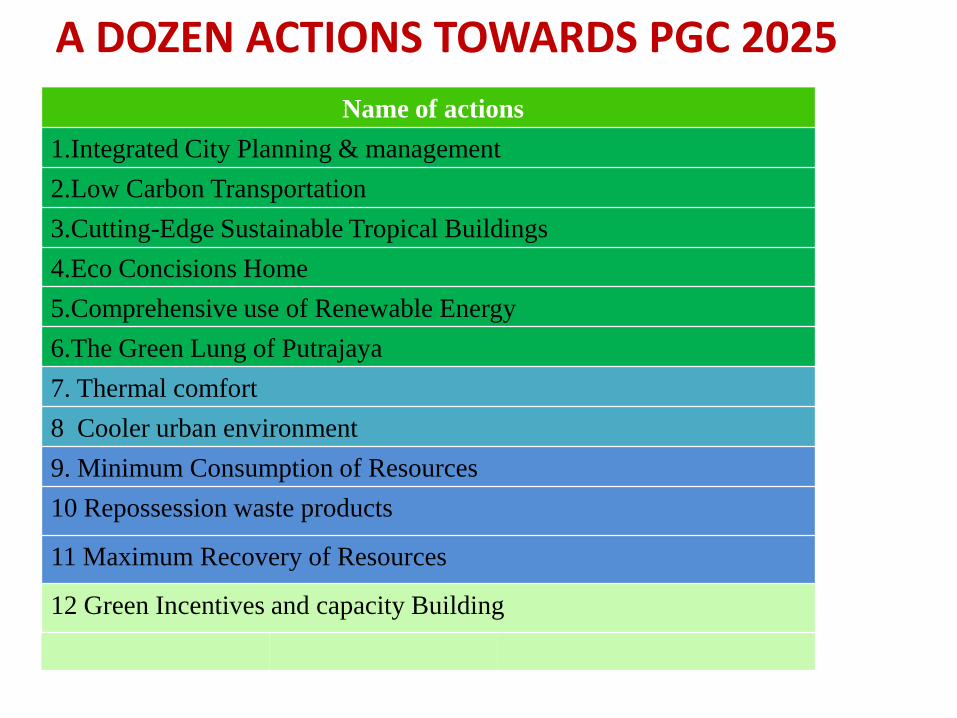
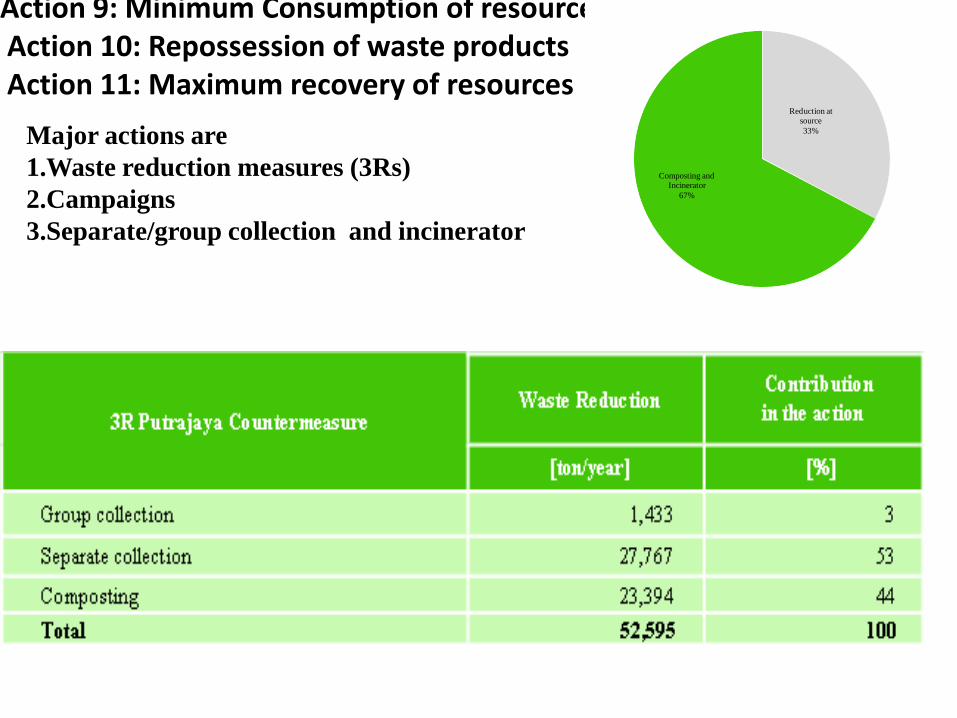
1. A Dozen Actions Towards PGC 2025
A DOZEN ACTIONS TOWARDS PGC 2025
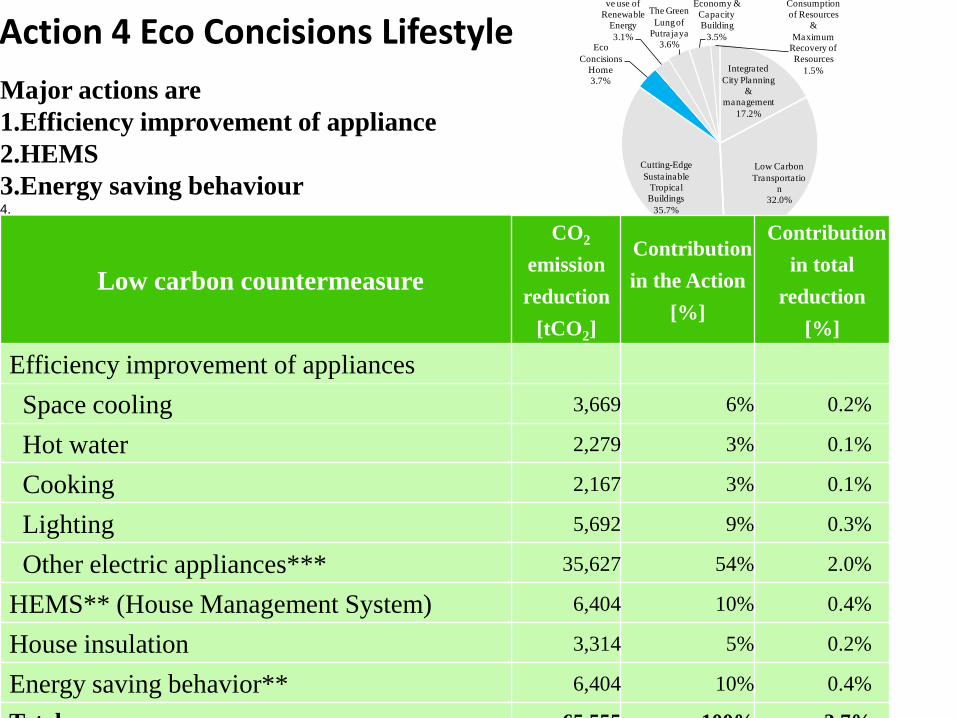
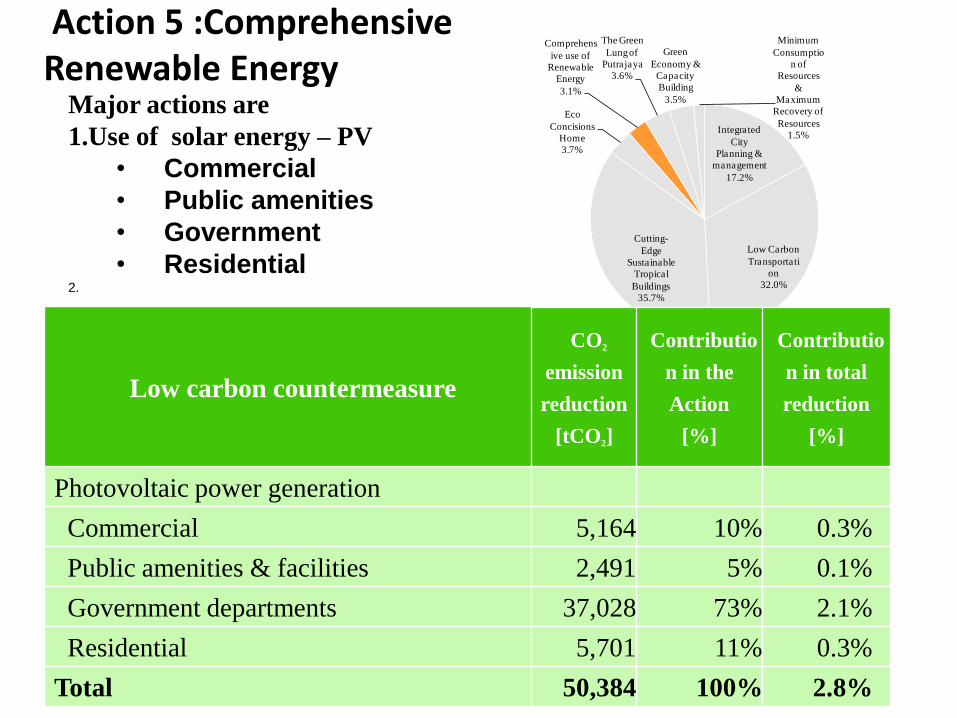
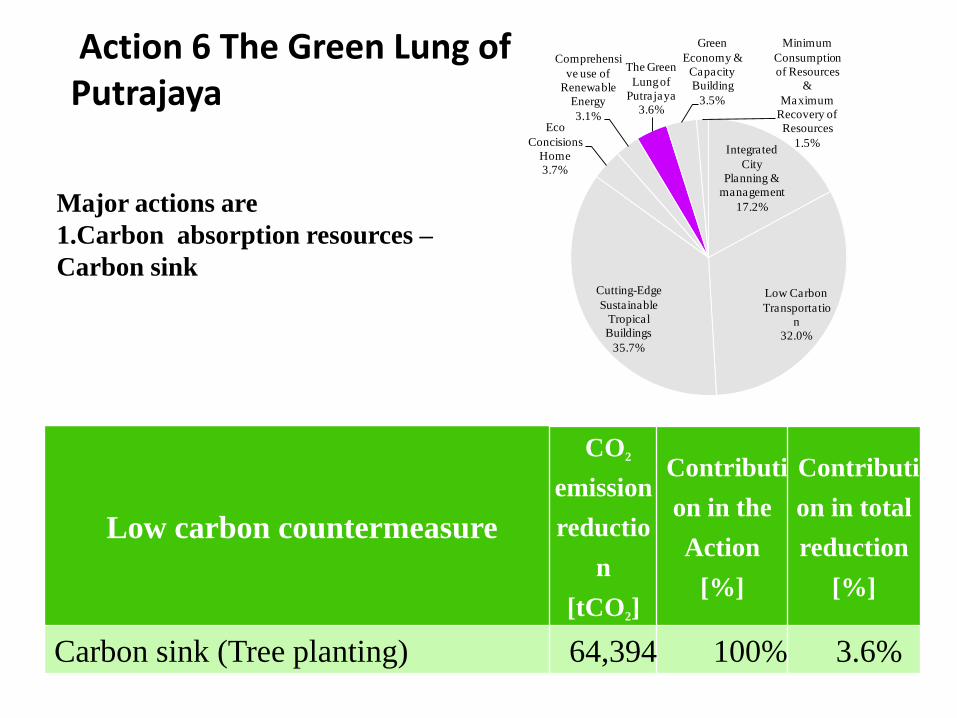
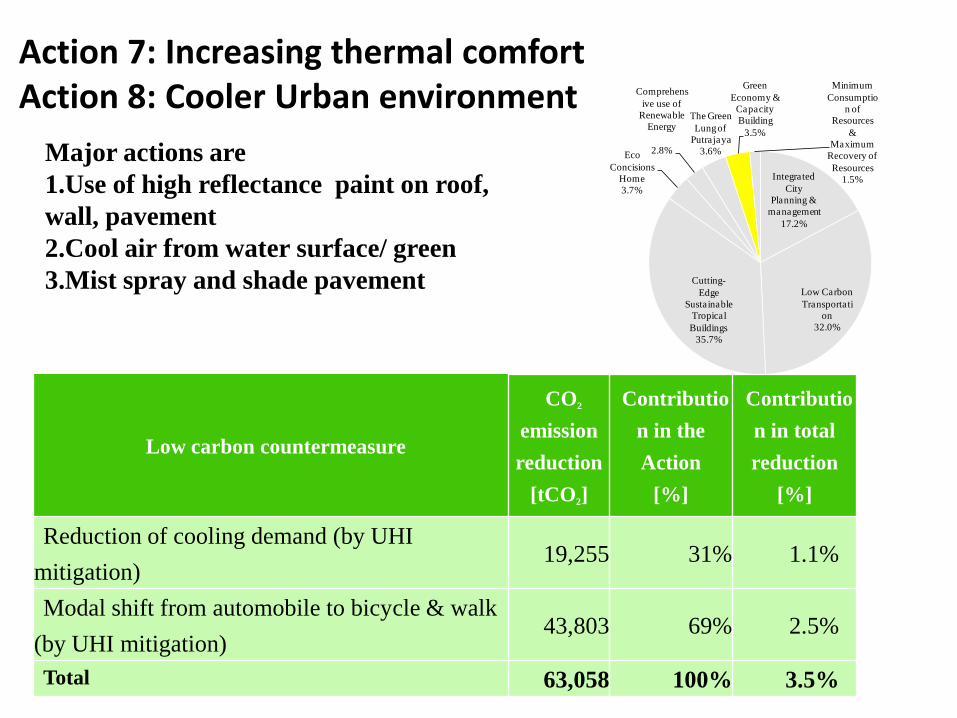
Name of actions
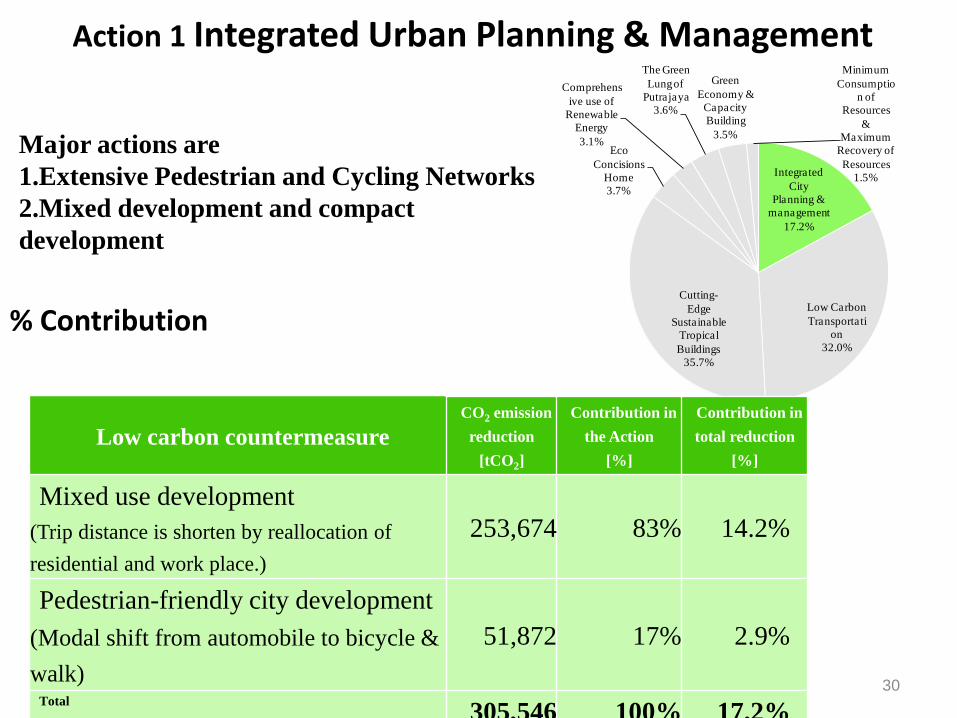
1.Integrated City Planning & management
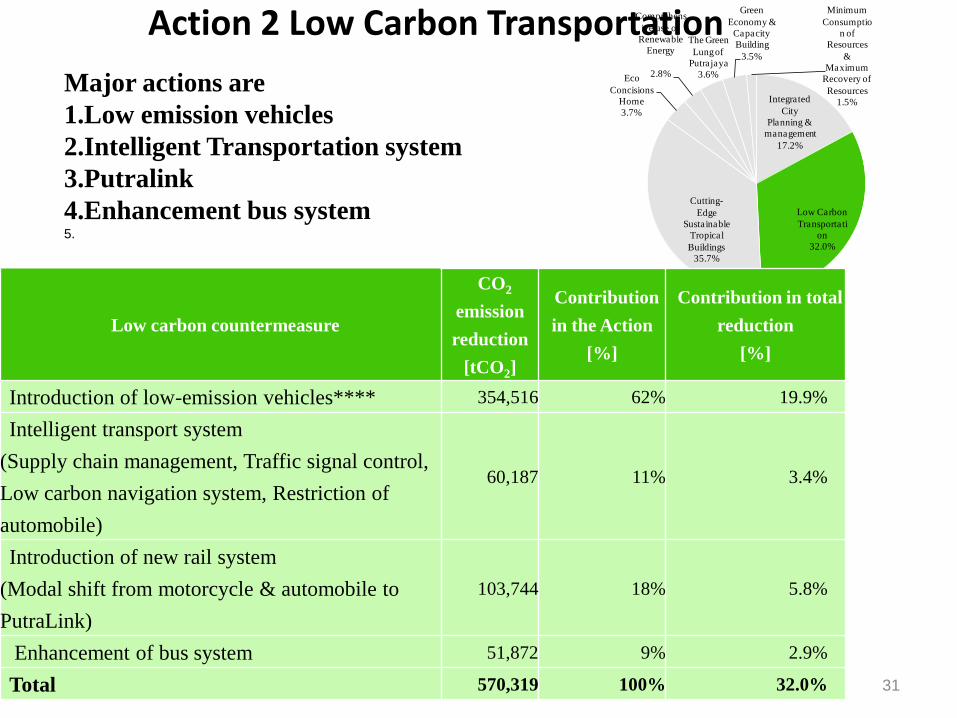
2.Low Carbon Transportation
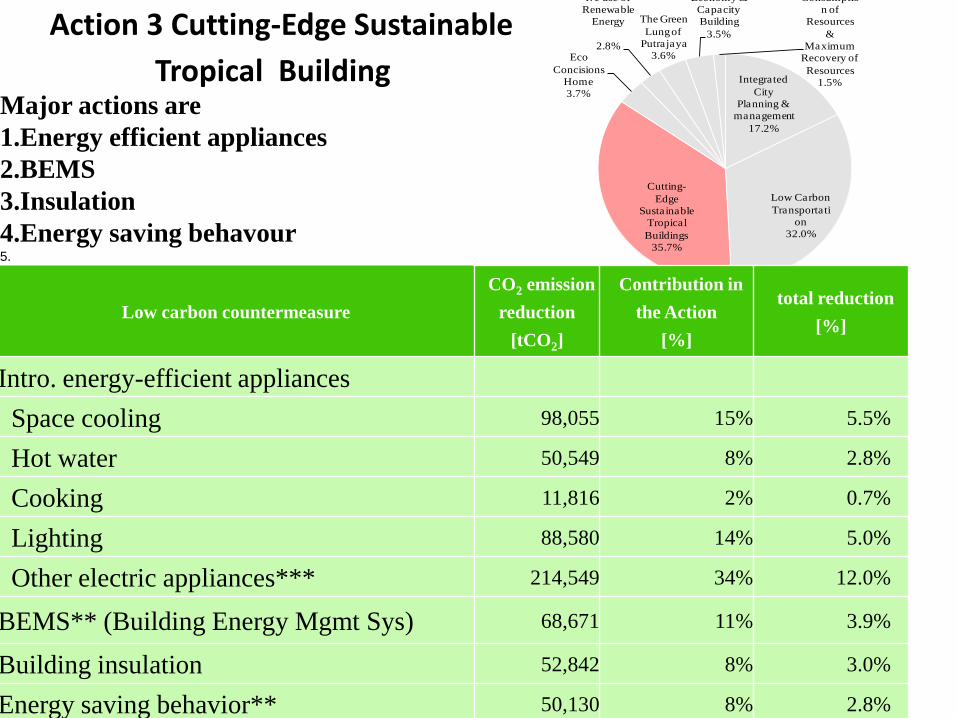
3.Cutting-Edge Sustainable Tropical Buildings
4.Eco Concisions Home
5.Comprehensive use of Renewable Energy
6.The Green Lung of Putrajaya
7. Thermal comfort
8 Cooler urban environment
9. Minimum Consumption of Resources
10 Repossession waste products
11 Maximum Recovery of Resources
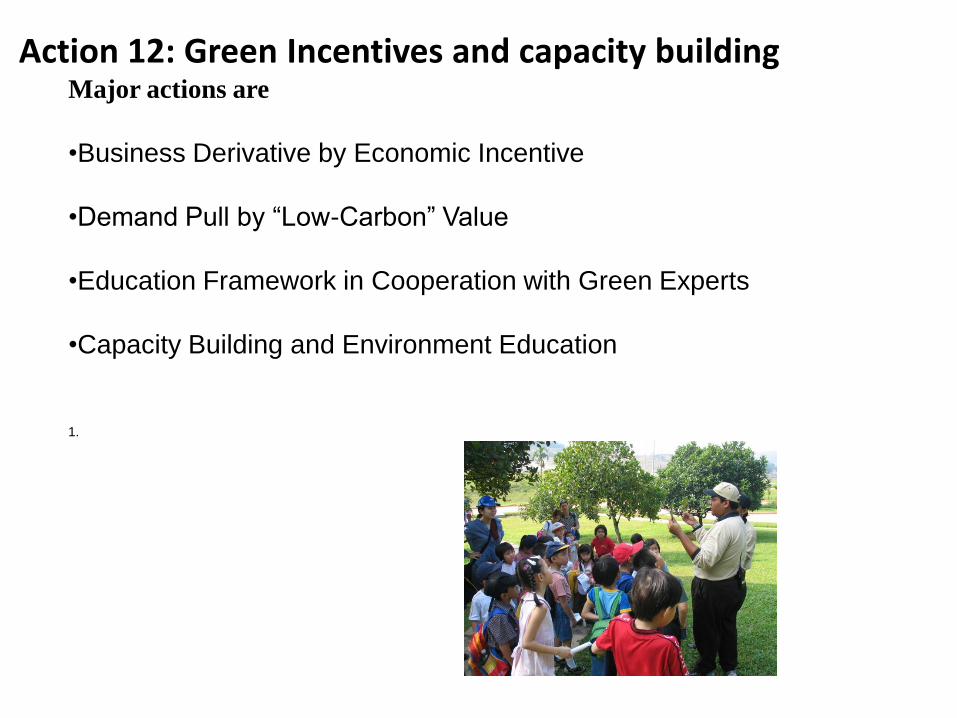
12 Green Incentives and capacity Building
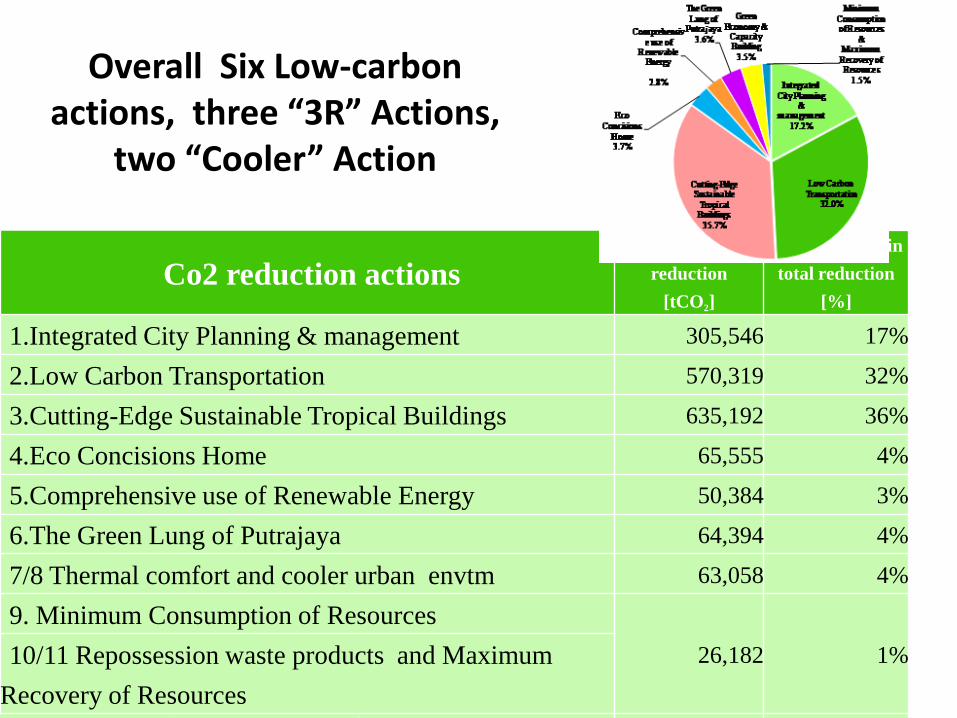
Overall Six Low-carbon actions, three “3R” Actions,
two “Cooler” Action
29
Co2 reduction actionsCO2 emission
reduction
[tCO2]
Contribution in
total reduction
[%]
1.Integrated City Planning & management 305,546 17%