DOCUMENT RESUME ED 417 677 HE 031 133 AUTHOR Kroc, Rick; Howard, Rich; Hull, Pat; Woodard, Doug TITLE Graduation Rates: Do Students' Academic Program Choices Make a Difference? PUB DATE 1997-05-00 NOTE 27p.; Paper presented at the Annual Forum of the Association for Institutional Research (37th, Orlando, FL, May, 1997). PUB TYPE Reports Research (143) -- Speeches/Meeting Papers (150) EDRS PRICE MF01/PCO2 Plus Postage. DESCRIPTORS College Freshmen; *Course Selection (Students); Decision Making; Diversity (Institutional); *Graduation; Higher Education; Land Grant Universities; *Majors (Students); Prediction; Predictor Variables; Research Universities; State Universities; *Student Characteristics; *Time to Degree IDENTIFIERS Scholastic Assessment Tests ABSTRACT This study looked at the relationship between the programs students chose upon college entry, the programs from which they graduated, and the time taken to graduate. Individual student data on more than 204,000 freshmen entering 38 public, land grant, and Research I universities in 1988 and 1990 were collected. Descriptive statistics were used to summarize student entry characteristics such as college admission test scores and high school grade point averages. Logistic analysis was used to calculate and compare predicted and actual graduation rates based on student entry characteristics. Among findings were: graduation rates varied more by university than by program; time to completion varied by academic prograth; business and social sciences were the program areas which experienced the largest in-migration from other areas; students entering education programs had the lowest average Scholastic Assessment Test scores whereas engineering students had the highest; students initially undecided about their major were no less likely to graduate than other students and their graduation was not delayed; there was a correlation of about .28 between actual and predicted graduation rates; and there were significant differences among institutions between actual graduation rates and predicted graduation rates. Tables provide detailed findings for each institutions. (DB) ******************************************************************************** Reproductions supplied by EDRS are the best that can be made from the original document. ********************************************************************************
Transcript
DOCUMENT RESUME
ED 417 677 HE 031 133
AUTHOR Kroc, Rick; Howard, Rich; Hull, Pat; Woodard, DougTITLE Graduation Rates: Do Students' Academic Program Choices Make
a Difference?PUB DATE 1997-05-00NOTE 27p.; Paper presented at the Annual Forum of the Association
for Institutional Research (37th, Orlando, FL, May, 1997).PUB TYPE Reports Research (143) -- Speeches/Meeting Papers (150)EDRS PRICE MF01/PCO2 Plus Postage.DESCRIPTORS College Freshmen; *Course Selection (Students); Decision
Making; Diversity (Institutional); *Graduation; HigherEducation; Land Grant Universities; *Majors (Students);Prediction; Predictor Variables; Research Universities;State Universities; *Student Characteristics; *Time toDegree
IDENTIFIERS Scholastic Assessment Tests
ABSTRACTThis study looked at the relationship between the programs
students chose upon college entry, the programs from which they graduated,and the time taken to graduate. Individual student data on more than 204,000freshmen entering 38 public, land grant, and Research I universities in 1988and 1990 were collected. Descriptive statistics were used to summarizestudent entry characteristics such as college admission test scores and highschool grade point averages. Logistic analysis was used to calculate andcompare predicted and actual graduation rates based on student entrycharacteristics. Among findings were: graduation rates varied more byuniversity than by program; time to completion varied by academic prograth;business and social sciences were the program areas which experienced thelargest in-migration from other areas; students entering education programshad the lowest average Scholastic Assessment Test scores whereas engineeringstudents had the highest; students initially undecided about their major wereno less likely to graduate than other students and their graduation was notdelayed; there was a correlation of about .28 between actual and predictedgraduation rates; and there were significant differences among institutionsbetween actual graduation rates and predicted graduation rates. Tablesprovide detailed findings for each institutions. (DB)
GRADUATION RATES: DO STUDENTS'ACADEMIC PROGRAM CHOICES MAKE A
DIFFERENCE?
Rick KrocUniversity of Arizona
Rich HowardMontana State
University
Doug WoodardUniversity of Arizona
BEST COPY AVAILABLE
Pat HullResearch Consultant
Association for Institutional Research ForumOrlando 1997
U.S. DEPARTMENT OF EDUCATIONOffice of Educational Research and Improvement
EDUCATIONAL RESOURCES INFORMATIONCENTER (ERIC)
fWThis document has been reproduced asreceived from the person or organizationoriginating it.
Minor changes have been made toimprove reproduction quality.
Points of view or opinions stated in thisdocument do not necessarily representofficial OERI position or policy.
PERMISSION TO REPRODUCE ANDDISSEMINATE THIS MATERIAL HAS
BEEN GRANTED BY
Rick Kroc
TO THE EDUCATIONAL RESOURCESINFORMATION CENTER (ERIC)
GRADUATION RATES: DO STUDENTS' ACADEMICPROGRAM CHOICES MAKE A DIFFERENCE?
Introduction
In this paper, the results of the second phase of a multi-phase study whichattempts to look at the graduation rates of first-time, full-time freshmen at publicland-grant and research universities are discussed. At the Boston Forum in1995, the authors of this paper presented the results of the first phase of thestudy. In fact, two papers were presented that year about the study. In one, themethodology used to collect the data was outlined. In the second (Kroc,Woodard, Howard and Hull, 1995), the results of Phase I were presented anddiscussed. As background for this study, the two papers presented in 1995 willbe reviewed, since they form the foundation for this paper.
An important component of the study was the methodology used to create thedata base. Specifically, all public land-grant and research universities wereinvited to participate in the study. Each institution was asked to send unit recordfiles of their entering 1988 freshman class. Using IPEDS definitions for first-time, full-time freshmen, records were created for each student, which includedhigh school GPA, SAT or ACT scores, gender, ethnicity, class rank, residency,four and five year graduation and persistence status. The files were builtaccording to a format defined by the authors. These files were then sent to theauthors' university using either FTP or e-mail as the method of transfer. Thefiles from each of the participating institutions were then merged to form a filewith over 160,000 records from some fifty-three institutions. A program waswritten that edited the files as they came into the server at the authors'institution. At no time in the building of this large data base did the authors haveto clean or modify any of the data by hand, cutting down significantly datacleanup procedures usually necessary before analysis can begin. Thesuccessful transfer of large data bases and the subsequent building of a verylarge data base using technology found on virtually all campuses hasimplications for data exchanges among institutions and reporting in general.
The initial research drew on the work of Astin (1993) in which the predictabilityof graduation rates was examined in relation to students' entry characteristics.In the first paper, the authors replicated Astin's work, specifically for land-grantresearch universities. Student characteristics were regressed on graduationrates to produce a predicted graduation rate for each of the institutions in thestudy, which was then compared to the actual rate. In this analysis, the database was composed of some 130,000 student records from 44 universities.Graduation and persistence rates (four and five year) were estimated, usinghigh school GPA, SAT or ACT scores, gender, and ethnicity.
3BEST COPY AVAILABLE
Comparison of the results of Astin's prediction equation and the equationderived from the analysis described above revealed that whereas Astinobtained the strongest correlation with four year graduation rates (R=.34), ourbest results were obtained using five year rates (R=.32). The Astin equationover predicted four year graduation rates for 93% of the universities in thesample. However, prediction of four year graduation and persistence rateswere essentially equivalent for both equations. These results raise questionsabout the use of Astin's equation in predicting graduation rates for land-grant,research universities.
A second analysis compared the efficiency of logistic regression equations andlinear regression (the methodology used in the above analyses). In contrast toother reported findings (Dey and Astin, 1993), in each instance, logisticregression performed better than linear regression. Residual analysis showeda better fit, particularly at the extremes. Sixty-eight percent of the universitieshad a closer fit between their actual and predicted rates using a logisticregression model. This analysis indicated that, although it adds to thecomplexity to the analysis and the interpretation, logistic regression may bebetter than linear regression for predicting graduation rates.
A third analysis was conducted to examine the impact of university levelvariables on the ability to predict graduation rates. Some twenty-two variableswere identified for inclusion in the study. Because of the number of variablesand their disparate nature, factor analysis was used to simplify the data. Usingan orthogonal rotation, six primary factors were identified from the twenty-twovariables. Adding factor scores from this analysis to the student backgroundvariables improved the prediction of graduation rates somewhat. The overalllogistic regression equation correctly predicted 70.2% of the students'graduation status, with the correlation between predicted and actual rates ofgraduation being .35. Fifty-eight percent of the university graduation rates weremore accurately predicted using both student and institutional variables thanwith only student variables.
Methodology
In this part of our study, Phase II, we were interested in gathering data fromLand Grant, Research I and AAU universities updated with a more recent cohort(1990) and including information about the program students chose upon entryand the program from which they graduated. CIP codes, which all universitiesuse for federal IPEDS reporting, were gathered from each participatinguniversity. This database enabled us to update our previous findings and toextend our research by analyzing program level information. We answered aseries of questions about graduation rates both at the university and programlevels, as detailed in the results section below.
2 4
Two approaches were used. First, descriptive statistics were used to tabulateand summarize the data from a variety of perspectives. Understanding the datain a simple manner is both important in its own right and essential beforeproceeding to more sophisticated analyses. To simplify the data, ACT scoreswere converted to the SAT scale using ETS concordance tables (SAT scoresare on the old scale, not recentered). Also, we converted high school classranks to high school grade point averages for those universities that had onlyranks by using a concordance table we developed from data in this study usinga method developed by Chisholm (1993).
Second, based on student entry characteristics, we calculated and comparedpredicted and actual graduation rates using logistic regression. This extensionof Astin's work (Astin, 1993; Dey and Astin, 1994) provided performanceindicators by calculating predicted graduation rates against which actual rateswere compared. The independent variables were high school grade pointaverage, SAT score, sex, ethnicity and domicile; the dependent variable waswhether the student had graduated after five years. This analysis was doneboth at the program and university levels. We plan to use the results of thisanalysis to identify universities with much higher than predicted rates inparticular academic disciplines for future qualitative study.
Results
Descriptive Statistics
What were the summary statistics for the study?
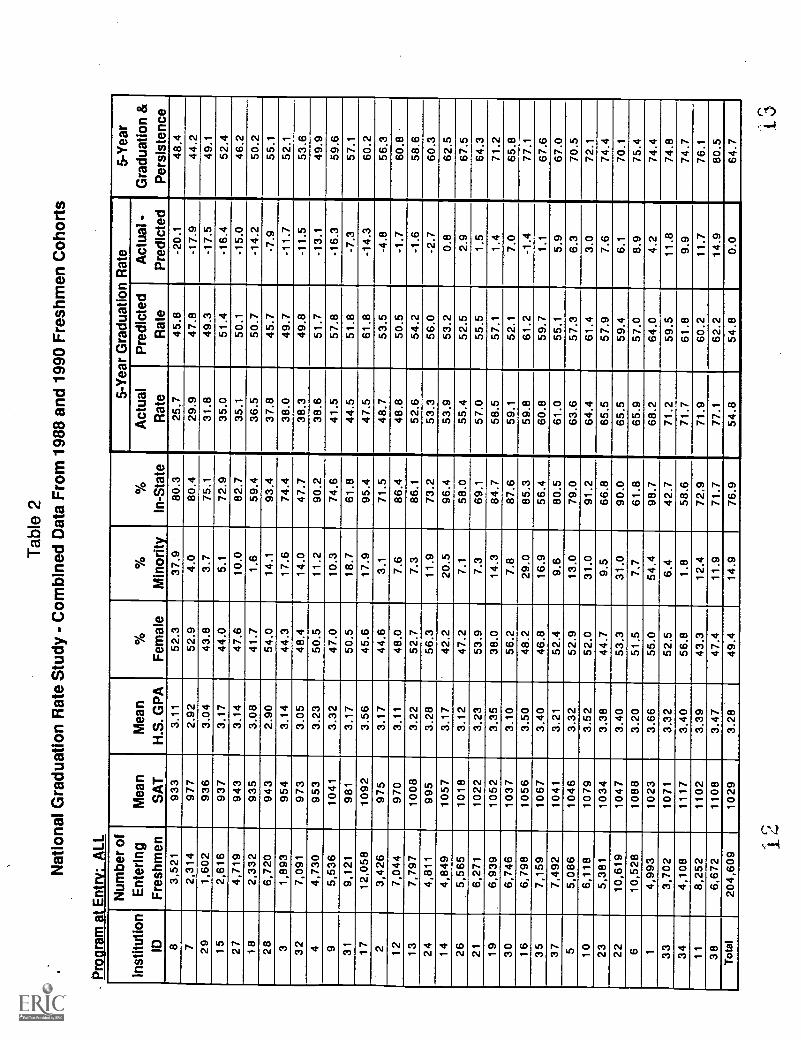
Individual student data was collected on more than 204,000 freshmen entering38 public, land grant, Research I universities in 1988 and 1990. Table 1provides a list of the participating universities. As shown in Table 2 (sorted bygraduation rate), the five year graduation rate for all of the students was 54.8%with an additional 9.9% still enrolled but not yet graduated. The mean SATscore was 1029; mean high school grade point average was 3.28; 49.4% werefemale; 14.9% were minority; and in-state residents made up 76.9% of thefreshmen.
Did graduation rates vary by academic program and by university?
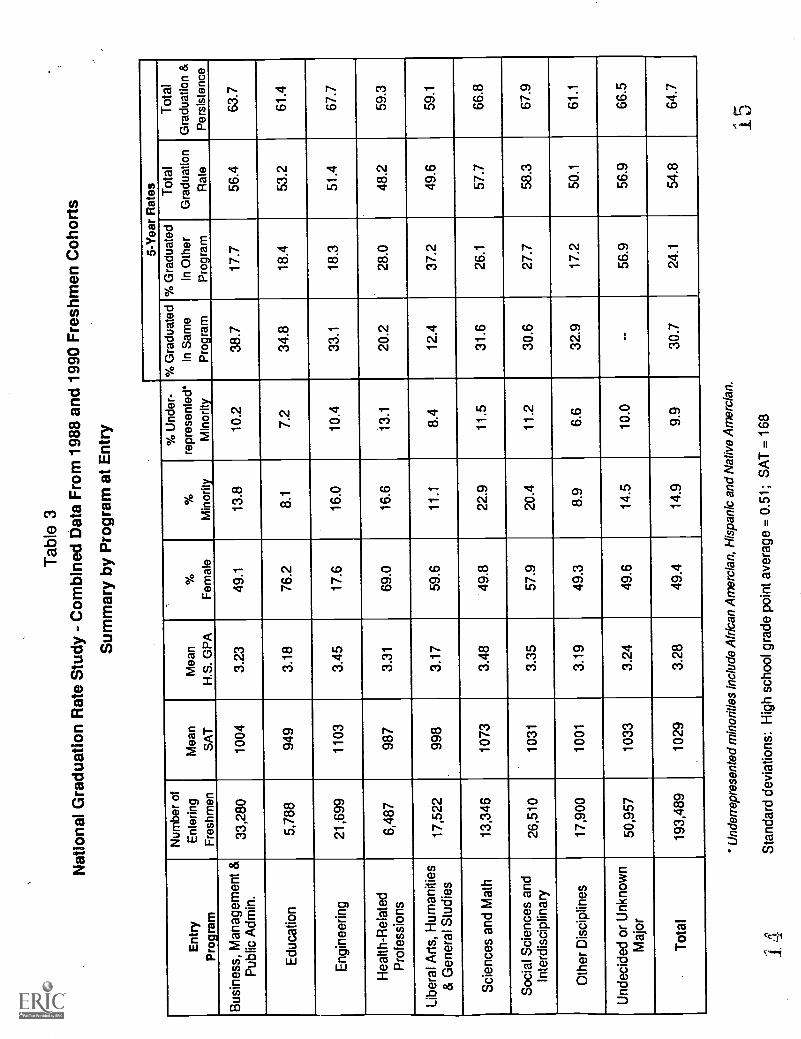
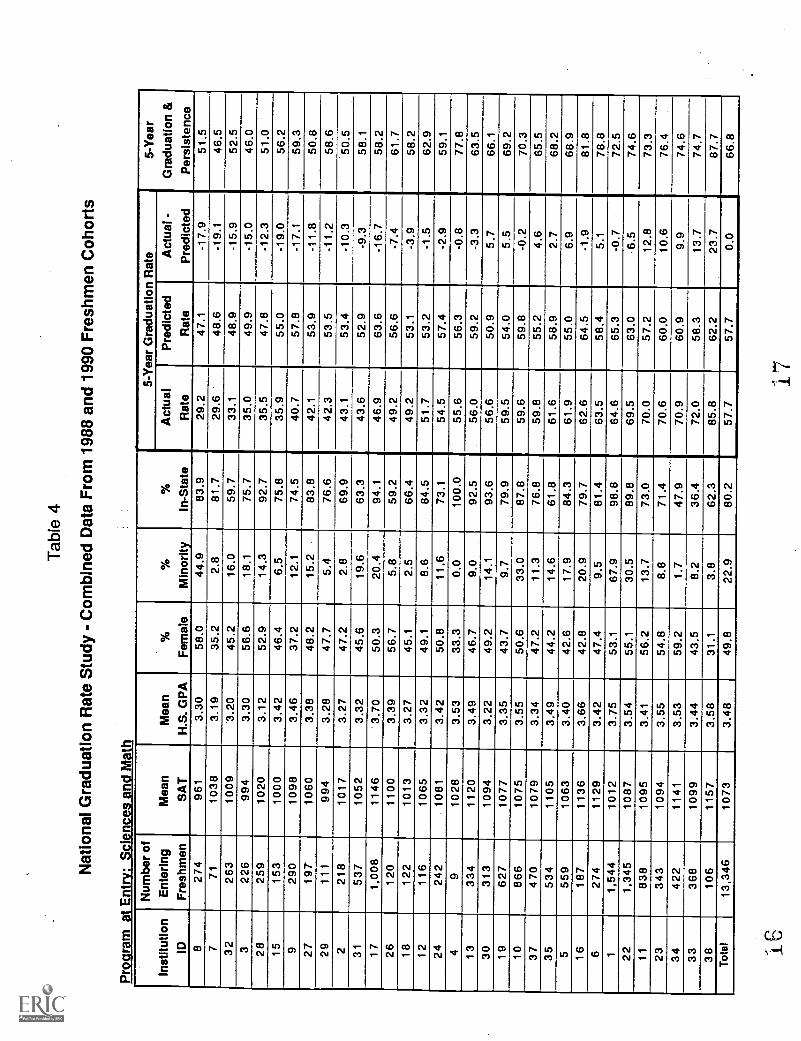
Yes, much more by university than by program. Table 3 displays program leveldata showing that five year graduation rates vary from 58.3% for freshmen whoentered social sciences and interdisciplinary programs to 48.2% for those whoentered health related professions. Table 2 shows a much larger variationamong universities, from 25.7% for university #8 to 77.1% for #38. To illustrate
3 5
the variation of graduation rates within a specific set of programs, Table 4details data in the sciences and math, showing a variation from a low of 29.2%for #8 to 85.5% for #38. It is also noteworthy that within sciences and math,women had a 61.2% five year graduation rate, while the rate for males was only54.1%.
Did time to completion vary by academic program?
Yes. Table 3 shows that engineering students take longest--16.3% are stillenrolled after five years--whereas business students finish fastest--only 7.3%remain enrolled after five years. A consequence of this is the underestimationof graduation rates for engineering students when looking out five or even sixyears.
What were the student migration patterns across programs?
Of the 112,000 graduates in the database, 26.0% graduated in business fieldsand 22.5% in the social sciences (see Table 5). These were also the programsthat experienced the largest in-migration from other areas (each gained about15% from other programs or undecided students). Engineering had the leastamount of "swirling", while liberal arts and social sciences had the most. As wedefined it: swirling = [(number of out-migrants) + (number of in-migrants)] /(number who graduated from the same program as they entered).
Since the study gathered six digit CIP codes for 93,447 graduates, we werealso able to assess the number of students who changed majors between entryand graduation. Almost three of every four entering freshmen (72%) whoinitially chose a major--undecided students were excluded--changed to adifferent major before graduating.
Is there an interaction between program and university: do some universitiesdo relatively better at graduating students in some disciplines?
No, the university rankings on five year graduation rate were highly correlatedacross programs--a university with a high graduation rate in one program waslikely to have a high rate in other programs (r >.95 for seven out of the ninecomparisons).
Did academic preparation vary among programs and universities?
Yes, students entering education programs had the lowest average SAT scoreat 949, whereas engineering students were highest at 1103. High school gradepoint averages had the same pattern. To put this into context, the averagestudent entering education would have been at the 16th percentile inengineering and the 22nd percentile in sciences and math. Table 3 detailsthese results.
4
Preparation varied considerably among universities, as well, ranging from anaverage SAT of 933 at university #8 to 1108 at #38 (see Table 2). The averagefreshman at #8 would have been at the 12th percentile at university #38.Looking at a specific area, the average entering sciences and math students at#8 would have been at only the 7th percentile at university # 38. Our data, then,indicate considerable variation in academic preparation across both programsand universities.
How did other student characteristics vary among programs?
As shown in Table 3, females were most likely to enter education (76%) andleast likely to enter engineering fields (18%). Minority students were most likelyto enter sciences and math (22.9%); least likely to enter education (7.2%).Underrepresented minorities, which we define as African American, Hispanicand Native American students, were most likely to enter health relatedprofessions (13.1%) and least likely to enter education (7.2%). AsianAmericans were most likely to enter sciences and math. These findings areconsistent with other national data.
Were undecided students at risk?
No, in fact undecided students, who were about 26% of the study population,perform slightly better than students who choose a major upon entry--theygraduated at a slightly higher rate (56.9% compared with 54.8%), and theirgraduation did not appear to be delayed (a five year graduation andpersistence rate of 66.5% compared with 64.7% for "decided" student4 Also,undecided students had very similar entry characteristics, including high schoolpreparation, to other students.
This finding is significant given the mythology about undecided students.Clearly undecided students are not poorly prepared upon entry, do not drop outat higher rates, and do not take longer to graduate.
Predicting Graduation Rates
As discussed earlier in this paper, in our previous study of graduation rates(Kroc, Woodard, Howard and Hull; 1995), Astin's (1993) model was used toaccount for the influence of student background characteristics on graduationrates. In this study we extended the logistic regression model used in Phase I ofour research by including an additional, more recent, cohort (1990) with theoriginal 1988 freshman cohort, and by adding program level data (six digit CIPcodes) that could be used to predict students' graduation rates within individualprograms or program areas.
5 7
How well could university graduation rates be predicted using entrycharacteristics?
Using logistic regression, we obtained about 66% concordance-- students' werecorrectly classified as having graduated or not 66% of the time, where 50%would be chance level. This translates into a correlation of about .28 betweenactual and predicted graduation rates.
What does this mean? As an example, look at university #1 in Table 2. If youknew nothing about this university, your best guess about its graduation ratewould be the mean of the sample, 54.8%, which was much lower than thisuniversity's actual rate of 68.2%. This is the kind of logic naive readers mightuse when looking at graduation rate data from the upcoming Student Right-to-Know reports or, currently, when perusing US News and World Report or thegrad rate data in the NCAA Report. Using entry characteristics, however, thepredicted rate for university #1 was 64.0%, closer to its actual rate--and a betterrepresentation of what its actual graduation rate should be.
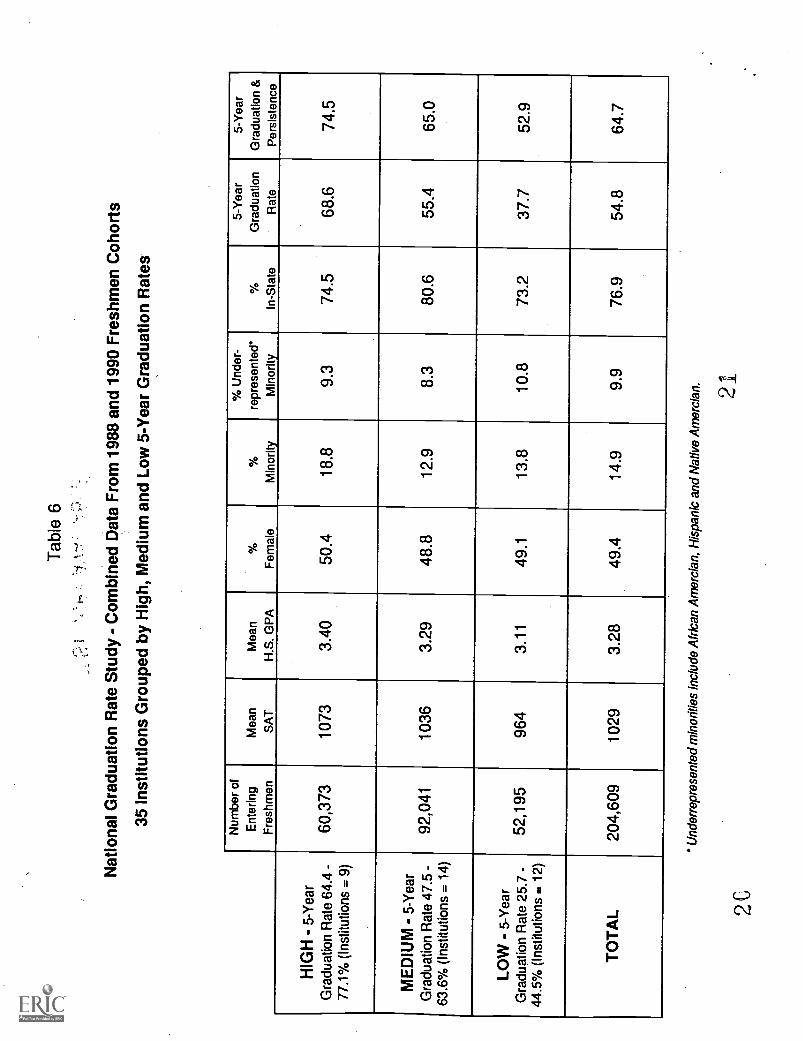
The best predictor was high school grade point average, followed by SAT, sex,ethnicity and domicile, respectively. In Table 6, to illustrate some of theserelationships in tabular form, we have aggregated the universities into either ahigh, medium or low group based on their graduation rates. Differences in SATand high school grade point averages among these groups are most evident.
Clearly, the results shown in Table 2 show that entry variables can help usunderstand some of the large variations in graduation rates among universities.Examining the differences between actual and predicted rates, then, can helpus sharpen our thinking and refine our questions about why universitygraduation rates vary.
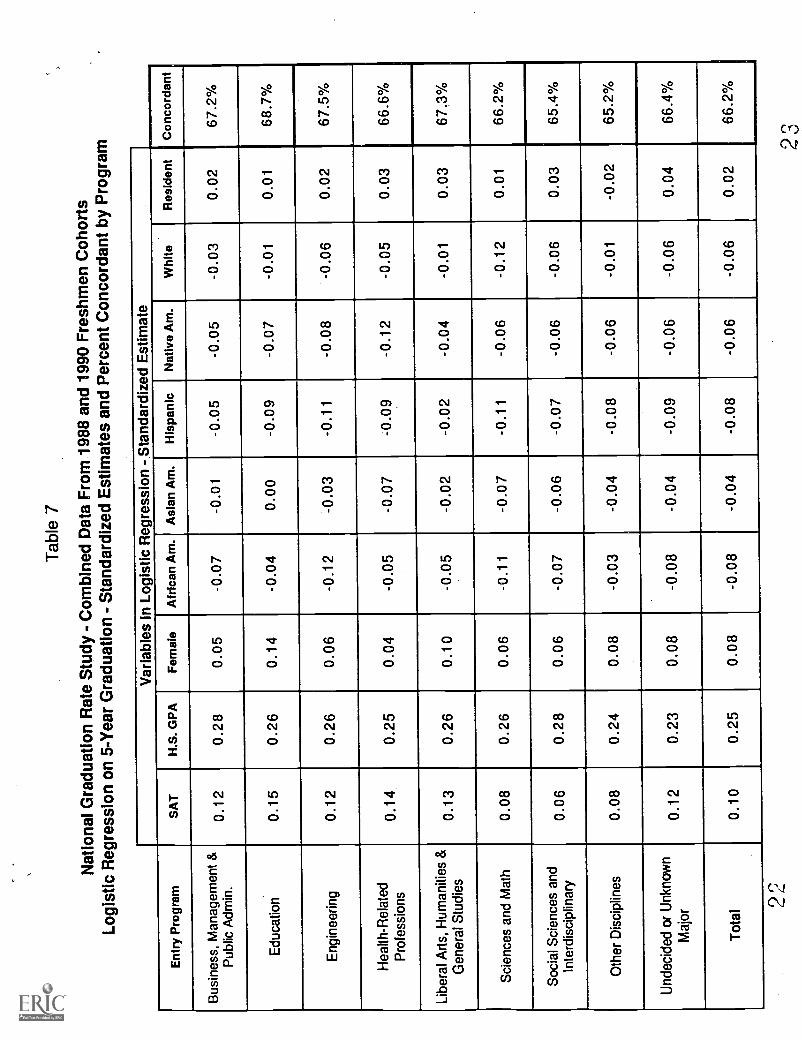
Were there differences in the predictability of graduation rates at the programlevel?
No, we found little variation in either the strength of the relationship or thecoefficients for the independent variables among the regressions produced foreach program. The equations were essentially interchangeable. Given thedegree of "swirling" among undergraduates, this is probably not a surprisingfinding. Table 7 displays the beta weights and the concordance values for eachprogram.
Did individual universities excel in some programs. but not in others?
Again, generally, no. The correlation coefficients were about .95 whencomparing the differences between actual and predicted graduation rates foruniversities across programs (see Table 8). A university with better thanpredicted graduation rates in one program was likely to have better rates for its
66
other programs. The exception in these data was health related professions,but much smaller numbers of students in this area may have been the primaryreason for the lower correlation.
Are there differences in actual graduation rates among universities with similarpredicted graduation rates?
One of the purposes of this study was to identify, at the program level,universities that graduated more students than might be expected from theirentry characteristics. These universities would then be studied more thoroughlyusing qualitative, case study, methods in Phase III of our project. In particular,we would be looking for the influences of university "environmental"characteristics on graduation rates.
Table 9, sorted by predicted graduation rate, shows results for sciences andmath programs. Examining pairs of universities with similar predicted rates,some interesting differences are evident. For example, universities #16 and#17 both had high predicted rates but differed by almost 16 percentage pointsin their actual graduation rates for science and math students. University #34and #38 showed a similar pattern. University #15 and #27 were alsointeresting--#27 had a lower predicted rate, but higher actual rate than did #15.
Implications
These results suggest that there may be value in further studies of the particularconditions at individual universities that may influence graduation rates.Accounting for entry characteristics as best we could with this methodology,there appeared to be variance in graduation rates that was unexplained.Moreover, we found intriguing differences within specific programs amonguniversities that appeared to have similar entering students.
Some of the differences and unexplained variance in graduation rates could beattributed to limitations in the methodology, specification error in particular. Thevariables used to account for "input" differences among universities do notperfectly measure what they purport to measure, and do not represent all of thedimensions of student difference. Socio-economic status, for example, isprobably not adequately measured in this study. Nonetheless, we believe thatthis methodology does move us considerably closer to understandingdifferences in graduation rates that are caused by university culture andenvironment.
How do we answer the question posed in the title of this paper: "Graduationrates: Do students' program choices make a difference?" Our answer is adefinitive yes--and no. We found that student characteristics varied
C 7 BEST COPY AVAILABLE
considerably among programs, with nearly a standard deviation of differencebetween the low and high programs. But, program-level graduation rates forindividual universities were almost entirely predictable from the university'soverall graduation rate--universities with the highest total graduation rates alsotended to have the highest rates in their individual programs. And when weaccounted for entry characteristics using logistic regression, universities with,better than predicted overall graduation rates also tended to have better ratesfor their individual programs.
Comparing one university with another, then, the variations among programsthat occur at the graduate level are not evident at the undergraduate level. Thisis probably not surprising given the impact of lower division course work, whenstudents are often taking a common core of courses; the fact that nearly threeout of four students change majors; and the large number of students who areundecided when they matriculate. Overall admission criteria and the overalluniversity environment appear to be more important than the selection of aprogram among undergraduates.
Finally, we believe that the findings of this study bear directly on this year's AIRForum program theme, performance indicators. For public, Research I, LandGrant and MU universities, the data in this study can provide valuablebenchmark and comparative information. As we face increasing pressures toimprove--and report on--undergraduate education, this information may beuseful.
References
Astin, A. (1993). How good is your institution's retention rate? Los Angeles:Higher Education Research Institute.
Chisholm, M. P. (1993). An evaluation of a statewide admission standardspolicy. Association for Institutional Research Annual Forum, Atlanta.
Dey, E. L. and Astin, A. (1993). Statistical alternatives to studying collegeretention: A comparative analysis of logit, probit and linear regression.Research in Higher Education, 34, 569-582.
Kroc, R. J., Woodard, D. B., Howard, R., and Hull, P. S. (1995) Predictinggraduation rates: A study of public Land Grant, Research I, and AAUuniversities. Association for Institutional Research Annual Forum, Boston.
8
Table 1
National Graduation Rate Study
Participating Universities
Arizona State U.Auburn U.
Clemson U.Iowa State U.
Louisiana State U.Mississippi State U.
Montana StateN. Carolina State U.
North Dakota State U.Oklahoma State U.
Penn State U.Rutgers U.
South Dakota State U.SUNY at BuffaloTexas A&M U.U. of Arkansas
U. of TennesseeU. C. Irvine
U. C. Santa BarbaraU. of Arizona
U. of Colorado-BoulderU. of Connecticut
U. of GeorgiaU. of IdahoU. of Iowa
U. of KansasU. of Maine
U. of MassachusettsU. of MinnesotaU. of MissouriU. of Montana
U. of New HampshireU. of New Mexico
U. of OregonU. of Vermont
U. of WashingtonU. of Wisconsin-Madison
Virginia Tech U.
11
Tab
le 2
Nat
iona
l Gra
duat
ion
Rat
e S
tudy
- C
ombi
ned
Dat
a F
rom
198
8 an
d 19
90 F
resh
men
Coh
orts
Pro
aram
at E
ntry
: ALL
inst
itutio
nID
Num
ber
of
Ent
erin
gF
resh
men
Mea
nS
AT
Mea
nH
.S. G
PA
%
Fem
ale
%
Min
ority
%
In-S
tate
5-Y
ear
Gra
duat
ion
Rat
e5-
Yea
rA
ctua
lR
ate
Pre
dict
edR
ate
Act
ual -
Pre
dict
edG
radu
atio
n &
Per
sist
ence
83,
521
933
3.11
52.3
37.9
80.3
25.7
45.8
-20.
148
.47
2,31
497
72.
9252
.94.
080
.429
.947
.8-1
7.9
44.2
291,
602
936
3.04
43.8
3.7
75.1
31.8
49.3
-17.
549
.115
2,61
693
73.
1744
.05.
172
.935
.051
.4-1
6.4
52.4
274,
719
943
3.14
47.6
10.0
82.7
35.1
50.1
-15.
046
.218
2,33
293
53.
0841
.71.
659
.436
.550
.7-1
4.2
50.2
286,
720
943
2.90
54.0
14.1
93.4
37.8
45.7
-7.9
55.1
31,
893
954
3.14
44.3
17.6
74.4
38.0
49.7
-11.
752
.132
7,09
197
33.
0548
.414
.047
.738
.349
.8-1
1.5
53.6
44,
730
953
3.23
50.5
11.2
90.2
38.6
51.7
-13.
149
.99
5,53
610
413.
3247
.010
.374
.641
.557
.8-1
6.3
59.6
319,
121
981
3.17
50.5
18.7
61.8
44.5
51.8
-7.3
57.1
1712
,058
1092
3.56
45.6
17.9
95.4
47.5
61.8
-14.
360
.22
3,42
697
53.
1744
.63.
171
.548
.753
.5-4
.856
.312
7,04
497
03.
1148
.07.
686
.448
.850
.5-1
.760
.813
7,79
710
083.
2252
.77.
386
.152
.654
.2-1
.658
.624
4,81
199
53.
2856
.311
.973
.253
.356
.0-2
.760
.314
4,84
910
573.
1742
.220
.596
.453
.953
.20.
862
.526
5,56
510
183.
1247
.27.
158
.055
.452
.52.
967
.521
-6,
271
1022
3.23
53.9
7.3
69.1
57.0
55.5
1.5
64.3
196,
939
1052
3.35
38.0
14.3
84.7
58.5
57.1
1.4
71.2
306,
746
1037
3.10
56.2
7.8
87.6
59.1
52.1
7.0
65.8
166,
798
1056
3.50
48.2
29.0
85.3
59.8
61.2
-1.4
77.1
357,
159
1067
3.40
46.8
16.9
56.4
60.8
59.7
1.1
67.6
377,
492
1041
3.21
52.4
9.6
80.5
61.0
55.1
5.9
67.0
55,
086
1046
3.32
52.9
13.0
79.0
63.6
57.3
6.3
70.5
106,
118
1079
3.52
52.0
31.0
91.2
64.4
61.4
3.0
72.1
235,
381
1034
3.38
44.7
9.5
66.8
65.5
57.9
7.6
74.4
2210
,619
1047
3.40
53.3
31.0
90.0
65.5
59.4
6.1
70.1
610
,528
1088
3.20
51.5
7.7
61.8
65.9
57.0
8.9
75.4
14,
993
1023
3.66
55.0
54.4
98.7
68.2
64.0
4.2
74.4
333,
702
1071
3.32
52.5
6.4
42.7
71.2
59.5
11.8
74.8
344,
108
1117
3.40
56.8
1.8
58.6
71.7
61.8
9.9
74.7
118,
252
1102
3.39
43.3
12.4
72.9
71.9
60.2
11.7
76.1
386,
672
1108
3.47
47.4
11.9
71.7
77.1
62.2
14.9
80.5
Tot
al20
4,60
910
293.
2849
.414
.976
.954
.854
.80.
064
.7
i 413
Tab
le 3
Nat
iona
l Gra
duat
ion
Rat
e S
tudy
- C
ombi
ned
Dat
a F
rom
1988
and
199
0 F
resh
men
Coh
orts
Sum
mar
y by
Pro
gram
at E
ntry
5 -Y
ear
Rat
es
Ent
ryP
rogr
am
Num
ber
of
Ent
erin
gF
resh
men
Mea
nS
AT
Mea
n
H.S
. GP
A
%
Fem
ale
%M
inor
ity
% U
nder
-re
pres
ente
d'M
inor
ity
% G
radu
ated
in S
ame
Pro
gram
% G
radu
ated
in O
ther
Pro
gram
Tot
alG
radu
atio
nR
ate
Tot
alG
radu
atio
n &
Per
sist
ence
Bus
ines
s, M
anag
emen
t &P
ublic
Adm
in.
33,2
8010
043.
2349
.113
.810
.238
.717
.756
.463
.7
Edu
catio
n5,
788
949
3.18
76.2
8.1
7.2
34.8
18.4
53.2
61.4
Eng
inee
ring
21,6
9911
033.
4517
.616
.010
.433
.118
.351
.467
.7
Hea
lth-R
elat
edP
rofe
ssio
ns6,
487
987
3.31
69.0
16.6
13.1
20.2
28.0
48.2
59.3
Libe
ral A
rts,
Hum
aniti
es&
Gen
eral
Stu
dies
17,5
2299
83.
1759
.611
.18.
412
.437
.249
.659
.1
Sci
ence
s an
d M
ath
13,3
4610
733.
4849
.822
.911
.531
.626
.157
.766
.8
Soc
ial S
cien
ces
and
Inte
rdis
cipl
inar
y26
,510
1031
3.35
57.9
20.4
11.2
30.6
27.7
58.3
67.9
Oth
er D
isci
plin
es17
,900
1001
3.19
49.3
8.9
6.6
32.9
17.2
50.1
61.1
Und
ecid
ed o
r U
nkno
wn
Maj
or50
,957
1033
3.24
49.6
14.5
10.0
-56
.956
.966
.5
Tot
al19
3,48
910
293.
2849
.414
.99.
930
.724
.154
.864
.7
3.4
Und
erre
pres
ente
d m
inor
ities
Incl
ude
Afr
ican
Am
erci
an, H
ispa
nic
and
Nat
ive
Am
erci
an.
Sta
ndar
d de
viat
ions
: Hig
h sc
hool
gra
de p
oint
ave
rage
= 0
.51;
SA
T =
168
15
Tab
le 4
Nat
iona
l Gra
duat
ion
Rat
e S
tudy
- C
ombi
ned
Dat
a F
rom
198
8 an
d 19
90 F
resh
men
Coh
orts
roar
am a
t Ent
ry S
cien
ces
and
Mat
h
Inst
itutio
nID
Num
ber
of
Ent
erin
gF
resh
men
Mea
n
SA
TM
ean
H.S
. GP
A
%
Fem
ale
%
Min
ority
%
In-S
tate
5-Y
ear
Gra
duat
ion
Rat
e5-
Yea
rA
ctua
lR
ate
Pre
dict
edR
ate
Act
ual -
Pre
dict
edG
radu
atio
n &
Per
sist
ence
827
496
13.
3058
.044
.983
.929
.247
.1-1
7.9
51.5
771
1038
3.19
35.2
2.8
81.7
29.6
48.6
-19.
146
.532
263
1009
3.20
45.2
16.0
59.7
33.1
48.9
-15.
952
.53
226
994
3.30
56.6
18.1
75.7
35.0
49.9
-15.
046
.028
259
1020
3.12
52.9
14.3
92.7
35.5
47.8
-12.
351
.015
153
1000
3.42
46.4
6.5
75.8
35.9
55.0
-19.
056
.29
290
1098
3.46
37.2
12.1
74.5
40.7
57.8
-17.
159
.327
197
1060
3.38
48.2
15.2
83.8
42.1
53.9
-11.
850
.829
111
994
3.28
47.7
5.4
76.6
42.3
53.5
-11.
258
.62
218
1017
3.27
47.2
2.8
69.9
43.1
53.4
-10.
350
.531
537
1052
3.32
45.6
19.6
63.3
43.6
52.9
-9.3
58.1
171,
008
1146
3.70
50.3
20.4
94.1
46.9
63.6
-16.
758
.226
120
1100
3.39
56.7
5.8
59.2
49.2
56.6
-7.4
61.7
1812
210
133.
2745
.12.
566
.449
.253
.1-3
.958
.212
116
1065
3.32
49.1
8.6
84.5
51.7
53.2
-1.5
62.9
2424
210
813.
4250
.811
.673
.154
.557
.4-2
.959
.14
910
283.
5333
.30.
010
0.0
55.6
56.3
-0.8
77.8
1333
411
203.
4946
.79.
092
.556
.059
.2-3
.363
.530
313
1094
3.22
49.2
14.1
93.6
56.6
50.9
5.7
66.1
1962
710
773.
3543
.79.
779
.959
.554
.05.
569
.210
866
1075
3.55
50.6
33.0
87.8
59.6
59.8
-0.2
70.3
3747
010
793.
3447
.211
.376
.859
.855
.24.
665
.535
534
1105
3.49
44.2
14.6
61.8
61.6
58.9
2.7
68.2
555
910
633.
4042
.617
.984
.361
.955
.06.
968
.916
187
1136
3.66
42.8
20.9
79.7
62.6
64.5
-1.9
81.8
627
411
293.
4247
.49.
581
.463
.558
.45.
178
.81
1,54
410
123.
7553
.167
.998
.864
.665
.3-0
.772
.522
1,34
510
873.
5455
.130
.589
.869
.563
.06.
574
.611
838
1095
3.41
56.2
13.7
73.0
70.0
57.2
12.8
73.3
2334
310
943.
5554
.88.
871
.470
.660
.010
.676
.434
422
1141
3.53
59.2
1.7
47.9
70.9
60.9
9.9
74.6
3336
810
993.
4443
.58.
236
.472
.058
.313
.774
.738
106
1157
3.58
31.1
3.8
62.3
85.8
62.2
23.7
87.7
Tot
al13
,346
1073
3.48
49.8
22.9
80.2
57.7
57.7
0.0
66.8
i617
Tab
le 5
Nat
iona
l Gra
duat
ion
Rat
e S
tudy
- C
ombi
ned
Dat
a F
rom
198
8 an
d 19
90 F
resh
men
Coh
orts
Per
cent
of 5
-Yea
r G
radu
ates
by
Ent
ry a
nd E
xit P
rogr
am
Pro
gram
at
Gra
duat
ion
Pro
gram
at E
ntry
BP
AE
DE
NG
HP
LA&
HU
S&
MS
S&
IO
ther
Und
ecid
edT
otal
Bus
ines
s, M
anag
emen
t &P
ublic
Adm
in. (
BP
A)
11.5%
0.2%
1.2%
0.2%
1.7%
0.5%
2.0%
0.8%
8.0%
26.0%
Edu
catio
n (E
D)
0.4%
1.8%
0.1%
0.1%
-
0.4%
0.2%
0.3%
0.3%
1.3%
4.9%
Eng
inee
ring
(EN
G)
0.2%
0.0%
r 1
6.4%
0.0%
0.1%
0.2%
0.6%
0.1%
3.3%
10.9%
Hea
lth-
Rel
ated
Pro
fess
ions
(HR
P)
0.1%
0.1%
0.1%
1.2%
0.2%
0.2%
0.3%
0.1%
0.8%
2.9%
Libe
ral A
rts,
Hum
aniti
es &
Gen
eral
Stu
dies
(LA
&H
U)
0.9%
0.1%
0.2%
0.1%
1.9%
o
0.3%
1.3%
0.3%
2.7%
7.9%
Sci
ence
s an
d M
ath
(S&
M)
0.3%
0.1%
0.6%
0.5%
0.4%
3.8%
1 .1%
0.2%
2.3%
9.3%
Soc
ial S
cien
ces
and
Inte
rdis
cipl
inar
y (S
S&
I)2.2%
0.3%
0.8%
0.4%
2.1%
1.2%
7.2%
0.8%
7.6%
22.5%
Oth
er D
isci
plin
es (
Oth
er)
1.1%
0.3%
0.6%
0.2%
1.0%
0.5%
1.0%
5.3%
5.5%
15.5%
Tot
al16.7%
2.7%
10.0%
2.8%
7.7%
6.9%
13.8%
8.0%
31.4%
100.0%
= G
radu
ated
in s
ame
prog
ram
are
a as
ent
ered
.
'ES
T C
OP
Y A
VA
ILA
BLE
Tab
le 6
C's
,'t
.
Nat
iona
l Gra
duat
ion
Rat
e S
tudy
- C
ombi
ned
Dat
a F
rom
198
8 an
d 19
90 F
resh
men
Coh
orts
35 In
stitu
tions
Gro
uped
by
Hig
h, M
ediu
m a
nd L
ow 5
-Yea
r G
radu
atio
n R
ates
Num
ber
of
Ent
erin
gF
resh
men
Mea
n
SA
TM
ean
H.S
. GP
A%
Fem
ale
%
Min
ority
% U
nder
-re
pres
ente
d*M
inor
ity%
In-S
tate
5-Y
ear
Gra
duat
ion
Rat
e
5-Y
ear
Gra
duat
ion
&P
ersi
sten
ce
HIG
H -
5-Y
ear
Gra
duat
ion
Rat
e 64
.4 -
77.1
% (
Inst
itutio
ns =
9)
60,3
7310
733.
4050
.418
.89.
374
.568
.674
.5
ME
DIU
M -
5-Y
ear
Gra
duat
ion
Rat
e 47
.5-
63.6
% (
Inst
itutio
ns =
14)
92,0
4110
363.
2948
.812
.98.
380
.655
.465
.0
LOW
- 5
-Yea
rG
radu
atio
n R
ate
25.7
-44
.5%
(In
stitu
tions
= 1
2)52
,195
964
3.11
49.1
13.8
10.8
73.2
37.7
52.9
TO
TA
L20
4,60
910
293.
2849
.414
.99.
976
.954
.864
.7
2C
Und
erre
pres
ente
d m
inor
ities
incl
ude
Afr
ican
Am
erci
an, H
ispa
nic
and
Nat
ive
Am
erci
an. 21
Tab
le 7
Nat
iona
l Gra
duat
ion
Rat
e S
tudy
- C
ombi
ned
Dat
a F
rom
198
8an
d 19
90 F
resh
men
Coh
orts
Logi
stic
Reg
ress
ion
on 5
-Yea
r G
radu
atio
n -
Sta
ndar
dize
d E
stim
ates
and
Per
cent
Con
cord
ant b
y P
rogr
am
Var
iabl
es in
Log
istic
Reg
ress
ion
- S
tand
ardi
zed
Est
imat
e
Ent
ry P
rogr
amS
AT
H.S
. GP
AF
emal
eA
fric
an A
m.
Asi
an A
m.
His
pani
cN
ativ
e A
m.
Whi
teR
esid
ent
Con
cord
ant
Bus
ines
s, M
anag
emen
t &P
ublic
Adm
in.
0.12
0.28
0.05
-0.0
7-0
.01
-0.0
5-0
.05
-0.0
30.
0267
.2%
Edu
catio
n0.
150.
260.
14-0
.04
0.00
-0.0
9-0
.07
-0.0
10.
0168
.7%
Eng
inee
ring
0.12
0.26
0.06
-0.1
2-0
.03
-0.1
1-0
.08
-0.0
60.
0267
.5%
Hea
lth R
elat
edP
rofe
ssio
ns0.
140.
250.
04-0
.05
-0.0
7-0
.09
-0.1
2-0
.05
0.03
66.6
%
Libe
ral A
rts,
Hum
aniti
es &
Gen
eral
Stu
dies
0.13
0.26
0.10
-0.0
5-0
.02
-0.0
2-0
.04
-0.0
10.
0367
.3%
Sci
ence
s an
d M
ath
0.08
0.26
0.06
-0.1
1-0
.07
-0.1
1-0
.06
-0.1
20.
0166
.2%
Soc
ial S
cien
ces
and
Inte
rdis
cipl
inar
y0.
060.
280.
06-0
.07
-0.0
6-0
.07
-0.0
6-0
.06
0.03
65.4
%
Oth
er D
isci
plin
es0.
080.
240.
08-0
.03
-0.0
4-0
.08
-0.0
6-0
.01
-0.0
265
.2%
Und
ecid
ed o
r U
nkno
wn
Maj
or0.
120.
230.
08-0
.08
-0.0
4-0
.09
-0.0
6-0
.06
0.04
66.4
%
Tot
al0.
100.
250.
08-0
.08
-0.0
4-0
.08
-0.0
6-0
.06
0.02
66.2
%
23
Tab
le 8
Nat
iona
l Gra
duat
ion
Rat
e S
tudy
- C
ombi
ned
Dat
a F
rom
198
8 an
d 19
90 F
resh
men
Coh
orts
Diff
eren
ce B
etw
een
Act
ual a
nd P
redi
cted
5-Y
ear
Gra
duat
ion
Rat
e (m
inim
um N
=50
)
Inst
itutio
nID
Bus
ines
s&
Pub
licA
dmin
.E
duca
tion
Eng
inee
ring
Hea
lthR
elat
edP
rofe
ssio
ns
Libe
ral
Art
s &
Hum
aniti
es
Sci
ence
san
dM
ath
Soc
ial
Sci
ence
s &
inte
rdis
cip.
Oth
er
Dis
cipl
ines
Und
ecid
edor
Unk
now
n
Maj
or
TO
TA
L
3816
.4%
16.7
%17
.1%
--16
.2%
23.7
%10
.8%
18.5
%12
.1%
14.9
%33
10.9
%11
.6%
14.0
%19
.6%
14.4
%13
.7%
12.5
%15
.1%
--11
.8%
118.
6%21
.3%
----
14.0
%12
.8%
12.5
%12
.3%
9.3%
11.7
%34
10.1
%15
.7%
11.7
%24
.4%
13.7
%9.
9%6.
7%9.
1%7.
7%9.
9%6
--2.
4%5.
8%12
.1%
--5.
1%--
11.2
%7.
4%8.
9%23
9.0%
14.2
%6.
7%1.
4%15
.0%
10.6
%8.
9%14
.9%
--7.
6%30
8.1%
4.8%
----
3.5%
5.7%
0.5%
5.1%
3.6%
7.0%
55.
2%--
3.3%
1.7%
5.7%
6.9%
8.5%
3.7%
7.5%
6.3%
223.
3%--
6.8%
8.5%
9.2%
- 6.
5%9.
6%7.
8%3.
5%6.
1%37
6.7%
9.6%
9.8%
18.8
%7.
4%4.
6%5.
8%8.
3%--
5.9%
13.
8%--
7.2%
--.
7.8%
-0.7
%4.
9%7.
2%--
4.2%
10i
0.2%
--6.
0%--
8.5%
-0.2
%3.
1%2.
3%2.
0%3.
0%26
9.0%
8.5%
7.1%
--9.
3%-7
.4%
0.4%
1.7%
-0.7
%2.
9%19
1.0%
16.3
%15
.0%
2.6%
11.5
%5.
5%7.
7%3.
9%-4
.4%
1.4%
355.
0%-4
.2%
1.6%
--3.
8%2.
7%0.
9%-1
.5%
-1.7
%1.
1%16
----
----
---1
.9%
-3.2
%-5
.6%
---1
.4%
130.
0%-4
.9%
-0.1
%1.
2%-8
.3%
-3.3
%-4
.5%
-1.6
%--
-1.6
%12
2.3%
---0
.7%
-0.8
%--
-1.5
%-5
.9%
-5.1
%-3
.6%
-1.7
%24
0.8%
----
--1.
9%-2
.9%
0.2%
-8.2
%-1
3.2%
-2.7
%2
-5.2
%2.
8%2.
4%25
.7%
-2.6
%-1
0.3%
-5.5
%-2
.8%
-11.
7%-4
.8%
31-6
.6%
-10.
7%-7
.4%
-5.1
%-4
.3%
-9.3
%-4
.5%
-10.
7%-7
.1%
-7.3
%28
-4.4
%-4
.8%
-8.6
%-9
.9%
-3.6
%-1
2.3%
-3.0
%-5
.2%
---7
.9%
32-8
.2%
-8.0
%-1
6.4%
-1.7
%-1
2.8%
-.15
.9%
-9.0
%-1
4.2%
-12.
3%-1
1.5%
3-4
.0%
-2.6
%-1
1.4%
----
-15.
0%-6
.5%
-14.
6%-1
2.7%
-11.
7%4
-12.
5%-1
1.2%
.-14
.8%
---1
0.0%
----
-7.9
%-
-13.
1%18
-11.
6%--
-12.
9%-6
.7%
-19.
4%-3
.9%
-14.
5%-3
.3%
---1
4.2%
17-1
4.9%
-9.4
%-1
0.3%
-15.
0%-7
.4%
-16.
7%-2
1.5%
-11.
4%--
-14.
3%27
-12.
7%-1
0.5%
-11.
9%12
.1%
-12.
1%-1
1.8%
-15.
5%-1
4.5%
-23.
4%-1
5.0%
9-1
5.6%
-14.
9%-6
.7%
-12.
6%-1
9.1%
-17.
1%-1
7.2%
-16.
4%-1
7.4%
-16.
3%15
-15.
4%-1
4.0%
-15.
8%--
-14.
4%-1
9.0%
-8.6
%-1
3.5%
---1
6.4%
29-1
8.9%
-21.
3%-1
0.0%
-3.1
%-1
6.1%
-11.
2%-1
5.4%
-15.
4%--
-17.
5%7
-13.
7%-1
7.1%
---2
1.9%
-15.
7%-1
9.1%
,-1
6.9%
-15.
2%-2
1.8%
-17.
9%8
-18.
9%-1
5.4%
-17.
1%-1
4.2%
-20.
8%-1
7.9%
-23.
8%-1
5.7%
-21.
7%-2
0.1%
Cor
rela
tion
of P
rogr
amto
Tot
al
-
0.97
0.91
0.93
0.70
0.95
0.93
0.94
0.94
0.97
Tab
le 9
Nat
iona
l Gra
duat
ion
Rat
e S
tudy
- C
ombi
ned
Dat
a F
rom
198
8 an
d 19
90F
resh
men
Coh
orts
Pro
aram
at E
ntry
: Sci
ence
s an
d M
ath
Inst
itutio
nID
Num
ber
of
Ent
erin
gF
resh
men
Mea
n
SA
T
Mea
n
H.S
. GP
A
%
Fem
ale
%
Min
ority
%
In-S
tate
5-Y
ear
Gra
duat
ion
Rat
e5-
Yea
r
Gra
duat
ion
&P
ersi
sten
ceA
ctua
lR
ate
Pre
dict
edR
ate
Act
ual -
Pre
dict
ed
827
496
13.
3058
.044
.983
.929
.247
.1-1
7.9
51.5
2825
910
203.
1252
.914
.392
.735
.547
.8-1
2.3
51.0
771
1038
3.19
35.2
2.8
81.7
29.6
48.6
-19.
146
.5
3226
310
093.
2045
.216
.059
.733
.148
.9-1
5.9
52.5
322
699
43.
3056
.618
.175
.735
.049
.9-1
5.0
46.0
3031
310
943.
2249
.214
.193
.656
.650
.95.
766
.1
3153
710
523.
3245
.619
.663
.343
.652
.9-9
.358
.1
1812
210
133.
2745
.12.
566
.449
.253
.1-3
.958
.2
1211
610
653.
3249
.18.
684
.551
.753
.2-1
.562
.9
221
810
173.
2747
.22.
869
.943
.153
.4-1
0.3
50.5
2911
199
43.
2847
.75.
476
.642
.353
.5-1
1.2
58.6
2719
710
603.
3848
.215
.283
.842
.153
.9-1
1.8
50.8
1962
710
773.
3543
.79.
779
.959
.554
.05.
569
.2
1515
310
003.
4246
.46.
575
.835
.955
.0-1
9.0
56.2
555
910
633.
4042
.617
.984
.361
.955
.06.
968
.9
3747
010
793.
3447
.211
.376
.859
.855
.24.
665
.5
49
1028
3.53
33.3
0.0
100.
055
.656
.3-0
.877
,8
2612
011
003.
3956
.75.
859
.249
.256
.6-7
.461
.7
1183
810
953.
4156
.213
.773
.070
.057
.212
.873
.3
2424
210
813.
4250
.811
.673
.154
.557
.4-2
.959
.1
929
010
983.
4637
.212
.174
.540
.757
.8-1
7.1
59.3
3336
810
993.
4443
.58.
236
.472
.058
.313
.774
.7
627
411
293.
4247
.49.
581
.463
.558
.45.
178
.8
3553
411
053.
4944
.214
.661
.861
.658
.92.
768
.2
1333
411
203.
4946
.79.
092
.556
.059
.2-3
.363
.5
1086
610
753.
5550
.633
.087
.859
.659
.8-0
.270
.3
2334
310
943.
5554
.88.
871
.470
.660
.010
.676
.4
3442
211
413.
5359
.21.
747
.970
.960
.99.
974
.6
3810
611
573.
5831
.13.
862
.385
.862
.223
.787
.7
221,
345
1087
3.54
55.1
30.5
89.8
69.5
63.0
6.5.
74.6
171,
008
1146
3.70
50.3
20.4
94.1
46.9
63.6
-16.
758
.2
1618
711
363.
6642
.820
.979
.762
.664
.5-1
.981
.8
11,
544
1012
3.75
53.1
67.9
98.8
64.6
65.3
-0.7
72.5
Tot
al13
,346
1073
3.48
49.8
22.9
80.2
57.7
57.7
0.0
66.8
BE
ST
CO
PY
AV
AIL
AB
LE27
U.S. Department of EducationOffice of Educational Research and Improvement (OERI)
National Library of Education (NLE)Educational Resources Information Center (ERIC)
REPRODUCTION RELEASE(Specific Document)
I. DOCUMENT IDENTIFICATION:
Title: GILA-12-e-vs-nelit) 1?--A-crtS b0 5'114/3 A-04-6E/-1 C piw&AA-eiiDI PP-&f2-C CE__
Author(s): li67,044148, /Z.-t at Den46-
Corporate Source: Publication Date:
i144# l'qq7
II. REPRODUCTION RELEASE:
In order to disseminate as widely as possible timely and significant materials of interest to the educational community, documents announced in themonthly abstract journal of the ERIC system, Resources in Education (RIE), are usually made available to users in microfiche, reproduced paper copy,and electronic media, and sold through the ERIC Document Reproduction Service (EDRS). Credit is given to the source of each document, and, ifreproduction release is granted, one of the following notices is affixed to the document.
If permission is granted to reproduce and disseminate the identified document, please CHECK ONE of the following three options and sign at the bottomof the page.
The sample sticker shown below will beaffixed to all Level 1 documents
PERMISSION TO REPRODUCE ANDDISSEMINATE THIS MATERIAL HAS
BEEN GRANTED BY
\e
Sad
TO THE EDUCATIONAL RESOURCESINFORMATION CENTER (ERIC)
Level
Check here for Level 1 release, permitting reproductionand dissemination in microfiche or other ERIC archival
media (e.g., electronic) and paper copy.
Signhere, -#please
The sample sticker shown below will beaffixed to all Level 2A documents
PERMISSION TO REPRODUCE ANDDISSEMINATE THIS MATERIAL IN
MICROFICHE, AND IN ELECTRONIC MEDIAFOR ERIC COLLECTION SUBSCRIBERS ONLY,
HAS BEEN GRANTED BY
2A
\e
TO THE EDUCATIONAL RESOURCESINFORMATION CENTER (ERIC)
Level 2A
nCheck here for Level 2A release, permitting reproductionand dissemination in microfiche and in electronic media
for ERIC archival collection subscribers only
The sample sticker shown below will beaffixed to all Level 2B documents
PERMISSION TO REPRODUCE ANDDISSEMINATE THIS MATERIAL IN
MICROFICHE ONLY HAS BEEN GRANTED BY
2B
\e,
TO THE EDUCATIONAL RESOURCESINFORMATION CENTER (ERIC)
Level 2B
nCheck here for Level 2B release, permitting
reproduction and dissemination in microfiche only
Documents will be processed as indicated provided reproduction quality permits.If permission to reproduce is granted, but no box is checked, documents will be processed at Level 1.
I hereby grant to the Educational Resources Information Center (ERIC) nonexclusive permission to reproduce and disseminate this documentas indicated above. Reproductidh from the ERIC microfiche or electronic media by persons other than ERIC employees and its systemcontractors requires permission from the copyright holder. Exception is made for non-profit reproduction by libraries and other service agenciesto satisfy information needs of educators in response to discrete inquiries.
Signature:
organizatiorvAddr ss:
lA A) I r4L5 d9'f- -f2) z_6AM-L-rPtcso (\) AZ $5"72
Printed Name/Position/Title:
f>.,1 GK grz-oci 2-Eercra ft72,48A--/achi
ail Addresd:
F"(5-2D) 40.242 -2.3 4
visa-0. A42- r224^AZTe: 3 Jqs
T43phocl:
(over)
III. DOCUMENT AVAILABILITY INFORMATION (FROM NON-ERIC SOURCE):
If permission to reproduce is not granted to ERIC, or, if you wish ERIC to cite the availability of the document from another source, pleaseprovide the following information regarding the availability of the document. (ERIC will not announce a document unless it is publiclyavailable, and a dependable source can be specified. Contributors should also be aware that ERIC selection criteria are significantly morestringent for documents that cannot be made available through EDRS.)
Publisher/Distributor:
Address:
Price:
IV. REFERRAL OF ERIC TO COPYRIGHT/REPRODUCTION RIGHTS HOLDER:
If the right to grant this reproduction release is held by someone other than the addressee, please provide the appropriate name andaddress:
Name:
Address:
V. WHERE TO SEND THIS FORM:
Send this form to the following ERIC Clearinghouse:
However, if solicited by the ERIC Facility, or if making an unsolicited contribution to ERIC, return this form (and the document beingcontributed) to:
ERIC Processing and Reference Facility1100 West Street, 2nd Floor