Water Flow in, Through, and Around theGas Diffusion LayerE. Gauthier1, Q. Duan2, T. Hellstern1, J. Benziger1*1 Department of Chemical and Biological Engineering, Princeton University, Princeton, NJ 08544, USA2 College of Material Science and Engineering, State Key Laboratory for Modification of Chemical Fibers and Polymer Materials,
Donghua University, Shanghai 201620, P. R. China
Received November 22, 2011; accepted August 10, 2012
1 Introduction
The gas diffusion layer (GDL) is an essential element ofthe electrodes in polymer electrolyte membrane (PEM) fuelcells. The GDL makes electrical contact with the catalystlayers to provide a larger area to carry the electronic currentfrom the catalyst to the bipolar plates reducing the resistancefor current flow. The GDL must be porous to permit the flowof reactant gas from the gas flow channel to the catalyst layerand flow of water from the catalyst layer to the gas flow chan-nel. The GDL must be electrically conductive, but it is alsodesirable for it to be hydrophobic to keep liquid water fromfilling the pores and blocking gas flow to the catalyst layer.Figure 1 is a schematic of the flow paths for the reactant gasesand liquid water in the GDL coupled with transport in thegas flow channels, proton transport in the PEM and electrontransport through the external load.
There have been numerous studies characterizing the porestructure of GDL materials [1–12]. Gostick et al. have recentlywritten a very comprehensive review of studies characteriz-ing gas diffusion media [7]. Most studies of the GDL havefocused on water flooding the GDL [1, 5, 8, 13–18]. Severalinvestigators have reported saturation curves from imbibing
and draining water into the gas diffusion media; this data hasbeen analyzed to determine pore volumes, pore radii and theinternal contact angle of GDL materials. Several studies havealso examined the hysteresis between the imbibition anddraining curves attributing it to contact angle hysteresis andgeometrical effects [3, 4, 6, 10, 19].
Benziger et al. [20, 21] and coworkers introduced waterpenetration experiments to characterize GDL materials. Theirresults showed that carbon fiber GDL materials are hydro-phobic and liquid water penetrates the largest pores. Theysuggested that liquid water only penetrates a few large poresand the smaller pores, that comprise the majority of the porevolume, remain free of liquid water and allow gas to be trans-ported from the gas flow channel to the catalyst layer. Otherresearchers have employed NMR and neutron scattering im-aging to confirm that liquid water penetrates only the largestpores [22–24]. The incipient water penetration results indicatethat the tail of the pore size distribution is critical for control-ling water transport.
AbstractLiquid water produced in polymer electrolyte membranefuel cells is transported from the cathode catalyst/mem-brane interface through the gas diffusion layer (GDL) to thegas flow channel. Liquid water travels both laterally (in theplane of GDL) and transversely through the largest pores ofthe porous GDL structure. Narrow apertures in the largestpores are the primary resistance to liquid water penetration.Carbon paper has limiting apertures ∼20 lm in diameterand ∼1 lm in length whereas carbon cloth has apertures∼100 lm in diameter and ∼200 lm in length. After sufficienthydrostatic pressure is applied, water penetrates the limitingaperture and flows through the pore. The pressure required
for water to flow through the pores is less than the pressureto penetrate the limiting aperture of the pores. Water movedlaterally and directed through a small number of transversepores. There is less resistance to lateral liquid water flow atthe interface between the GDL and a solid surface thanthrough the GDL. The results from these experiments sug-gest that water flow through the GDL is dominated by asmall number of pores and most pores remain free of liquidwater.
Keywords: Flow Through Pores, Gas Diffusion Layer, WaterPenetration
Gauthier et al.: Water Flow in, Through, and Around the Gas Diffusion Layer
Several studies have compared fuel cell performance withdifferent GDL materials in efforts to correlate GDL pore andfuel cell performance [18, 25, 26]. A common focus is addingTeflon to the carbon fiber GDL materials to limit flooding [13, 15,17, 27–29]. Other researchers have also considered the potentialto control GDL saturation using a hydrophobic microporouslayer (MPL) between the catalyst layer and the GDL [7, 30–34].
Water removal from PEM fuel cells depends on thecoupled transport of water through the GDL and dropdetachment in the gas flow channel. While the literature onflow channel design is extensive it seldom considers thecoupled design of the GDL and the gas flow channel. Jiao andZhao [14] and Lee et al. [35] developed models to show howlarger and different shaped pores limit liquid water satura-tion of the GDL. Gerteisen et al. experimentally demonstratedthat systematically perforating carbon paper with knowledgeof the flow channel structure reduces water accumulationand results in increased limiting current densities of 8–22%[36]. Kimball et al. [37] created flow directing pores throughthe GDL. They reported the highest current density wasachieved with a vertical flow channel, gas flow down, andthe flow directing pore under the rib near the cathode gasinlet. By far the worst fuel cell performance was with a hori-zontal flow channel, cathode facing upward (with respect togravity), and the pore directing pore under the channel nearthe cathode inlet. The efforts of all these studies suggest thatthe GDL and flow channels can be engineered to reduce theresistance to liquid water flow along certain pathways yield-ing less water saturation in the GDL and better fuel cell per-formance.
There have been a few previous studies that have exam-ined the resistance to lateral flow [38–40]. However, as wewill report in this paper it can be ambiguous as to whetherthe water flow is through the GDL or between the GDL–gasket interfaces. We shall quantify the resistance for liquidwater flow through the different lateral flow paths. We shallalso show that the lateral resistance to water flow changesover time, indicating slow dynamics of water penetration intosome of the pores of the GDL cause partial flooding. Gostick
et al. [7] suggested that the lateral trans-port gradient results in partial saturationand flooding of the cathode GDL. Wewill correlate our results with models ofpore structures that explain the dynamicsof partial saturation.
In this paper we report measurementsof the resistances of transverse and lat-eral water flow associated with carbonpaper and carbon cloth GDL materials,which we relate to pore structures ofGDL materials. Carbon cloth has poreswith nearly uniform diameter along theirlength. Carbon paper has wide poreswith narrow necks. Liquid penetration islimited by the narrow pore necks, butafter penetration the flow rate is con-
trolled by the average pore diameter. Lastly, we will showthat the resistance to lateral flow is substantially reduced atthe interface between the GDL and a solid surface.
2 Experimental
2.1 Materials
The gas diffusion materials tested were purchased fromFuel Cell Earth LLC. Toray carbon paper materials (TGP-H-120) were obtained with treatments of 5, 20, and 40 wt.%Teflon and a thickness of 370 lm. Woven carbon cloth wassupplied by Fuel Cell Earth with 0, 20 and 40 wt.% Teflonand a thickness of 380 lm. Figure 2 are micrographs of thetwo different GDL materials.
2.2 Transverse Transport Experiments
A cell similar to that used by Kimball et al. [21] was usedto measure transverse liquid transport. A sample of GDL wassealed between two chambers. One of the chambers was filledwith liquid water and connected to a water reservoir by atygon tube; the other side was maintained at atmosphericpressure and allowed to drain directly to a beaker on an ana-lytical balance (Ohaus Model AR0640). The piece of GDLexposed to water was 2.5 cm in diameter (total area of∼5 cm2). GDL samples were stored in desiccators prior to test-ing. The water reservoir was placed on a lab jack that could
Fig. 1 Schematic of structure of flow channels and membrane electrode assembly showing the flowof liquid water from the cathode catalyst layer to the cathode gas flow channel.
Fig. 2 Micrographs of carbon cloth and carbon paper GDL materials.
Gauthier et al.: Water Flow in, Through, and Around the Gas Diffusion Layer
be raised or lowered relative to the GDL sample. The hydro-static pressure of the liquid water was increased incremen-tally by 0.62 cm water (62 Pa) every 10 s until breakthroughwas achieved. After breakthrough the flow rate was mea-sured at fixed hydrostatic pressure interval for 100 s. Abovebreakthrough the hydrostatic pressure was increased in incre-ments of 0.62 cm water and the flow rates were measured for100 s. The GDL surface was visible through an acrylic plate,the number of drops forming on the surface of the GDL wasrecorded at each hydrostatic pressure. The pressure measure-ments are accurate to ±15 Pa. The standard deviations for theliquid flow rates were evaluated from ten measurements andwere typically about ±10% for a given sample. Breakthroughpressures and flow rates were reproducible for a single GDLsample. However, there were larger differences between dif-ferent samples taken from the same GDL material. We esti-mated the differences in values for breakthrough pressurebetween two different samples from the same GDL materialwere larger ±200 Pa for carbon cloth GDL and ±350 Pa forcarbon paper GDL. We suggest that the larger differencebetween different samples the same material is the conse-quence of tail of the pore size distribution.
2.3 Lateral Transport Experiments
Lateral transport resistance was measured using an acryliccell shown schematically in Figure 3. Water was forcedthrough a lateral flow distance of 2.54 cm; the cross-sectionfor flow was 0.47 cm wide × 0.038 cm high. A 2 L waterreservoir pressurized with compressed air was connected tothe cell. Pressurized water was pushed into an exposed are0.47 cm in diameter on one side of a GDL strip, forced to flowlaterally and then exit at atmospheric pressure from the otherside of the GDL strip. The GDL was clamped between300 lm thick silicon rubber gaskets, with holes for where thewater entered and exited the GDL. The cell was assembledand six bolts tightened to 40 in-lbs. Water flow rate was deter-mined by draining the cell into a beaker on an analytical bal-
ance (Ohaus Model AR0640). Two sets of measurements weremade. One with the cell as described above with the siliconrubber gaskets. For the second set of measurements a thincoating of vacuum grease was applied to the faces of the sili-con gaskets contacting the GDL material.
The pressure in the water reservoir was increased by increas-ing the regulator pressure on the compressed air. The pressurewas increased in increments of 10 kPa from 50 to 300 kPa every100 s. The liquid flow rates were determined from the changein mass of water collected over the 100 s collection interval.The lateral flow distance is 60 times greater than the trans-verse flow distance (2.5 cm vs. 0.04 cm and the pressures are50 times greater for the lateral flow (300 kPa vs. 6 kPa for car-bon paper) so the driving force for liquid flow, DP/L, isapproximately the same for the two different experiments.
3 Results
3.1 Transverse Water Penetration
The water flow through carbon paper and carbon clothGDL materials was measured as the pressure head wasincreased. The hydrostatic pressure head was set by position-ing the water reservoir at a desired height above the permea-tion cell. The mass of water passing through the GDL wasrecorded every 10 s for 100 s. The pressure head was thenincreased. The breakthrough pressure was defined as thepressure when the first drop of water was collected on thebalance. We could also see the GDL surface through a poly-carbonate window and the formation of the breakthroughpressure corresponded to the formation of the first drop onthe surface of the GDL sample.
After the initial breakthrough the hydrostatic pressure wasincreased by 62 Pa every 100 s and the accumulated liquidmass recorded. The surface of the GDL sample was viewedand the number of distinct liquid drops forming on the sur-face of the GDL was recorded. Each drop observed on thesurface of the GDL was assumed to be associated with water
penetration through a single pore in theGDL. Figure 4 shows the average massflow rate as a function of hydrostaticpressure. A series of vertical lines areshown indicating the number of distinctdrops seen on the surface of the GDLsample. The flow rates increase each timethe number of drops increased. The flowrates also increased at some points whereno new drop was observed. At those pointsone drop appeared to grow and detach at afaster rate than the others.
The hydrostatic pressure wasincreased until four to five drops wereforming simultaneously and then thepressure was stepped down incremen-tally by steps of 62 Pa every 100 s andthe flow rate was measured until the
Fig. 3 Experimental system for water penetration and flow measurements. (a) Side view showingthat an area of 0.17 cm2 exposed to liquid water with a fixed hydrostatic pressure. The water tra-verses 2.54 cm of GDL material 1.5 cm wide and exits from the GDL. (b) 3-D view showing thepositioning of the GDL material between two gaskets.
Gauthier et al.: Water Flow in, Through, and Around the Gas Diffusion Layer
flow of water ceased; the pressure when water flow ceased isreferred to as the shutoff pressure. Figure 5 shows the flowrate for increasing pressure and decreasing pressure througha carbon cloth GDL with 20 wt.% Teflon loading. Flow com-menced circa 1,000 Pa, corresponding to the breakthroughpressure. Flow did not shut off until the pressure wasdecreased to 250–300 Pa, corresponding to the shutoff pres-sure. The data in Figures 4 and 5 are for two different20 wt.% Teflon loaded carbon cloth GDLsamples. The results for breakthroughare similar, but the breakthrough andshutoff pressures show some variabilityreflecting slightly different pore sizesbetween samples.
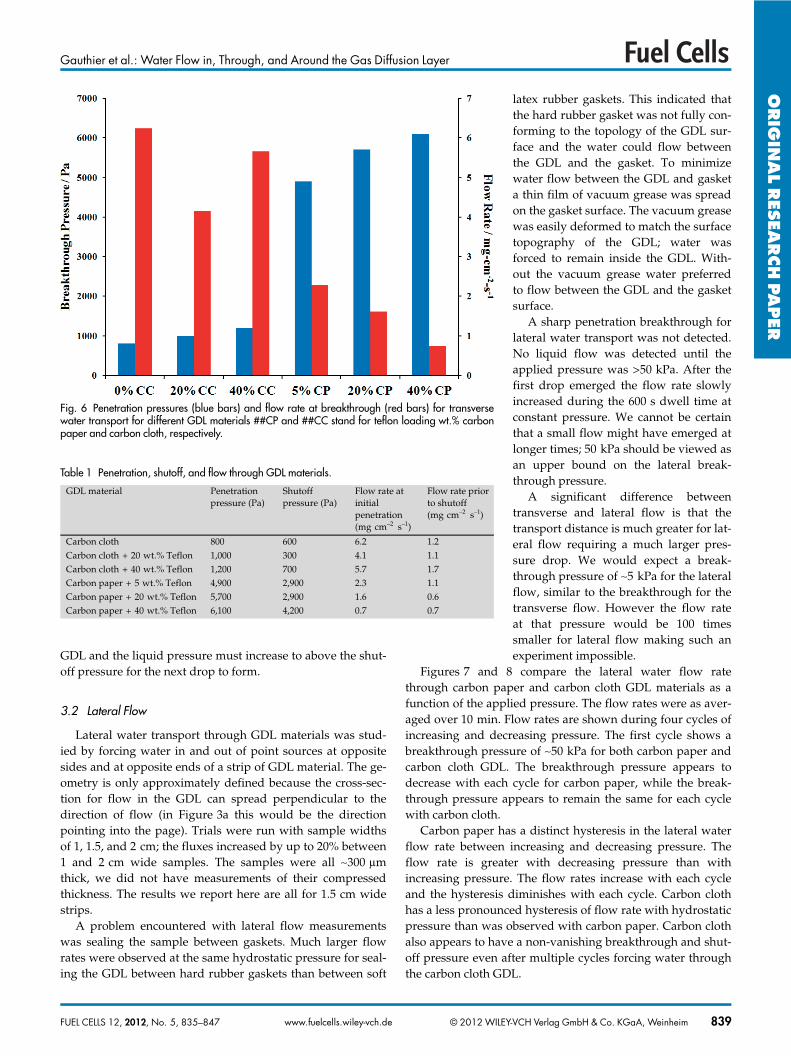
The pressure required for liquid pene-tration through the GDL is much greaterfor carbon paper than for carbon cloth.Figure 6 is a bar graph that highlights thedifference; penetration pressures for car-bon paper with different Teflon loadingsare five to six times greater than those forcarbon cloth. After penetration through asingle pore the flow rate for carbon clothwas two to three times greater than thesingle pore flow rate through carbonpaper. The liquid flow rates at break-through were >0.025 g s–1; that flow ratecorresponds to a fuel cell current of200 A. Current densities in PEM fuelcells are <2 A cm–2 which suggests thatthe water product from an area >10 cm2
can be conducted through a single porein the GDL. Table 1 summarizes thebreakthrough pressure, the shutoff pres-sure, and the flow rate at the break-through pressure for different GDLmaterials. The shutoff pressure rep-resents the minimum pressure differen-tial between the cathode catalyst layerand the cathode gas flow channel to per-mit sustained (constant) water removalfrom the catalyst layer. If the pressuredifferential is below the shutoff pressurethe hydrostatic pressure is insufficient toadvance the contact line perimeter of thedrop on outer surface of the GDL. Thedrop remains pinned when the Laplacepressure at the pore exit balances thesum of the hydrostatic and gravitationforces on the drop. Because the interfa-cial force pinning the drop is greater thanthe pressure required for water flowthrough the pore there is an abrupt dropin flow rate at the shutoff pressure. Theflow rate at shutoff represents the mini-mum current required to have sustained
steady liquid flow and a steady pressure differential betweenthe catalyst layer and the gas flow channel. If the current isless than the flow rate at shutoff the liquid flow will stop andthe pressure differential must build up to exceed the shutoffpressure for flow to recommence. The results in Table 1 sug-gest that in normal operation the pressure differentialbetween the catalyst layer and the gas flow channel will fluc-tuate as liquid drops are removed from the surface of the
Fig. 4 Penetration of water through a carbon cloth GDL with 20 wt.% Teflon loading. Trial 1 (blueline) was for a sample initially fully dried. The vertical lines designate the number of distinct dropsseen on the GDL surfaces during Trials 1 and 2. Trial 2 (red line) is water penetration for the samesample after initial water penetration from Trial 1.
Fig. 5 Penetration and shut off of water flow through a carbon cloth GDL with 20 wt.% Teflon load-ing. The arrows designate the direction of pressure change.
Gauthier et al.: Water Flow in, Through, and Around the Gas Diffusion Layer
GDL and the liquid pressure must increase to above the shut-off pressure for the next drop to form.
3.2 Lateral Flow
Lateral water transport through GDL materials was stud-ied by forcing water in and out of point sources at oppositesides and at opposite ends of a strip of GDL material. The ge-ometry is only approximately defined because the cross-sec-tion for flow in the GDL can spread perpendicular to thedirection of flow (in Figure 3a this would be the directionpointing into the page). Trials were run with sample widthsof 1, 1.5, and 2 cm; the fluxes increased by up to 20% between1 and 2 cm wide samples. The samples were all ∼300 lmthick, we did not have measurements of their compressedthickness. The results we report here are all for 1.5 cm widestrips.
A problem encountered with lateral flow measurementswas sealing the sample between gaskets. Much larger flowrates were observed at the same hydrostatic pressure for seal-ing the GDL between hard rubber gaskets than between soft
latex rubber gaskets. This indicated thatthe hard rubber gasket was not fully con-forming to the topology of the GDL sur-face and the water could flow betweenthe GDL and the gasket. To minimizewater flow between the GDL and gasketa thin film of vacuum grease was spreadon the gasket surface. The vacuum greasewas easily deformed to match the surfacetopography of the GDL; water wasforced to remain inside the GDL. With-out the vacuum grease water preferredto flow between the GDL and the gasketsurface.
A sharp penetration breakthrough forlateral water transport was not detected.No liquid flow was detected until theapplied pressure was >50 kPa. After thefirst drop emerged the flow rate slowlyincreased during the 600 s dwell time atconstant pressure. We cannot be certainthat a small flow might have emerged atlonger times; 50 kPa should be viewed asan upper bound on the lateral break-through pressure.
A significant difference betweentransverse and lateral flow is that thetransport distance is much greater for lat-eral flow requiring a much larger pres-sure drop. We would expect a break-through pressure of ∼5 kPa for the lateralflow, similar to the breakthrough for thetransverse flow. However the flow rateat that pressure would be 100 timessmaller for lateral flow making such anexperiment impossible.
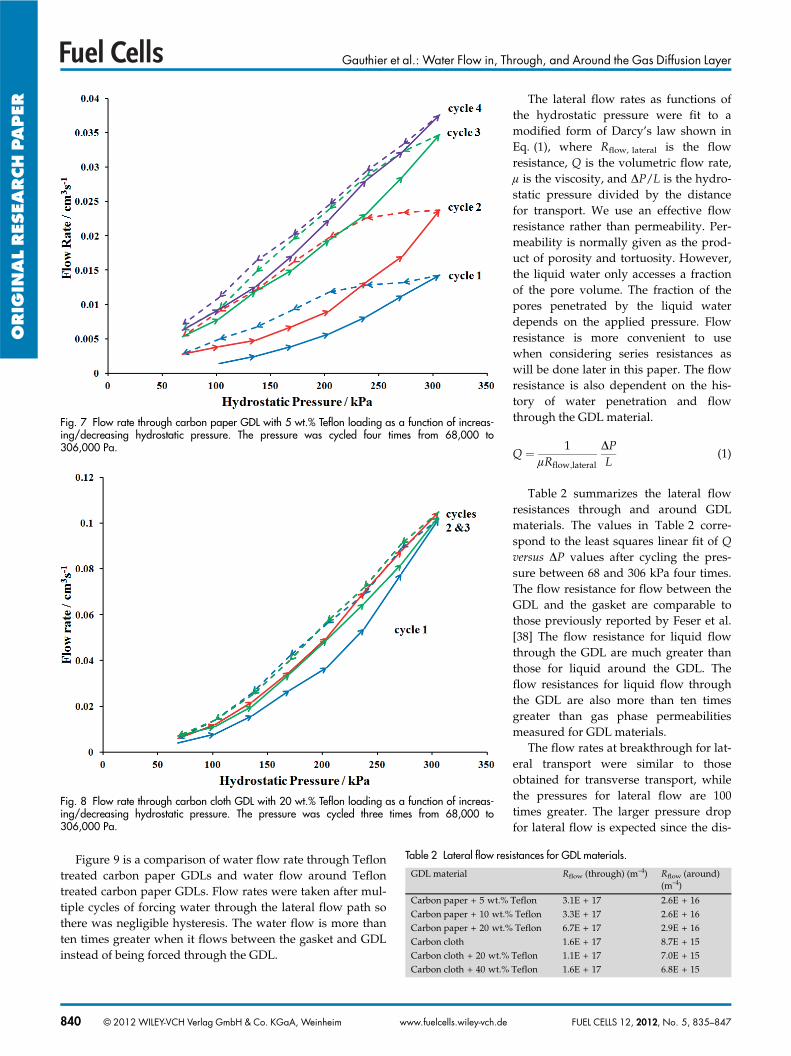
Figures 7 and 8 compare the lateral water flow ratethrough carbon paper and carbon cloth GDL materials as afunction of the applied pressure. The flow rates were as aver-aged over 10 min. Flow rates are shown during four cycles ofincreasing and decreasing pressure. The first cycle shows abreakthrough pressure of ∼50 kPa for both carbon paper andcarbon cloth GDL. The breakthrough pressure appears todecrease with each cycle for carbon paper, while the break-through pressure appears to remain the same for each cyclewith carbon cloth.
Carbon paper has a distinct hysteresis in the lateral waterflow rate between increasing and decreasing pressure. Theflow rate is greater with decreasing pressure than withincreasing pressure. The flow rates increase with each cycleand the hysteresis diminishes with each cycle. Carbon clothhas a less pronounced hysteresis of flow rate with hydrostaticpressure than was observed with carbon paper. Carbon clothalso appears to have a non-vanishing breakthrough and shut-off pressure even after multiple cycles forcing water throughthe carbon cloth GDL.
Fig. 6 Penetration pressures (blue bars) and flow rate at breakthrough (red bars) for transversewater transport for different GDL materials ##CP and ##CC stand for teflon loading wt.% carbonpaper and carbon cloth, respectively.
Table 1 Penetration, shutoff, and flow through GDL materials.
Gauthier et al.: Water Flow in, Through, and Around the Gas Diffusion Layer
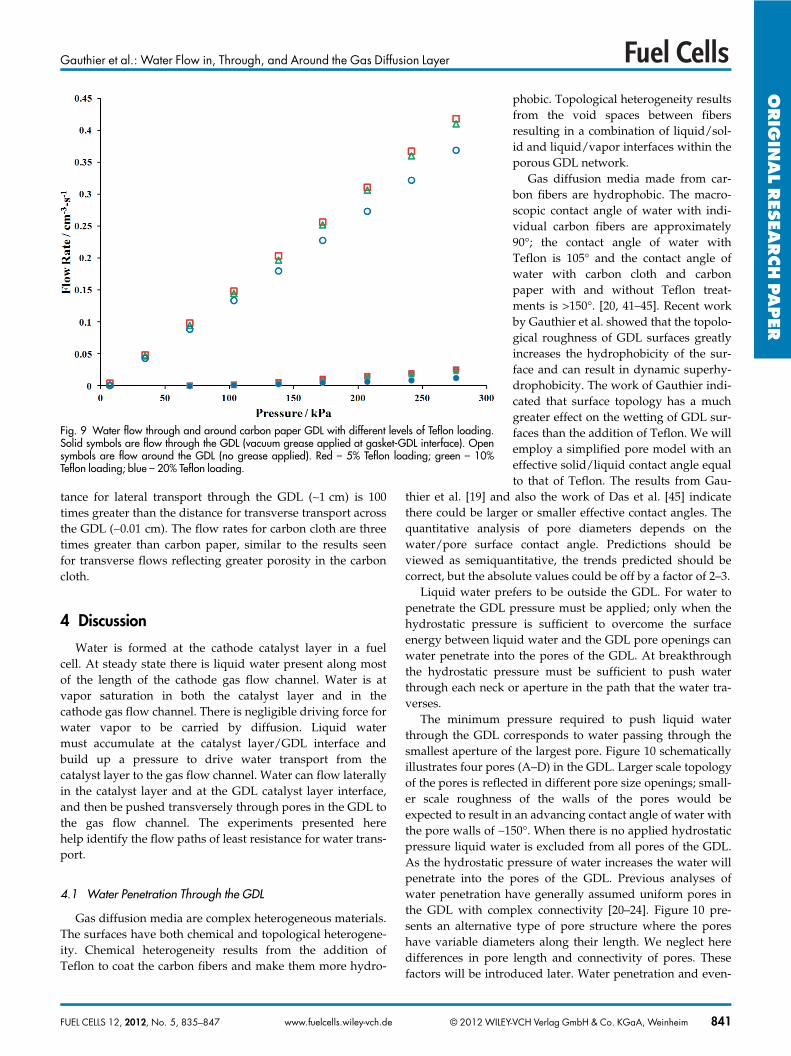
Figure 9 is a comparison of water flow rate through Teflontreated carbon paper GDLs and water flow around Teflontreated carbon paper GDLs. Flow rates were taken after mul-tiple cycles of forcing water through the lateral flow path sothere was negligible hysteresis. The water flow is more thanten times greater when it flows between the gasket and GDLinstead of being forced through the GDL.
The lateral flow rates as functions ofthe hydrostatic pressure were fit to amodified form of Darcy’s law shown inEq. (1), where Rflow, lateral is the flowresistance, Q is the volumetric flow rate,l is the viscosity, and DP/L is the hydro-static pressure divided by the distancefor transport. We use an effective flowresistance rather than permeability. Per-meability is normally given as the prod-uct of porosity and tortuosity. However,the liquid water only accesses a fractionof the pore volume. The fraction of thepores penetrated by the liquid waterdepends on the applied pressure. Flowresistance is more convenient to usewhen considering series resistances aswill be done later in this paper. The flowresistance is also dependent on the his-tory of water penetration and flowthrough the GDL material.
Q � 1lRflow�lateral
DPL
(1)
Table 2 summarizes the lateral flowresistances through and around GDLmaterials. The values in Table 2 corre-spond to the least squares linear fit of Qversus DP values after cycling the pres-sure between 68 and 306 kPa four times.The flow resistance for flow between theGDL and the gasket are comparable tothose previously reported by Feser et al.[38] The flow resistance for liquid flowthrough the GDL are much greater thanthose for liquid around the GDL. Theflow resistances for liquid flow throughthe GDL are also more than ten timesgreater than gas phase permeabilitiesmeasured for GDL materials.
The flow rates at breakthrough for lat-eral transport were similar to thoseobtained for transverse transport, whilethe pressures for lateral flow are 100times greater. The larger pressure dropfor lateral flow is expected since the dis-
Fig. 7 Flow rate through carbon paper GDL with 5 wt.% Teflon loading as a function of increas-ing/decreasing hydrostatic pressure. The pressure was cycled four times from 68,000 to306,000 Pa.
Fig. 8 Flow rate through carbon cloth GDL with 20 wt.% Teflon loading as a function of increas-ing/decreasing hydrostatic pressure. The pressure was cycled three times from 68,000 to306,000 Pa.
Table 2 Lateral flow resistances for GDL materials.
GDL material Rflow (through) (m–4) Rflow (around)(m–4)
Gauthier et al.: Water Flow in, Through, and Around the Gas Diffusion Layer
tance for lateral transport through the GDL (∼1 cm) is 100times greater than the distance for transverse transport acrossthe GDL (∼0.01 cm). The flow rates for carbon cloth are threetimes greater than carbon paper, similar to the results seenfor transverse flows reflecting greater porosity in the carboncloth.
4 Discussion
Water is formed at the cathode catalyst layer in a fuelcell. At steady state there is liquid water present along mostof the length of the cathode gas flow channel. Water is atvapor saturation in both the catalyst layer and in thecathode gas flow channel. There is negligible driving force forwater vapor to be carried by diffusion. Liquid watermust accumulate at the catalyst layer/GDL interface andbuild up a pressure to drive water transport from thecatalyst layer to the gas flow channel. Water can flow laterallyin the catalyst layer and at the GDL catalyst layer interface,and then be pushed transversely through pores in the GDL tothe gas flow channel. The experiments presented herehelp identify the flow paths of least resistance for water trans-port.
4.1 Water Penetration Through the GDL
Gas diffusion media are complex heterogeneous materials.The surfaces have both chemical and topological heterogene-ity. Chemical heterogeneity results from the addition ofTeflon to coat the carbon fibers and make them more hydro-
phobic. Topological heterogeneity resultsfrom the void spaces between fibersresulting in a combination of liquid/sol-id and liquid/vapor interfaces within theporous GDL network.
Gas diffusion media made from car-bon fibers are hydrophobic. The macro-scopic contact angle of water with indi-vidual carbon fibers are approximately90°; the contact angle of water withTeflon is 105° and the contact angle ofwater with carbon cloth and carbonpaper with and without Teflon treat-ments is >150°. [20, 41–45]. Recent workby Gauthier et al. showed that the topolo-gical roughness of GDL surfaces greatlyincreases the hydrophobicity of the sur-face and can result in dynamic superhy-drophobicity. The work of Gauthier indi-cated that surface topology has a muchgreater effect on the wetting of GDL sur-faces than the addition of Teflon. We willemploy a simplified pore model with aneffective solid/liquid contact angle equalto that of Teflon. The results from Gau-
thier et al. [19] and also the work of Das et al. [45] indicatethere could be larger or smaller effective contact angles. Thequantitative analysis of pore diameters depends on thewater/pore surface contact angle. Predictions should beviewed as semiquantitative, the trends predicted should becorrect, but the absolute values could be off by a factor of 2–3.
Liquid water prefers to be outside the GDL. For water topenetrate the GDL pressure must be applied; only when thehydrostatic pressure is sufficient to overcome the surfaceenergy between liquid water and the GDL pore openings canwater penetrate into the pores of the GDL. At breakthroughthe hydrostatic pressure must be sufficient to push waterthrough each neck or aperture in the path that the water tra-verses.
The minimum pressure required to push liquid waterthrough the GDL corresponds to water passing through thesmallest aperture of the largest pore. Figure 10 schematicallyillustrates four pores (A–D) in the GDL. Larger scale topologyof the pores is reflected in different pore size openings; small-er scale roughness of the walls of the pores would beexpected to result in an advancing contact angle of water withthe pore walls of ∼150°. When there is no applied hydrostaticpressure liquid water is excluded from all pores of the GDL.As the hydrostatic pressure of water increases the water willpenetrate into the pores of the GDL. Previous analyses ofwater penetration have generally assumed uniform pores inthe GDL with complex connectivity [20–24]. Figure 10 pre-sents an alternative type of pore structure where the poreshave variable diameters along their length. We neglect heredifferences in pore length and connectivity of pores. Thesefactors will be introduced later. Water penetration and even-
Fig. 9 Water flow through and around carbon paper GDL with different levels of Teflon loading.Solid symbols are flow through the GDL (vacuum grease applied at gasket-GDL interface). Opensymbols are flow around the GDL (no grease applied). Red – 5% Teflon loading; green – 10%Teflon loading; blue – 20% Teflon loading.
Gauthier et al.: Water Flow in, Through, and Around the Gas Diffusion Layer
tual flow through a pore can be broken down into a sequenceof stages.
Stage 1: When the hydrostatic pressure is increased, waterwill first enter the pore with the largest entry aperture (poreC). The hydrostatic pressure for water to enter pore C is givenby the Young–Laplace equation [Eq. (2)].
DPC�i � 2cw cos hrC�i
(2)
Stage 2: Water will only enter pore C up to level ii until thepressure is increased to DPA�i � 2cw cos h�rA�i and then waterwill penetrate into the entries of pores A and D. Pore A willfill to level iii, pore C will remain pinned at level ii and poreD will fill to level ii.
Stage 3: Increasing the pressure to DPB�i � 2cw cos h�rB�i
will allow water to fill pore B to level v, while the levels in allthe other pores remain pinned because of the contact lineforces at the narrowed pore apertures.
Stage 4: Increasing the pressure to DPD�ii � 2cw cos h�rD�ii
will allow water to penetrate further into pore D up to levelv. The liquid levels in all the other pores remain pinned.
Stage 5: Increasing the pressure to DPC�ii � DPD�v � 2cwcos h�rC�ii � 2cw cos h�rD�v will permit water to flow intopores C and D. The level in pore C will rise to between levels
iii and iv, while the water in pore D breaks through to exitinto the gas flow channel. After water breaks through in poreD the resistance to flow through pore D drops and waterflows through pore D with the water levels in pores A, B, andC staying fixed.
The liquid flow rate through pore D at breakthrough canbe found by taking the sum of the resistances through eachsection of the pore. A simplifying assumption is that the pres-sure drop through each section is given by the Hagen–Poi-seuille equation [46]. Summing up the contributions to theoverall pressure drop gives Eq. (3), where ti is the length ofeach section along the pore and ri is the radius of the apertureof each section.
DPtGDL
�� DPi
ti
� �� Qlw
8p
� �� 1r4
i(3)
Additional water will only flow into pores A–C if the pres-sure is raised above DPD�v. With increasing hydrostatic pres-sure pore C would be the next pore to fill and breakthroughso liquid would flow through pores C and D. As the pressurewas increased further pore B would fill with liquid to level v,followed by penetration through pore A, and lastly, waterwill penetrate pore B.
If the hydrostatic pressure is decreased flow will shut offin order B, D, A, and C. Flow through a pore shuts off whenthe hydrostatic pressure is no longer sufficient for water toovercome the surface tension holding the drop to the poreexit. The shutoff pressure is found by using the radius of thepore exit in the Young–Laplace equation. The final shutoffpressure when all liquid flow ceases is DPD�v � 2cw cos h�rD�v.
The pore filling and breakthrough sequence illustrated inFigure 10 is applicable to both lateral and transverse flow inand through the GDL. This model can assist in explaining thehystereses observed when cycling the hydrostatic pressure.Suppose the pressure is increased to DPD�v so only Pore Dallowed flow; if the pressure were then decreased belowDPD�v liquid flow would shut off. Flow would recommence ifthe pressure were again raised to DPD�v. But as the pressure isincreased the liquid front in Pore C will advance toward leveliv. After cycling the pressure up and down the liquid front inPore C will eventually reach level iv and liquid will flowthrough both Pore C and Pore D. This corresponds to thecycle dependent hysteresis seen with carbon paper shown inFigure 7.
4.2 Transverse Water Flow and Pore Structure
Transverse water flow in all the tested GDL materialsrequires an applied hydrostatic pressure, clearly demonstrat-ing that the GDL materials are hydrophobic. Water seeks thepath of least resistance to flow through the GDL, which willbe the pore with the largest restricting aperture (in mathema-tical terms this corresponds to the maximum of the minimumpore aperture, which was Pore D in Figure 10). From thepressures and flow rates at breakthrough and shutoff the lim-
Fig. 10 Sequential filling of pores up to liquid breakthrough. The numberscorrespond to the sequence of water penetration described in the text.Stage 5 corresponds to liquid breakthrough and the commencement ofsteady liquid water flow through the GDL.
Gauthier et al.: Water Flow in, Through, and Around the Gas Diffusion Layer
iting aperture for water flow, the radius of the pore exit andthe effective length of the limiting aperture can be deter-mined. The radius of the limiting aperture for water break-through is found applying the Young–Laplace equation tothe breakthrough pressure [Eq. (4)].
rbreakthrough � 2cw cos hDPbreakthrough
(4)
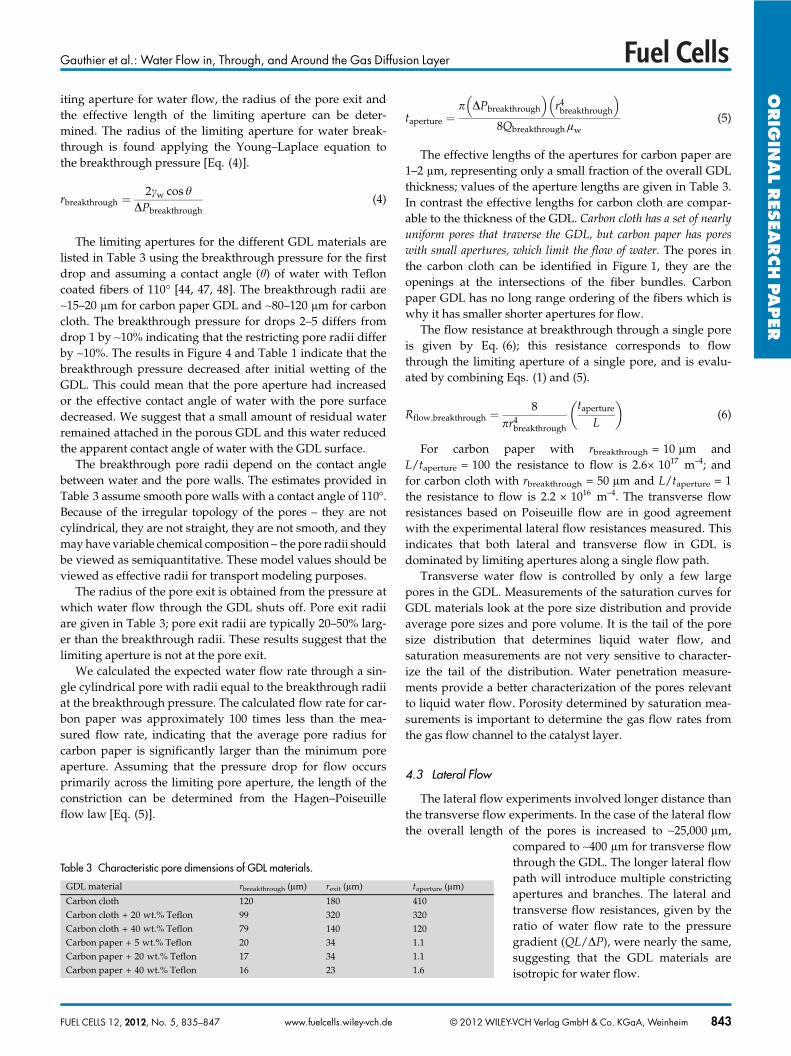
The limiting apertures for the different GDL materials arelisted in Table 3 using the breakthrough pressure for the firstdrop and assuming a contact angle (h) of water with Tefloncoated fibers of 110° [44, 47, 48]. The breakthrough radii are∼15–20 lm for carbon paper GDL and ∼80–120 lm for carboncloth. The breakthrough pressure for drops 2–5 differs fromdrop 1 by ∼10% indicating that the restricting pore radii differby ∼10%. The results in Figure 4 and Table 1 indicate that thebreakthrough pressure decreased after initial wetting of theGDL. This could mean that the pore aperture had increasedor the effective contact angle of water with the pore surfacedecreased. We suggest that a small amount of residual waterremained attached in the porous GDL and this water reducedthe apparent contact angle of water with the GDL surface.
The breakthrough pore radii depend on the contact anglebetween water and the pore walls. The estimates provided inTable 3 assume smooth pore walls with a contact angle of 110°.Because of the irregular topology of the pores – they are notcylindrical, they are not straight, they are not smooth, and theymay have variable chemical composition – the pore radii shouldbe viewed as semiquantitative. These model values should beviewed as effective radii for transport modeling purposes.
The radius of the pore exit is obtained from the pressure atwhich water flow through the GDL shuts off. Pore exit radiiare given in Table 3; pore exit radii are typically 20–50% larg-er than the breakthrough radii. These results suggest that thelimiting aperture is not at the pore exit.
We calculated the expected water flow rate through a sin-gle cylindrical pore with radii equal to the breakthrough radiiat the breakthrough pressure. The calculated flow rate for car-bon paper was approximately 100 times less than the mea-sured flow rate, indicating that the average pore radius forcarbon paper is significantly larger than the minimum poreaperture. Assuming that the pressure drop for flow occursprimarily across the limiting pore aperture, the length of theconstriction can be determined from the Hagen–Poiseuilleflow law [Eq. (5)].
taperture �p DPbreakthrough
� �r4
breakthrough
� �8Qbreakthrough lw
(5)
The effective lengths of the apertures for carbon paper are1–2 lm, representing only a small fraction of the overall GDLthickness; values of the aperture lengths are given in Table 3.In contrast the effective lengths for carbon cloth are compar-able to the thickness of the GDL. Carbon cloth has a set of nearlyuniform pores that traverse the GDL, but carbon paper has poreswith small apertures, which limit the flow of water. The pores inthe carbon cloth can be identified in Figure 1, they are theopenings at the intersections of the fiber bundles. Carbonpaper GDL has no long range ordering of the fibers which iswhy it has smaller shorter apertures for flow.
The flow resistance at breakthrough through a single poreis given by Eq. (6); this resistance corresponds to flowthrough the limiting aperture of a single pore, and is evalu-ated by combining Eqs. (1) and (5).
Rflow�breakthrough � 8pr4
breakthrough
taperture
L
� �(6)
For carbon paper with rbreakthrough = 10 lm andL/taperture = 100 the resistance to flow is 2.6× 10¹⁷ m–4; andfor carbon cloth with rbreakthrough = 50 lm and L/taperture = 1the resistance to flow is 2.2 × 10¹⁶ m–4. The transverse flowresistances based on Poiseuille flow are in good agreementwith the experimental lateral flow resistances measured. Thisindicates that both lateral and transverse flow in GDL isdominated by limiting apertures along a single flow path.
Transverse water flow is controlled by only a few largepores in the GDL. Measurements of the saturation curves forGDL materials look at the pore size distribution and provideaverage pore sizes and pore volume. It is the tail of the poresize distribution that determines liquid water flow, andsaturation measurements are not very sensitive to character-ize the tail of the distribution. Water penetration measure-ments provide a better characterization of the pores relevantto liquid water flow. Porosity determined by saturation mea-surements is important to determine the gas flow rates fromthe gas flow channel to the catalyst layer.
4.3 Lateral Flow
The lateral flow experiments involved longer distance thanthe transverse flow experiments. In the case of the lateral flowthe overall length of the pores is increased to ∼25,000 lm,
compared to ∼400 lm for transverse flowthrough the GDL. The longer lateral flowpath will introduce multiple constrictingapertures and branches. The lateral andtransverse flow resistances, given by theratio of water flow rate to the pressuregradient (QL/DP), were nearly the same,suggesting that the GDL materials areisotropic for water flow.
Table 3 Characteristic pore dimensions of GDL materials.
GDL material rbreakthrough (lm) rexit (lm) taperture (lm)
Gauthier et al.: Water Flow in, Through, and Around the Gas Diffusion Layer
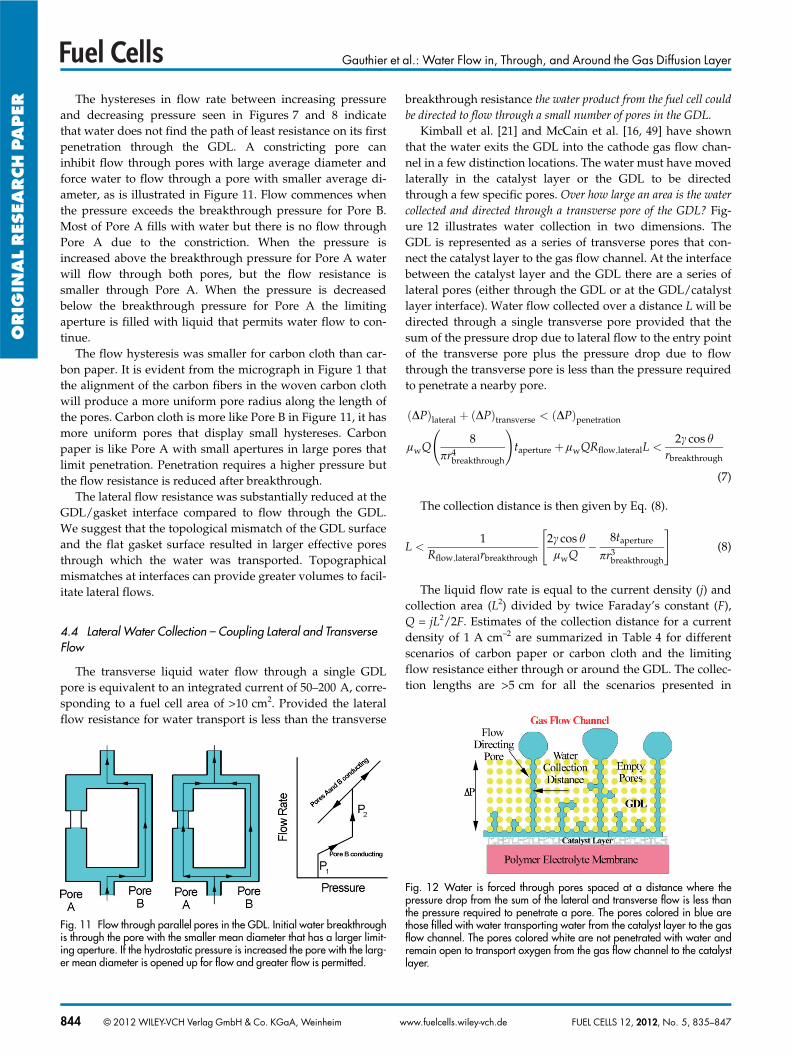
The hystereses in flow rate between increasing pressureand decreasing pressure seen in Figures 7 and 8 indicatethat water does not find the path of least resistance on its firstpenetration through the GDL. A constricting pore caninhibit flow through pores with large average diameter andforce water to flow through a pore with smaller average di-ameter, as is illustrated in Figure 11. Flow commences whenthe pressure exceeds the breakthrough pressure for Pore B.Most of Pore A fills with water but there is no flow throughPore A due to the constriction. When the pressure isincreased above the breakthrough pressure for Pore A waterwill flow through both pores, but the flow resistance issmaller through Pore A. When the pressure is decreasedbelow the breakthrough pressure for Pore A the limitingaperture is filled with liquid that permits water flow to con-tinue.
The flow hysteresis was smaller for carbon cloth than car-bon paper. It is evident from the micrograph in Figure 1 thatthe alignment of the carbon fibers in the woven carbon clothwill produce a more uniform pore radius along the length ofthe pores. Carbon cloth is more like Pore B in Figure 11, it hasmore uniform pores that display small hystereses. Carbonpaper is like Pore A with small apertures in large pores thatlimit penetration. Penetration requires a higher pressure butthe flow resistance is reduced after breakthrough.
The lateral flow resistance was substantially reduced at theGDL/gasket interface compared to flow through the GDL.We suggest that the topological mismatch of the GDL surfaceand the flat gasket surface resulted in larger effective poresthrough which the water was transported. Topographicalmismatches at interfaces can provide greater volumes to facil-itate lateral flows.
4.4 Lateral Water Collection – Coupling Lateral and TransverseFlow
The transverse liquid water flow through a single GDLpore is equivalent to an integrated current of 50–200 A, corre-sponding to a fuel cell area of >10 cm2. Provided the lateralflow resistance for water transport is less than the transverse
breakthrough resistance the water product from the fuel cell couldbe directed to flow through a small number of pores in the GDL.
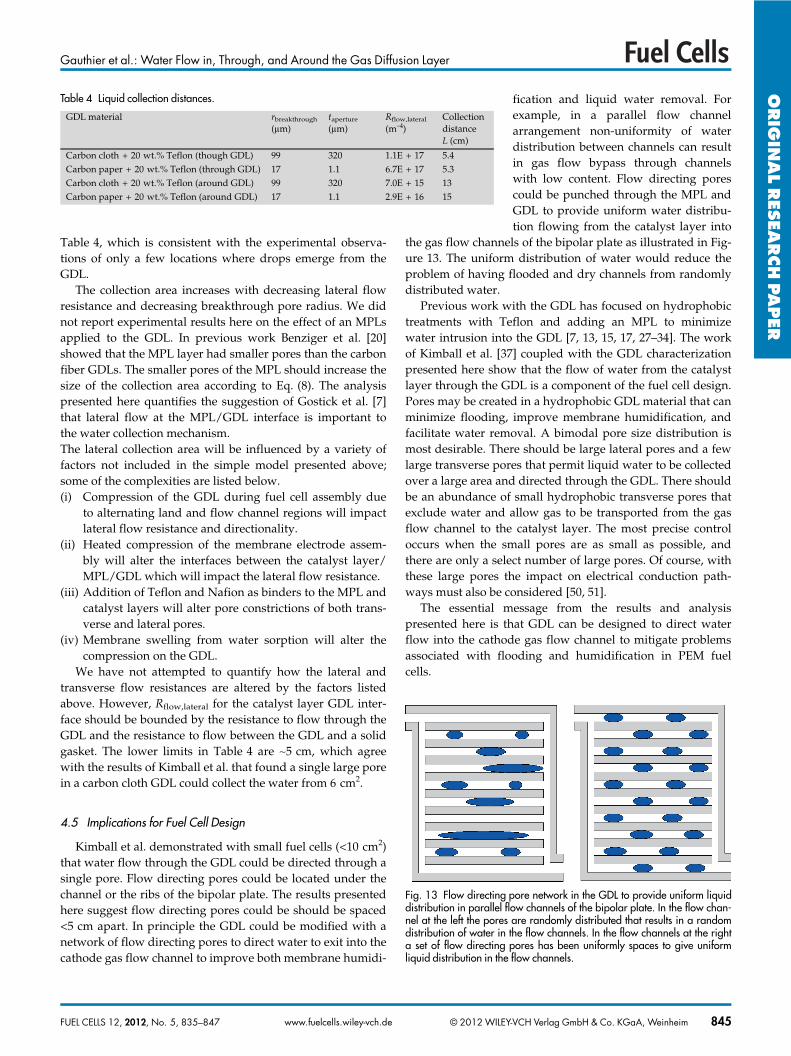
Kimball et al. [21] and McCain et al. [16, 49] have shownthat the water exits the GDL into the cathode gas flow chan-nel in a few distinction locations. The water must have movedlaterally in the catalyst layer or the GDL to be directedthrough a few specific pores. Over how large an area is the watercollected and directed through a transverse pore of the GDL? Fig-ure 12 illustrates water collection in two dimensions. TheGDL is represented as a series of transverse pores that con-nect the catalyst layer to the gas flow channel. At the interfacebetween the catalyst layer and the GDL there are a series oflateral pores (either through the GDL or at the GDL/catalystlayer interface). Water flow collected over a distance L will bedirected through a single transverse pore provided that thesum of the pressure drop due to lateral flow to the entry pointof the transverse pore plus the pressure drop due to flowthrough the transverse pore is less than the pressure requiredto penetrate a nearby pore.
DP� �lateral � DP� �transverse � DP� �penetration
lwQ8
pr4breakthrough
� �taperture � lwQRflow�lateralL �
2c cos hrbreakthrough
(7)
The collection distance is then given by Eq. (8).
L �1
Rflow�lateralrbreakthrough
2c cos hlwQ
� 8taperture
pr3breakthrough
� (8)
The liquid flow rate is equal to the current density (j) andcollection area (L2) divided by twice Faraday’s constant (F),Q = jL2/2F. Estimates of the collection distance for a currentdensity of 1 A cm–2 are summarized in Table 4 for differentscenarios of carbon paper or carbon cloth and the limitingflow resistance either through or around the GDL. The collec-tion lengths are >5 cm for all the scenarios presented in
Fig. 11 Flow through parallel pores in the GDL. Initial water breakthroughis through the pore with the smaller mean diameter that has a larger limit-ing aperture. If the hydrostatic pressure is increased the pore with the larg-er mean diameter is opened up for flow and greater flow is permitted.
Fig. 12 Water is forced through pores spaced at a distance where thepressure drop from the sum of the lateral and transverse flow is less thanthe pressure required to penetrate a pore. The pores colored in blue arethose filled with water transporting water from the catalyst layer to the gasflow channel. The pores colored white are not penetrated with water andremain open to transport oxygen from the gas flow channel to the catalystlayer.
Gauthier et al.: Water Flow in, Through, and Around the Gas Diffusion Layer
Table 4, which is consistent with the experimental observa-tions of only a few locations where drops emerge from theGDL.
The collection area increases with decreasing lateral flowresistance and decreasing breakthrough pore radius. We didnot report experimental results here on the effect of an MPLsapplied to the GDL. In previous work Benziger et al. [20]showed that the MPL layer had smaller pores than the carbonfiber GDLs. The smaller pores of the MPL should increase thesize of the collection area according to Eq. (8). The analysispresented here quantifies the suggestion of Gostick et al. [7]that lateral flow at the MPL/GDL interface is important tothe water collection mechanism.The lateral collection area will be influenced by a variety offactors not included in the simple model presented above;some of the complexities are listed below.(i) Compression of the GDL during fuel cell assembly due
to alternating land and flow channel regions will impactlateral flow resistance and directionality.
(ii) Heated compression of the membrane electrode assem-bly will alter the interfaces between the catalyst layer/MPL/GDL which will impact the lateral flow resistance.
(iii) Addition of Teflon and Nafion as binders to the MPL andcatalyst layers will alter pore constrictions of both trans-verse and lateral pores.
(iv) Membrane swelling from water sorption will alter thecompression on the GDL.
We have not attempted to quantify how the lateral andtransverse flow resistances are altered by the factors listedabove. However, Rflow,lateral for the catalyst layer GDL inter-face should be bounded by the resistance to flow through theGDL and the resistance to flow between the GDL and a solidgasket. The lower limits in Table 4 are ∼5 cm, which agreewith the results of Kimball et al. that found a single large porein a carbon cloth GDL could collect the water from 6 cm2.
4.5 Implications for Fuel Cell Design
Kimball et al. demonstrated with small fuel cells (<10 cm2)that water flow through the GDL could be directed through asingle pore. Flow directing pores could be located under thechannel or the ribs of the bipolar plate. The results presentedhere suggest flow directing pores could be should be spaced<5 cm apart. In principle the GDL could be modified with anetwork of flow directing pores to direct water to exit into thecathode gas flow channel to improve both membrane humidi-
fication and liquid water removal. Forexample, in a parallel flow channelarrangement non-uniformity of waterdistribution between channels can resultin gas flow bypass through channelswith low content. Flow directing porescould be punched through the MPL andGDL to provide uniform water distribu-tion flowing from the catalyst layer into
the gas flow channels of the bipolar plate as illustrated in Fig-ure 13. The uniform distribution of water would reduce theproblem of having flooded and dry channels from randomlydistributed water.
Previous work with the GDL has focused on hydrophobictreatments with Teflon and adding an MPL to minimizewater intrusion into the GDL [7, 13, 15, 17, 27–34]. The workof Kimball et al. [37] coupled with the GDL characterizationpresented here show that the flow of water from the catalystlayer through the GDL is a component of the fuel cell design.Pores may be created in a hydrophobic GDL material that canminimize flooding, improve membrane humidification, andfacilitate water removal. A bimodal pore size distribution ismost desirable. There should be large lateral pores and a fewlarge transverse pores that permit liquid water to be collectedover a large area and directed through the GDL. There shouldbe an abundance of small hydrophobic transverse pores thatexclude water and allow gas to be transported from the gasflow channel to the catalyst layer. The most precise controloccurs when the small pores are as small as possible, andthere are only a select number of large pores. Of course, withthese large pores the impact on electrical conduction path-ways must also be considered [50, 51].
The essential message from the results and analysispresented here is that GDL can be designed to direct waterflow into the cathode gas flow channel to mitigate problemsassociated with flooding and humidification in PEM fuelcells.
Fig. 13 Flow directing pore network in the GDL to provide uniform liquiddistribution in parallel flow channels of the bipolar plate. In the flow chan-nel at the left the pores are randomly distributed that results in a randomdistribution of water in the flow channels. In the flow channels at the righta set of flow directing pores has been uniformly spaces to give uniformliquid distribution in the flow channels.
Gauthier et al.: Water Flow in, Through, and Around the Gas Diffusion Layer
5 Conclusion
Water flow in, through and around carbon paper and car-bon cloth GDL materials has been studied. The GDL materi-als are hydrophobic and pressure must be applied to forcewater to intrude the pores of the GDL. Water flows throughthe path of least resistance.(i) Transverse water flow commences when the applied
hydrostatic pressure exceeds the Laplace pressure asso-ciated with the smallest aperture of the largest pore inthe GDL. The pressure drop for water flow through thepore is less than the pressure required for penetration ofthe smallest aperture. Water sequentially penetratessmaller pores as the hydrostatic pressure is increased.
(ii) The water flow rate at penetration through the largestpore in carbon paper is 100 times greater than predictedfor a uniform diameter cylindrical pore with radius equalto the penetration aperture; the transverse pores in car-bon paper have large mean diameters with penetrationlimited by small aperture necks.
(iii) The water flow rate at penetration through the largestpore in carbon cloth is approximately equal to that pre-dicted for a uniform diameter cylindrical pore withradius equal to the penetration aperture; the transversepores in carbon cloth have uniform diameters.
(iv) The resistance to lateral water flow through the GDL isapproximately the same as the resistance to transversewater flow.
(v) The resistance to water flow between the GDL surfaceand a smooth solid surface is 10 times less than the resis-tance to water flow through the GDL.
(vi) Water from areas >10 cm2 may be focused by liquidpenetration to flow through a single 100 lm transversepore of the GDL.
(vii)The collection of water through a flow directing pore net-work as a method to improve water management wasdescribed.
Acknowledgements
This material is based upon work supported by NationalScience Foundation Grant No. 0903661 “Nanotechnology forClean Energy IGERT.”
References
[1] P. Cheung, J. D. Fairweather, D. T. Schwartz, J. PowerSources 2009, 187, 487.
[2] J. D. Fairweather, P. Cheung, D. T. Schwartz, J. PowerSources 2010, 195, 787.
[3] J. D. Fairweather, P. Cheung, J. St-Pierre, D. T.Schwartz, Electrochem. Commun. 2007, 9, 2340.
[4] K. G. Gallagher, R. M. Darling, T. W. Patterson, M. L.Perry, J. Electrochem. Soc. 2008, 155, B1225.
[5] J. T. Gostick, M. W. Fowler, M. A. Ioannidis, M. D. Pritz-ker, Y. M. Volfkovich, A. Sakars, J. Power Sources 2006,156, 375.
[6] J. T. Gostick, M. A. Ioannidis, M. W. Fowler, M. D. Pritz-ker, Electrochem. Commun. 2008, 10, 1520.
[7] J. T. I. Gostick, A. Marios, M. W. Fowler, M. D. Pritzker,Characterization of the Capillary Properties of Gas Dif-fusion Media, in Modeling and Diagnostics of PolymerElectrolyte Fuel Cells (Eds.: U. Pasaogullari, C.-Y. Wang),Springer, New York, USA, 2010.
[8] I. R. Harkness, N. Hussain, L. Smith, J. D. B. Sharman,J. Power Sources 2009, 193, 122.
[9] J. Hinebaugh, A. Bazylak, J. Electrochem. Soc. 2010, 157,B1382.
[10] T. V. Nguyen, G. Lin, H. Ohn, X. Wang, Electrochem.Solid State Lett. 2008, 11, B127.
[11] A. Z. Weber, J. Power Sources 2010, 195, 5292.[12] M. Mathias, J. Roth, J. Fleming, W. Lehnert, Diffusion
Media Materials and Characterization, in Handbook ofFuel Cells – Fundamentals, Technology and Applications,Vol. 3 (Eds.: W. Vielstich, H. Gasteiger, A. Lamm), JohnWiley & Sons, London 2003.
[13] D. Bevers, R. Rogers, M. vonBradke, J. Power Sources1996, 63, 193.
[14] K. Jiao, B. Zhou, J. Power Sources 2007, 169, 296.[15] G. Y. Lin, T. Van Nguyen, J. Electrochem. Soc. 2005, 152,
A1942.[16] B. A. McCain, A. G. Stefanopoulou, J. B. Siegel, J. Dyn.
Syst. Meas. Control-Trans. ASME 2010, 132, 061303-1.[17] G. G. Park, Y. J. Sohn, T. H. Yang, Y. G. Yoon, W. Y. Lee,
C. S. Kim, J. Power Sources 2004, 131, 182.[18] L. J. Yang, W. A. Li, X. Z. Du, Y. P. Yang, J. Fuel Cell Sci.
Technol. 2010, 7.[19] E. Gauthier, T. Hellstern, I. G. Kevrekidis, J. Benziger,
ACS Appl. Mater. Interfaces 2012, 4, 761.[20] J. Benziger, J. Nehlsen, D. Blackwell, T. Brennan, J. Ites-
cu, J. Membr. Sci. 2005, 261, 98.[21] E. Kimball, T. Whitaker, Y. G. Kevrekidis, J. B. Benziger,
AIChE J. 2008, 54, 1313.[22] J. Eller, T. Rosen, F. Marone, M. Stampanoni, A. Wo-
kaun, F. N. Buchi, J. Electrochem. Soc. 2011, 158, B963.[23] S. Litster, D. Sinton, N. Djilali, J. Power Sources 2006,
154, 95.[24] Z. J. Lu, M. M. Daino, C. Rath, S. G. Kandlikar, Int. J.
Hydrogen Energy 2010, 35, 4222.[25] S. Park, B. N. Popov, Electrochim. Acta 2009, 54, 3473.[26] S. Park, B. N. Popov, Fuel 2011, 90, 436.[27] S. Park, B. N. Popov, Fuel 2009, 88, 2068.[28] Z. Fishman, A. Bazylak, J. Electrochem. Soc. 2011,
158, B841.[29] J. Lobato, P. Canizares, M. A. Rodrigo, C. Ruiz-Lopez,
J. J. Linares, J. Appl. Electrochem. 2008, 38, 793.[30] J. H. Nam, K. J. Lee, G. S. Hwang, C. J. Kim, M. Ka-
viany, Int. J. Heat Mass Transfer 2009, 52, 2779.[31] H. K. Atiyeh, K. Karan, B. Peppley, A. Phoenix, E. Hal-
liop, J. Pharoah, J. Power Sources 2007, 170, 111.