Università degli Studi di Cagliari DOTTORATO DI RICERCA Scienze e Tecnologie Chimiche e Farmaceutiche Ciclo XXIII Structural and morphological characterization of hydrozincite and its interaction with organic molecules Settore scientifico disciplinare di afferenza CHIM/2-Chimica Fisica Presentata da: Dott.ssa Roberta Sanna Coordinatore Dottorato Prof. Mariano Casu Relatore Prof. Mariano Casu Esame finale anno accademico 2009 - 2010
Transcript
Università degli Studi di Cagliari
DOTTORATO DI RICERCA
Scienze e Tecnologie Chimiche e Farmaceutiche
Ciclo XXIII
Structural and morphological characterization of hydrozincite and its
interaction with organic molecules
Settore scientifico disciplinare di afferenza
CHIM/2-Chimica Fisica
Presentata da: Dott.ssa Roberta Sanna
Coordinatore Dottorato Prof. Mariano Casu
Relatore Prof. Mariano Casu
Esame finale anno accademico 2009 - 2010
i
ii
Abstract
The morphological diversity and complexity of naturally occurring forms and
patterns have been a motivation for humans to copy and adopt ideas from Nature
to achieve functional, aesthetic and social value. Common biogenic materials, such
as biominerals, constructed with mineral phases and an organic matrix exhibit
delicate structure with unusual optimal chemical-physical, morphological and
mechanical properties, and have inspired ideas for the design and synthesis of
biomimetic functional materials. The organic templates play an important role in
directing assembly of the mineral/organic composites, and in controlling the
nucleation and subsequent crystallization. Consequently, knowledge about the
molecular interactions at mineral/organic interfaces is essential for understanding
the principles of the organic-matrix-mediated biomineralization process.
The microscopic properties of biomineral hydrozincite [Zn5(CO3)2(OH)6] from
Naracauli Creek (SW Sardinia) were investigated by using X-ray Diffraction (XRD),
Fourier Transform Infrared (FT-IR), Nuclear Magnetic Resonance (NMR), Scanning
Electron Microscopy (SEM), and High-Resolution Transmission Electron
Microscopy (HR-TEM) and the organic matrix present has been extracted and
characterized by using Fourier Transform Infrared (FT-IR).
In the context of molecular interactions at mineral/organic interfaces we describe
an experimental study of the interaction of Bis(2-ethylhexil)phthalate (DEHP) with
hydrozincite. This interaction, under controlled laboratory experiments, was
investigated by using Fourier Transform Infrared (FT-IR) and Nuclear Magnetic
Resonance Spectroscopy (NMR).
iii
iv
Acknowledgement
First, I would like to thank my supervisor Prof. Mariano Casu. He has given me the
opportunity to explore the world of science and research in a really working
environment. His enthusiasm for all the aspects of research was contagious,
always helping me to do my best. His guidance, I could learn and explore several
aspects of biomineralization and the interaction between minerals and organic
molecules, applying different techniques for structural characterization.
I would really like to thank Prof. Anna Musinu for her help during my academic
career. She has nicely and patiently answered to all of my questions, even the
silliest ones. In particular, I would like to thank her for the valuable contribution to
my first scientific publication.
I want also to thank Dr. Giovanni De Giudici, Dr. Francesca Podda, Dr. Elodia
Musu, Dr. Riccardo Tombolini and Dr. Carla Cannas who contributed to my first
paper making it possible.
In particular, I would like to thank Dr. Carla Cannas and Dr.Andrea Ardu for the
XRD, TEM and HRTEM, Dr. Elodia Musu for the SEM and Dr. Marzia Fantauzzi for
the XPS experiments, as well as Prof. Constantino Floris who helped me often with
the organic chemistry involved in my job. Many thanks to Brian Phillips of the Stony
Brook University for having hosted me in his group, where I could enlarge my
knowledge and experise on the Nuclear Magnetic Resonance, but also, giving me
a valuable opportunity of personal growth.
During these three years I enjoyed discussing about science, as well as many
other aspects of my life as Ph.D student, with Federica Orrù, Mauro Mureddu,
Andrea Ardu, Alessandro Valente, Carla Cannas, Andrea Scorciapino, Cristina
Piras, Marzia Fantauzzi and Davide Peddis, who largely contributed to my scientific
and personal growth.
v
Also, I would like to thank the Bachelor and Master students I worked with:
Biomineralization mechanisms are not completely clear (Mount et al., 2004), their
understanding may provide models for new material, inspired design solutions and
give new insight into the genetic control of biological structure (e.g. Schäffer et al.,
1997). The mechanism of biomineralization are poorly understood at the molecular
level, in the bone, shell and some bacterial filaments, the organic matrix direct the
formation of specific crystal phase, habit, size and orientation of the mineral. In the
Figure 1.2 is shows a biomineralization paradigm (Gilbert et al., 2005), but is not
generalized and it is a simply intended to guide our reasoning and gives a visual
model, however, it not included all biomineralization systems. To this day, the
organic molecular components have been identified in only few biominerals. This
paradigm, therefore, is to be interpreted as a conceptual mechanism, not a detailed
model of interaction between known molecules. This paradigm can simplify the
idea of the organic mineral interface and the chemical bonds at the interface. In
BCM and BIM process (Lowenstam, 1981) the organic components are formed
first, then these bind a few ions, which serve as nucleation sites for crystal growth
(Lowenstam and Weiner, 1989; Falini et al., 1996). In Figure 1.2, the organic matrix
(A) is composed from macromolecules which depending on the particular
biomineral may include a single organic molecule, e.g., a polysaccharide or a
complex arrangement of proteins and glycoproteins. In all cases the organic
components have charged functional groups that attract ions from solution (B). The
steric arrangement of organic macromolecules, their sequence, and folding
determines the precise position in three dimensions of the ions. Such positions are
only compatible with a specific mineral, even more: they are only compatible with a
well-determined polymorph of a specific mineral (C).
11
The crystal structure shown (C) is aragonite, the large white ions in (B) are Ca2+
,
while the small-white and large-dark atoms are C and O, respectively in (C). In (D)
is showed the zoom of the organic mineral interface, the inner-atomic bonds are
indicated by dashed lines.
Figure 1.2 The organic matrix (A) is composed of macromolecules, the organic components have charged functional groups that attract ions from solution (B). The steric arrangement of organic macromolecules, their sequence, and folding determines the precise position in three dimensions of the ions. Such positions are only compatible with a specific mineral, even more: they are only compatible with a well-determined polymorph of a specific mineral (C).The crystal structure shown (C) is aragonite, the large white ions in (B) are Ca
2+, while
the small-white and large-dark atoms are C and O, respectively in (C). (D) Zooming in on the organic-mineral interface: the inter-atomic bonds are indicated by dashed lines.
Several authors suggest that the negatively charged amino acids, aspartate and
glutamate, along their proteins sequences attract positive ions from solution and
iniziate crystal nucleation and growth (Mann, 2001; Weiner and Dove, 2003; Gotliv
et al., 2005). The concentration of amino acid usually constitute between 30 and 40
mol% of the protein matrix. Gotliv et al. (Gotliv et al., 2005) show that the “Asprich”
12
family of proteins from the bivalve mollusk Atrina rigida contained more than 50
mol% of aspartate and 10 mol% of glutamate. For this reason, the paradigm by
which negatively charged amino acid collect ions from solution provide the
nucleation sites and direct growth biomineralization, is very interesting.
1.4 The role of mineral in the pollution immobilization
Minerals play an important role in the regulation of contaminants in ecosystems. In
fact they can attenuate potentially toxic concentrations of contaminants and
accordingly diminish the risk of surface water and groundwater contamination. For
instance, silicates and oxides can adsorb organic pollutants, promoting their
degradation to nontoxic forms, attenuating their movement through the
environment, or preventing their uptake by plants and their introduction into the
food chain. The characteristic of minerals as particle distribution, high specific area,
structural order-disorder, and chemical groups in the surface make them highly
reactive and permitted strong physical and chemical interaction with pollutant
species, but at the other and also the physical chemical properties of the organic
pollutant are dedicate by the structure of the molecule and the nature of the atom
present in it, have an important role in the interactions.
For example, an important feature of clay minerals is the presence of structural
negative charges, which enables clay minerals to adsorb different kind of
molecules, especially organic and inorganic cations (Rytwo et al., 2002; Gürses et
al., 2004; Lombardi et al., 2006), and at very low pH, the edges of 2:1 and 1:1 clay
minerals carry a positive charge, which makes them capable to interact with
anionic compounds. Fe, Al, Mn, Si and Ti oxides exhibit variable or pH-dependent
surface charge, which is due to the amphoteric character of their surface hydroxyl
groups. As a result, most oxides exhibit positive charge at low pH and negative
13
charge at high pH. Oxides with high point of zero charge, e.g. for goethite and
hematite between pH 6-9, are therefore important adsorbents for anionic organic
and inorganic substances (Cornell and Schwertmann, 2003). The quantification
and understanding of immobilization mechanisms are of fundamental significance
for predicting the fate of organic contaminants in a specific environment. In
addition, knowledge about these mechanisms is essential for the development of
efficient methods for contaminated soil and aquifer remediation. Sorption is
generally the strongest interaction mechanism and can affect the fate of a
contaminant in a number of ways. Apart from affecting mobility, and the potential
for a contaminant to reach groundwater, sorption can affect the biodegradation and
toxicity of a compound by influencing the bioavailability (Allard and Neilson, 1997;
Guo, et al., 2000; Eggleton and Thomas, 2004; Arias-Estevez et al., 2008). There
are generally many intermolecular interactions involved in sorption, but the
dominant processes depend on chemical-specific properties, such molecular size
and configuration, and polarity or lipophilicity, as well as mineral-specific properties,
such as pH, surface groups and structural disordered.
For example, for polar contaminants, surface interactions include ionic and/or
covalent and hydrogen bonding. Anionic contaminants are only weakly sorbed by
minerals with permanent charge, such as clays, because they are electrostatically
repulsed from negatively charged surfaces. Cationic contaminants are strongly
sorbed on permanent negatively charged clay mineral surfaces by cation
exchange. They interact much more strongly with the solid phase of soils and
sediments than anionic ones, since ionisable organic-matter moieties and clay
mineral surfaces are generally neutral or negatively charged over the pH range
found in the environment.
However, for non-polar contaminants, the non-polar hydrophobic domains of
organic matter provide important sorption sites and binding through hydrophobic
14
interactions (Van der Waals forces) will dominate the contaminant sorption
(Wauchope et al., 2002; Semple et al. 2003). Sorption of hydrophobic organic
contaminants to soil organic matter may be controlled by the amount of aromatic
carbon (Abelmann et al., 2005), aliphatic carbon (Simpson et al., 2003, Chen et al.,
2007), or the polarity of the soil organic matter (Tanaka et al., 2005). Müller et al.
(2007) showed that also mineral surfaces could significantly contribute to the
retention of hydrophobic organic contaminants, especially in subsurface soil
horizons and aquifer sediments with small amounts of organic matter. The link
between structure and physico-chemical properties of geosorbents and sorption
activity of hydrophobic organic pollutants upon interaction with solid matrices has
been established recently (Ehlers and Loibner, 2006). The conclusions are from
high importance for studies on risk assessment and remediation. Currently
research has focused on the development of low cost and highly reactive
innovative materials. These modified natural or designed materials can be very
useful in treating aqueous systems, including wastewater and aqueous waste
streams, by removing undesired substances. In addition, it might be possible to
incorporate or inject these materials into soil and subsoil, in order to enhance the
sorption and retention of organic contaminants. From these studies it can be
concluded that operative mechanisms for any particular interaction between
contaminants, soil constituents and soil biota depends on the nature and properties
of the soil surfaces, the chemistry of the system (e.g. pH, kind of exchangeable
cations, water saturation degree) and the chemical nature of the organic
contaminant.
15
1.5 Objectives
The main purpose of this study was to investigate and gain understanding of the
fascinating word of biominerals and their interaction with organic molecules.
The first part of the thesis presents the structural and morphological
characterization of biomineral hydrozincite and inorganic hydrozincite. This
biomineral is a zinc carbonate [Zn5(CO3)2(OH)6] that has been found in a mine
environment at Naracauli creek (Sardinia, Italy) in association with cyanobacteria
(Scytonema sp.) and algae (Chlorella) (Podda et al., 2000). At Naracauli creek, as
already shown in the literature, the precipitation of this biomineral results in the
abatement of zinc concentration from hundreds ppm to few ppm in few hundred
meters downstream. The presence of organic matter and the structural differences
compared to inorganic mineral surface is presented is highlighted.
In the second part of the thesis the study has been devoted to the physics
chemical study of the interaction between synthetic hydrozincite and several
phthalate. The problem of phthalate was born later when during investigation of the
molecular-level basis of biomineralization, we found the presence of bis-(2-
ethylexyl)phthalate (DEHP) in some of the in-vitro synthesized samples. The DEHP
was released by the tubing in PVC used for the synthetic preparation and capture
by the mineral synthetic surface. The DEHP have an important role in the
environmental sounds, due to the human health risk.
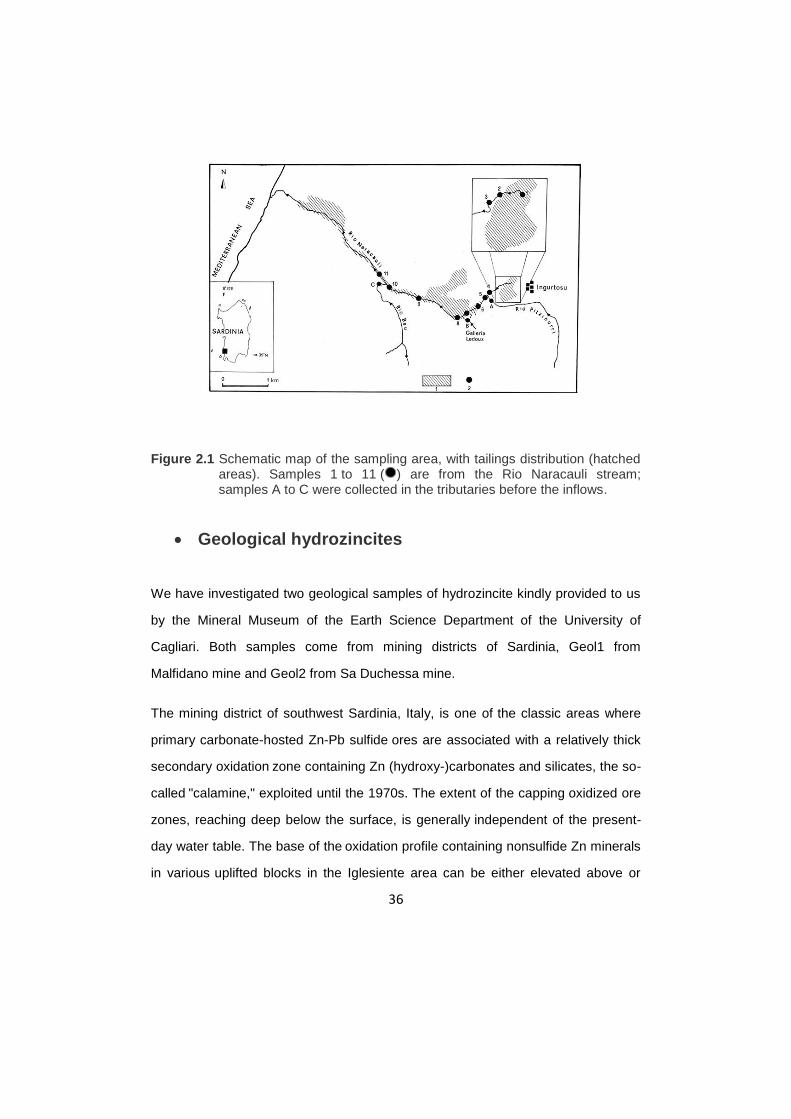
Hydrozincite [Zn5(CO3)2(OH)6] is a mineral formed in the oxidized zones of zinc
deposits and is found as masses or crusts and is often not readily observed and
may be confused with other minerals such as calcite. The mineral is often
associated with other minerals such as smithsonite, calcite, hemimorphite,
aurichalcite (Anthony et al., 2003).
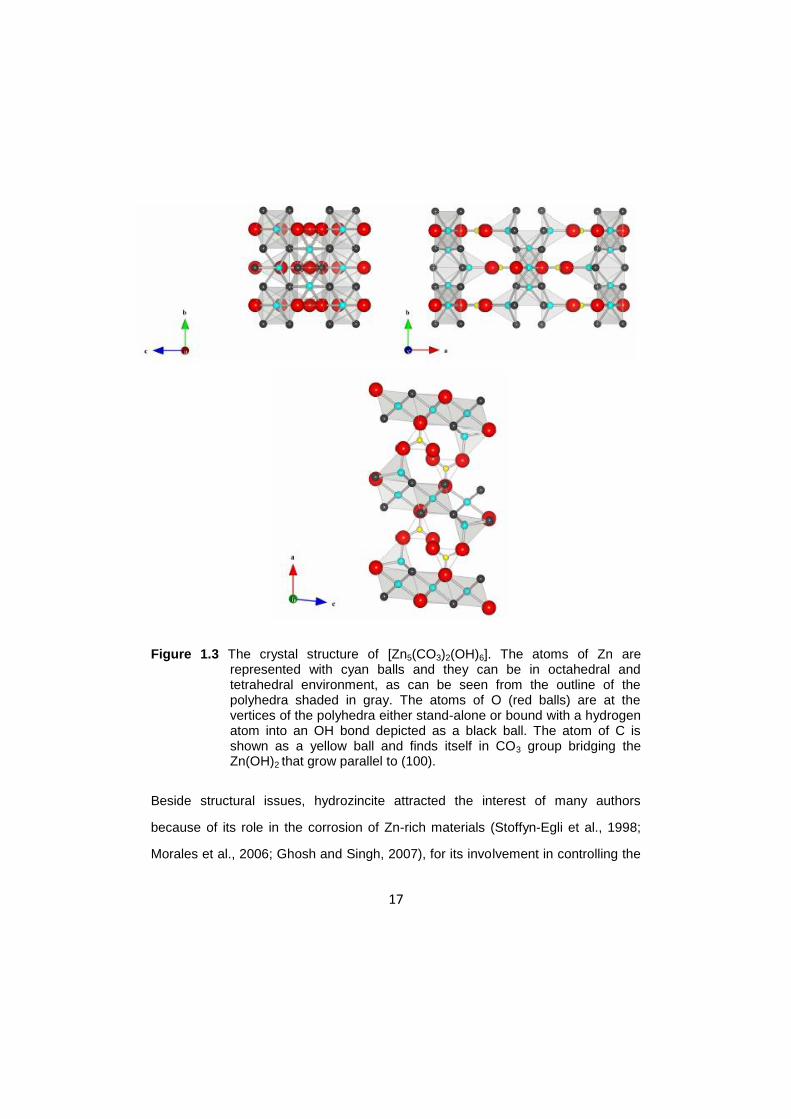
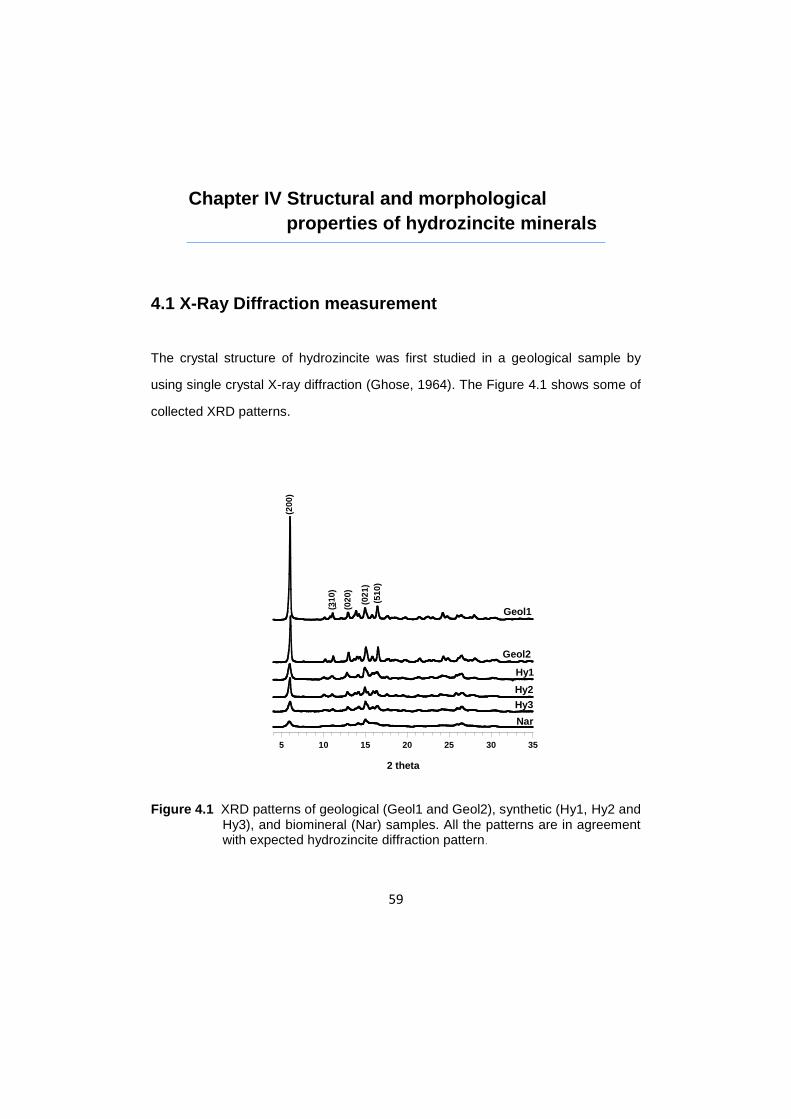
The crystal structure of hydrozincite was first studied in a museum sample by
Subrata Ghose in 1964 (Ghose, 1964) using single crystal X-ray diffraction. The
structure is monoclinic with a0=13.62, b0=6.30, c0=5.42 A, β = 95°50’, the space
group is C2/m. There are two Zn sites, one in octahedral and one in tetrahedral
coordination as shown in Figure 1.3. The octahedral sites outnumber the
tetrahedral in the 3:2 ratio. Zinc atoms in tetrahedral coordination occur above
holes that are present in sheets of octahedral zinc atoms. CO3 groups are binding
the sheets parallel to (100). Out of the three oxygen atoms in the CO3 group the
first is bonded to an octahedral, the second to the tetrahedral oxygen site while the
remaining one is hydrogen bonded to three OH groups. The tetrahedral Zn-O
distance is limited to 1.95 Å and is significantly smaller than the octahedral Zn-O
distance at 2.10 Å. This author found also that synthetic crystals of hydrozincite
have low crystallinity, and speculated that plane defects are the likely cause for the
observed decrease in crystal order. After Ghose other authors studied the mineral
hydrozincite, Infrared spectra from several hydrozincite specimens can differ
significantly and show peak broadening (Jambor, 1966; Zabinsky, 1966). This
difference was explained to the contributions of different plane defects. Conversely,
Jambor (1964) and, more recently, Hales and Frost (2007) proposed that hydrous
zinc carbonate could have two, or more, polymorphs.
17
Figure 1.3 The crystal structure of [Zn5(CO3)2(OH)6]. The atoms of Zn are represented with cyan balls and they can be in octahedral and tetrahedral environment, as can be seen from the outline of the polyhedra shaded in gray. The atoms of O (red balls) are at the vertices of the polyhedra either stand-alone or bound with a hydrogen atom into an OH bond depicted as a black ball. The atom of C is shown as a yellow ball and finds itself in CO3 group bridging the Zn(OH)2 that grow parallel to (100).
Beside structural issues, hydrozincite attracted the interest of many authors
because of its role in the corrosion of Zn-rich materials (Stoffyn-Egli et al., 1998;
Morales et al., 2006; Ghosh and Singh, 2007), for its involvement in controlling the
18
mobility of zinc in soils (Uygur and Rimmel, 2000) and waters (Mercy et al., 1998;
Podda et al., 2000; Zuddas and Podda, 2005). Occurrence of hydrozincite forming
in Zn-polluted calcareous soils was recently found by Jacquat et al. (2008). In
addition, bioprecipitation of hydrozincite could represent an alternative biological
approach for bioremediation of zinc-contaminated waters. A zinc carbonate,
hydrozincite [Zn5(CO3)2(OH)6], has been found in a mine environment at Naracauli
creek (Sardinia, Italy) in association with cyanobacteria (Scytonema sp.) and algae
(Chlorella) (Podda et al., 2000). At Naracauli creek, as already shown in the
literature, the precipitation of this biomineral results in the abatement of zinc
concentration from hundreds ppm to few ppm in few hundreds meters downstream.
In addition, the bioprecipitation is also effective in the uptake of other heavy metals
(Cd, Pb, etc) that are concentrated in the precipitate sediments.
1.7 Phthalates and Bis-(2-ethylexyl)phthalate
Phthalate esters are a large group of chemical compounds that are frequently used
as plasticizers, solvents, and adhesives cosmetics, pesticides, building
maintenance products, lubrificants, and personal care goods that surround
consumers at home, work, and in hospitals (Kato et al., 2004).
Phthalates are principal components of flexible polyvinyl chloride (PVC) products.
PVC, after polyethylene is the second most widely used thermoplastic polymer, this
material without additive is inherently a rigid and brittle material, requiring large
amounts of plasticizer to make flexible products. In fact, approximately 90% of
global plasticizer production is destined for use in PVC plastic (Bizzari et al., 2000;
Houhhan and Wiles, 2000). The remaining 10% is used in other applications as
Willker, W., Leibfritz, D., Kerssebaum, R., Bermel, W. Gradient selection in
selection in inverse heteronuclear correlation spectroscopy. Magn. Reson.
Chem., 31, 287–292 (1993).
47
Chapter III High Resolution Solid-State 13C Nuclear Magnetic
Resonance Spectroscopy
3.1 Introduction
The utilization of Nuclear Magnetic Resonance (NMR) techniques for the structural
characterization has a very long tradition (Kogel-Knabner, 1997; Wilson et al.,
1981). The advent of modern solid-state NMR spectrometers, which are capable of
producing liquid-like spectra, ushered in a new era of organic matter
characterization. A major attraction of this technique is the fact that samples can be
analyzed often times without any prior pretreatment, thus rendering solid state
NMR a non-destructive approach to characterization without the production of
artifacts.
Although solid-state NMR spectroscopy has these added advantages, several
disadvantages do exist. Larger quantities of material are needed to perform NMR
in the solid-state (~ 70-200 mg). Already an insensitive technique, solid-state NMR
gives very low and broad signals such that much more accumulation time is
needed to obtain spectra with reasonable S/N ratios. Despite these limitations,
several techniques have been developed to overcome these shortcomings,
principally cross-polarization with magic angle spinning (CPMAS) and high power
proton decoupling (HPDEC). The theory of NMR has been widely reported and the
following discussion will be adopted from several sources (Hays, 1982; Schaefer et
al., 1975).
13C is the most common nucleus studied in geochemical materials and the focus of
this dissertation, although a variety of other nuclei such as 15
N and 31
P are
available for investigation. Since NMR is considered an insensitive technique, the
48
concentration of the particular element under study in the sample, as well as its
natural abundance, is of importance. Also, characteristics of the nuclei of interest
are critical such as the gyromagnetic ratio, γ, where nuclei with small values are
much more difficult to detect because they have small nuclear dipole moments.
3.2 Magic Angle Spinning
One of the problems encountered in solid-state NMR spectroscopy is that of
chemical shift anisotropy (CSA). It has been shown (Wilson, 1987) that the
chemical shift observed in the solid state can be expressed as:
σobs = 3/2σisosin2θ + 1/2(3cos
2θ -1) Σpσpcos
2p
where p are the angles of the nuclei axes of rotation to the principal axes and σp
are the various chemical shift tensors. Since chemical shift is a tensor, there are
three chemical shift components (x,y,z planes), which in most cases are not
identical. Upon performing NMR on static samples where all possible orientations
of these tensors exist, powder patterns are produced which are associated with
broad resonances due to this anisotropy.
In order to remove CSA, the sample is spun at the magic angle of 54.7° relative to
the external magnetic field Bo (z axis) (Schaefer and Stejskal, 1976; Schaefer and
Stejskal, 1977). The effect on the chemical shift can be understood mathematically
that if θ = 54.7°, we recognize that 3cos2(54.7)-1 is equal to zero.
Then σobs = σiso. σiso is the isotropic chemical shift characterized by sharp
resonances which are naturally obtained in solution-state NMR where molecular
tumbling allows for these orientational effects on chemical shifts to be averaged.
49
Therefore, MAS mimics this molecular motion and allows liquid-like spectra to be
obtained on solid samples.
Since the chemical shift of a particular 13
C environment is dependent on the
orientation of the parent molecule with respect to the external magnetic field, the
MAS rate must have a greater frequency than the frequency range of the chemical
shift in the static powder sample. If this is not the case, several spinning sidebands
will be observed in addition to a sharp central peak for a particular chemical shift.
These sidebands are located on both sides of the center signal at integral multiples
of the MAS rate and extend over the entire frequency rage of the chemical shift in
the static solid state spectrum.
3.3 High Power Proton Decupling
High power proton decoupling (HPDEC) (Bloch, 1958), in conjunction with magic
angle spinning, removes 13
C-1H dipolar interactions. These same interactions,
which allow for efficient cross-polarization, also cause severe broadening in solid-
state spectra due to the 99% abundance of the 1H nucleus. As the
13C nucleus is
rare, almost all of this broadening arises from interaction with neighboring protons.
Proton decoupling in solution-state NMR is a familiar technique, but the application
to solids requires much greater power (100W vs. 10W or less) because the 13
C-1H
interaction is much stronger. HPDEC is achieved by applying continuous high
power at frequencies comparable to the proton line widths, usually tens to
hundreds of kHz (Schaefer et al. 1975), for the whole duration of 13
C data
acquisition. 13
C-1H dipolar interactions result from the through space interaction
between 13
C and 1H magnetic dipoles. This interaction modifies the
13C spectrum
because 1H dipoles change the effective Bo at the
13C nucleus by adding to it (
1H
dipoles align with Bo) or by subtracting from it (1H dipoles align against Bo). The
50
magnitude of the interaction is dependent on the distance between carbons and
protons and on their orientation with respect to Bo. The dipolar interactions spread
a particular
13C NMR frequency over a wide range in the solid-state
13C NMR spectrum.
HPDEC effectively flips the 1H dipoles rapidly, aligning them with and against Bo,
thus averaging the dipolar 13
C-1H interaction. The frequency range of carbon
functional groups, which experience dipolar interactions, now spans a smaller
range, and thus narrower resonances can be observed.
3.4 Cross-Polarization
Cross-polarization allows the low natural abundance of the 13
C nucleus to be
overcome in a way far superior to DP-MAS (Direct Polarization). Unlike solution
state NMR, proton NMR in the solid-state of these materials gives broad,
featureless signals due to very strong 1H-
1H dipolar interactions (Sullivan and
Maciel, 1982). The cartesian coordinate representation for a typical CPMAS
experiment is seen in Figure 3.1. When proton nuclei are placed in a magnetic
field, the magnetic dipoles of these nuclei align themselves with (low energy) or
against (high energy) the magnetic field, Bo, according to the Boltzmann
distribution. However, as more nuclei align themselves in the low energy
configuration, a net magnetization, MoH, develops along the z axis. A 90° proton
radiofrequency (rf) pulse is then applied along x’, after which each M1H (proton
magnetization) points along y’.
51
Figure 3.1 Cross-Polarization scheme showing magnetization vectors during a
CPMAS experiment: (a) proton magnetization along +z’ axis at equilibrium (b) magnetization tipped along y’ after 90° pulse along x’ from (a) (c) spin-locking of proton magnetization along y’.
An rf proton spin lock with magnitude B1H is immediately applied along y’ such that
the magnetization M1H is now forced to rotate (locked) about y’ with a frequency
given by:
ν1ρH = γHB1H/2π
where γH is the gyromagnetic ratio of the protons. Without the presence of B1H,
each M1H would spread out in the x’y’ plane (1H NMR plane) because each M1H
corresponds to a different 1H NMR frequency and each M1H starts to move out of
the x’y’ plane because of spin-lattice (T1) relaxation. If B1H is left on indefinitely, the
magnitude of each M1H will gradually decrease because of spin-lattice relaxation in
the rotating frame (T1ρ) as well.
In the cross-polarization experiment, a 13
C spin lock with magnitude B1C is applied
simultaneously along the x’’y’’ plane (13
C NMR plane). If the magnitude of B1C is
adjusted to a matching condition known as Hartmann-Hahn (Hartmann and Hahn,
1962) given by:
52
γHB1H = γCB1C
where γH and γC are the gyromagnetic ratio of proton and carbon, respectively, and
B1H and B1C represent the spin locking rf of protons and carbons, respectively, then
a rapid transfer of magnetization between 1H and
13C can occur. Since at the start
of the 1H and
13C spin locks, M1H equals MoH (proton magnetization along z axis
before 90o
pulse) and M1C equals zero, magnetization is transferred from 1H to
13C
nuclei. 13
C dipoles that initially contributed towards MoC are forced to re-orient
themselves in a non-zero M1C component at the expense of the 1
H dipoles that
contributed towards M1H. This magnetization transfer is known as cross-
polarization (Pines et al., 1973) and is defined by a time constant TCH.
The time duration of the matched spin locks is termed the contact time. At the end
of the contact time, the spin locks are turned off and the 13
C M1 components are
detected in the presence of high power proton decoupling. For CP from 1H to
13C
with the matching condition met, the signal intensity of each 13
C spectral
component, M1C, as a function of the contact time, t, is given by:
by Origin 5.0 program from Microcal Software, for each collected diffraction spectra
the dimension has been calculated by fitting of the main reflections.
The averages sized calculated on the main reflection were ~21 nm for Geol1, ~19
nm for Geol2, ~14 nm for Hy2, ~10 nm for Hy1, ~9 nm for Hy3 and ~7 nm for Nar.
Thus, the progressive decrease in the size of crystal coherent domains should be
dependent on the structural evolution of the minerals and/or on the crystallinzation
process. Specifically, the persistence of the nanocrystals should be explained
according to the mechanism on an imperfect oriented aggregation of nanoparticles
(Meldrum and Cölfen, 2007).
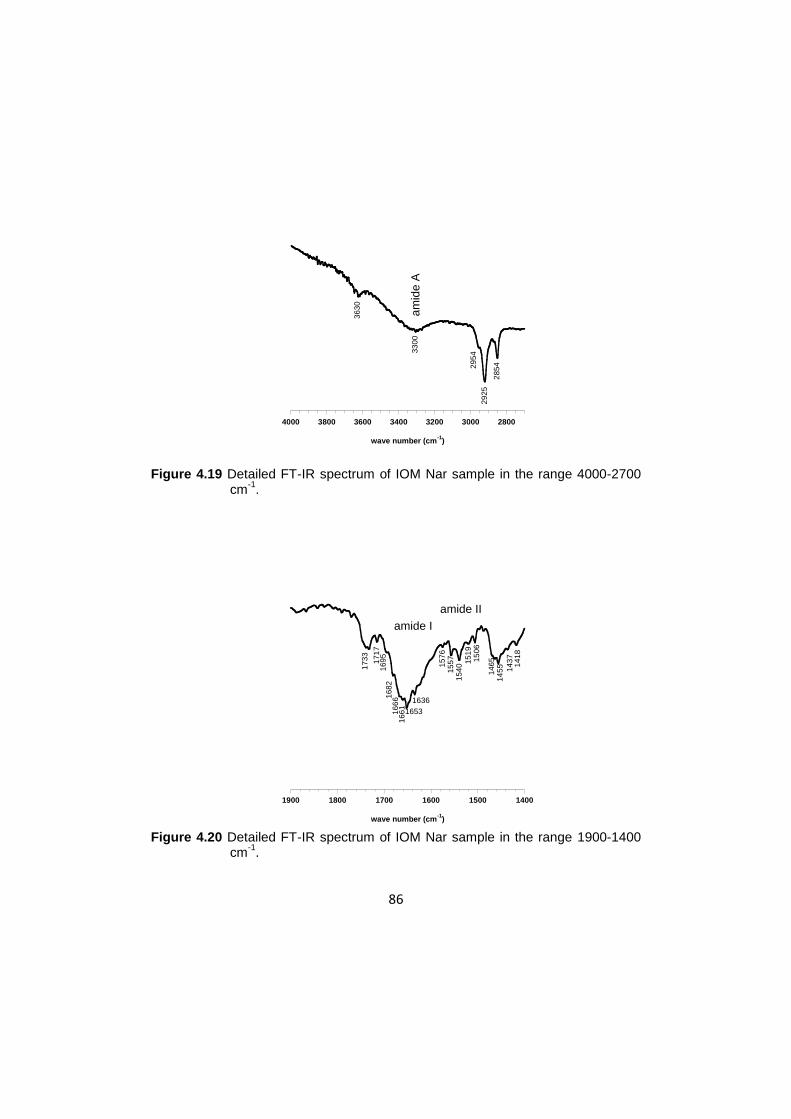
4.2 Infrared Spectroscopy investigation
Infrared spectroscopy is usually applied in the investigation of both inorganic and
organic materials (Hasse et al., 2000; Wang et al., 2003). It allows the identification
of characteristic functional groups in molecules that correspond to specific
molecular vibrations (Conley, 1966). In addition, sampling is easy and requires a
small amount of materials (about 1 mg). FT-IR has also been applied for comparing
the organic composition of different molluscan shells (Dauphin, 1999; Dauphin et
al., 2008). The main features of all FT-IR spectra in the range 400 – 1800 cm-1
are
shown in the Figure 4.2.
62
Figure 4.2 FT IR spectrum for geological samples (Geol1 and Geol2), synthetic
samples (Hy1, Hy2 and Hy3), and biomineral sample (Nar).
The carbonate vibrational stretching and bending of hydrozincite are attributed in
comparison with the literature attributions (Music’ et al., 2002), and the main peaks
are shown in Table 4.1. For comparison the IR peaks of carbonate groups taken
from (Music’ et al., 2002) are show in the Table 4.1. The four peaks in the region
1520–1390 cm−1
are ascribed to the asymmetric CO32-
stretching ν3 mode (the
correlation field splitting is well observed in the spectrum). The peak at 1047 cm-1
is
assigned to the ν1 symmetric CO32-
stretching mode. The strong and sharp peaks
at 836 cm−1
is assigned to ν2 out-of-plane OCO bending mode and that at 709
cm−1
is assigned to ν4 asymmetric OCO bending mode. All the samples show
bands in the range 2900-3600 cm-1
which can be ascribed to the water molecules
and to the OH stretching modes. Both museum samples exhibit in the 2900-3600
5001000150020002500300035004000
Geol1
Geol2
Hy1
Hy2
Nar
Hy3
wave number (cm-1
)
63
cm-1
region a broad signal with on the top three peaks observed at 3235, 3298,
3382 cm-1
in Geol1 and at 3235, 3301, 3379 cm-1
in Geol2.
Mode Z4a Geol1 Geol2 Hy1 Hy2 Hy3 Nar
v1 1047 1047 1047 1046 1046 1046 1046
v2 837 836 836 835 835 834 835
v4 710 709 709 709 709 709 709
v3 1362 1363 1351 1354 1355 1345
v3 1387 1389 1389 1386 1382 1386 1380
v3 1511 1506 1501 1505 1508 1510 1509
v3 1549 1548 1546 1547 1550 1555 1556
3234 3235 3235 3300 3300 3368 3369
vOH 3303 3298 3301 3562 3566 3569 3569
3363 3282 3379
Table 4.1 FT IR frequencies (cm-1) of Hydrozincite samples compared with sample Z4 taken from Music´ et al. (2002).
These peaks are in very good agreement with that reported in literature: 3234,
3303 and 3363 cm-1
(Music et al., 2002) and attributed to the structured OH groups
in hydrozincite. In this mineral, two oxygen atoms of the carbonate group are
bonded to an octahedral and tetrahedral zinc atom each, whereas the third oxygen
atom is hydrogen bonded to three OH groups. The hydrogen bonds present are of
different strength, in spite of the similar hydrogen bond lengths, due to the different
hydrogen bond acceptor strengths of the carbonate oxygen atoms (Schmidt and
Lutz, 1993). This means that the stretching vibrations of the structural OH groups in
hydrozincite should show three types of interactions in chemical bonding. In the IR
spectrum of all the other samples in Figure 4.2, two broad bands centred at about
3500 cm-1
and 3300 cm-1
can be observed. These indicate the presence of large
64
amount of adsorbed water on the surface of the hydrozincite. The broad absorption
bands at 1640 cm-1
, assigned to the bending of water molecules, demonstrate the
presence of molecularly adsorbed water in the crystal. The stretching vibrations
corresponding to the structural OH group, which contributes to the IR band
between 3200 – 3400 cm-1
, are not resolved in these samples.
The geological samples present a gradual separation of the IR bands
corresponding to the structural OH groups in [Zn5(CO3)2(OH)6]. Zabinski (1964)
investigated the IR spectra of several hydrozincite minerals from different localities.
Hydrozincite mineral from Dorchester showed a broad IR band centred at 3450 cm-
1, whereas the best crystallized hydrozincite mineral from Sedmocislenici showed
well-resolved IR band at 3230 and 3303 cm-1
and a weak shoulder at 3350 cm-1
.
This author concluded that the change in the microstructure of hydrozincite caused
this effect in the corresponding spectra. According to this author, hydrozincite
consist essentially of Zn5(OH)6O24-
sheets with additional Zn atoms and CO3
groups above and below these sheets. The carbonate group hold these sheets
together and, consequently, a deficiency of carbonate groups in hydrozincite
facilities a disorder in the layer sequence. This means that the disorder crystal
structure of hydrozincite influences the FT-IR spectrum as observed in the
biomineral sample, in fact the spectrum showed a poor crystallinity respect the
synthetic and in particular respect the geological samples. With an increase in the
staking disorder the hydrogen bonds become elonged for different amounts in the
various sheets and the corresponding IR bands are broadened and shifted toward
higher wave number (Music´ et al., 2002).
65
4.3 The morphologies analyzed by Scanning Electron
Microscopy
The morphological features of the samples studied are significantly dependent on
the mineral growth process. Geol1 and Geol2 show globular aggregates (Fig. 4.3
a) and crystals are characterized by a platelet shape (Fig. 4.3 b), probably caused
by the association of crystallographic forms {100} and {010}. Samples grown under
a condition of inorganic synthesis show acicular crystals (Fig. 4.3 c) having a short
side typically 100 and 200 nm in length, while the largest side is 2-10 µm and
platelet shaped (Fig. 4.3 d). Synthetic crystals show shapes and sized similar to the
geologically occurring crystals. The distinctive feature of the Naracauli samples is
that the hydrozincite form a packed network (Fig. 4.3 e) and encrust cyanobacteria
sheaths (Fig. 4.3 f). The crystals of the Nar samples show a platelet shape (Fig. 4.3
g) having the shortest side typically 50-100 nm long. These crystals are misaligned
and form mesoporous aggregate having a sponge-like surface. In addition, some
filaments of organic material are clearly visible between sheaths (Fig. 4.3 g) and
sometime protrude out from the inner sheaths.
66
Figure 4.3 SEM images of Geologic sample Geol1 (a and b), synthetic sample Synth2 (c and d), and Naracauli natural biomineral (Nar). Morphological units flattened on {100} can be recognized for all samples. The morphology of Nar sample is characterized by sheaths and sole organic matter filaments.
67
4.4 HR - Transmission Electron Microscopy structural
informations
A representative HRTEM micrograph of geologic samples is provided in Figure 4.4
image a and b, where a low magnification image (Fig. 4.4 a) of the Geol1 sample
shows a euredral particle. Due to the thickness of these well crystallized particles,
only the extreme edge is transparent to electrons in high-resolution mode at high
magnification (Fig. 4.4 b). The image of figure 3.4 b shows nanocrystalline domains
larger than 5 nm with a grain boundary network. The observed nanocrystals exhibit
the lattice plane distance of 2.85 Å, which corresponds to the (220) hydrozincite
planes, as calculated by fast Fourier transform (FFT) in the inset (Fig. 4.4 b).
Representative images of the Nar sample are show in Figure 4.4 c, with the FFT in
the figure 4.4d (inset). The particle size distribution of the Nar sample, calculated
on about 2000 particles observe in dark-field images, is reported in Figure 4.4 d.
The average particle size is about 3-4 nm and the particle size distribution is
narrow. TEM results are in good agreement with FWHM from XRD; the value (3-4
nm), lower than the average crystallites size determined by XRD (7 nm), could be
the result of the presence of some attached isoriented primary nanoparticles. In the
literature were reported to spontaneously self-organized to a superstructure with a
common crystalloghraphic orientation in a process called” oriented attachment”
(Banfield et al., 2000; Meldrum and Cölfen, 2007). Figure 4.4 c (inset 1 and 3)
clearly indicates that nanocrystals can aggregate by fusion at the grain boundaries.
Sometimes misalignment between crystallites falls below 10°. More often
nanocrystals sharing some of the atomic position at their grain boundaries show
misalignment higher than 10°. The fusion process should be able to decrease the
excess of surface free energy and then stabilize the nanocrystals. According to
Meldrum and Cölfen (2007) the platelet observed by SEM can be consider as a
68
mesocrystals produced by imperfect oriented aggregation of the nanocrystals
observed by TEM. In the Nar sample, the aggregation and fusion process cannot
be scaled up and mesocrystals are only platelets observed in Figures 1 g and h. In
high resolution mode, some nanocrystals are observed with the lattice plane
distance of 2.72 and 3.14 Å corresponding to the (021) and (020) hydrozincite
planes. In comparison with geologic samples, the Nar sample show lattice defects,
which can be related to the presence of staking modes (Fig. 4.4 c inset 2), in
addition to nanocrystals in contact through grain boundaries. An HRTEM image of
Hy2 sample is show in Figure 4.4 e with the FFT in the inset. The HRTEM image
show grain boundaries and lattice defects, which can be ascribed to the presence
of stacking modes on the basis of the typical streaking of the reciprocal rows
observed in the FFT.
69
Figure 4.4 HRTEM images: Geol2 sample at low (a) and high magnification with FFT in the inset (b); Nar sample at high magnification (c-left) where lattice defects as grain boundaries (1,3) and stacking modes (2) are evidenced (c-right); FFT of Nar sample and particle size distributions(d); Hy1 sample at high magnification with FFT in the inset (e).
70
4.5 Solid State Nuclear Magnetic Resonance
13
C NMR spectroscopy has been a routine tool of organic chemistry for many
years, but there has been little investigation of the 13
C behavior of inorganic phase.
The first paper regarding the mineral carbonate with biogenic origin has been
published in the 1989 (Papenguth et al., 1989).
The information that we obtain from a solid-state NMR spectrum concern the
presence of polytipes, different number of lattice defects in the sample, namely
plane defects such as stacking faults (Tateyama et al., 1997; Harris, 2004). This
because NMR spectra are influenced by the local environment, extending to only
few spheres of coordination, so long–range order is not required to produce a
signal. The local environment can lower the local symmetry, thus affecting the
individual chemical shift and broadening of the observed peak, which are the result
of a superposition of the signals arising from all the carbon atoms in given sites
(Mehring, 1983; Engelhardt, 1987).
71
4.5.1 13C MAS experiments
The 13
C NMR experiments were collected with different relaxation delay, between
0.2 s and 1200 s. The Figure 4.7 and Figure 4.8 show the 13
C spectra of the
samples Geol1, Geol2, Hy1, Hy2, Hy3 and Nar collected with 5 s and 1200 s. In
the spectra of Geol1 and Geol2, shown in the Figure 4.7 and collected with 5 s of
relaxation delay, a peak with FWHM of ~1ppm is present at 163.8 ppm. Figure 4.7
shows that no signals are observed in the spectra of Hy1 and Hy3, while a large
featureless signals is observed in the spectrum of Hy2 in the range 160-168 ppm.
The spectrum of Nar sample shows overlapping signals falling in the 162-169 ppm
range, with a main signal at ~164 ppm.
Figure 4.7
13C MAS NMR spectra of geologic samples (Geol1 and Geol2),
synthetic samples (Hy1, Hy2 and Hy3), and biomineral sample (Nar). The spectra were collected at two relaxation delay of 5 s. All spectra have 50Hz line broadening.
140150160170180190
13C (ppm)
Geol1 5s
Geol2 5s
Hy1 5s
Hy2 5s
Hy3 5s
Nar 5s
72
The spectra Geol1 and Geol2 collected with 1200 s of relaxation delay are shown
in the Figure 4.8.
Figure 4.8
13C MAS NMR spectra of geologic samples (Geol1 and Geol2),
synthetic samples (Hy1, Hy2 and Hy3), and biomineral sample (Nar). The spectra were collected at 1200 s. All spectra have 50Hz line broadening.
The samples collected at 1200 s of delay show a main peak at 164 ppm, such as
that observed in the spectra collected with 5 s of relaxation delay (Fig. 4.7);
however, small shoulders at both low and high frequencies can now be identified.
In addition, a small high frequencies signal at 168 ppm can be observed in the
spectrum of Geol1. The spectrum of Hy1 collected with 1200 s of relaxation delay
(Fig. 4.8) present overlapping signals in the range between 163-169 ppm, the
spectra of Hy2 and Hy3 show similar features to those of Hy1; however the peaks
in the range 165.5-169 ppm are broader. The spectrum of the Nar sample shows
140150160170180190
Geol1 1200s
Geol2 1200s
Hy1 1200s
Hy2 1200s
Nar 1200s
Hy3 1200s
13C (ppm)
73
the same features under both delay conditions. As observed in Figure 4.8, even
the use of a very long relaxation delay (1200 s) gives 13
C MAS NMR spectra of low
quality.
4.5.2 13C CPMAS experiments
The use of 13
C Cross-Polarization Magic Angle Spinning (CPMAS) technique gives
spectra with a better signal to noise ratio (Fig. 4.9 and 4.10). The CPMAS
technique is also useful for detecting biopolymers (Ueyama et al. 1998; Takahashi
et al., 2004). The 13
C CPMAS NMR spectra should be effective for the organic
components which have many protons, in fact in the 1H-
13C Cross-Polarization
experiment the proton magnetization transfer to a carbon nucleus occurs during the
contact time period and depend on the distance between the protons and carbon
nuclei; moreover, it is governed by the characteristic proton spin-lattice relaxation
time in the rotating frame (T1ρ) and 1H-
13C cross polarization time.
Figure 4.9 shows the spectra collected whit a contact time of 4 ms for Geol1,
Geol2, Hy1, Hy2 and Hy3 and with 1 ms of contact time for Nar sample. The
geological and synthetic samples show the maximum polarization time as 10 ms,
while the natural sample present 1 ms of maximum polarization time.
74
Figure 4.9 13
C CPMAS NMR spectra of geological samples (Geol1 and Geol2), synthetic samples (Hy1, Hy2 and Hy3) and biomineral sample (Nar). Geological and synthetic spectra collected with 4 ms and Nar sample collected with 1 ms of contact time. All spectra have 50-Hz line broadening.
In the experiments reported in the Figure 4.9 and in the experiments with 10 ms of
contact time (Fig. 4.10) the sample Geol1, Geol2, Hy1, Hy2 and Hy3 present
overlapping signals in the 162-169 ppm range, whose the main signals appears at
~164 ppm. The Nar sample was not cross polarizable with a contact time of 10 ms.
this because, as described above, the presence of paragmanetic impurities in the
sample Nar induces a shortening of the T1ρ relaxation process.
150155160165170175180
13C (ppm)
Geol1 4ms
Geol2 4ms
Hy1 4ms
Hy3 4ms
Hy2 4ms
Nar 1ms
75
Figure 4.10
13C CPMAS NMR spectra of geological samples (Geol1 and Geol2),
synthetic samples (Hy1, Hy2, Hy3) and biomineral sample (Nar) collected with 10 ms contact time. All spectra have 50-Hz line broadening.
4.5.3 Individual Gaussian decomposition of 13C CPMAS
overlapped signals
The CPMAS NMR technique gives spectra with a better signals to noise ratio
respect the MAS NMR experiment, for this reason, we consider the analysis of
CPMAS spectra suitable to discriminate the single components of the overlapped
signals, at least for the chemical shift of the different observed peaks. The
overlapped signals collected with 4ms of contact time for the geological and
synthetic samples were decomposed into individual Gaussian by using the
Software package Origin 7 from Microcal. The Figure 4.11 shows the experimental
and simulates spectra of the Geol1 (a), Geol2 (b), Hy1 (c), Hy2 (d) and Hy3 (e).
150155160165170175180
Geol1 10ms
Geol2 10ms
Hy1 10ms
Hy2 10ms
Nar 10ms
Hy3 10ms
13C (ppm)
76
This approach has been used in literature either for the simulation of infrared and
Raman spectra of hydrozincite and smithsonite systems (Hales and Frost, 2007) or
NMR spectra as silicon carbide (Mykhaylyk, 2002). The information obtained (i.e.,
positions, FWHM, and chemical shift values of geological samples) were reported
in the Table 4.3 The relative areas of the signals in the Table 4.3 should be taken
with caution and only as an indication of the relative amounts of the different
structural conditions.
Figure 4.11 13
C CPMAS NMR spectra of Geol1 (a), Geol2 (b), Hy1 (c),Hy2(d) and Hy3 (e) samples. The species distributions in
13C CPMAS experiment
of the samples were obtained by a nonlinear fitting of the NMR spectrum to individual Gaussians (grey curves). In the fitting procedure, the position, line width, and intensity were varied to find the best fit curve (red curve) to the experimental spectrum. The residuals were show offset for clarity (black curve).
Table 4.3 Chemical shift (ppm), FWHM (ppm), and percentage of carbon CPMAS signals decomposed into individual Gaussians for geologic and synthetic samples collected with 4ms contact time.
The fitting results clearly show that the signals at 164 ppm are the main signals for
all samples, as observed in the 13
C MAS (Fig. 4.7 and 4.8) spectra. In the Geol1
samples two more signals were detected at ~163 and ~165 ppm, whereas in the
Geol2 samples further signals is detected at ~168 ppm. In the spectra of both
synthetic samples, more components are present, and a good simulation can be
achieved using only five Gaussians at ~163, ~164, ~166, ~168, and ~169 ppm.
78
4.5.4 Considerations on the overlapped signals
It is worth noting that, even though the hydrozincite structure (Ghose 1964) has
only one crystallographically independent site for the carbon atom, but all MAS and
CPMAS spectra in the Figure 4.4 and 4.5 show several peaks in the range 150-180
ppm, more dominant in the biomineral and synthetic samples. Several reasons can
be taken into consideration to explain the presence of these additional signals:
1. The presence of paramagnetic metals can influences the chemical shift,
the spin lattice relaxation time (T1) and the line with the carbon signals (La
Mar et al. 1973) The amount of paramagnetic metal impurities in the Nar
sample is lower than 0.3%, is below 0.1% in the Geol1 and Geol2 samples,
and far below 0.1% in Hy1, Hy2 and Hy3 samples (Table 4.4). As
consequence, since overlapping signals are present in Nar, synthetic
samples, the presence of paramagnetic metal impurities cannot be
responsible for the appearance of additional signals. It is worth noting that
the spectra Hy1, Hy2 and Hy3 clearly show very broad signals at 5 s of
delay (Fig. 4.7), whereas small peaks are observed with 1200s delay (Fig.
4.8). Thus large T1 characterizes the NMR signals of these samples.
However, the spectrum of the Nar sample appears to be independent of
the investigated delays, showing that the NMR signals are affected by
short T1 (<5 s). Geological samples show a slight dependence on the
experimental delay. This seems to indicate that samples having low
paramagnetic metal impurity content show dependence on relaxation delay
(synthetics), samples having high concentration impurities contents show
very little dependence (Nar), and samples of intermediate content show a
slight dependence. This shows that the paragmanetic impurities do have
strong effects on the NMR spin lattice relaxation times affecting the
79
appearance of the peaks as a function of relaxation delay in the MAS
spectra (Fig. 4.7 - 4.8). Similar information is obtained from the CPMAS
spectra (Fig. 4.9 - 4.10). It may be suggest that in Nar, the presence of
higher concentration of paramagnetic impurities, when compared to the
other samples, induces a shortening of the T1ρ relaxation process, limiting
the polarization transfer to C nuclei. This can explain to loss of cross-
polarizable carbon signal in Nar sample collected at 10 ms contact time
(Fig. 4.10).
Geol1 Geol2 Hy1 Hy2 Hy3 Nar
Zn (g/Kg)
511 539 550 543 540 515
Pb (mg/Kg)
110 <0.4 0.05 81 25 1800
Cd (mg/Kg)
974 116 <0.4 <0.4 <0.4 560
Fe (mg/Kg)
300 21 <6.2 <0.4 <0.4 1970
Mn (mg/Kg)
300 2.00 0.01 0.04 0.02 220
Cu (mg/Kg)
17 12 8.08 7.02 7.56 150
Ni (mg/Kg)
23 10 0.08 0.08 0.08 330
Co (mg/Kg)
0.02 0.02 0.02 0.02 0.01 26
Ba (mg/Kg)
26 29 1.01 1.02 1.03 22
Sr (mg/Kg)
1.07 0.06 0.01 0.01 0.01 9
Table 4.4 Concentration of paramagnetic impurities in the geologic samples (Geol1 and Geol2), synthetic samples (Hy1, Hy2 and Hy3) and biomineral samples (Nar).
2. The appearances of extra peaks in the range of 150-180 ppm could be
explain by the presence of carbonyl/amide-carbons from organic
80
biopolymers, as previously observed (Takahashi et al., 2004). However
the presence of additional signals can be clearly excluded for the synthetic
samples, since they were synthesized in our laboratory in the absence of
any organic molecule, as evidenced by the absence of organic filaments in
TEM images. As to the Geol1 and Geol2 samples, they show lower
additional signals than the other samples analyzed, and, like the previous
sample, the SEM images do not show traces of organic filaments. This
evidence, and the fact that the amount of carbon estimates through CHNS-
O analysis was in agreement with the stoichiometry of the hydrozincite
formula (4.44%) for all geological and synthetic samples (Geol1 4.41%;
Geol2 4.37%; Hy1 4.29%; Hy2 4.34%; Hy3 4.32%) rule out this possibility.
Different consideration should be made regarding the Nar sample. In this
sample, the C estimate through CHNS-O analysis revealed an excess of C
(4.84%), which suggest the presence of biopolymer C. This evidence
confirms the presence of some organic material in the Nar sample, as
observed in SEM images (Fig. 4.3 g), and it is in good agreement with the
signals observed in CPMAS spectrum, as shown in the next paragraph. In
fact, the CPMAS spectrum Figure 4.12 of the Nar sample is characterized
by a broad signals that can be attributed, as revealed by CHN-O analysis,
to aliphatic chains (~22ppm) and to O-aliphatic –carbons (~73ppm and
~110 ppm), whereas these signals were not observed in the other
samples. Carbonyl-C atoms would be expected in the range 160<d<190
ppm. All this evidence would suggest the presence of signals coming from
carbonyl C from organic material in the range of 150-180 or at least, and
81
more importantly, that the organic material has some influence in the
formation of this additional signals.
3. The NMR technique is well known to be sensitive to the crystal order and to
the presence of lattice defects such as stacking faults. The relation
between stacking and/or polytype and NMR peak formation is well known
in literature for several phase such as silicon carbide (Tateyama et al.,
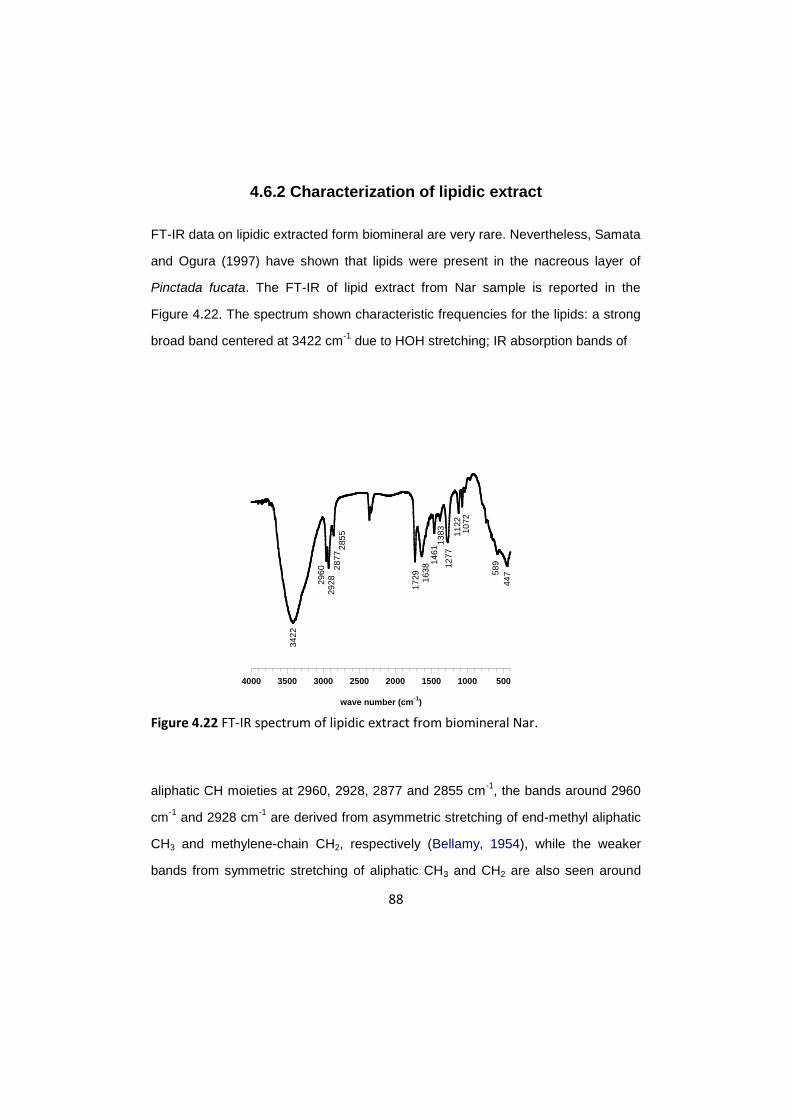
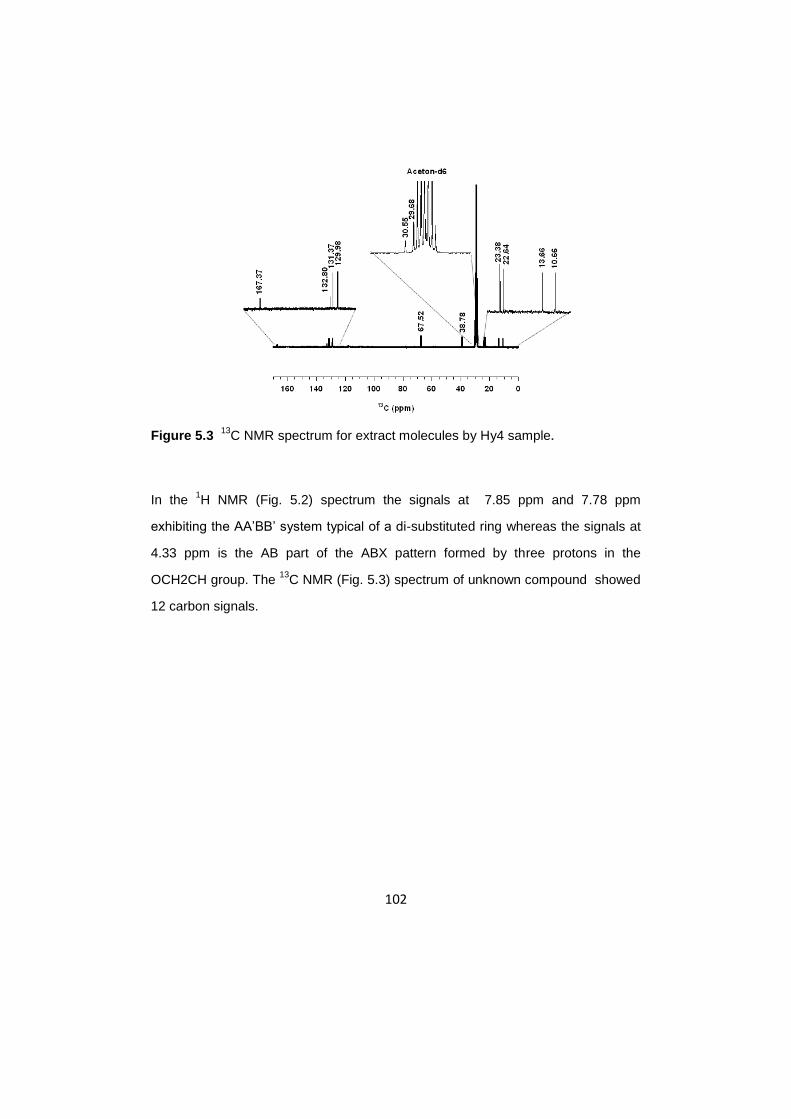
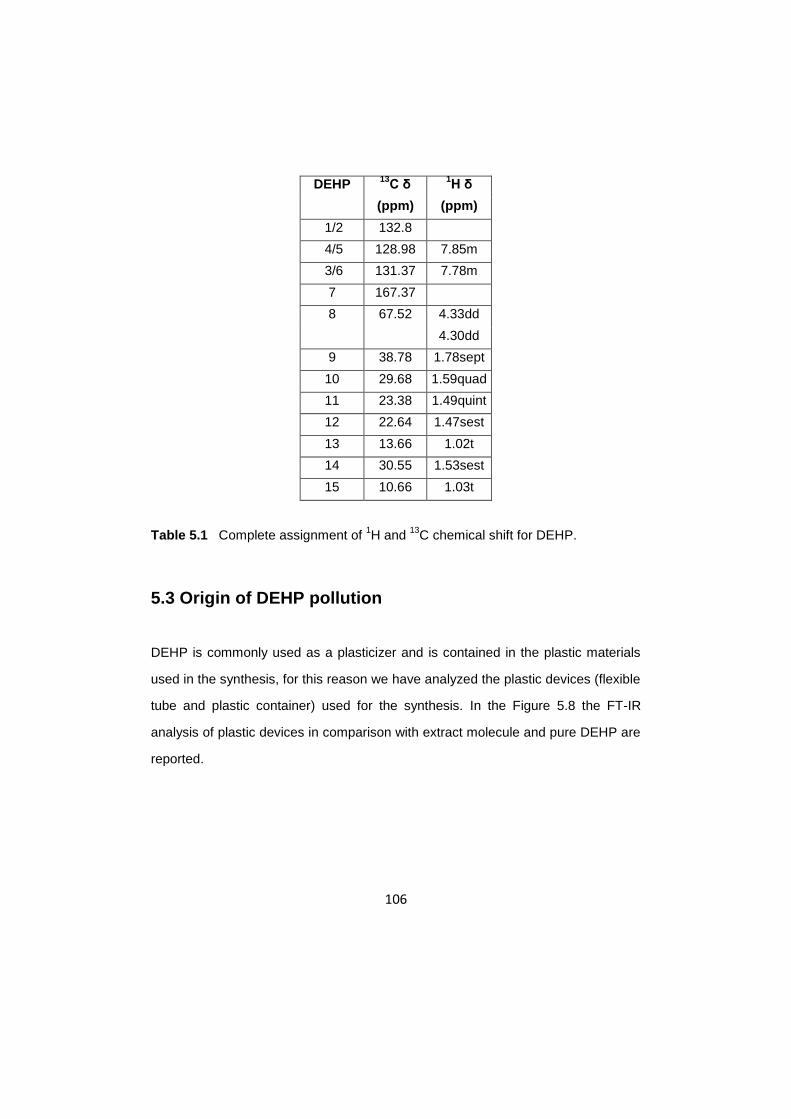
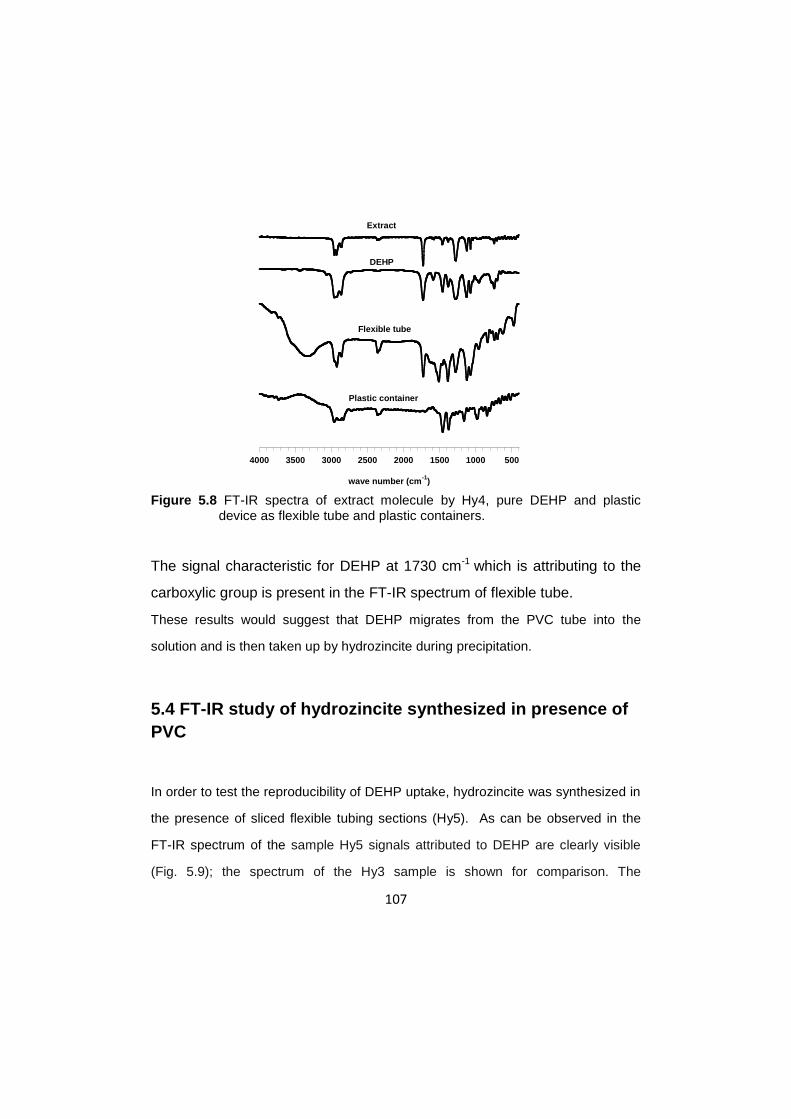
DEHP is commonly used as a plasticizer and is contained in the plastic materials
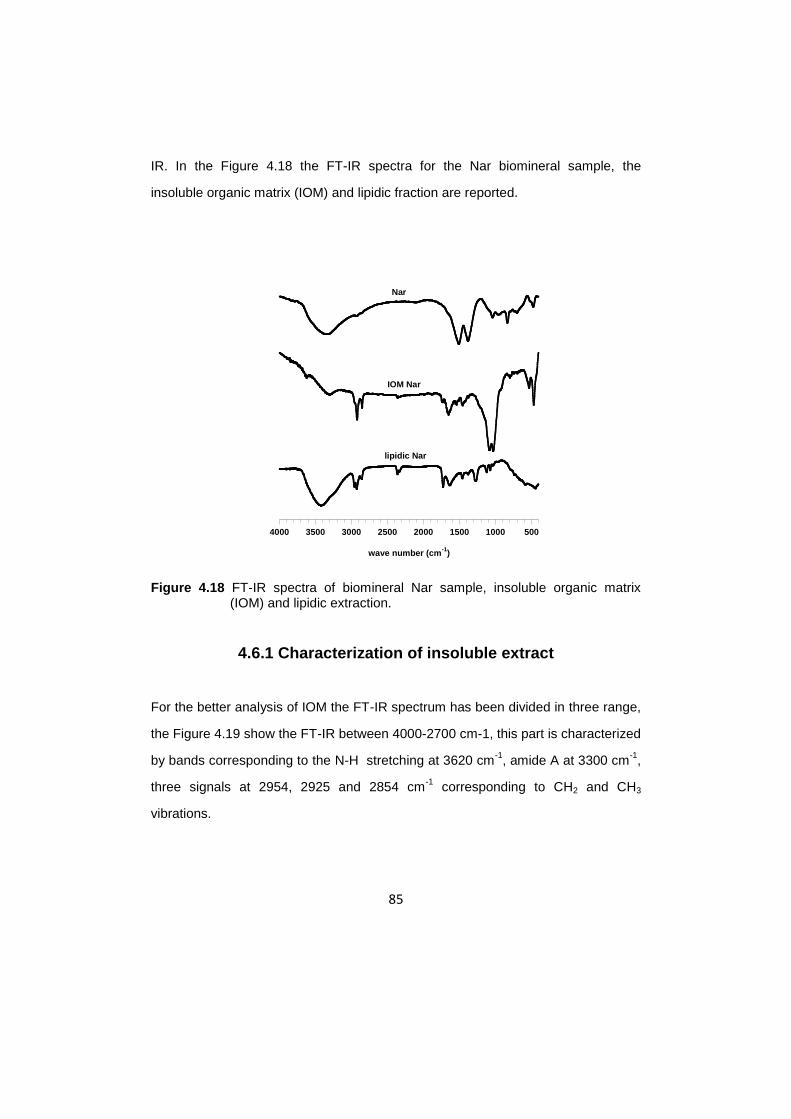
used in the synthesis, for this reason we have analyzed the plastic devices (flexible
tube and plastic container) used for the synthesis. In the Figure 5.8 the FT-IR
analysis of plastic devices in comparison with extract molecule and pure DEHP are
reported.
107
Figure 5.8 FT-IR spectra of extract molecule by Hy4, pure DEHP and plastic device as flexible tube and plastic containers.
The signal characteristic for DEHP at 1730 cm-1 which is attributing to the
carboxylic group is present in the FT-IR spectrum of flexible tube.
These results would suggest that DEHP migrates from the PVC tube into the
solution and is then taken up by hydrozincite during precipitation.
5.4 FT-IR study of hydrozincite synthesized in presence of
PVC
In order to test the reproducibility of DEHP uptake, hydrozincite was synthesized in
the presence of sliced flexible tubing sections (Hy5). As can be observed in the
FT-IR spectrum of the sample Hy5 signals attributed to DEHP are clearly visible
(Fig. 5.9); the spectrum of the Hy3 sample is shown for comparison. The
5001000150020002500300035004000
wave number (cm-1
)
Extract
DEHP
Flexible tube
Plastic container
108
experiment was repeated several times always giving the same result when the pH
of the solution was set at 6.8, which was found to be stable during the experiments.
Figure 5.9 FT-IR of synthetic hydrozincite Hy3, hydrozincite synthesized in presence of PVC slices (Hy5) and Hy5 after washing with acetone Hy5/1.
In order to evaluate whether the DEHP was only adsorbed by hydrozincite, the
sample Hy5 was washed with acetone at room temperature in a glass tube. The
FT-IR spectrum of the washed hydrozincite (Hy5/1) showed that the signal
intensities pertaining to DEHP were significantly reduced. However, as can be
observed from the signals attributed to C-H stretching vibration, some of the DEHP
remained. The absence of the signal attributed to the C=O stretching vibration is
evident.
5001000150020002500300035004000
wave number (cm-1
)
Hy3
Hy5
Hy5/1
109
For explain this different evolution of the DEHP signals in the FT-IR spectra after
washing, we have prepared several samples of hydrozincite (Hy3) mixed with pure
DEHP.
5.5 FT-IR study of hydrozincite/DEHP mixture
Several samples are prepared by mixing hydrozincite Hy3 with different quantities
of pure commercial DEHP. The FT-IR spectra for the hydrozincite samples mixed
with 25µl, 50 µl, 100 µl, 200 µl, 400 µl of pure DEHP are show in Figure 5.10.
Figure 5.10 FT-IR spectra 300 mg of hydrozincite Hy3 mixed with 25µl of pure
DEHP (Hy3-25DEHP), with 50µl of pure DEHP (Hy3-50DEHP), with 100µl of pure DEHP (Hy3-100DEHP), with 200µl of pure DEHP (Hy3-200DEHP) and with 400µl of pure DEHP (Hy3-400DEHP).
5001000150020002500300035004000
wave number (cm-1
)
Hy3-25DEHP
Hy3-50DEHP
Hy3-100DEHP
Hy3-200DEHP
Hy3-400DEHP
110
The intensity of the signals in the region of C-H stretching (2800-3000 cm-1
) and
the signal of the C=O stretching at 1730 cm-1
increase with addition of DEHP. The
FT-IR spectra does not show any shift of the above mentioned signals, neither the
signals attribute to hydrozincite show broadening or shift.
5001000150020002500300035004000
wave number (cm-1
)
Hy5
Hy5/1
Hy3-25DEHP
Hy3-25DEHP/1
Hy3-400DEHP
Hy3-400DEHP/1
Figure 5.11 FT-IR spectra of Hy5, Hy5 after washing (Hy5/1), Hy3-25DEHP, Hy3-25DEHP after washing (Hy3-25DEHP/1), Hy3-400DEHP and Hy3-400DEHP after washing (Hy3-400DEHP/1).
The Figure 5.11 display the FT-IR spectra of Hy5, Hy5/1, Hy3-25DEHP,Hy3-
25DEHP/1, Hy3-400DEHP, Hy3-400DEHP/1. The samples Hy5/1, Hy3-25DEHP/1,
Hy3-400DEHP/1 were the samples washed with acetone. After washing (Hy3-
25DEHP/1 and Hy3-400DEHP/1) the FT-IR spectra showed that the intensity of the
C-H stretching signals and C=O signals decrease proportionally, but for the sample
Hy5 this proportionally is not respect, in fact after washing (Hy5/1) the FT-IR
present the signals for the C-H but is not present the C=O stretching.
111
This result indicates that the C=O stretching signal of the DEHP is broadened
beyond detection in the spectrum of Hy5/1, and this suggest that DEHP is strongly
bound to the hydrozincite, possibly through the C=O groups, when flexible tubing
is present during the hydrozincite synthesis (sample Hy5), while it shows a
weaker interaction with the surface of the hydrozincite when added to hydozincite
nanocrystals (sample Hy3-400DEHP).
For comparison the synthetic calcite has been prepared in the presence of flexible
tubing slices (Cal2). The FT-IR spectra are reported in Figure 5.12. The FT-IR
spectra are consistent with the previously reported spectra of pure calcite (White,
1974; Balmain et al., 1999; Cebeci and So¨nmez, 2004). Both spectra showed the
diagnostic and characteristic signals for the calcite at 1428, 878, and 714 cm-1
that correspond to the v2, v3 and v4 mode of vibration stretching. In the spectra
are present also the bands for the overtone of calcium carbonate at 2983, 2782,
2589, 2511 cm-1
and a broad band in the region of 3700-3100 cm
-1 attributable to
the stretching modes of structural water.
The spectrum for the calcite synthesized in the presence of flexible tubing slices
resulted indistinguishable from the calcite control spectra (Cal1). This result shows
no evidence of DEHP incorporation into calcite during growth, under the
experimental conditions used.
112
5001000150020002500300035004000
wave number (cm-1
Cal1
Cal2
Figure 5.12 FT-IR of synthetic calcite Cal1 and synthetic calcite synthesized in presence of PVC (Cal2).
5.6 13C MAS NMR investigation of hydrozincite/DEHP
NMR spectroscopy is well suited for the study of organic compound – solution or
organic compound adsorbed interaction because it is an element specific method
that is extremely sensitive to the electron density (shielding) near the nucleous of
interest. NMR techniques can be used to obtain a variety of information about an
adsorbed molecule, including mechanisms of adsorption and surface sites
involved, the dynamics (molecular diffusion, chemical exchange) of an adsorbed
molecule on a mineral surface (Fyfe, 1983). The 13
C NMR spectra of pure DEHP
(neat DEHP), hydrozincite in which 25 µl of neat DEHP was added to 300 mg of
113
hydrozincite (Hy3-25DEHP) and hydrozincite synthesized in the presence of sliced
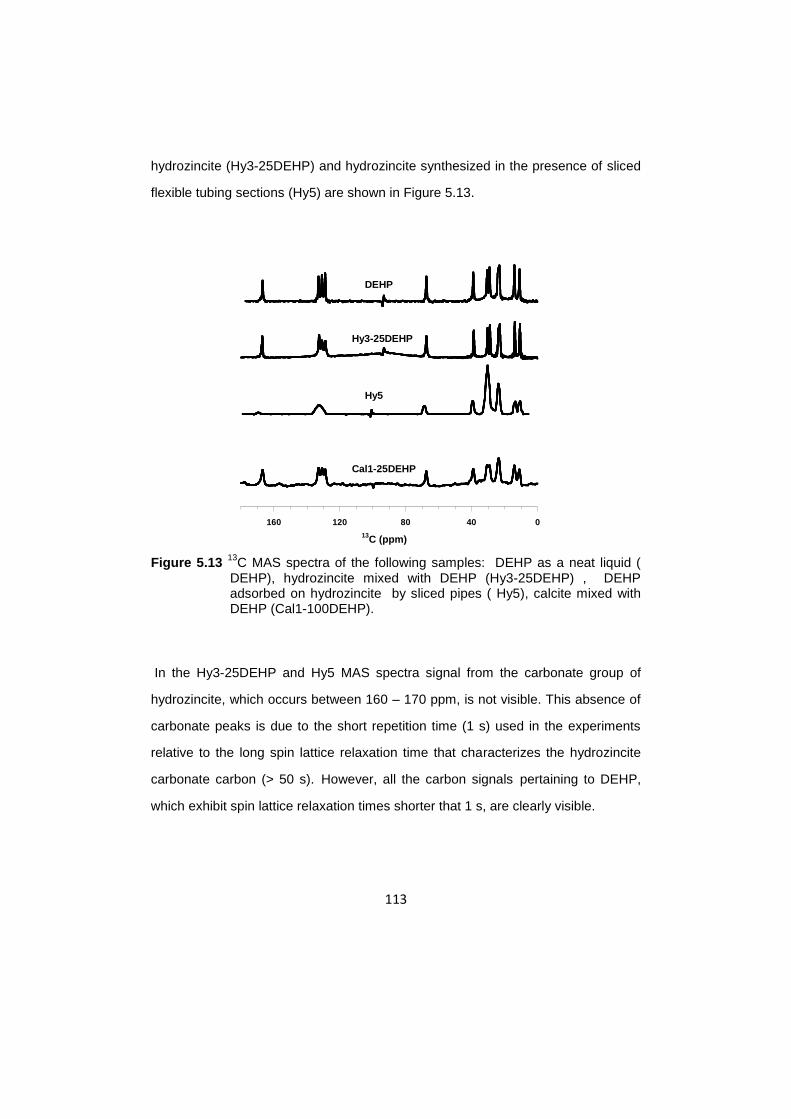
flexible tubing sections (Hy5) are shown in Figure 5.13.
Figure 5.13 13
C MAS spectra of the following samples: DEHP as a neat liquid ( DEHP), hydrozincite mixed with DEHP (Hy3-25DEHP) , DEHP adsorbed on hydrozincite by sliced pipes ( Hy5), calcite mixed with DEHP (Cal1-100DEHP).
In the Hy3-25DEHP and Hy5 MAS spectra signal from the carbonate group of
hydrozincite, which occurs between 160 – 170 ppm, is not visible. This absence of
carbonate peaks is due to the short repetition time (1 s) used in the experiments
relative to the long spin lattice relaxation time that characterizes the hydrozincite
carbonate carbon (> 50 s). However, all the carbon signals pertaining to DEHP,
which exhibit spin lattice relaxation times shorter that 1 s, are clearly visible.
04080120160
DEHP
Hy3-25DEHP
Hy5
Cal1-25DEHP
13C (ppm)
114
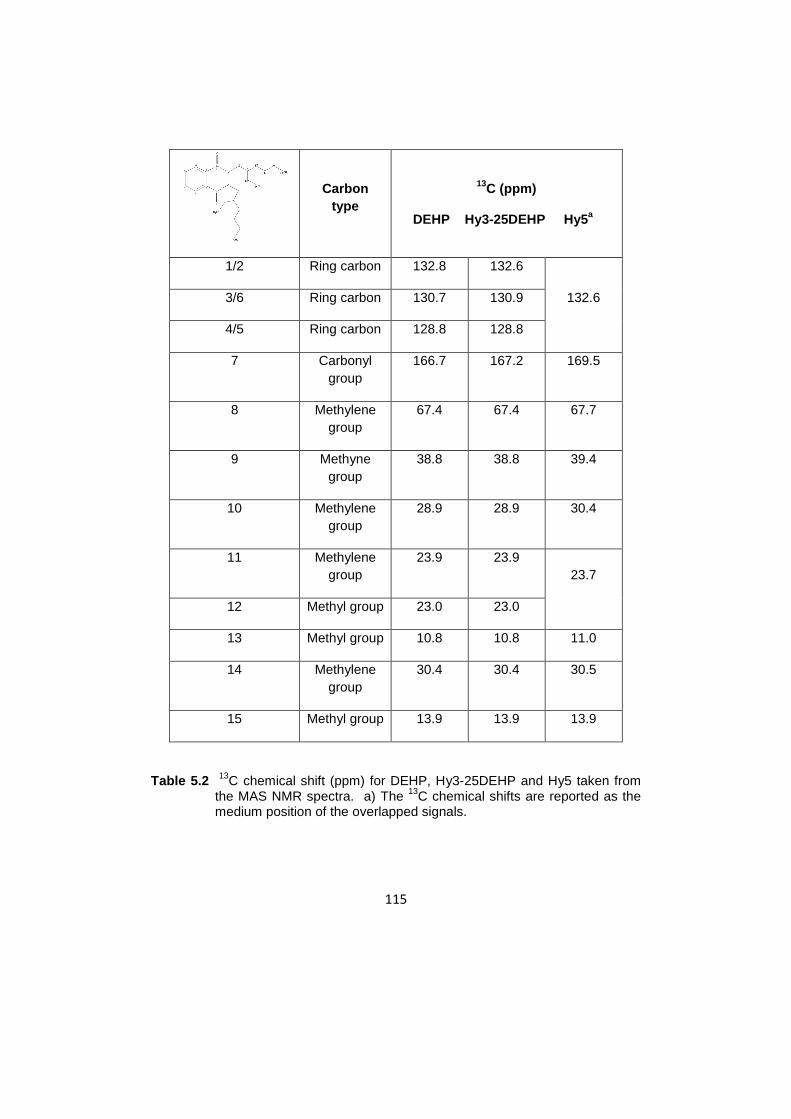
The most important differences concerning the 13
C NMR spectra of DEHP as a
neat liquid and DEHP in the Hy5 and Hy3-25DEHP samples are highlighted in the
following:
- 13
C spectrum of neat liquid DEHP taken without sample spinning (spinning
at 1 kHz did not change the quality of the spectrum) is shown in Figure
5.13 and the chemical shift values are listed in Table 5.1. The Full Width at
Half Maximum (FWHM) of the carbon signals of this sample range
between 0.82 ppm (C3/6) to 0.72 ppm (C7).
- 13
C MAS peaks of the aliphatic chains of DEHP mixed with hydrozincite
(Hy3-25DEHP) are very similar to those observed for neat liquid DEHP.
Slight differences were observed in the regions for C8, carboxyl and ring
carbons: the peaks for C8, carboxyl and ring carbons in the Hy3-25DEHP
MAS spectra are slightly broader (FWHM >1.0 ppm) and the carboxyl
signal is shifted 0.4 ppm downfield (Table 5.1).
- 13
C MAS spectrum of the Hy5 sample exhibits overlapping resonances and
a downfield shift of the aliphatic carbons (Fig. 5.13 and Table 5.1). The ring
carbons show only a single, unresolved broad peak (FWHM = 5.3 ppm)
shifted downfield (~3 ppm) and the carboxyl peak is also broadened
(FWHM > 3 ppm) and shifted downfield (3.5 ppm).
115
Carbon
type
13C (ppm)
DEHP Hy3-25DEHP Hy5a
1/2 Ring carbon 132.8 132.6
3/6 Ring carbon 130.7 130.9 132.6
4/5 Ring carbon 128.8 128.8
7 Carbonyl
group
166.7 167.2 169.5
8 Methylene
group
67.4 67.4 67.7
9 Methyne
group
38.8 38.8 39.4
10 Methylene
group
28.9 28.9 30.4
11 Methylene
group
23.9 23.9
23.7
12 Methyl group 23.0 23.0
13 Methyl group 10.8 10.8 11.0
14 Methylene
group
30.4 30.4 30.5
15 Methyl group 13.9 13.9 13.9
Table 5.2 13
C chemical shift (ppm) for DEHP, Hy3-25DEHP and Hy5 taken from the MAS NMR spectra. a) The
13C chemical shifts are reported as the
medium position of the overlapped signals.
116
It is important to observe that the C7 carboxyl carbon in Hy5 sample is ~3 ppm
shifted respect the pure DEHP and Hy3-DEHP. At the same time some others
carbons (3/6 and 4/5 ring carbons between 2 and 3.8 ppm; C9 ~0.6 ppm and C10
~1.4 ppm) close to the C7 show significant shifts. This would suggest that the C=O
group of DEHP is in close contact with the surface of the mineral.
The 13
C MAS spectrum of a calcite sample in which 100 µl of neat DEHP was
added to 300 mg of calcite (Cal1-100DEHP) is also shown in Figure 5.13. The
carbon signals of this sample did not show chemical shift variations compared to
those of neat DEHP, but the signals appear broader. No 13
C MAS signal was
observed from a calcite sample precipitated in the presence of sliced tubing
sections (data not show). This observation would suggest that the DEHP released
by the PVC slices is not strongly adsorbed at the surface of the calcite and
consequently it is not incorporated during crystal growth.
5.7 13C CPMAS NMR investigation on hydrozincite /DEHP
Additional information can be obtained from the analysis of the 13
C CPMAS
spectra. Cross-polarization is a method of signal enhancement, whereby energy is
transferred from abundant spins (1H) to the rare spins (
13C). For the
1H–
13C CP
experiment, the efficiency of polarization transfer depends on the strength of the
static dipolar interaction between 1H and
13C spins, which is determined by the
number of protons directly bound to the carbons or close to them and the 1H–
13C
internuclear distances (<10 Å). Effective intermolecular CP transfer also requires
molecular rigidity, being hindered by molecular motions in the kilohertz range.
(Fyfe, 1980; Demco et al., 1975; Hoffmann and Mayer, 1999).
117
04080120160
13C (ppm)
Hy3
Hy3-25DEHP
Hy5
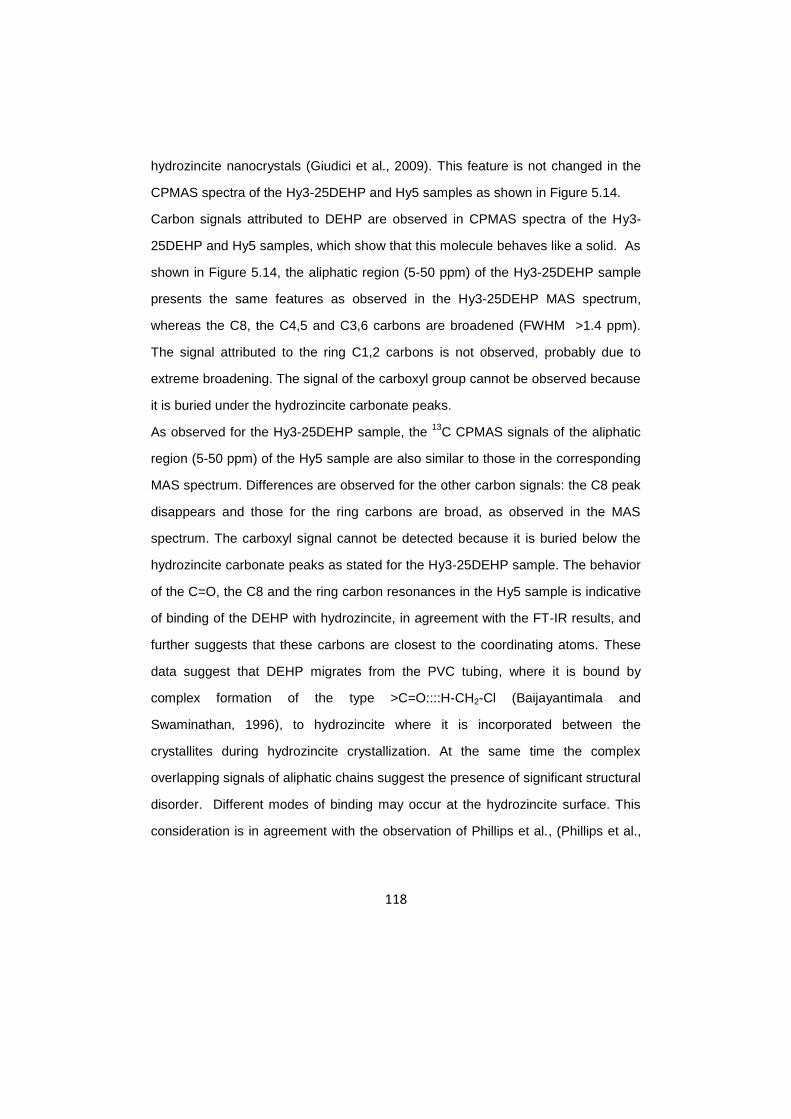
Figure 5.14 13
C CPMAS NMR spectra of the following samples: pure hydrozincite (Hy3) hydrozincite mixed with DEHP (Hy3-25DEHP), DEHP adsorbed on hydrozincite by sliced pipes (Hy5).
The Figure 5.14 shows the 13
C CPMAS NMR spectrum of the Hy3, Hy3-25DEHP
and Hy5 samples collected with 8 ms contact time. No 13
C CPMAS NMR signal of
DEHP as a neat liquid is observed at any contact time, owing to molecular
tumbling. The CPMAS spectrum of the Hy3 sample shows overlapping signals in
the 162 – 169 ppm range, whose main peak appears at ~163.8 ppm. These signals
are attributed to the carbonate group of hydrozincite, despite the fact that the
carbonate in this mineral has only one crystallographic position in the ideal
structure (De Giudici et al., 2009; Ghose, 1964) as described in the chapter IV.
These additional peaks have been ascribed to the presence of lattice defects,
namely grain boundaries and stacking faults that lower the crystal order in these
118
hydrozincite nanocrystals (Giudici et al., 2009). This feature is not changed in the
CPMAS spectra of the Hy3-25DEHP and Hy5 samples as shown in Figure 5.14.
Carbon signals attributed to DEHP are observed in CPMAS spectra of the Hy3-
25DEHP and Hy5 samples, which show that this molecule behaves like a solid. As
shown in Figure 5.14, the aliphatic region (5-50 ppm) of the Hy3-25DEHP sample
presents the same features as observed in the Hy3-25DEHP MAS spectrum,
whereas the C8, the C4,5 and C3,6 carbons are broadened (FWHM >1.4 ppm).
The signal attributed to the ring C1,2 carbons is not observed, probably due to
extreme broadening. The signal of the carboxyl group cannot be observed because
it is buried under the hydrozincite carbonate peaks.
As observed for the Hy3-25DEHP sample, the 13
C CPMAS signals of the aliphatic
region (5-50 ppm) of the Hy5 sample are also similar to those in the corresponding
MAS spectrum. Differences are observed for the other carbon signals: the C8 peak
disappears and those for the ring carbons are broad, as observed in the MAS
spectrum. The carboxyl signal cannot be detected because it is buried below the
hydrozincite carbonate peaks as stated for the Hy3-25DEHP sample. The behavior
of the C=O, the C8 and the ring carbon resonances in the Hy5 sample is indicative
of binding of the DEHP with hydrozincite, in agreement with the FT-IR results, and
further suggests that these carbons are closest to the coordinating atoms. These
data suggest that DEHP migrates from the PVC tubing, where it is bound by
complex formation of the type >C=O::::H-CH2-Cl (Baijayantimala and
Swaminathan, 1996), to hydrozincite where it is incorporated between the
crystallites during hydrozincite crystallization. At the same time the complex
overlapping signals of aliphatic chains suggest the presence of significant structural
disorder. Different modes of binding may occur at the hydrozincite surface. This
consideration is in agreement with the observation of Phillips et al., (Phillips et al.,
119
2005) of broad peaks in 13
C CPMAS NMR spectra of citrate coprecipitated with
calcite which indicates multiple conformations of citrate with the calcite.
Signals from DEHP are absent in the 13
C CPMAS spectrum Cal1-25DEHP and in
the spectrum of the calcite sample precipitated in the presence of sliced PVC
tubing sections (data not shown). The absence of CPMAS signal from the Cal1-
25DEHP sample suggests that the DEHP is too mobile to cross-polarize and has a
low affinity for binding at surface Ca sites compared to DEHP interacting with
surface Zn sites in Hy3-25DEHP.
5.8 13C CPMAS NMR experiments with different contact
times
The CP technique is based on heteronuclear dipolar interaction, it is sensitive to
internuclear dipolar interaction, to internuclear distance and to the mobility of
molecules or functional groups involved (Kolodziejski and Klinowski, 2002). This
means that CP can be used to establish the connectivity between coupled nuclei
and to monitor molecular dynamics in solids, a very useful feature in the structural
determination. To gain such information it is indispensable to measure the spin
lattice relaxation time in the rotating frame, T1ρ, and the cross-polarization time
(TCH). Variable contact time CP experiments allow simultaneous monitoring of TCH
and T1ρ. However these experiments require spectra with a good signal/noise ratio,
which is not our case. In fact, as it is observed in the Figure 5.14 using the 13
C
natural abundance the ratio signal/noise is poor. To perform such experiments we
should have to use 13
C labeled DEHP. Moreover important information, although
qualitative, can be obtained by collecting the spectra with few contact times.
120
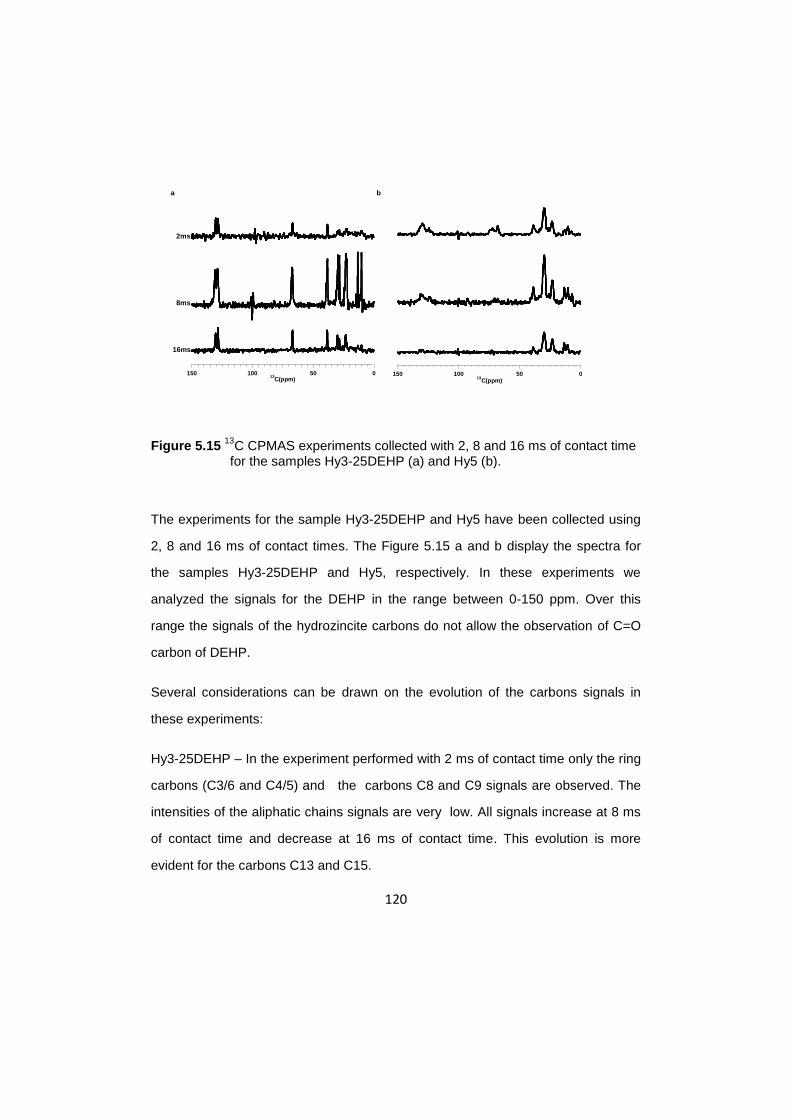
Figure 5.15 13
C CPMAS experiments collected with 2, 8 and 16 ms of contact time for the samples Hy3-25DEHP (a) and Hy5 (b).
The experiments for the sample Hy3-25DEHP and Hy5 have been collected using
2, 8 and 16 ms of contact times. The Figure 5.15 a and b display the spectra for
the samples Hy3-25DEHP and Hy5, respectively. In these experiments we
analyzed the signals for the DEHP in the range between 0-150 ppm. Over this
range the signals of the hydrozincite carbons do not allow the observation of C=O
carbon of DEHP.
Several considerations can be drawn on the evolution of the carbons signals in
these experiments:
Hy3-25DEHP – In the experiment performed with 2 ms of contact time only the ring
carbons (C3/6 and C4/5) and the carbons C8 and C9 signals are observed. The
intensities of the aliphatic chains signals are very low. All signals increase at 8 ms
of contact time and decrease at 16 ms of contact time. This evolution is more
evident for the carbons C13 and C15.
05010015013
C(ppm)
2ms
8ms
16ms
a
05010015013
C(ppm)
b
121
Hy5 – the CPMAS spectra collected with 2, 8, 16 ms of the Hy5 sample show
broad signal as reported before. The intensity of the ring carbons and C8 and C9
decrease at 8 ms and disappear at 16 ms, while the aliphatic carbons show similar
evolution as observed in the Hy3-25DEHP.
The behavior of the C8 and the ring carbon resonances in the Hy5 sample, when
compared to the behavior of the same signals in the Hy3-25DEHP, is indicative of
reduced mobility and/or of a stronger 1H-
13C hetero nuclear dipolar coupled
network, thus suggesting that those atoms are the most involved in the interaction
with the mineral. The aliphatic chains display slower CP kinetics in both samples
denoting a lower rigidity of this portion of the molecules of DEHP. The non-rigid
environment and inefficient cross-polarization have been observed previously for
organic molecules intercalated in smectite (Corrado et al., 1990; O’Brein et al.,
1991) and for the adsorbed pyridine on clay minerals (Ukrainczyk and Smith,
1996). These results, which are in good agreement with the FT-IR, 13
C MAS and
CPMAS results, confirm that the portion of the molecule including the carboxyl
group of DEHP, in the sample Hy5, is strictly bound to the surface of hyrozincite.
5.9 1H MAS information
Further experiments were carried out on Hy3-25DEHP and Hy5 samples in order to
investigate the surface of the hydrozincite mineral, through the 1H resonance of
water and DEHP molecules. The mobility of a pollutant molecule at the surface of
solid matrix can be assessed, as reported in the literature, also with 1H MAS
experiments that are very promising in differentiating molecular species according
to their degree of mobility in solids (Chamignon et al., 2004).
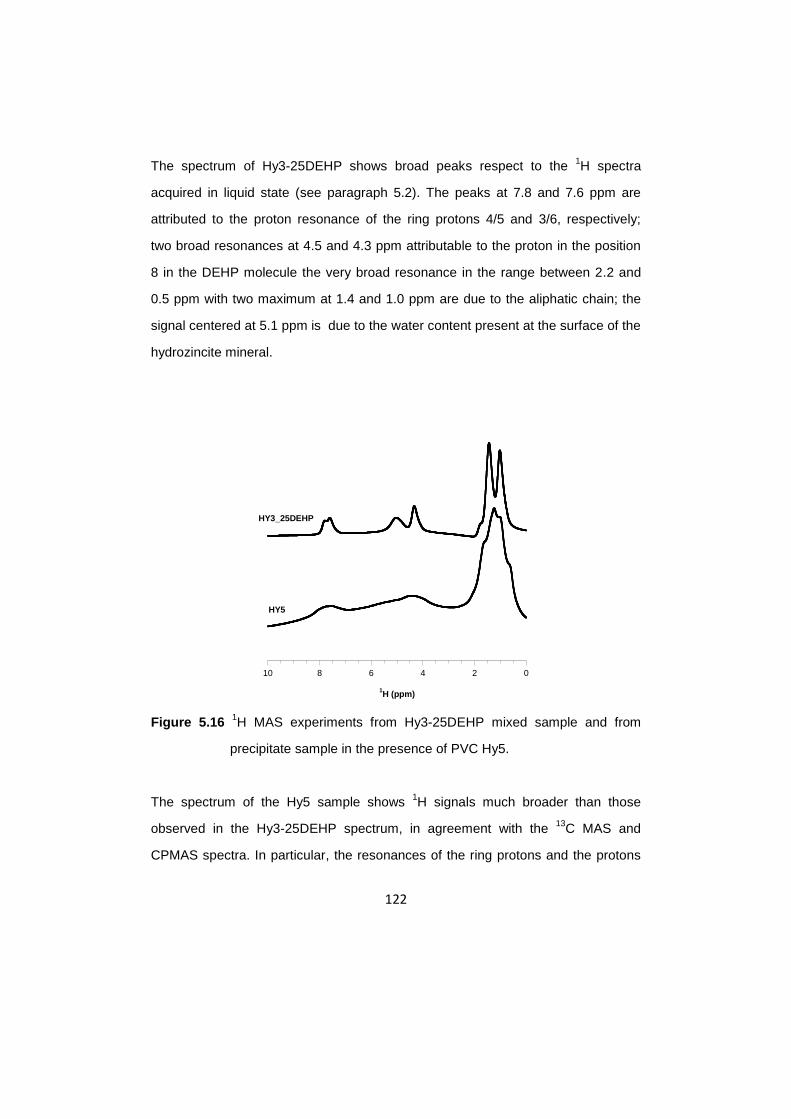
In the Figure 5.18 the 1H MAS spectra of Hy3-25DEHP and Hy5 are reported.
122
The spectrum of Hy3-25DEHP shows broad peaks respect to the 1H spectra
acquired in liquid state (see paragraph 5.2). The peaks at 7.8 and 7.6 ppm are
attributed to the proton resonance of the ring protons 4/5 and 3/6, respectively;
two broad resonances at 4.5 and 4.3 ppm attributable to the proton in the position
8 in the DEHP molecule the very broad resonance in the range between 2.2 and
0.5 ppm with two maximum at 1.4 and 1.0 ppm are due to the aliphatic chain; the
signal centered at 5.1 ppm is due to the water content present at the surface of the
hydrozincite mineral.
Figure 5.16 1H MAS experiments from Hy3-25DEHP mixed sample and from
precipitate sample in the presence of PVC Hy5.
The spectrum of the Hy5 sample shows 1H signals much broader than those
observed in the Hy3-25DEHP spectrum, in agreement with the 13
C MAS and
CPMAS spectra. In particular, the resonances of the ring protons and the protons
0246810
1H (ppm)
HY3_25DEHP
HY5
123
in the position 8 in the DEHP molecule are particularly broad. It is remarkable the
broadening of the proton resonance (~5 ppm) attributed to the water molecules at
the hydrozincite surface.
MAS NMR signals basically reflect the degree of mobility of the species loaded
onto the surface of a solid matrix: very mobile molecules give narrow signals, close
to those of liquid-state NMR spectra. In contrast, when the strength of the
interaction increases, the signals are broader. In this way, it is possible to
differentiate adsorbed versus incorporated DEHP. Similar examples are reported
in literature for the study of 4-chloro-2-methylphenoxyacetic acid in clays
(Combourieu et al., 2001).
Thus, it appears that the 1H MAS NMR is suitable to discriminate different species
(mobile and immobile) of a DEHP loaded onto the surface of hydrozincite. From
these considerations it is evident that DEHP molecules in the Hy3-25DEHP are
weakly-bound to the surface of the hydrozincite. On the contrary, the results clearly
show that, in the Hy5 sample, the DEHP molecules are strongly bound or
incorporated between the hydozincite nanoparticles.
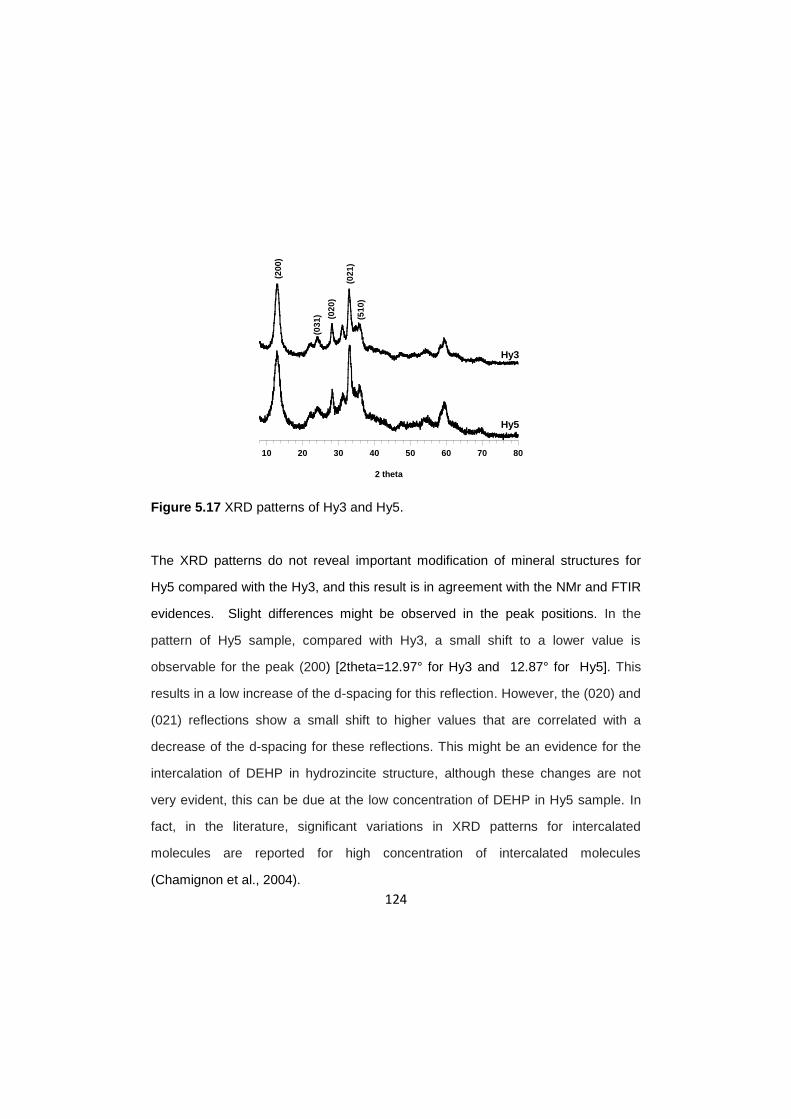
5.10 X-Ray Diffraction complementary information
The structural differences between synthetic hydrozincite Hy3 and synthetic
hydrozincite synthesized in the presence of PVC slices Hy5 have been investigated
by XRD diffraction. The XRD patterns of the two samples are reported in Figure
5.17. Both XRD patterns exhibit Bragg reflections that can be indexed as
hydrozincite single phase with a monocline structure, according to experimental
(PDF Card 19-1458) and calculated (PDF 72-1100) references patterns.
124
Figure 5.17 XRD patterns of Hy3 and Hy5.
The XRD patterns do not reveal important modification of mineral structures for
Hy5 compared with the Hy3, and this result is in agreement with the NMr and FTIR
evidences. Slight differences might be observed in the peak positions. In the
pattern of Hy5 sample, compared with Hy3, a small shift to a lower value is
observable for the peak (200) [2theta=12.97° for Hy3 and 12.87° for Hy5]. This
results in a low increase of the d-spacing for this reflection. However, the (020) and
(021) reflections show a small shift to higher values that are correlated with a
decrease of the d-spacing for these reflections. This might be an evidence for the
intercalation of DEHP in hydrozincite structure, although these changes are not
very evident, this can be due at the low concentration of DEHP in Hy5 sample. In
fact, in the literature, significant variations in XRD patterns for intercalated
molecules are reported for high concentration of intercalated molecules
(Chamignon et al., 2004).
10 20 30 40 50 60 70 80
2 theta
Hy3
Hy5
(20
0)
(03
1)
(02
1)
(02
0)
(51
0)
125
All diffraction peaks are slightly broad in the HY5 sample; the broadening can be
ascribed to the presence of DEHP with consequent increase of disorder in the
structure, and this is in agreement with the previous 13
C MAS measurements.
5.11 Conclusions
The interaction of Bis-(2-ethylhexil)phthalate (DEHP) with hydrozincite
[Zn5(CO3)2(OH)6], under controlled laboratory experiments, was investigated by
using Fourier Transform Infrared (FT-IR), Nuclear Magnetic Resonance
Spectroscopy (NMR) and X-ray Diffraction (XRD).
Our results from FT-IR and solid state 13
C NMR indicate that DEHP released from
flexible PVC tubing is bound to the hydrozincite structure during crystallization.
Under our experimental conditions the hydrozincite contains about ~10% (w/w)
DEHP taken up from the tubing. 13
C MAS and CPMAS NMR spectra reveal that
the chemical shift, the intensity and the line width of DEHP carboxylic group and
the ring carbons are greatly affected. These data suggest that the carboxyl head
group is directly involved in the binding to hydrozincite. At the same time, the
observed broad and overlapping aliphatic carbon signals of DEHP, is indicative of
structural disorder. Overall these results would suggest that DEHP is sequestered
from the tubes and incorporated at the hydrozincite nanoparticles surface during
the crystallization. In contrast, 13
C MAS and CPMAS NMR data show that DEHP is
not incorporated in calcite precipitated in the presence of flexible tubing. XRD
results are also consistent with an increase of structural disorder in hydrozincite
structure caused by the presence of DEHP, in agreement with the 13
C MAS
measurements.
This result suggests a specific interaction between DEHP and surface Zn-centers
is responsible for the strong uptake of DEHP by hydrozincite.
126
5.12 References
127
Baijayantimala, G., and Swaminathan, S. Study of Polymer−Plasticizer Interaction
by 13
C CP/MAS NMR Spectroscopy: Poly(vinyl chloride)−Bis(2-ethylhexyl)