144
2013 DRAFT TAX SUPPORTED CAPITAL BUDGET AND FORECAST 2013-2022

2013
DRAFT TAX SUPPORTED
CAPITAL BUDGET AND FORECAST
2013-2022

2013 Draft Tax Supported Capital Budget and Forecast Table of Contents
Page Executive Summary: Message from the Chief Financial Officer ................................................................................................................................................................................................................................... I
Treasurer’s 2013 Draft Tax Supported Capital Budget and Forecast Report ............................................................................................................................................................................ III
Summary 1 - Projects Added or Deleted – (where project is greater than $100,000) ............................................................................................................................................................. A-1
Summary 2 - Projects Scope/Price Increase/(Decrease)- (where project is greater than $100,000) ...................................................................................................................................... A-2
Summary 3 - Projects Shifted in Timing – (where project is greater than $100,000) .............................................................................................................................................................. A-3
Summary 4 - Net Capital Financing ......................................................................................................................................................................................................................................... A-4
Summary 5 - 2013 Ten Year Forecast – Co-ordinated Projects ............................................................................................................................................................................................. A-5
Haldimand County Council .............................................................................................................................................................................................................................................................. 1 Haldimand County Senior Staff ....................................................................................................................................................................................................................................................... 2 2013 Tax Supported Ten Year Capital Budget and Forecast Overall Summary ............................................................................................................................................................................. 3 General Government ...................................................................................................................................................................................................................................................... 7 Protection Services ....................................................................................................................................................................................................................................................... 17 Transportation Services ................................................................................................................................................................................................................................................ 25 Environmental Services ................................................................................................................................................................................................................................................ 47 Health Services ............................................................................................................................................................................................................................................................ 57 Social and Family Services .......................................................................................................................................................................................................................................... 63 Recreation and Cultural Services ................................................................................................................................................................................................................................. 69 Planning and Development .......................................................................................................................................................................................................................................... 85 Appendices Appendix A - Capital Financing Principles .................................................................................................................................................................................................................... 91 Appendix B - Forecast of Capital Reserves ................................................................................................................................................................................................................... 92 Appendix C - Forecast of Development Charges Reserve Funds Balances ............................................................................................................................................................... 112 Appendix D – Projects Deferred or Removed ............................................................................................................................................................................................................. 121
Appendix E – Impact of Acceleration of Caithness Street Project .............................................................................................................................................................................. 122

2013 Draft Tax Supported Capital Budget and Forecast Report
Page I
THE CORPORATION OF HALDIMAND COUNTY
2013 Draft Tax Supported Capital Budget and Forecast to 2022
MESSAGE FROM THE CHIEF FINANCIAL OFFICER Mayor and Members of Council, This document contains the Draft 2013 Tax Supported Capital Budget and 10 Year Capital Forecast for consideration of Council. The budget provides an opportunity for Council to review and adjust the capital plans to ensure that the proposed direction is aligned with the chosen priorities. Haldimand County, as a single tier municipality, is a complex and multidimensional operation with multiple accountabilities. As a public sector entity, our sole reason to exist is for the purpose of serving the public. To responsibly meet this objective, an elected official must understand and assess the performance and financial health of the municipality before making expenditure decisions. It must then ensure that the actions and results flowing from these decisions serve the public interest. Council’s decision making, during review of the annual budget, is a critical component of ensuring public accountability. Public accountability requires not only the provision of services and allocation of resources, but the long-term stewardship of the assets that have been funded over time by the taxpayers. As the budget allocates resources through the expenditure plans, it inherently commits the municipality to a long term financial position. Accordingly, an understanding of the financial implications of the budget is crucial. There are five recognized pillars to a sound financial plan for a public sector organization: 1. A long-term service vision:
• Define the future the community wants
• Build a financial strategy that aligns with the service strategy
2. Define financial polices that ensure stewardship of the public’s money:
• Policies ensure accountability and increase trust in government
• Policies define standards against which performance can be assessed
3. Accurate and credible forecasting:
• Must be technically sound and allow for different options/scenarios
• Essential so that stakeholders have confidence in the process
• Ensure adaptability to changing conditions and requirements
4. Participative process:
• Quality of the plan will be improved when developed using different perspectives and areas of expertise
• Build a wide basis of support for the financial strategies
5. Ensure a connection to other corporate planning documents:
• There should be a direct tie between the budgets and other strategic plans, including land use planning, technical and master plans.

2013 Draft Tax Supported Capital Budget and Forecast Report
Page II
Staff have prepared this ten year capital forecast using criteria and principles established in past years. The 2013 to 2022 Tax Supported Capital Forecast is very similar to the plan approved by Council last year. Any new projects or recommended changes to an individual project’s scope or timing are based strictly on information that has been subsequently made available. Projects have been identified based on their merits in meeting the three corporate pillars:
• Growing our Local Economy by Creating Economic Opportunity – Does the expenditure support the strengthening of the economic base of the County?
• Community Vibrancy and Healthy Community – Does the expenditure contribute to the betterment of the quality of a community?
• Corporate Image and Efficient Government – Does the expenditure contribute to more accessible, more efficient or more cost effective local government? Does it result in a visible, positive image for the County?
As noted, this budget is the “tax supported” capital forecast meaning that property taxes are primarily used to generate the sources of revenue needed to fund the planned expenditures. At a later date, the rate supported capital budget will outline the investments needed in the water and wastewater infrastructure, which are financed solely through user rates charged to the approximately 8,600 customers of these systems. It is acknowledged, however, that these same users are typically property owners as well, so sensitivity in the combined financial demands placed on these ratepayers is required. This budget requires approximately 32 cents of every property tax dollar raised in 2013 to be directed towards capital financing. Compared to our peers, this is a highly commendable level of investment in County assets for such a small municipality with a limited assessment base, yet the responsibility for all local government services. The budgeted expenditures reflect a 10 year capital investment of 76% in “state of good repair”/replacement of existing assets and 24% in enhancements/new initiatives. Compared to previous years, this shows a shift of capital investment to “new”/enhanced services. Given the significant financial investment in the County’s existing capital assets, it is crucial that Council consider whether enhancing services is affordable in the long term. The financial plan must be sustainable in the long term so that assets don’t deteriorate over time and/or require significant tax increases to support future reinvestment. With regards to financial sustainability, this budget document reflects a responsible approach to capital financing. Haldimand County has benefited from sound financial planning in the past, resulting in low debt levels and healthy reserves. Although this municipality is below the Province’s established debt repayment limits, it must be remembered that debt capacity is primarily limited by the taxpayer’s ability to bear the debt burden, as well as the bond rating agency’s assessment of the prudence of such financing decisions. Information has been provided to Council with the goal of assisting in decisions affecting the public resources entrusted by the taxpayers. Accountability for the sustainable management of both the financial and capital assets of the municipality will be met through use of this budget as a policy framework. Staff are committed to working with Council in meeting these stewardship responsibilities. Respectfully Submitted by, Karen General, CGA CFO & General Manager, Corporate Services

Treasurer’s 2013 Draft Tax Supported Capital Budget and Forecast Report
Page III
THE CORPORATION OF HALDIMAND COUNTY 2013 Draft Tax Supported Capital Budget and
Forecast
Introduction/Background: Prudent management, as well as section 290 (1) of the Municipal Act, requires local municipalities to prepare and adopt annual estimates required for the purposes of the municipality, including amounts sufficient to pay all debts of the municipality falling due within the year, amounts required to be raised for sinking funds, and amounts required for any board, commission or other body. The County currently develops three (3) annual budgets as follows:
• Rate Supported – includes Water and Wastewater Operating Budget and Capital Budget (including 9 year capital forecast)
• Tax Supported Capital Budget (including 9 year forecast)
• Tax Supported Operating Budget. To date, Council has approved the following 2013 Budget Timetable:
Draft Budget Review Date(s) Additional/Conditional Dates
Tax Supported Capital Budget January 14, 2013 January 16, 2013 Rate Supported Capital and Operating Budget
March 27, 2013 (afternoon)
March 28, 2013
Tax Supported Operating Budget March 25, 2013 March 26, 2013 Council approved the review of the Tax Supported Capital Budget before the review of the Tax Supported Operating Budget. The projects included in this document are funded from the tax levy. Water and wastewater capital projects are funded from rates and included in the Rate Supported Capital and Operating Budget. The merits of adopting a Capital Budget and forecast prior to review of the Tax Supported Operating Budget are well documented and have long been the practice of both large and small municipalities. There are several fiscally responsible and operational reasons that warrant early adoption of the Capital Budget. The adoption of the Capital Budget provides a firm understanding of the impacts of the anticipated capital program on the operations of the municipality. Based on historical service levels, the relative infrastructure requirements to sustain these service levels are determined and can be evaluated based on available financing resources. In addition to the underlying fiscal responsibilities associated with the adoption of a capital program, there are several operational advantages to early adoption of the Capital Budget. Early adoption of the Capital Budget allows project managers to better plan approved projects and to better monitor work in process during the year. With an early adoption of the capital budget, requests for proposals can be issued in non-peak times often resulting in preferential pricing (i.e. contractors/suppliers do not have future commitments or prices have not been adjusted to reflect anticipated inflation). Although the preference would be to adopt all budgets by the end of the preceding fiscal year, operational and staff resources impact the ultimate timing of Council’s review. It is anticipated that future budget review timelines will continue to improve, providing for the earliest adoption of the Tax Supported Capital and Operating Budgets to take full advantage of the aforementioned prudent fiscal and management tools, as well as the ability to assess the full impact on annual property taxes.
Legislative Framework and Capital Budget Process: Legislative Framework: The legislative environment in which municipalities operate is continually evolving, inevitably placing additional constraints and pressures on resources and finances. Over the past few years, many municipal associations (i.e. Municipal Finance Officers Association (MFOA) and Government Finance Officers Association (GFOA)) have strongly supported the adoption of Long Term Financial Planning. These principles go beyond “multi-year budgeting” and involve the integration of long range strategic planning with service delivery plans and the appropriate annual budgets to facilitate the financial resources required. Although the Municipal Act provides the legislative authority for multi-year budgets (from 2 to 5 years), there are limited legislative requirements to adopt true long term financial plans (except for those required under the Safe Drinking Water Act to report both the full

Treasurer’s 2013 Draft Tax Supported Capital Budget and Forecast Report
Page IV
cost of the water services and a cost recovery plan, representing a period of at least six (6) years). The ideology of sustainable services and the allocation of limited resources are paramount in the budgeting decisions of all municipalities across the Province. The requirement to report tangible capital assets in the statement of financial position (i.e. balance sheet) and the corresponding amortization (i.e. utilization) of tangible capital assets as an expense in the statement of operations has dramatically altered the way municipalities report and plan for the replacement of existing infrastructure. Ultimately, these reporting requirements provide the fundamental basis for municipalities to budget and plan for capital asset replacement, including identifying the resources necessary, or lack thereof, to fund these requirements. It is generally accepted that improved asset management and reporting practices, which the PSAB amendments are designed to promote, will improve accountability to the taxpayer, providing a better basis for decision making and a more effective means to determine the appropriate expenditure levels to maintain the assets integral to the County’s operations. However, municipalities are required to record capital assets at their historical cost adjusted by associated accumulated amortization to reflect their remaining useful life. It is unlikely these costs will reflect the underlying replacement costs and associated resources required to replace aging infrastructure. This practice can lead to significant underfunding of future replacements if not managed effectively (this underfunding is commonly referred to as the “infrastructure gap”). An analysis of the County’s current estimated “infrastructure gap” is provided later in this report. The requirement to develop a comprehensive asset management plan, although not a specific legislative requirement, is based on fundamental good fiscal management and has become increasingly important when competing for government grant opportunities (both at the Provincial and Federal levels). Ontario’s Municipal Infrastructure Strategy strongly emphasizes the importance of good asset management planning. The Province has developed a guide on developing comprehensive asset management plans, including the following 4 core/fundamental requirements: review of the current state of infrastructure; development of expected levels of service, asset management strategy to achieve the desired levels of service; and a comprehensive financing plan to fund these objectives. The Province’s most recent intake/expression of interest (November of 2012) for available grants funds has a specific requirement for a municipal asset management plan. All applications will be evaluated on 3 criteria: assessment management planning; the criticality of the proposed project; and the fiscal situation of the applicant. Although the County has recommended a water related project for its submission, the County will be required to complete a comprehensive asset management plan by the end of 2013. Although the County does not currently have a comprehensive plan, several of the required components are in place and the underlying financial principles have been adopted in preparation of such a plan. To this end, utilizing the financial assistance of previously approved grant funds from the Province, the County will endeavor to complete a more formalized asset management plan in 2013. Despite the above noted reporting requirements related to tangible capital assets, the Municipal Act continues to allow municipalities to not budget for the following items: amortization expenses related to capital assets; post-employment benefit costs; and solid waste landfill closure and post-closure expenses. Although this does not directly affect the 2013 Draft Tax Supported Capital Budget, it does require a separate report on these “excluded expenses”. This report will be presented to Council as part of the 2013 Draft Tax Supported Operating Budget which will outline the potential impact the exclusion of these expenses would have on the County’s accumulated year end surplus/deficit. Economic Environment Recent economists reports indicate a softer than expected economy and disappointing economic growth. As a result, it is anticipated that current economic times will undoubtedly have continued impacts locally, provincially and nationally. Based on the National Bank’s December 2012 Economic Forecast, Canada’s annualized rate of change in key financial areas is projected as follows: Annualized Rate of Change
2009 Actuals
2010 Actuals
2011 Actuals
2012 Forecast
2013 Forecast
Gross Domestic Product
(2.8)% 3.2% 2.6% 2.1% 1.7%
Residential Construction
(6.4)% 7.9% 1.9% 5.6% (2.0)%
Unemployment Rate 8.3% 8.0% 7.5% 7.3% 7.3%
Inflation 0.3% 1.8% 2. 9% 1.6% 1.7%
Prime Lending rate Currently at 3.0%, expected to remain at 3.0% throughout 2013 In addition to the National data above, as part of the Province’s 2013 Ontario Municipal Partnership (OMPF) funding announcements, allocations/transitional funding for 2013 was, in part, adjusted for local economic factors. The Province provided enhancements to offset anticipated funding reductions based on two economic factors. Firstly, the Province reviewed the 2012 OMPF funding to the County’s overall “own-source” revenue and provided additional funding for municipalities where the OMPF funding exceeded 10% of their own source

Treasurer’s 2013 Draft Tax Supported Capital Budget and Forecast Report
Page V
revenue. The County’s 2012 OMPF allocation was 7.0% and as a result no additional funding was provided. However, the second factor compared 6 local financial/economic indicator’s (weighted assessment per household, median household income, new construction, employment rate, ratio of working age to dependent population and percentage of population above low income threshold) to the median of all rural and northern municipalities to determine a specific Municipal Fiscal Circumstances Index (MFCI). Municipalities with a MFCI above 2.0 (where 5.0 is the median and 0 to 5 represent above average relative to rural and northern municipalities) were provided additional transitional funding in 2013 (to offset part of the anticipated reductions). Haldimand County’s MFCI was 2.7 and as a result was provided additional transitional funding in 2013 due to its relative fiscal/economic circumstances (albeit the overall grant funding has been reduced in 2013). Given the economic projections above, the affordability of the County’s investments in infrastructure has been heavily weighed against the need to provide sustainable and reliable services to our residents. Although municipal spending may act as a stimulant for spending in the local economy, this is more advantageous if current funding is already in place or municipal funds can be leveraged by support from the federal and provincial levels of government. As it is expected the Federal Government is committed to balancing its budget by 2017, it is unlikely there will be any substantial fiscal stimulus from this sector in the near future. As a result, in the absence of long-term guaranteed funding sources from upper levels of government, it is difficult to develop a long range financing plan for the County’s infrastructure needs that is sustainable and affordable to the local taxpayers. During 2010, the Committee on Canadian Issues of the Government Finance Officers Association (GFOA) conducted a survey of its members to develop a top ten list of key financial issues currently facing municipalities. This was an extensive process over several months, involving stakeholders across Canada; the top 4 issues (in order) were as follows:
1. Long-term financial planning/fiscal sustainability; 2. Citizen expectations and emerging service demands vs. taxation and user fee levels 3. Infrastructure deficit 4. Economic situation and effects on budgets.
As indicated above, these issues continue to remain in the forefront across the Province and throughout Canada as municipalities struggle to find the balance between the ability to pay and fiscal sustainability in our current economic times. The recommendations contained within the 2013 Draft Capital Budget and Forecast attempt to strike this balance between: (1) being fiscally responsible through establishing a long range sustainable capital plan; and (2) minimizing the tax impacts on the residents of the County. Capital Budget Process For the past several years, the County’s budget process has been focused on strategic objectives and long term financial planning. This process provides direction to management and staff when identifying infrastructure needs and implementing a long range financial plan that is sustainable. These long range plans provide for a structured process to determine future investments in infrastructure needs as well as planned financial impacts on future budgets. Although the long range vision is to have “fully funded sustainable services”, in the medium term, the goal is to increase municipal investment in infrastructure, focusing on replacement/state of good repair. As indicated above, the Province has developed a Guide for Municipal Asset Management Plans which incorporates several of the County’s current underlying principles. Although there are several methods/models to assist in developing a long-range financial plan, the underlying principles are typically the same:
• Introduction/Overview to Established Goals/Objectives/Framework to Govern the Process: The County has well established Corporate Strategic Objectives to guide the development of a long range asset management plan.
• Identify the State of Local Infrastructure: A major component of sustainable asset management is determining: what we have; what it is worth; what condition it is in; and when it needs to be replaced. The County must continually update its inventory of capital assets on an annual basis to meet financial reporting requirements and revise anticipated replacement costs/timing. Although the County has inventories of its various assets, the details, accuracy and relevant timeliness varies from category to category of assets (the County undertakes regular bridge/structure reviews while certain categories of facilities have not had recent updates). The intent of a comprehensive asset management plan is to utilize this information to determine optimum replacement timing and costs to meet the approved service levels. Additional studies/reviews will be required to assist in determining the replacement timing while maximizing asset life and efficiencies (i.e. facilities/fleet reviews and master servicing studies for water and wastewater infrastructure). To the extent this information is available to County staff, the replacement requirements have been evaluated in the departments’ current and forecasted capital budget submissions. As more information is available and condition assessments of these assets are

Treasurer’s 2013 Draft Tax Supported Capital Budget and Forecast Report
Page VI
completed, a more detailed, comprehensive replacement program can be developed. Growth related needs have been evaluated based on alignment with corporate strategic priorities, legislative requirements, health and safety impacts and operating financial impacts.
• Desired Levels of Service: While inventorying and assessing the condition of existing infrastructure is integral to an asset management plan, the intended levels of service and performance targets can significantly affect future timing and costs of replacements or upgrades. Defined levels of service with anticipated performance measures and timelines ensure the underlying infrastructure needs are appropriately identified to meet these targets. This analysis includes an assessment of both current and future needs based on established/anticipated community/resident needs.
• Asset Management Strategy: This step involves utilizing the aforementioned information to develop a planned set of actions that will ensure the underlying infrastructure will provide the desired levels of service in a sustainable manner. This includes managing future risk and annual costs through a series of planned maintenance/rehabilitation and replacement activities.
• Financing Strategy: A comprehensive long range financial plan is critical in putting the planned strategy into action. This step involves the integration of the physical asset management plan with the required financial plan. The requisite financial plan will ultimately impact the municipalities’ capital and operating budgets and identify funding shortfalls therein. The County has established specific guidelines/principles to guide the development of our long range financial plan. As outlined in Appendix A and detailed below, these principles are reviewed annually and evaluated in relation to the draft budget submitted for Council’s review.
An asset management plan is an ever evolving process and each year the County evaluates the funding sources and infrastructure needs against the established principles. Based on the current information available, replacement and growth related infrastructure needs over the 10 year forecast period cannot be fully accommodated without an increase in debt financing, depletion of reserves and/or an increase in the capital tax levy.
As indicated above, the budgeting process is the planning of financing future infrastructure replacements. As a result, the focus of the 2013 Draft Tax Supported Capital Budget and Forecast is financing. Minor capital repairs/replacements (i.e. typically individual items less than $5,000) are financed directly from the Tax Supported Operating Budget. All remaining capital expenditures are either financed internally from capital replacement reserves, external financing sources or new debt issuance. As a result, there are no capital projects financed directly from the levy. These principles are a major step towards sustainability and lifecycle costing of infrastructure needs – it is the first step in moving from a “cash basis” to an “accrual basis” of funding. Key Capital Financing Principles have been established to guide the application of various funding sources for the County’s proposed capital program. These Principles have continually been reviewed/revised (outlined in detail in Appendix A of the budget document) and are based on past practices and “industry best practices”. With the exception of Provincial legislation establishing Annual Debt Repayment Limits (ARL), there are no mandatory financial principles established for municipalities. As a result, the principles have been developed by staff and approved by Council to provide annual guidelines for uses of various funding sources and their application to specific capital projects as proposed in the 2013 Draft Capital Budget and Forecast. These principles include:
• Annual debt repayment limits significantly below Provincial guidelines as well as application guidelines for use of debt on specific infrastructure projects ;
• Use of Reserves and Reserve Funds including minimum balances over the forecasted period;
• Application of available provincial/federal grants subject to eligibility; and
• Application of external funds including conditions on initiating projects funded from these sources. The use of these guidelines adds an element of affordability to the budget process in evaluating the County’s ability to finance the proposed capital projects over the forecasted period. This plan is a multi-year approach to provide additional funding to increase the County’s investment in infrastructure to an acceptable level to maintain a “state of good repair” and provide the necessary funds for future growth and development initiatives to achieve the County’s long range strategic goals. Ultimately, this approach will provide the fundamental basis for a long range financial plan as part of an integral asset management plan. 2013 Draft Tax Supported Capital Budget and Forecast
Overview and Underlying Principles The County employs several key financial principles to ensure the budget document is understandable and meets the County’s needs. These include ensuring the budget(s) are: accountable, credible, reliable, manage expectations, transparent and meet legislative compliance. The budget cycle is continuous and ever evolving including the following integral steps: preparation, approval, monitoring and reporting. These principles are also embodied in the County’s budget guidelines. The 10 year Capital Forecast for any organization gives a better

Treasurer’s 2013 Draft Tax Supported Capital Budget and Forecast Report
Page VII
indication as to its corporate strategies and financial health than a year-over-year comparison of its annual capital expenditures. It is in the capital budget where the corporation commits to build the necessary infrastructure over the next long term. By extension, the corporation has also committed itself to the operating costs of maintaining the facilities and/or infrastructure and, in most cases, to the costs of programs run out of those facilities. As a result, the fundamental financial principles/objectives of the 2013 Draft Tax Supported Capital Budget and Forecast, as approved by Council, are as follows:
• A 1.0% increase in the tax levy to fund the capital requirements for the 2013 Capital Budget, offset firstly from assessment growth, and secondly, in the event assessment growth is insufficient and Council deems it appropriate, from an additional increase in the Municipal Tax Rate, to fund the capital requirements for the 2013 Capital; and
• Capital related expenditures targeted to be at 35% of the total tax levy within the forecast period but at a future date beyond 2013; and
• Maintain an 80:20 ratio of capital expenditures for replacements/“state of good repair” to new/enhanced projects over the 10 year forecast period.
The underlying intent of these principles/guidelines is to develop a capital financing plan over the forecasted period that, while achieving the aforementioned targets, will minimize the anticipated infrastructure deficit (ultimately resulting in deferred capital replacements or new initiatives).
Increase Capital Related Levy to Target of 35% Description/Rationale for Guideline: This principle was established and previously adopted by Council based on staff recommended “best practices” and financial indicators utilized by Credit Rating organizations. As part of the County’s annual credit rating review by Standard and Poor’s, one of the key financial indicators is Capital Expenditures as a % of Total Expenditures. This indicator is used to assess the sustainability of the municipality’s capital program. The relative percentage for rated municipalities (Standard & Poor’s rates approximately 38 Canadian municipalities) has increased steadily since 2001 (based on Standard and Poor’s last “Municipal Report Card” issued in February of 2012) and is anticipated to reach the 25% to 40% by 2015 (with higher/stronger rated municipalities moving closer to 40% and lower/weaker municipalities closer to 25/30%). Although this information is based on actual data up to 2010, despite the economic conditions over this period, it is expected this spending level will be maintained over time to meet aging infrastructure needs. The County has set a target in the middle of the anticipated increase at 35% and modified the target based on percentage of levy not actual expenditures. Although this is only an indicator, in the absence of comprehensive asset management plan, this indicator has been consistently used to determine the County’s ability to meet its future infrastructure needs in the municipal setting. Analysis: The County has significantly increased its relative contribution to capital related-expenditures since its inception in 2001. In the County’s inaugural year, only 13.2% of the total levy was capital related. Annual increases over multiple years are required to meet this target. Annual increases have been impacted in recent years due to the economic conditions and other fiscal constraints. Although the percentage has changed over the years (ranging from 1.5% to 0.25%), the County has recognized the importance of addressing the infrastructure deficit related to the County’s underlying capital assets. Given the continued depressed economy, a 1.0% increase in the tax levy related to capital expenditures is recommended for 2013. Based on a the approved guideline of a 1% increase in tax levy related to capital expenditures (reserve contributions or debt related payments), it is estimated that 31.68% of the County’s 2013 levy will be capital related. The following graph depicts the County’s historical and projected percentages over the 2001 to 2017 period based on the 2013 Draft Capital Budget and Forecast. As depicted below, steady improvement has been made in the annual tax levy investment in capital spending. It is anticipated that by initiating successive future increases in the capital levy of 1.0%, the 35% target will be achieved by 2017 (projections assume no change in annual levy requirements and constant dollars for the capital forecast). Any deviations from the annual capital levy will impact the capital levy forecast as the financing may not be available.

Treasurer’s 2013 Draft Tax Supported Capital Budget and Forecast Report
Page VIII
Note: The years 2001 through 2008 are based on reported expenditures in the annual Financial Information Return (FIR) As a result, the percentages can fluctuate year over year due to timing of completion of capital projects. The remaining years are based on the budget reflecting the capital related levy percentage.
Focus on “Replacement”/State of Good Repair”
Description/Rationale for Guideline: The 2013 Draft Tax Supported Capital Budget and Forecast represents a review of current and future capital needs based on replacement/“state of good repair” needs versus ”new”/enhanced infrastructure needs. As 2008 was the first time an evaluation based on “replacement versus new/enhanced” capital projects had been undertaken, it is impossible to determine the historical allocation between the two categories of infrastructure needs. For analysis/presentation purposes, the following definitions/criteria have been utilized to determine the relative allocations:
State of Good Repair (SOGR)/Replacement: Represents capital projects related to repairing/replacing an asset that the County currently owns and manages (this includes replacing existing capacity for service levels – i.e. landfills and cemeteries). These assets are typically already in the County’s inventory and are being amortized on an annual basis (this also includes studies associated with these assets – i.e. condition assessment studies). Some replacements will include “enhanced components” (e.g. enlarged square footage of fire halls due to size of new vehicles) as an integral part of the project; these would be included with the “SOGR” unless the cost is significant in relation to the original replacement costs or can be separately identified from the replacement component.
New/Enhanced Services: Represents capital projects that result in a change in scope of a program, a new process or new purchase over and beyond the current inventory allocation (this would include added excess capacity beyond the foreseeable future needs).
Given the ultimate responsibility to replace existing infrastructure and the associated costs of deferred maintenance/replacements, the relative proportion of capital costs related to “replacements” should be significantly higher than “new/enhanced”. In a perfect world, the County would have sufficient reserves and alternative financing sources to accommodate all replacement projects as well as desired new/enhanced projects to achieve its corporate objectives. The reality is that the County is not in a financial position to fund all required replacement projects as well as the proposed new initiatives without significant new debt or increased taxation. Ultimately, the removal/deferral of infrastructure replacements will have a long range negative levy impact as operating maintenance costs escalate and replacement costs rise exponentially based on the deterioration of the underlying asset.
The use of the Capital Financing Principles and a long range financial plan will guide in the development of a balanced approach; utilizing reserves, debt and other financing sources to provide for sustainable replacement of existing infrastructure while providing necessary resources for new initiatives. The established guideline utilizes a target of an 80/20 allocation between Replacements versus New/Enhanced. As the current budget process is refined and financing policies are developed, it is anticipated that this allocation will provide for substantially more replacements in the future, recognizing that annual fluctuations in the percentage split will likely occur due to changing priorities.
Analysis: The following chart depicts the capital project allocations for the forecast period (including 2012 for comparison purposes). The 2013 capital budget represents a 76%/24% allocation (replacement to new/enhanced). The average over the ten year forecasted period is 76%/24%. The intent is to maintain the relative percentage over the forecasted period, recognizing certain years may fluctuate based on the nature of the specific infrastructure needs. The majority of the years are with-in or relatively near the 80%/20% target (as

Treasurer’s 2013 Draft Tax Supported Capital Budget and Forecast Report
Page IX
the Gravel Road Conversion projects are considered “enhancements”, these projects impact the overall percentages on an annual basis) with the notable exception of 2014. Included in 2014 is a significant “New/Enhanced” project related to implementing the conversion from landfill disposal to a transfer station waste management approach (as previously approved by Council via report PW-ES-22-2012 Waste Management Strategic Options Analysis). This conversion represents a significant fundamental approach to waste management that has both immediate and long-term impacts on the capital requirements. Overall, this approach will reduce the 10 year capital forecast requirements for waste management by approximately $4.0 Million. However, this will require approximately $5.5 to design and develop the proposed transfer station, considered a “New/Enhanced” capital project, with the majority of these works in 2014 (approximately $5.3 million). Excluding this anomaly, the remaining years have a relatively consistent split between replacements to “new/enhanced” projects.
Developing a Long Range Capital Financing Plan The aforementioned Capital Financing Principles provide the framework for ensuring the County has a balanced financial approach while maintaining our liquidity and strong financial health. A long range plan needs to provide consistent, predictable levy increases directly associated with capital related levy requirements. The focus is on a capital funding plan based on our anticipated capital replacements or growth needs. As a result, simply deferring capital projects will have a limited impact on our long range financial needs unless the deferral pertains to new/enhanced programs or initiatives. This is a plan that will evolve and develop as more detailed information is available to accurately predict the County’s infrastructure deficit and future investment needs. A review of the overall gross capital costs clearly depicts a need for better underlying infrastructure data to predict replacement periods and associated costs in order to develop a long range sustainable financing plan. Although we have reported tangible capital assets for financial reporting purposes, including estimated replacement dates, this information has not been fully utilized to develop future forecasted needs (previously, not all asset categories had detailed asset information). In future years, we will continue to utilize this information to develop a comprehensive asset management plan that ensures optimal replacement of assets over their useful lives. As a result, in developing the 2013 Draft Capital Budget and Forecast, the financing plan was focused on the “Short-Term” needs (1 to 3 year) as these are the most predictable. The infrastructure needs over the “Mid-Term” (4 to 6 year) period are less predictable and the “Long-Term” (7 to 10) year period lacks sufficient data in all asset categories to develop an accurate/predictable 10 year financing plan. This is clearly depicted in the average annual gross expenditures over these periods as follows:
Forecast Period (years) 2013 Draft Budget Average Annual
Gross Expenditures
2012 Approved Budget Average Annual Gross
Expenditures
“Short Term ” - 2013 to 2015 $22.0 Million $21.1 Million “Mid-Term” - 2016 to 2018 $13.6 Million $14.4 Million
“Long-Term” - 2019 to 2022 $10.6 Million $13.2 Million
10 year Average $14.9 Million $15.9 Million
Treasurer’s 2013 Draft Tax Supported Capital Budget and Forecast Report
Page X
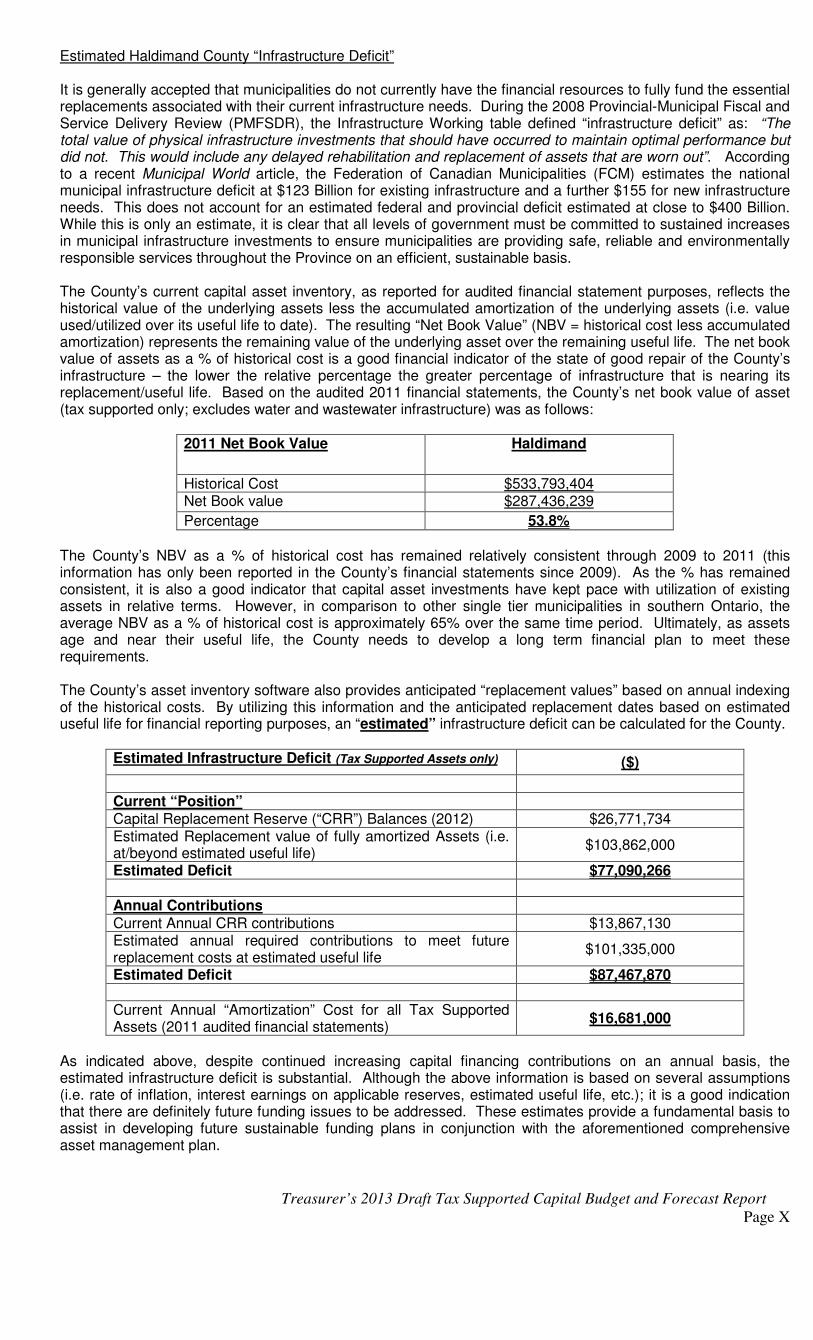
Estimated Haldimand County “Infrastructure Deficit” It is generally accepted that municipalities do not currently have the financial resources to fully fund the essential replacements associated with their current infrastructure needs. During the 2008 Provincial-Municipal Fiscal and Service Delivery Review (PMFSDR), the Infrastructure Working table defined “infrastructure deficit” as: “The total value of physical infrastructure investments that should have occurred to maintain optimal performance but did not. This would include any delayed rehabilitation and replacement of assets that are worn out”. According to a recent Municipal World article, the Federation of Canadian Municipalities (FCM) estimates the national municipal infrastructure deficit at $123 Billion for existing infrastructure and a further $155 for new infrastructure needs. This does not account for an estimated federal and provincial deficit estimated at close to $400 Billion. While this is only an estimate, it is clear that all levels of government must be committed to sustained increases in municipal infrastructure investments to ensure municipalities are providing safe, reliable and environmentally responsible services throughout the Province on an efficient, sustainable basis. The County’s current capital asset inventory, as reported for audited financial statement purposes, reflects the historical value of the underlying assets less the accumulated amortization of the underlying assets (i.e. value used/utilized over its useful life to date). The resulting “Net Book Value” (NBV = historical cost less accumulated amortization) represents the remaining value of the underlying asset over the remaining useful life. The net book value of assets as a % of historical cost is a good financial indicator of the state of good repair of the County’s infrastructure – the lower the relative percentage the greater percentage of infrastructure that is nearing its replacement/useful life. Based on the audited 2011 financial statements, the County’s net book value of asset (tax supported only; excludes water and wastewater infrastructure) was as follows:
2011 Net Book Value Haldimand
Historical Cost $533,793,404 Net Book value $287,436,239
Percentage 53.8%
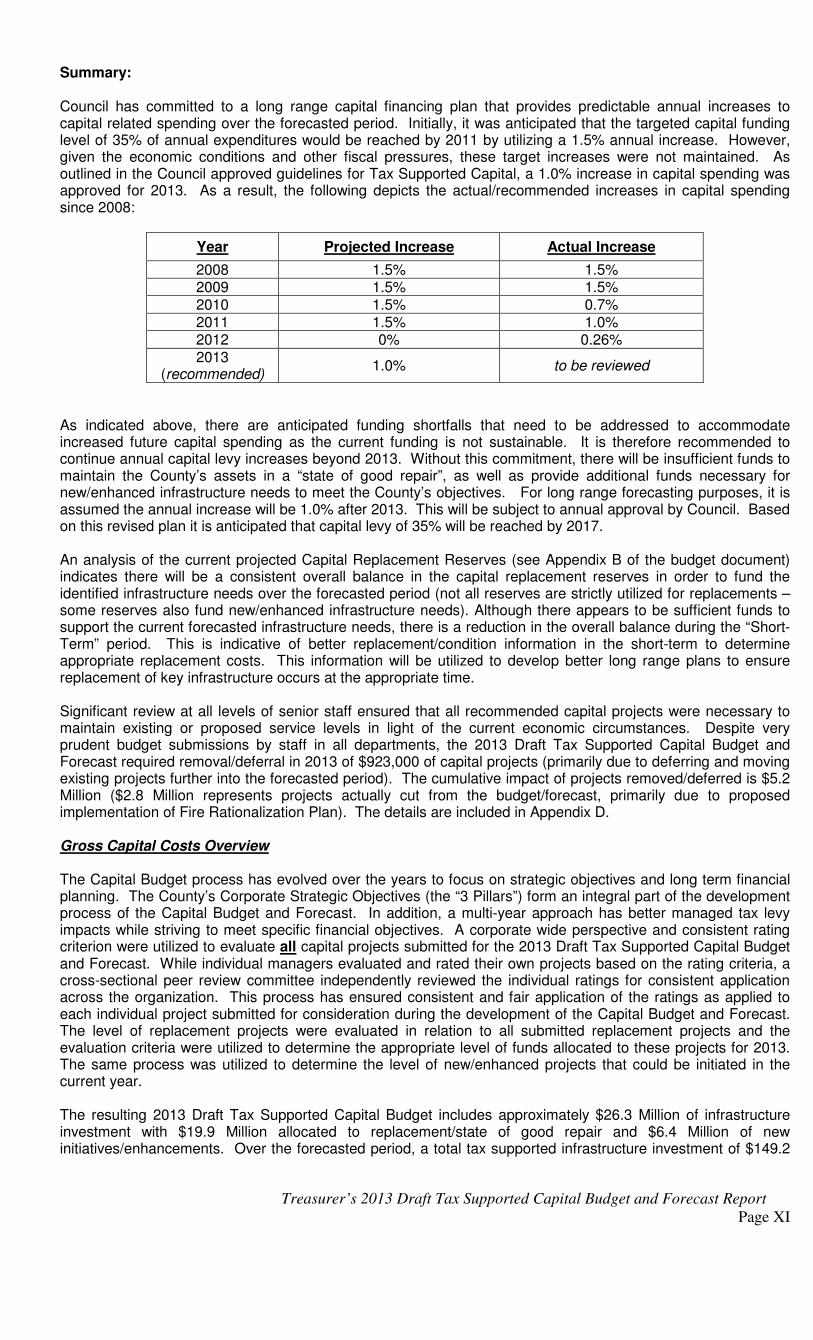
The County’s NBV as a % of historical cost has remained relatively consistent through 2009 to 2011 (this information has only been reported in the County’s financial statements since 2009). As the % has remained consistent, it is also a good indicator that capital asset investments have kept pace with utilization of existing assets in relative terms. However, in comparison to other single tier municipalities in southern Ontario, the average NBV as a % of historical cost is approximately 65% over the same time period. Ultimately, as assets age and near their useful life, the County needs to develop a long term financial plan to meet these requirements. The County’s asset inventory software also provides anticipated “replacement values” based on annual indexing of the historical costs. By utilizing this information and the anticipated replacement dates based on estimated useful life for financial reporting purposes, an “estimated” infrastructure deficit can be calculated for the County.
Estimated Infrastructure Deficit (Tax Supported Assets only) ($)
Current “Position” Capital Replacement Reserve (“CRR”) Balances (2012) $26,771,734 Estimated Replacement value of fully amortized Assets (i.e. at/beyond estimated useful life)
$103,862,000
Estimated Deficit $77,090,266
Annual Contributions Current Annual CRR contributions $13,867,130 Estimated annual required contributions to meet future replacement costs at estimated useful life
$101,335,000
Estimated Deficit $87,467,870
Current Annual “Amortization” Cost for all Tax Supported Assets (2011 audited financial statements)
$16,681,000
As indicated above, despite continued increasing capital financing contributions on an annual basis, the estimated infrastructure deficit is substantial. Although the above information is based on several assumptions (i.e. rate of inflation, interest earnings on applicable reserves, estimated useful life, etc.); it is a good indication that there are definitely future funding issues to be addressed. These estimates provide a fundamental basis to assist in developing future sustainable funding plans in conjunction with the aforementioned comprehensive asset management plan.
Treasurer’s 2013 Draft Tax Supported Capital Budget and Forecast Report
Page XI
Summary: Council has committed to a long range capital financing plan that provides predictable annual increases to capital related spending over the forecasted period. Initially, it was anticipated that the targeted capital funding level of 35% of annual expenditures would be reached by 2011 by utilizing a 1.5% annual increase. However, given the economic conditions and other fiscal pressures, these target increases were not maintained. As outlined in the Council approved guidelines for Tax Supported Capital, a 1.0% increase in capital spending was approved for 2013. As a result, the following depicts the actual/recommended increases in capital spending since 2008:
Year Projected Increase Actual Increase
2008 1.5% 1.5% 2009 1.5% 1.5% 2010 1.5% 0.7% 2011 1.5% 1.0% 2012 0% 0.26% 2013
(recommended) 1.0% to be reviewed
As indicated above, there are anticipated funding shortfalls that need to be addressed to accommodate increased future capital spending as the current funding is not sustainable. It is therefore recommended to continue annual capital levy increases beyond 2013. Without this commitment, there will be insufficient funds to maintain the County’s assets in a “state of good repair”, as well as provide additional funds necessary for new/enhanced infrastructure needs to meet the County’s objectives. For long range forecasting purposes, it is assumed the annual increase will be 1.0% after 2013. This will be subject to annual approval by Council. Based on this revised plan it is anticipated that capital levy of 35% will be reached by 2017. An analysis of the current projected Capital Replacement Reserves (see Appendix B of the budget document) indicates there will be a consistent overall balance in the capital replacement reserves in order to fund the identified infrastructure needs over the forecasted period (not all reserves are strictly utilized for replacements – some reserves also fund new/enhanced infrastructure needs). Although there appears to be sufficient funds to support the current forecasted infrastructure needs, there is a reduction in the overall balance during the “Short-Term” period. This is indicative of better replacement/condition information in the short-term to determine appropriate replacement costs. This information will be utilized to develop better long range plans to ensure replacement of key infrastructure occurs at the appropriate time. Significant review at all levels of senior staff ensured that all recommended capital projects were necessary to maintain existing or proposed service levels in light of the current economic circumstances. Despite very prudent budget submissions by staff in all departments, the 2013 Draft Tax Supported Capital Budget and Forecast required removal/deferral in 2013 of $923,000 of capital projects (primarily due to deferring and moving existing projects further into the forecasted period). The cumulative impact of projects removed/deferred is $5.2 Million ($2.8 Million represents projects actually cut from the budget/forecast, primarily due to proposed implementation of Fire Rationalization Plan). The details are included in Appendix D. Gross Capital Costs Overview The Capital Budget process has evolved over the years to focus on strategic objectives and long term financial planning. The County’s Corporate Strategic Objectives (the “3 Pillars”) form an integral part of the development process of the Capital Budget and Forecast. In addition, a multi-year approach has better managed tax levy impacts while striving to meet specific financial objectives. A corporate wide perspective and consistent rating criterion were utilized to evaluate all capital projects submitted for the 2013 Draft Tax Supported Capital Budget and Forecast. While individual managers evaluated and rated their own projects based on the rating criteria, a cross-sectional peer review committee independently reviewed the individual ratings for consistent application across the organization. This process has ensured consistent and fair application of the ratings as applied to each individual project submitted for consideration during the development of the Capital Budget and Forecast. The level of replacement projects were evaluated in relation to all submitted replacement projects and the evaluation criteria were utilized to determine the appropriate level of funds allocated to these projects for 2013. The same process was utilized to determine the level of new/enhanced projects that could be initiated in the current year. The resulting 2013 Draft Tax Supported Capital Budget includes approximately $26.3 Million of infrastructure investment with $19.9 Million allocated to replacement/state of good repair and $6.4 Million of new initiatives/enhancements. Over the forecasted period, a total tax supported infrastructure investment of $149.2
Treasurer’s 2013 Draft Tax Supported Capital Budget and Forecast Report
Page XII
Million is proposed with $112.7 Million allocated to replacement/”state of good repair” and $36.5 Million of new initiatives/enhancements. Starting last year, the format for presentation of the details of the capital projects has been modified to reflect the reporting format required for the County’s Annual Financial Information Return (FIR). Traditionally, the County has reported the details by Department (i.e. Corporate Services, Public Works, Community Services and Planning & Economic Development). These departments do not necessarily align with the FIR reporting requirements and do not always take into account the cross-divisional delivery of services provided by the County. The FIR requires specific functional areas to be grouped together. In total there are 9 functional categories, with a varying number of sub-categories as follows:
• General Government: Includes all corporate overhead and related capital projects. Sub-categories include Governance (i.e. CAO and Council) as well as Corporate Management and Support (i.e. Clerks, Infrastructure Technology Support, Human Resources, Corporate Support Services, Financial Services and Administrative Facilities)
• Protection Services: Includes all services intended to protect the public and the community as a whole. Sub-categories include fire, police, court security costs, prisoner transportation, conservation authorities, protective inspection and control (building/by-law enforcement), emergency measures and provincial offenses operations.
• Transportation Services: This category includes all means of transportation and associated services. Sub-categories include various roadways, winter control operations, transit, parking, street lighting and municipal airports.
• Environmental Services: This category includes services that impact the environment. The sub-categories include storm water management, solid waste management and waste diversion. Water and wastewater capital projects are included in a separate budget document as they are supported by user rates and not property taxes.
• Health Services: This category includes all public health related services. The sub-categories include Public Health services, hospitals, ambulance services, and municipally managed cemeteries.
• Social and Family Services: This category includes services related to social assistance to local residents. The sub-categories include social assistance programs, assistance to the aged (i.e. long term care facilities), and child care services.
• Social Housing: This category includes services related to housing programs for residents within the municipality. This includes public housing and not for profit housing as well as rent supplemented accommodations.
• Recreation and Cultural Services: This category includes all parks, recreational and cultural services. The sub-categories include parks and recreational programs, recreational facilities, libraries, museums and other cultural services (i.e. arts and entertainment).
• Planning and Development: This category includes all planning and development related services. The sub-categories include residential and commercial/industrial planning, agriculture and reforestation, tile drainage and shoreline management, economic development and tourism related activities.
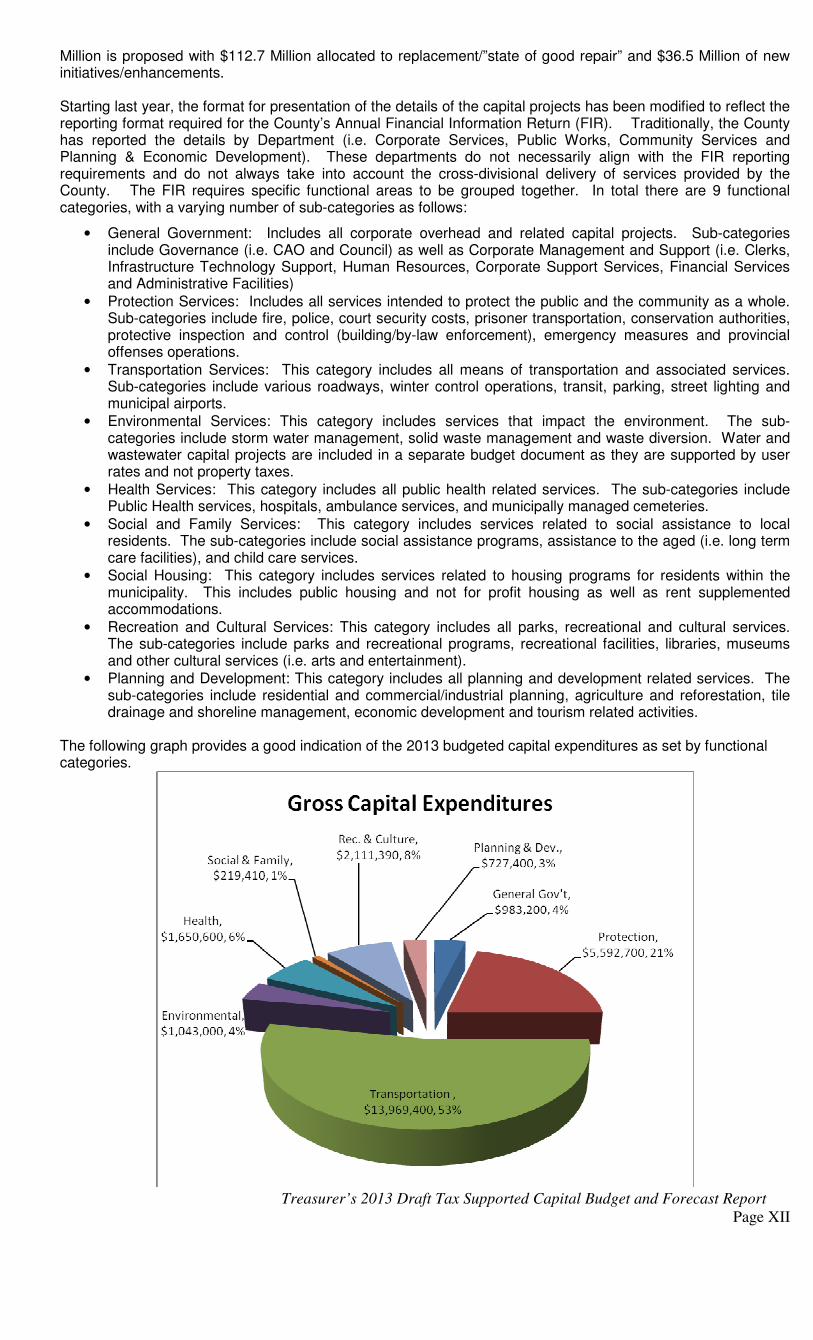
The following graph provides a good indication of the 2013 budgeted capital expenditures as set by functional categories.

Treasurer’s 2013 Draft Tax Supported Capital Budget and Forecast Report
Page XIII
As shown above, the County’s 2013 Draft Tax Supported Capital Plan focuses primarily in two main areas: Transportation and Protection. Traditionally, the capital projects are focused in Transportation and Environmental (i.e. Waste Management) as these areas represent the majority of the planned annual infrastructure needs (as outlined in Standard & Poor’s annual municipal ratings report, the relative percentages of capital works in the Transportation and Environmental services areas is typically between 80% and 90%, excluding water and wastewater projects). The shift in focus to Protection Services (primarily fire services) from Environmental Services in 2013 is due to:
� The proposed implementation of the Fire Services Station Location/Rationalization Plan as presented in principle to Council at the November 5, 2012 Workshop; and
� Proposed relocation of staff related to the construction of Cayuga Fire Station.; and � The aforementioned shift in waste management practices (i.e. implementing the conversion from landfill
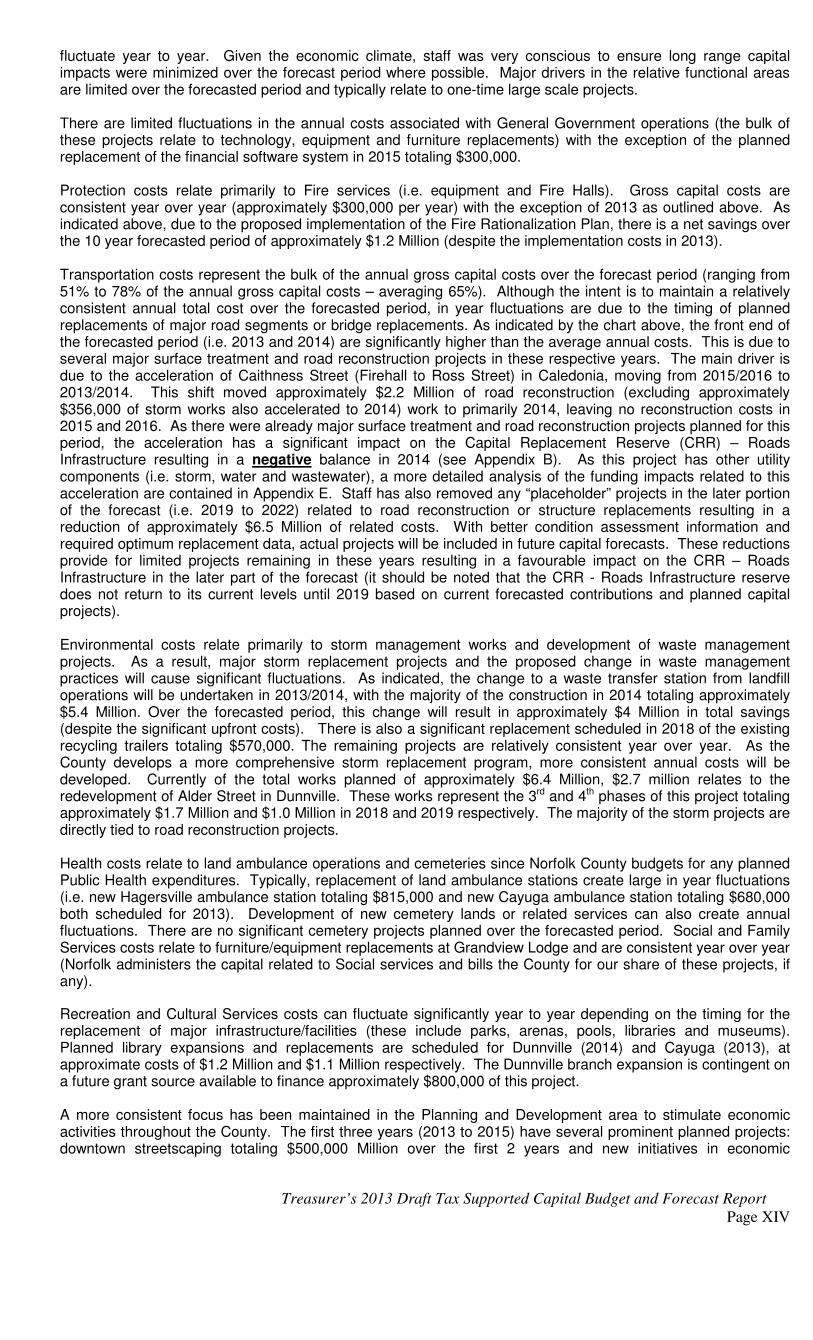
disposal to a transfer station). As a result, there are significant upfront infrastructure requirements to implement the Fire Services Rationalization Plan (in addition to the planned replacement of both the Hagersville and Cayuga Fire stations as approved by Council in 2012 for construction in 2013). As outlined in the summary of new projects added to the budget (see Summary 1), a new bay is required at South Haldimand fire station to accommodate the relocation of fire equipment totaling $500,000. The replacement of the Hagersville and Cayuga Fire Stations totals approximately $2.0 Million and $1.7 Million respectively. In addition, as part of the reconstruction of the Cayuga Fire Station, there are several proposed staff relocations as follows: move fire administration staff to new Cayuga Fire Station to accommodate relocation of Dunnville water/wastewater staff from library site - $495,000; relocate parks/facilities staff from proposed fire station site in Cayuga to arena location - $520,000 (see Summary 1). These changes result in a total Fire services capital budget of $5.6 Million in 2013 representing a significant increase over a typical year (approximately $300,000 annually). Future fleet reallocations and fire station repairs /replacements impacts future years in the Capital forecast, resulting in reductions over the forecasted period of approximately $1.7 Million (representing reductions in facility, equipment and fleet repairs/replacements). The impacts of the change in waste management practices significantly affects futures years staring in 2014, resulting in limit capital projects in 2013. The remaining annual allocations are reasonable and predictable given the majority of the County’s current infrastructure costs are invested in roads, fleet, facilities, storm sewers and waste management. It is anticipated these trends will continue during the forecasted period with cyclical changes as one time major infrastructure replacements are planned (i.e. typically during the replacement/expansion of major facilities – administrative, fire, recreational or cultural facilities). As one of the main focuses of the capital budget is to ensure an adequate state of good repair, these allocations are consistent with infrastructure replacement needs. With better inventories of assets and condition assessments, more resources will likely be required in the facilities and parks/recreational areas. Also, a more consistent allocation of resources to planning and development has been maintained to align with many corporate priorities and the focus on new economic/development initiatives. The following graph outlines the functional allocation of gross capital costs over the 10 year forecasted period ending in 2022.
The capital forecast represents consistent functional allocations of proposed capital projects over the forecasted period with a few notable exceptions. As previously indicated, the forecast was viewed in three segments: “Short-Term”, “Mid-Term” and “Long-Term”. As depicted above, the expenditures are relatively consistent within these segments (as indicated, more heavily weighted in the first 3 years), albeit the functional allocations will
Treasurer’s 2013 Draft Tax Supported Capital Budget and Forecast Report
Page XIV
fluctuate year to year. Given the economic climate, staff was very conscious to ensure long range capital impacts were minimized over the forecast period where possible. Major drivers in the relative functional areas are limited over the forecasted period and typically relate to one-time large scale projects. There are limited fluctuations in the annual costs associated with General Government operations (the bulk of these projects relate to technology, equipment and furniture replacements) with the exception of the planned replacement of the financial software system in 2015 totaling $300,000. Protection costs relate primarily to Fire services (i.e. equipment and Fire Halls). Gross capital costs are consistent year over year (approximately $300,000 per year) with the exception of 2013 as outlined above. As indicated above, due to the proposed implementation of the Fire Rationalization Plan, there is a net savings over the 10 year forecasted period of approximately $1.2 Million (despite the implementation costs in 2013). Transportation costs represent the bulk of the annual gross capital costs over the forecast period (ranging from 51% to 78% of the annual gross capital costs – averaging 65%). Although the intent is to maintain a relatively consistent annual total cost over the forecasted period, in year fluctuations are due to the timing of planned replacements of major road segments or bridge replacements. As indicated by the chart above, the front end of the forecasted period (i.e. 2013 and 2014) are significantly higher than the average annual costs. This is due to several major surface treatment and road reconstruction projects in these respective years. The main driver is due to the acceleration of Caithness Street (Firehall to Ross Street) in Caledonia, moving from 2015/2016 to 2013/2014. This shift moved approximately $2.2 Million of road reconstruction (excluding approximately $356,000 of storm works also accelerated to 2014) work to primarily 2014, leaving no reconstruction costs in 2015 and 2016. As there were already major surface treatment and road reconstruction projects planned for this period, the acceleration has a significant impact on the Capital Replacement Reserve (CRR) – Roads Infrastructure resulting in a negative balance in 2014 (see Appendix B). As this project has other utility components (i.e. storm, water and wastewater), a more detailed analysis of the funding impacts related to this acceleration are contained in Appendix E. Staff has also removed any “placeholder” projects in the later portion of the forecast (i.e. 2019 to 2022) related to road reconstruction or structure replacements resulting in a reduction of approximately $6.5 Million of related costs. With better condition assessment information and required optimum replacement data, actual projects will be included in future capital forecasts. These reductions provide for limited projects remaining in these years resulting in a favourable impact on the CRR – Roads Infrastructure in the later part of the forecast (it should be noted that the CRR - Roads Infrastructure reserve does not return to its current levels until 2019 based on current forecasted contributions and planned capital projects). Environmental costs relate primarily to storm management works and development of waste management projects. As a result, major storm replacement projects and the proposed change in waste management practices will cause significant fluctuations. As indicated, the change to a waste transfer station from landfill operations will be undertaken in 2013/2014, with the majority of the construction in 2014 totaling approximately $5.4 Million. Over the forecasted period, this change will result in approximately $4 Million in total savings (despite the significant upfront costs). There is also a significant replacement scheduled in 2018 of the existing recycling trailers totaling $570,000. The remaining projects are relatively consistent year over year. As the County develops a more comprehensive storm replacement program, more consistent annual costs will be developed. Currently of the total works planned of approximately $6.4 Million, $2.7 million relates to the redevelopment of Alder Street in Dunnville. These works represent the 3rd and 4th phases of this project totaling approximately $1.7 Million and $1.0 Million in 2018 and 2019 respectively. The majority of the storm projects are directly tied to road reconstruction projects. Health costs relate to land ambulance operations and cemeteries since Norfolk County budgets for any planned Public Health expenditures. Typically, replacement of land ambulance stations create large in year fluctuations (i.e. new Hagersville ambulance station totaling $815,000 and new Cayuga ambulance station totaling $680,000 both scheduled for 2013). Development of new cemetery lands or related services can also create annual fluctuations. There are no significant cemetery projects planned over the forecasted period. Social and Family Services costs relate to furniture/equipment replacements at Grandview Lodge and are consistent year over year (Norfolk administers the capital related to Social services and bills the County for our share of these projects, if any).
Recreation and Cultural Services costs can fluctuate significantly year to year depending on the timing for the replacement of major infrastructure/facilities (these include parks, arenas, pools, libraries and museums). Planned library expansions and replacements are scheduled for Dunnville (2014) and Cayuga (2013), at approximate costs of $1.2 Million and $1.1 Million respectively. The Dunnville branch expansion is contingent on a future grant source available to finance approximately $800,000 of this project. A more consistent focus has been maintained in the Planning and Development area to stimulate economic activities throughout the County. The first three years (2013 to 2015) have several prominent planned projects: downtown streetscaping totaling $500,000 Million over the first 2 years and new initiatives in economic

Treasurer’s 2013 Draft Tax Supported Capital Budget and Forecast Report
Page XV
development/tourism (Lakescape Action plan implementation totaling $700,000 during 2013/2014 and a birding tourism initiative totaling $200,000 in 2015). Also, the replacement of the Dunnville Farmer’s Market structure is planned in 2016 totaling $450,000. Financing Sources The County has limited financing sources to draw upon to provide for the capital costs associated with the 2013 Draft Tax Supported Capital Budget and Forecast. The source of financing for specific projects varies depending on the availability of funds and the nature of the capital projects. As previously indicated, specific Capital Financing Principles were developed and utilized to determine the appropriate funding sources for proposed capital replacements or new initiatives. These principles are outlined in detail in Appendix A of the budget document as they relate to specific sources of funding. Replacement of Existing Assets: In general terms, replacement of existing infrastructure is financed from specific reserves/reserve funds established for the underlying group of assets. When considering available funding sources for these projects, funds were applied in the following order: committed/contractual external revenue sources, available eligible grants source, specific capital replacement reserves, and debt financing. Debt financing would only be considered, subject to the Capital Financing Principles, if sufficient funds are not available through other sources. In addition, growth related studies are funded from the development charges reserve funds as indentified in the development charges background study. The application of the principles developed for the 2013 Capital Budget provides a fundamental basis to evaluate the County’s ability to finance its required capital replacements. Funding from own sources (i.e. capital replacement reserves) is allocated 79%/21% between replacement vs. new/enhanced capital projects in 2013. Growth Related Projects: The only specific funding source dedicated to funding growth related projects is development charges. Development charges are collected for specifically identified capital projects. External sources of funds may be available as user groups partner with the County to initiate new services or enhancement to existing services. The County does not have established predictable sources of funding for these initiatives other than the development charges collected on the specifically identified projects. The notable exception is the use of Federal Gas Tax Funding as the criteria to utilize these funds would lend itself to both replacement and new/enhanced infrastructure needs. As a result, the balance of new/enhanced initiatives must be funded from the specific capital replacement reserves that also fund the replacements. Funding sources for new/enhanced capital initiatives for 2013 are as follows:

Treasurer’s 2013 Draft Tax Supported Capital Budget and Forecast Report
Page XVI
As depicted by the accompanying chart, consistent trends are employed in financing projects in the proposed capital forecast. Reserve funding represents the largest annual funding source and is relatively consistently applied throughout the forecasted period (accounting for approximately 78% over the forecasted period). External financing sources fluctuate year to year depending on the nature of the project and availability of alternative funding sources (these sources are limited primarily to municipal recoveries from Norfolk for infrastructure related to shared services; municipal drain chargebacks; recovery for hydro related works and community contributions for joint projects on municipally owned assets). The only anticipated new debentures, totaling approximately $3.7 Million, relate to the multi purpose fire/ambulance stations in Hagersville and Cayuga (both projects are scheduled for 2013 with total debt financing of $2.0 Million and $1.0 Million respectively) and the Cayuga Library Branch replacement (construction starting in 2013 with debt proceeds totaling $700,000). As outlined in the 2012 Capital budget, the acceleration of the Hagersville fire/ambulance station to 2013 did not provide sufficient time to build the required internal reserves to fund this project. As a result, the only available financing source was debt financing. It is anticipated to tender both Hagersville and Cayuga multi-purpose facilities at the same time (similar to the Dunnville and Cayuga arenas in 2011) to get preferential bid pricing. As a result, both projects are included as debt financing (Cayuga has some offsetting development charges as it was in the original forecast and included in the 2009 Development Charges update). A portion of the Hagersville project has also been identified as growth related - staff has included an estimated development charge recovery that will require confirmation during the DC update in 2013. Use of development charges is relatively limited over the forecast period with only $7.8 Million financed of a total $149.2 Million in forecasted capital expenditures. The application of these funds is limited to the specific capital projects identified in the Development Charges Background Study completed in 2009 or subsequently identified as growth related through a Council resolution. As indicated above, approximately $1.5 million of development charges are anticipated for the redevelopment of the Hagersville and Cayuga fire/ambulance stations. The majority of the Development charges (approximately $2.7 Million) is related to transportation services, including road re-development and bridge expansions (i.e. Caledonia). Also, storm sewer re-construction accounts for approximately $1.6 Million of the development charge financing over the forecasted period. Included in recreation and cultural services, approximately $600,000 of development charges are planned for trails/park enhancements as well as approximately $600,000 for the two library expansion/replacements.
Over the forecast, the tax supported allocation of Federal Gas Tax funding, totaling $14.9 Million and is applied primarily to: energy conservation measures in facilities at $126,000; waste management projects at $2.4 Million (construction of transfer station); roads hot mix resurfacing at $800,000; and the gravel road conversion program at $11.6 Million.
Grant Funding The County has very limited predictable grant sources. Total financing from grants is limited to approximately $1.0 Million over the entire forecasted period (excluding Federal Gas Tax allocations). Grants are typically received in one of the following ways:
• Guaranteed Annual Amounts (e.g. Federal Gas Tax);

Treasurer’s 2013 Draft Tax Supported Capital Budget and Forecast Report
Page XVII
• Merit based granting opportunities (i.e. Ontario Municipal Infrastructure investment initiative (initiated late 2012);
• One time grant funds – Typically one-time funds restricted to specific areas. The Capital Financing Principles outlines the following guidelines for allocation of these grant sources. Federal Gas Tax – The County has an agreement in place through the Association of Municipalities of Ontario (AMO) for annual allocations of federal gas tax funding for eligible infrastructure projects. Our current annual funding allocation is $2.8 million and as outlined in the capital financing principles, is to allocated on a 50%/50% basis between tax supported and water/wastewater capital needs. This principle has been followed in the 2013 Draft Capital Budget and Forecast. In order to meet eligibility requirements, the allocations over the forecasted period are applied primarily to energy conservation efforts, waste management and roads/bridges projects as these areas have insufficient capital replacement reserves to fund all the required projects over the forecasted period. Merit Based Application Grant Opportunities – These opportunities are announced on a periodic basis and typically involve extensive application processes and conditions/restrictions with respect to the use of these funds. The County has continued to apply for these opportunities as they arise. The Province announced its Municipal Infrastructure Investment Initiative in late 2012, outlining how it will provide available funding to municipal capital investments in the future. A key criteria related to this fund is the development of comprehensive asset management plans. The County was successful in receiving $50,300 to assist in developing such a plan and is part of the 2013 capital projects. Future grant allocations will be based on specific evaluation criteria as previously mentioned. The County has submitted an application for a water related project to offset the infrastructure burden in this service area. Although the Federal government has not announced any future funding opportunities, it is anticipated that similar criteria will be implemented to allocate any available funds. County staff will continue to monitor this position at the Federal level. Ultimately the availability of these grant funds is extremely limited and shared across all municipalities in the Province or Canada as the case may be. One-Time Grant Allocations – There is no on-going upper level of government source of funds for these Grant opportunities. Given the current economic forecast and recent announcements, there will likely be no additional “one-time” grant funds available in the near future. The notable exceptions continue to be the Joint Emergency Preparedness Program (“JEPP”) grants for emergency services and Ministry of Health (MOH) for public access defibrillators. Included in the forecast are grants funds totaling $147,000 for MOH grants. Although there have been funds available from the Ministry of the Environment (MOE) for Landfill Gas projects in the past, no funds are currently available over the forecasted period. These funds are only available for waste disposal/diversion projects and staff will continue to apply for these opportunities for eligible projects if they become available. The County will continue to apply for Cultural specific grants for the Dunnville Library expansion project, deferred to 2014 since there does not appear to be grants available currently. To date, the County has been unsuccessful in obtaining grant funding to support this project. This project is contingent on successfully obtaining grant funding of approximately $800,000. As such there is no confirmed source for the funds currently included in the capital forecast while staff continues to seek grant opportunities specific to this project. Although the County does not currently have a policy governing the allocation of unrestricted grant allocations, the underlying capital financing principles provide the framework for directing all sources of capital financing. The tax supported forecast as presented to Council, based on proposed annual increases above the current portion of the tax levy, provides the necessary capital funding with limited use of debt. As a result, given the current financial pressures being exerted on the water and wastewater programs, Council has previously approved directing any one-time unrestricted grants/funding opportunities, if they become available, to this area. As annual increases in rates associated with water and wastewater services have neared double digits in the past years, these funds will help alleviate financial pressures and mitigate rate increases in coming years. As the County’s user rates are currently among the highest in the Province, this will have positive impacts on all the users of these systems as well as on the potential economic development of the County as a whole.
Impacts on Long Term Debt
As outlined in the Capital Financing Principles, debt financing for tax supported projects is utilized in limited circumstances. With the exception of the Grandview Lodge redevelopment, the County currently has a limited outstanding debt load supported from taxation. As indicated above, the proposed projects to be financed in the Capital Forecast relate to the multi-purpose fire hall/ambulance centers in Hagersville and Cayuga in 2013 and redevelopment of the Cayuga Library Branch also in 2013. Total proposed debt is approximately $3.7 Million to be issued in 2015. The County is expected to issue debt on completed/work in progress capital projects early in 2013 (i.e. balance of Grandview Lodge redevelopment; Lowbanks Fire Hall/Community Centre, HCCC and the arena redevelopment projects in Cayuga and Dunnville).

Treasurer’s 2013 Draft Tax Supported Capital Budget and Forecast Report
Page XVIII
The Ministry of Municipal Affairs and Housing regulates the level of debt that may be incurred by municipalities - no more than 25% of total own purpose revenue can be used to service debt and other long-term obligations. Based on projected credit limits as established by the Ministry of Municipal Affairs (assuming approximately a 3% increase in revenue fund net revenues annually), the County is well within its available credit limit. It should be noted that despite the limits imposed by the Province, a prudent municipality would not consider a debt burden to this level. As a result, a guideline has been established in the Capital Financing Principles at a 10% annual debt repayment limit based on own source revenues.
Based on the projections, Tax supported debt payments do not exceed 2.8% of the County’s annual net revenue fund revenues over the forecasted period. Total debt payments (including projected water and wastewater related debenture financing) do not exceed 4.5% over the same period. Relative to the Provincial Limit, the County could legally incur additional annual debt payments in 2013 in excess of $6 Million; however this would have a monumental impact on the tax and rate payers. The following graph reflects the proposed tax supported debt payments in relation to the 10% benchmark established in the Capital Financing Principles. As depicted, virtually all the tax supported debt relates to existing debt charges (this includes debt charges for completed/in progress capital projects for which debt payments have been committed but net yet incurred (i.e. Grandview Lodge Redevelopment, HCCC, Lowbanks Fire Station and Cayuga/Dunnville arena redevelopment projects). These particular projects represent annual debt repayments of approximately $977,000 (debt to be issued in 2013 with payments partial payments starting in 2013 and full payments in 2014). Debt payments related to new projects included in the 2013 Draft Tax Supported Capital Budget and Forecast have an impact on the overall tax supported future repayments of approximately $449,000 starting in 2014 (see Summary 4 in budget document). The maximum in year debt repayments (interest and principle portions) does not exceed $4.6 million (including both tax and rate supported debt payments) at any point during the forecast period (ranging from $3.0 Million to just under $4.6 Million).
The above graph excludes any debt required to offset the timing of cash flows related to Development Charge receipts (typically referred to as “DC Debt”). The impact on the Development Charge Reserve Funds is explained in detail below. Rate supported debt charges are based on prior year’s capital forecast projections.
In general terms, as the level of debt increases, the County’s degree of flexibility to meet unanticipated expenditures diminishes. Also, the level of debt held by the municipality is a key indicator when rating agencies evaluate a municipality’s relative financial strength. A lower credit rating results in higher interest rates paid on future debt instruments. Higher interest rates and annual debt payments can reduce budgetary options in financing service levels within the public’s expectations as to what an acceptable levy increase is, particularly for new or growth related infrastructure requirements. Given the significant infrastructure requirements, the future use of debt is unavoidable, however, fiscally sound debt policies ensure:
• That outstanding debt obligations will not threaten long-term financial stability;
• That the amount of outstanding debt will not place undue burden on property taxpayers;
• The municipality maintains the flexibility to take advantage of opportunities that arise; and
• A better matching of the ratepayers’ cost of financing the proposed project with future benefits derived from the public sector investment.

Treasurer’s 2013 Draft Tax Supported Capital Budget and Forecast Report
Page XIX
Impacts on Reserves and Reserve Funds
Reserves and Reserve Funds form a critical component of the County’s long-term financing plan and represent the major financing source of projected future capital projects. Included in the appendices is a summary of the tax supported Capital Replacement Reserves (CRR) and specific Capital Reserves (i.e. Park Dedication, Land Sales, etc.) and details of each specific reserve. These reserves only reflect the capital related reserves that have been established for general or specific replacement of tax supported capital expenditures. Debt issuance is utilized when sufficient funds are not available in specific reserves. Income for these funds is derived from the County’s tax levy. Based on the recommended 1.0% increase in capital related levy for 2013, there are available additional contributions to reserves (net of any changes in annual debt payments). The available additional reserve contributions in 2013 are approximately $766,500. Due to the acceleration of the Hagersville firehall/ambulance station in 2013, some of these funds were already committed as part of the 2012 budget to offset the anticipated future debt repayments. As a result, there is approximately $391,500 of one-time contributions to be allocated in 2013. Given the financing needs over the forecasted period and relative balances in the applicable reserves, some re-alignment of current annual contributions is also recommended. The rationale for the above recommendations is as follows:
• CRR-General for fire/ambulance stations: It is recommended (similar to the practice utilized from Grandview Lodge re-development and the Dunnville and Cayuga arenas) to ramp up the transfer to CRR-General specifically to offset future debt payments for the multi-purpose fire/ambulance stations in Hagersville and Cayuga. This is a two year phase-in to match the ultimate annual debt payments, started in 2012 to minimize the levy impact in 2014 (when the debt is anticipated to be issued). As a result, it is recommended that an additional $375,000 be allocated to CRR-General for these projects.
• CRR-Roads Infrastructure: Given the significant reduction in this reserve over the first three years of the forecast and the fact that it is projected to have a negative balance in 2014, it is recommended that the additional available contributions of approximately $391,500 be allocated to this reserve.
• CRR-Roads Infrastructure: Not withstanding the above recommendation, given the acceleration of Caithness Street, in lieu of debt financing this project, it is recommended to re-allocate annual contributions from CRR-Storm Sewer to CRR-Roads Infrastructure. Based on the anticipated needs over the 10 year forecast and relative balances in these reserve funds, it is recommended to re-allocate $500,000 in annual contributions from CRR-Storm Sewer to CRR-Roads Infrastructure reserve respectively. This reallocation will maintain relative balances in these reserves based on future overall infrastructure needs.
• Library Reserve Fund: Based on the current reserve fund balance and anticipated funding/expenditures, this reserve fund will be in a negative balance by the end of the forecast period. As these operations are managed by a specific Library Board which is accountable for its operations, it is recommended that the Board review their long term financing plan in relation to the anticipated projects and ensure adequate financing is available for all anticipated projects.
The application of reserve funds to specific projects was applied based on the principles outlined in the Capital Financing Principles. The key objective is to maintain a positive balance in each specific reserve over the forecast period while limiting the level of internal financing over the same period. Over the forecasted period, all the reserve/reserve fund financial principles are maintained.

Treasurer’s 2013 Draft Tax Supported Capital Budget and Forecast Report
Page XX
The above chart depicts the anticipated year end balances of the reserves specifically dedicated to capital replacement (it does not include the Development Charges Reserves which are detailed below or anticipated future annual increases as they have not been approved/allocated to a specific reserve). Over the forecasted period, a consistently healthy reserve balance is maintained. However, there is a significant reduction in the overall capital replacement reserve balance in the “Short-Term” (first three years) as major infrastructure replacements are planned. Not by coincidence, this is the period where the best information related to replacement of existing assets is available. Based on anticipated 2012 year end balances, it will take over 7 years to return to the current reserve balances. In addition, there are replacement capital projects not fully reflected in the later part of forecast (road/bridges, facilities, parks and recreational facilities) that would likely negatively impact the future forecasted reserve balances (these will be better identified through an asset management plan). As identified in the “estimated infrastructure deficit”, there is over $103 Million of current assets fully amortized for financial reporting purposes. This far exceeds the current capital reserve balances of approximately $26.8 Million. As previously noted, after the first three years, there tends to be a curtailing of known replacement capital projects. Using the asset inventory for financial reporting purposes and condition assessments to identify optimum replacement timeframes, more comprehensive replacement/re-development plans can be developed for all years included in the forecasted period to better reflect the financing needs (i.e. the development of a Sustainable Asset Management Plan). As a result, in order to adequately fund the proposed capital program, to stabilize year over year fluctuations in the municipal levy and to avoid the issuance of debt on ongoing replacement and renovation/maintenance programs, it is anticipated that these annual contributions will need to be continually increased in future years (i.e. beyond 2013). As the comprehensive replacement needs for the County are better understood, a more fiscally responsible plan can be developed to balance debt and reserve funding. The County’s past commitment to increase the annual capital levy has begun to address the anticipated shortfalls and will need to be re-evaluated for future years.
Impact on Development Charges Reserve Funds Limited funding over the forecasted period is derived from development charges receipts. During the comprehensive update to the development charges by-law in 2009, detailed capital projects and the relative growth related proportions were identified. Incorporated in this analysis is the financing of these requirements over the next 10 years (the 10 year forecasted balance of these reserve funds was calculated in the Development Charges Background Study and has this portion of the background study has not been reprinted in this document). As a result, the projects included in the Capital Budget Forecast include specifically the projects outlined in the Background Study for the 2009 update of the Development Charges By-law, as adjusted for revisions, if any, to the originally estimated costs. As indicated above, the majority of the approximately $7.8 Million in development charge funding is for fire/ambulance stations, road re-development, bridge reconstruction and storm sewer redevelopment. The inclusion of new/revised projects anticipated to be funded from development charges will be evaluated and included for Development Charge funding, if applicable, in the next Development Charge Study scheduled for 2013. During the setting of the development charge rates, the anticipated timing of receipts in relation to the infrastructure needs was evaluated. As a result, it was anticipated that certain Development Charges reserve funds would be “negative” over the period covered by the current rates. These shortfalls would be offset by borrowing (“DC Debt”) which would ultimately be collected from future rates (as these costs are fully self financed). A summary of the projected Development Charge Reserve funds over the forecasted period is included in Appendix C (based on actual results since 2009). As indicated by this analysis, the anticipated reserve funds are currently in line with the Background Study. During the DC Update in 2013, the relative development charge reserve fund balances will be re-evaluated based on growth related infrastructure needs for new development.
Conclusion/Recommendations Despite continued difficult financial times, from a long range sustainability perspective, the 2013 Draft Tax Supported Capital Budget and Forecast attempts to maintain the County’s fiscal health and is based on sound fundamental financial principles. As an organization, despite the County’s geographic size, limited tax base, constraints on development and the demands/issues resulting from restructuring, the County has made significant progress over the past years in developing a long range approach to capital budgeting. Continual improvements to the Capital Budget process will assist the County to better allocate resources and manage its significant investments in capital infrastructure.

Treasurer’s 2013 Draft Tax Supported Capital Budget and Forecast Report
Page XXI
By maintaining the current capital-related levy allocation capital infrastructure, the County will achieve the following:
• Continued commitment to increase our investment in the County’s infrastructure to ensure safe, reliable services to develop and grow our municipality;
• Maintain the County’s “Good Fiscal Health” while ensuring adequate reserves are available for future infrastructure replacements;
• Limited increases in the use of debt to finance capital replacements, thereby maintaining flexibility to address infrastructure needs as they arise.
As indicated, although there is a recommended 1.0% increase to the capital related levy in 2013, it is also recommended that future increases will be required to maintain the current relative financial position. It must be reiterated as well that the impacts of specific asset replacement/initiatives are not fully captured within this proposed budget document (i.e. roads/bridges, parks and recreational facilities, facility replacements/re-development and future staff accommodation issues). As the comprehensive replacement needs for the County are better understood, a more fiscally responsible plan can be developed to balance debt and reserve funding (i.e. reduce the “infrastructure deficit”). It is therefore recommended that Council adopt the 2013 Draft Capital Budget and Forecast to 2022 and the financing sources recommended therein. Approval of the 2013 Draft Capital Budget and Forecast approves the specific capital projects outlined in 2013 and endorses in principle the projects from 2014 to 2022. A commitment to a pre-determined tax levy increase associated with this continued investment in capital infrastructure will provide for better long range planning and predictable annual capital levy increases for taxpayers. It is also recommended that the proposed increase(s) in annual contributions to specific capital replacement reserves, as outlined in Summary 4 in the Executive summary on page A-4, be approved. Respectfully Submitted by, Mark Merritt, CA Karen General, CGA Treasurer General Manager, Corporate Services

SUMMARY 1
PROJECTS GREATER THAN $100,000:
2013 2014 2015 2016 2017 2018 2019 2020 2021 2022 TotalDIVISIONS Repair/Replacement of Existing Assets
Projects Added - EXCLUDING ADDITION OF 2022 YEAR
Facilities Establish and implement asbestos management program for all County facilities SOGR 332,000 332,000
Facilities Consulting services for a detailed audit/assessment of the roofs SOGR 150,000 150,000
Facilities Cayuga Administration Building - Replace complete boiler system with new HVAC unit. SOGR 15,000 100,000 115,000
Fire Services Replacement of fire dispatch system SOGR 100,000 100,000
Fire Services Cayuga Fire Administration Offices New/Enhanced 495,000 495,000
Fire Services Cayuga Relocation/Demolition Parks Yard New/Enhanced 520,000 520,000
Fire Services South Haldimand Bay Construction New/Enhanced 500,000 500,000
Fleet and Equipment Pool
Addition of 1 Loader / Back Hoe in 2013 - Moved forward from 2024 - unit 09-1281 $130K has experienced
hydraulic / boom problems. The additional time needed for repair, has affected the services levels. This unit
identified as needing replacement in the 2013 budget; whereas in 2012 Forecast scheduled for 2024
replacement. Project also shown in Projects moved (Summary 3).
SOGR 130,000 130,000
Other Roadwork
Concession 13 Walpole - Rd 20 to Rd 74 - Project identified by Roads Operations in early 2012. Ditching of
some sections completed by Roads Operations. Detailed investigation of project indicated that significantly
higher level of work than originally identified was required to remediate road.
SOGR 600,000 550,000 1,150,000
Other Roadwork
Contract Technical Support - Project identified to provide additional resources for managing contracts to allow
full time Engineering staff to focus their attention on contracts with complexity beyond what is expected of
normal contracts
SOGR 60,000 60,000 60,000 180,000
Structure ProjectsPedestrian Walkway (977402) - Rehab of walkway underneath the Nanticoke Parkway leading to the old
Regional office. Repair includes replacement/repair of the lighting and tunnel liningSOGR 100,000 100,000
Structure ProjectsTownline Rd Culvert (987406) - Project added in 2016 as rehab of existing culvert, guiderail improvements
and minor paving have been identifiedSOGR 275,000 275,000
Structure ProjectsConc 9 Walpole Rehab (0100136) - Project added in 2015 as rehab of existing culvert, guiderail
improvements and minor paving have been identifiedSOGR 300,000 300,000
Structure ProjectsHart Road Drain Replacement (00005C) - added in 2017 as culvert was identified through OSIM report as a
priority replacementSOGR 200,000 200,000
Structure ProjectsOswego Bridge Rehab (981501) - added to 2019 as identified through the OSIM investigation as a priority
rehabilitation SOGR 250,000 250,000
Structure Projects Removal of CNR Bridge (985402) - added to 2019 - removal of existing overhead CNR bridge SOGR 150,000 150,000
Structure Projects Removal of CNR Bridge (000016) - added to 2019 - removal of existing overhead CNR bridge SOGR 150,000 150,000
Structure ProjectsMud Street Culvert Rehab (980907) - added to 2020 - project includes rehabilitation of existing culvert
including end repairs, guiderails, soffit repairsSOGR 150,000 150,000
Structure ProjectsIndian Line Culvert Rehab - added to 2020 - project includes the end repairs of the existing culvert, guiderail
and shouldering SOGR 100,000 100,000
Structure Projects Townsend Parkway Culvert Rehab (987404) - project added in 2020 SOGR 200,000 200,000
Structure Projects Townsend Road 74 Culvert Rehab (987405) - project added in 2020 SOGR 100,000 100,000
Structure Projects Townsend Road 74 Culvert Rehab (987407) - project added in 2020 SOGR 100,000 100,000
Structure Projects Caithness Street Culvert Rehab (000006-C) - project added in 2021 SOGR 100,000 100,000
Structure Projects Conc 4 Rainham Bridge Rehab (000009) - project added in 2021 SOGR 100,000 100,000
Structure Projects Conc 4 Rainham Bridge Rehab (000045) - project added in 2021 SOGR 100,000 100,000
HALDIMAND COUNTY
Gross Expenditures
State of Good
Repair/ Enhanced
Service
New Projects Added or Projects Deleted
2013 to 2022 TAX SUPPORTED CAPITAL FORECAST
Pg 1 of 3A-1

SUMMARY 1
PROJECTS GREATER THAN $100,000:
2013 2014 2015 2016 2017 2018 2019 2020 2021 2022 TotalDIVISIONS Repair/Replacement of Existing Assets
HALDIMAND COUNTY
Gross Expenditures
State of Good
Repair/ Enhanced
Service
New Projects Added or Projects Deleted
2013 to 2022 TAX SUPPORTED CAPITAL FORECAST
Structure Projects Sunny Bank Park - Bridge Rehab (000019) - project added in 2021 SOGR 300,000 300,000
Structure Projects Johnson Bridge Rehab (010022) - project added in 2021 SOGR 100,000 100,000
Structure Projects Balmoral Bridge Rehab (985301) - project added in 2021 SOGR 100,000 100,000
Urban PavingCaledonia - Stirling Street - CNR Tracks to Argyle Street - Identified as a priority through the Road Needs
StudySOGR 148,300 148,300
Urban Paving Caledonia - Highland Blvd - Tartan to E Limit - Identified as a priority through the Road Needs Study SOGR 107,500 107,500
Storm Sewer Maintenance Talbot Street - identified through a change of scope in the entire Talbot Street Reconstruction Project SOGR 500,000 500,000
Waste Disposal Sites
As a result of the Recommendation to proceed with Option 3, As presented in PW-ES-22-2012, Waste
Management Strategic Options Analysis on November 5th, 2012 - Addition to the years 2015 to 2022 - for the
Canborough Waste Management Facility Repairs
SOGR 30,000 30,000 30,000 30,000 30,000 30,000 30,000 30,000 240,000
Waste Disposal Sites
Waste Transfer Facility - Design, Canborough - Added 2013 - Staff have completed a strategic options
analysis for the Haldimand County Waste Management program. The generalized outcome of the analysis is
that transferring our curbside waste to a third party for disposal is more cost effective than landfilling the
waste at the future Canborough landfill site. The Tom Howe Landfill is expected to reaches its operating
capacity in 2015. In order to ensure adequate schedule to establish a new waste transfer facility,
construction must begin in 2014, with the design and engineering work completed in 2013.
New/Enhanced
Service200,000 200,000
Waste Disposal Sites
As a result of the Recommendation to proceed with Option 3, As presented in PW-ES-22-2012, Waste
Management Strategic Options Analysis on November 5th, 2012 - Addition to 2014 - for the Canborough
Waste Transfer Station Development
New/Enhanced
Service5,350,000 5,350,000
Waste Disposal Sites
As a result of the Recommendation to proceed with Option 3, As presented in PW-ES-22-2012, Waste
Management Strategic Options Analysis on November 5th, 2012 - Addition to 2018 and 2020 - for the
Canborough Waste Transfer Station Upgrades
New/Enhanced
Service25,000 100,000 125,000
Waste Disposal Sites
As a result of the Recommendation to proceed with Option 3, As presented in PW-ES-22-2012, Waste
Management Strategic Options Analysis on November 5th, 2012 - Addition to the Years - 2015 to 2022 - for
the Canborough Landfill Perpetual Care - General Maintenance
SOGR 300,000 10,000 10,000 10,000 10,000 10,000 10,000 10,000 370,000
Waste Disposal Sites
Leachate Manhole Repairs - Tom Howe - Added - 2013, 2014 - Repairs to leachate collections system
manholes. Price based on current tender results at $25,000 per manhole. 10 manholes to be repaired over
two year period (5 manholes per year).
SOGR 125,000 125,000 250,000
Land Ambulance Electronic Patient Care Reporting System New/Enhanced 100,000 100,000
Arenas Hagersville - Additional Dressing Rooms (PED-COM-18-2012) New/Enhanced 40,000 360,000 400,000
Community Halls Annual Community Halls Projects - Capital Repairs SOGR 35,000 35,000 35,000 35,000 35,000 35,000 35,000 35,000 35,000 35,000 350,000
Community Halls Caledonia Lions Hall Structural Repairs - added as per assessment (2013: Structure; 2015: Roof) SOGR 20,000 80,000 100,000
Community Halls Fisherville Hall Roof Replacement - added as per assessment SOGR 170,000 170,000
Community Partnership Capital Annual Community Partnership Capital Projects New/Enhanced 150,000 150,000 150,000 150,000 150,000 150,000 150,000 150,000 150,000 150,000 1,500,000
TOTAL PROJECTS ADDED 16,457,800$
Pg 2 of 3A-1

SUMMARY 1
PROJECTS GREATER THAN $100,000:
2013 2014 2015 2016 2017 2018 2019 2020 2021 2022 TotalDIVISIONS Repair/Replacement of Existing Assets
HALDIMAND COUNTY
Gross Expenditures
State of Good
Repair/ Enhanced
Service
New Projects Added or Projects Deleted
2013 to 2022 TAX SUPPORTED CAPITAL FORECAST
Projects Deleted - EXCLUDING 2012 Open/Active Projects
FinanceAsset Management Software - project removed from Finance budget and added to Information Systems at a
reduced amount ($30,000 rather than $100,000)New/Enhanced 100,000 100,000
Support ServicesPayment Manager Software - project removed from Support Services budget and added to Information
Systems replacement of Financial System Software project in 2015New/Enhanced 110,000 110,000
Support Services Constituent Relationship Management Software - not viewed as a corporate priority at this time New/Enhanced 105,000 105,000
Fire ServicesDesign Fire/EMS Facilities has been removed as a stand alone item and are now allocated within the station
replacement budgetsNew/Enhanced 100,000 100,000
Ontarians with Disabilities
Administration
Removed budget as each capital project being considered should be taking accessibility compliance
improvements into considerationNew/Enhanced 100,000 96,000 90,000 96,000 100,000 100,000 100,000 96,000 100,000 878,000
Fleet & Equipment Pool Removed 3 Fire Apparatus Pumpers due to Emergency Services Station Location/Rationalization Study SOGR 820,000 380,000 1,200,000
Fleet & Equipment Pool Removed 1 Fire Apparatus Tanker due to Emergency Services Station Location/Rationalization Study SOGR 135,000 135,000
Road ReconstructionFuture Road Reconstruction - Placeholders have been removed - no detailed projects currently identified for
these yearsSOGR 1,000,000 1,000,000 2,000,000
Hot Mix ResurfacingCay - Munsee St S Brant to Talbot - removed as a portion of of this road will be completed in 2015 Talbot St
project; Also, estimated costs did not outweigh the needSOGR 600,000 600,000
Structure ProjectsFuture Structure Projects - per OSIM - Placeholders have been removed and replaced with more detailed
projects SOGR 1,500,000 1,500,000 1,500,000 4,500,000
Urban Paving Cay- Monture St - Hwy 3 to North End - removed as the road received surface treatment in 2012 SOGR 122,500 122,500
Storm Sewer MaintenanceCal-Wigton St-Argyle to Haddington - removed from 2013 as detailed investigation identified
replacement/rehabilitation is not required at this timeSOGR 350,000 350,000
Waste Disposal Sites
As a result of the Recommendation to proceed with Option 3, As presented in PW-ES-22-2012, Waste
Management Strategic Options Analysis on November 5th, 2012 - Deletion of the Canborough Weigh Scale
Replacement in 2013
SOGR 100,000 100,000
Waste Disposal Sites
As a result of the Recommendation to proceed with Option 3, As presented in PW-ES-22-2012, Waste
Management Strategic Options Analysis on November 5th, 2012 - Deletion of the Canborough Gas Collection
System in 2018
SOGR 1,300,000 1,300,000
Waste Disposal Sites
As a result of the Recommendation to proceed with Option 3, As presented in PW-ES-22-2012, Waste
Management Strategic Options Analysis on November 5th, 2012 - Deletion of Canborough Cell 1 Reopening
in 2014
SOGR 100,000 100,000
Waste Disposal Sites
As a result of the Recommendation to proceed with Option 3, As presented in PW-ES-22-2012, Waste
Management Strategic Options Analysis on November 5th, 2012 - Deletion of Canborough Cell 2
Development in 2014
SOGR 3,100,000 3,100,000
Waste Disposal Sites
As a result of the Recommendation to proceed with Option 3, As presented in PW-ES-22-2012, Waste
Management Strategic Options Analysis on November 5th, 2012 - Deletion of Canborough Cell 3
Development in 2016 and 2017
SOGR 300,000 2,000,000 2,300,000
Waste Disposal Sites
As a result of the Recommendation to proceed with Option 3, As presented in PW-ES-22-2012, Waste
Management Strategic Options Analysis on November 5th, 2012 - Deletion of Canborough Cell 4
Development in 2019 and 2020
SOGR 300,000 1,900,000 2,200,000
Pools Caledonia change house removed due to Caledonia Kinsmen Park Project SOGR 197,000 197,000
TOTAL PROJECTS DELETED 19,497,500$
NET DIFFERENCE 3,039,700-$
Pg 3 of 3A-1

SUMMARY 2
PROJECTS GREATER THAN $100,000:
DIVISIONS DESCRIPTION
State of Good
Repair/
Enhanced
Service
2012 to
2021
2013 to
2022
Increase/
(Decrease)
Division Description rankingSOGR/NEW 1 2 3 4 total
Information Systems Desktops (58) - reduction based on descrease to desktop inventory (4) SOGR 842,400 826,800 (15,600)
Information Systems Laptops (7) - increase based on increase to laptop inventory (3) SOGR 182,400 191,900 9,500
Information SystemsDesktop Operating System - increased due to the increase in number of computers (desktops and
laptops) to the inventorySOGR 296,000 320,000 24,000
Information SystemsSoftware Replacement - increased due to changes to Financial System Replacement based on
updated pricing and combining other related softwareSOGR 834,000 924,000 90,000
Information Systems
Cell Phone/Smartphone Replacement/Upgrade - Overall decrease, although inventory increased from
131 to 133. 2012 project open/active ($18,000); 2013 increase from $2,500 to $7,500 in anticipation of
early replacements due to failure; $2,500 added to 2022
SOGR 162,000 151,500 (10,500)
Support Services
Furniture Replacement - increased due to $69,700 being added to 2022, 2013 replacements broken out
into separate projects. Overall reduction in 2013 after scheduled items reviewed and determined not to
be required for replacement at this time.
SOGR 499,400 522,400 23,000
Facilities Cayuga Administration Parking Lot - changed to replace rear parking lot only SOGR 300,000 150,000 (150,000)
Fire ServicesHose Capital Forecast has been reduced by $10,000/year based on an assessment of the current age
and condition of hose. Tested each year and replaced as needed.SOGR 300,000 197,000 (103,000)
Fire ServicesHagersville Replacement Station - square footage changed from 7,000 to 7,500 and price per square
foot changed from $190 to $210. Purchase of land included in budget.SOGR 1,700,000 2,012,500 312,500
Fire ServicesCayuga Replacement Station - square footage changed from 7,000 to 7,500 and price per square foot
changed from $190 to $210. SOGR 1,330,000 1,697,500 367,500
Fleet and Equipment Pool
Cars, Vans, Pickups - (1) Increase in cost for a Four WHD with Plow and Sander, of $5,000 per unit.
(2) By-Law units have a scope change from the purchase of a Mid-size Car at $24,000/unit to the
purchase of a Compact Pickup/SUV at $23,000/unit, decrease of $1,000/unit . (3) change in Class
only, for the purchase of 3 units - Four WHD Pickups, rather than Club Cab Pickups, this will not result
in an increase to the cost per unit
SOGR 1,647,000 1,613,000 (34,000)
Fleet and Equipment PoolLoaders, Tractors, Sweepers - Back hoe brought forward from 2024 to 2013 (project also included in
New Projects (Summary 1) and Projects Moved (Summary 3)SOGR 1,461,000 1,591,000 130,000
Fleet and Equipment Pool Plow Trucks and Motor Graders - Increase of $10,000/unit for a Motor Grader SOGR 4,630,290 4,815,000 184,710
Gross Expenditures
HALDIMAND COUNTY
2013 to 2022 TAX SUPPORTED CAPITAL FORECAST
Scope/Price Increase/(Decrease)
Pg 1 of 5
A-2

SUMMARY 2
PROJECTS GREATER THAN $100,000:
DIVISIONS DESCRIPTION
State of Good
Repair/
Enhanced
Service
2012 to
2021
2013 to
2022
Increase/
(Decrease)
Gross Expenditures
HALDIMAND COUNTY
2013 to 2022 TAX SUPPORTED CAPITAL FORECAST
Scope/Price Increase/(Decrease)
Fleet and Equipment PoolRiding and Push Mowers - small equipment, minor variance in the costs and units being purchased
Class SOGR 402,400 486,400 84,000
Fleet and Equipment PoolMiscellaneous Equipment & Tools - small equipment, minor variance in the costs and units being
purchased SOGR 280,450 264,450 (16,000)
Fleet and Equipment PoolIce Equipment - Ice Resurfacer increase from $82,000/unit to $90,000/unit, 4 units scheduled for
replacement, (appears as a decrease due to the completion of the 2012 purchases)SOGR 435,000 390,000 (45,000)
Other RoadworkPreliminary Engineering Investigations - annual project reduced from $20K per year to $15K per year to
better reflect historical expendituresSOGR 200,000 150,000 (50,000)
Other RoadworkHald Rd 70 - Rainham Rd to Highway 6 - project has been extended to Highway 6 and will require
some additional padding to the existing surfaceSOGR 400,000 450,000 50,000
Other RoadworkSidewalk Replacement and Installation - increased to provide adequate budget for sidewalk work
requiredSOGR 1,460,000 1,500,000 40,000
Other Roadwork
Road Pulverizing-Resurfacing - removed amounts from placeholder in 2014/2015 as more details
projects have been identified; increased annual budget by $30K to $170,000 to better reflect
anticipated costs.
SOGR 1,120,000 1,190,000 70,000
Road ReconstructionCal - Caithness St W - Fire hall to Ross - price increased to reflect anticipated construction costs;
partially offset by recoveries from utilities ($400,000).SOGR 1,120,000 2,244,000 1,124,000
Road ReconstructionCayuga - Talbot Street - Ouse to Montour - the project was extended to Montour St rather than
Thorburn to allow for road resurfacing and shoulder paving SOGR 1,412,000 1,500,000 88,000
Road ReconstructionCal - Wigton St - Haddington to Argyle - project cost increased due to anticipated recovery from utilities
($350,000) as well as additional work required that was not originally estimatedSOGR 1,100,000 1,850,000 750,000
Road ReconstructionDun-Alder St - Niagara to West - $85K added in 2017 for engineering requirements in addition to minor
adjustments in estimated project costsSOGR 1,725,000 1,885,000 160,000
Road Reconstruction Cal - River Road - increased to reflect anticipated construction costs SOGR 900,000 1,200,000 300,000
Hot Mix Resurfacing McKenzie Road - Fuller to Hald Rd 9 - increased to reflect anticipated construction costs SOGR 1,800,000 2,000,000 200,000
Hot Mix ResurfacingMarshagan Rd - Hwy 3 - Niagara Townline - project combined into one year and costs adjusted to
reflect estimated construction valueSOGR 2,286,000 1,400,000 (886,000)
Hot Mix Resurfacing Cay - Munsee St N - Talbot to Indian - budget increased to better reflect estimated construction costs SOGR 330,000 500,000 170,000
Hot Mix ResurfacingDiltz Road - Niagara to Concession - Project moved from surface and expanded to include the entire
Diltz road. Arterial Road in need of rehabilitation.SOGR 510,000 1,400,000 890,000
Pg 2 of 5
A-2

SUMMARY 2
PROJECTS GREATER THAN $100,000:
DIVISIONS DESCRIPTION
State of Good
Repair/
Enhanced
Service
2012 to
2021
2013 to
2022
Increase/
(Decrease)
Gross Expenditures
HALDIMAND COUNTY
2013 to 2022 TAX SUPPORTED CAPITAL FORECAST
Scope/Price Increase/(Decrease)
Structure ProjectsFuture Structure Projects - reduced amount in 2020 as more detailed projects have been identified;
2021 & 2022 reduced to $1M as majority of major work will have been completed by this time.SOGR 4,500,000 2,500,000 (2,000,000)
Structure ProjectsTownsend Parkway Bridge Rehab - Budget decreased due to detailed costing estimate including
analysis of 2011/2012 tender resultsSOGR 312,000 200,000 (112,000)
Structure ProjectsNanticoke Creek Parkway Bridge Rehab - Budget decreased due to detailed costing estimate including
analysis of 2011/2012 tender resultsSOGR 260,000 150,000 (110,000)
Structure ProjectsWoodlawn Bridge Rehab - Budget increase due to detailed costing estimate including analysis of
2011/2012 tender resultsSOGR 1,010,000 1,115,000 105,000
Structure ProjectsSecond Line Bridge Oneida Rehab - Budget increase due to change in scope of bridge rehab based on
2011 OSIM inspectionSOGR 160,000 500,000 340,000
Structure ProjectsMattice Bridge Conc 3 Walpole Rehab - Budget increase due to change in scope of bridge rehab based
on 2011 OSIM inspectionSOGR 160,000 400,000 240,000
Structure ProjectsPeel Street Jarvis Replacement - Budget decrease based on detailed cost estimate including analysis
of 2011/2012 tender resultsSOGR 415,000 300,000 (115,000)
Structure ProjectsConc 3 Bridge Rainham Rehab (00006) - Budget increase based on detailed cost estimate including
analysis of 2011/2012 tender resultsSOGR 210,000 300,000 90,000
Structure ProjectsConc 3 Bridge Rainham Rehab (00007) - Budget increase based on detailed cost estimate including
analysis of 2011/2012 tender resultsSOGR 210,000 300,000 90,000
Structure ProjectsConc 7 Bridge Rainham Rehab (000014) - Budget increase based on detailed cost estimate including
analysis of 2011/2012 tender resultsSOGR 210,000 300,000 90,000
Structure ProjectsRiver Rd Bridge N - Cayuga Rehab (000017) - Budget increase based on detailed cost estimate
including analysis of 2011/2012 tender resultsSOGR 210,000 300,000 90,000
Structure ProjectsPeart Bridge - River Road Rehab (000032) - Budget increase based on detailed cost estimate including
analysis of 2011/2012 tender resultsSOGR 210,000 300,000 90,000
Structure Projects
Junction Road Culvert Rehab (000051) - Project moved from 2016 to 2019 based on 2011 OSIM
inspection. Budget increase due to detailed costing estimate including analysis of 2011/2012 tender
results.
SOGR 210,000 300,000 90,000
Structure ProjectsEmpire Rd Culvert Rehab (980909) - Budget increase based on detailed cost estimate including
analysis of 2011/2012 tender results.SOGR 210,000 250,000 40,000
Structure ProjectsCheapside Rd Bridge Rehab (010004) - Budget increase based on detailed cost estimate including
analysis of 2011/2012 tender resultsSOGR 300,000 350,000 50,000
Structure ProjectsTownline Bridge Replacement (D00005) - Budget increase based on detailed cost estimate including
analysis of 2011/2012 tender resultsSOGR 615,000 650,000 35,000
Urban Paving Caledonia - Heddel St - Haddington to Renfrew - Budget increase based on estimated construction SOGR 197,000 270,000 73,000
Pg 3 of 5
A-2

SUMMARY 2
PROJECTS GREATER THAN $100,000:
DIVISIONS DESCRIPTION
State of Good
Repair/
Enhanced
Service
2012 to
2021
2013 to
2022
Increase/
(Decrease)
Gross Expenditures
HALDIMAND COUNTY
2013 to 2022 TAX SUPPORTED CAPITAL FORECAST
Scope/Price Increase/(Decrease)
Urban Paving Dunnville - Pine St - North Cayuga to Conc - increase based on estimated construction costs SOGR 175,000 318,000 143,000
Urban Paving Dunnville - Chestnut - Queento S Cayuga - Budget increase based on estimated construction costs SOGR 80,000 185,000 105,000
Urban Paving Jarvis - Marley Cres - Craddock to Lafayette - reduced based on estimated construction costs SOGR 102,000 100,000 (2,000)
Gravel Road Conversion Conc 4 - Road 56 east to end - all but phase IV were accelerated in to 2012. SST remains in 2014 New/Enhanced 186,000 29,480 (156,520)
Gravel Road ConversionConc 4 Rainham - Road 12 to Road 8 all but phase IV were accelerated in to 2012. SST remains in
2014New/Enhanced 441,000 80,300 (360,700)
Gravel Road ConversionRiver Rd - S. Cay Rd to Hald-Dunn Townline all but phase IV were accelerated in to 2012. SST
remains in 2014New/Enhanced 407,000 63,800 (343,200)
Gravel Road ConversionTownline Road E - Windecker to Hwy 56 all but phase IV were accelerated in to 2012. SST remains in
2014New/Enhanced 351,000 55,000 (296,000)
Gravel Road ConversionConc 4 - Stoney Creek Rd to Road 56 - Phase I completed in 2012, remaining phases brought forward
to 2013/2014 as a result of changes from accelerated 2012 projectsNew/Enhanced 397,000 364,060 (32,940)
Gravel Road Conversion Conc 4 Rainham - Road 8 to Road 20 - adjusted based on estimated costs New/Enhanced 243,000 196,000 (47,000)
Gravel Road ConversionConc 2 Road S - Road 32 to Junction Rd - Phase 1 completed in 2012, remaining phases brought
forward one yearNew/Enhanced 392,000 343,000 (49,000)
Gravel Road ConversionWainfleet Line - Hwy 3 to Poth Road - Phase 1 completed in 2012, remaing phases brought forward
one yearNew/Enhanced 721,000 630,000 (91,000)
Gravel Road Conversion 4th Line Oneida - Broad Rd to end - Phase 1 completed in 2012 New/Enhanced 118,000 103,580 (14,420)
Gravel Road Conversion Broad Road - 4th Line to River Road - Phase 1 completed in 2012 New/Enhanced 473,000 414,400 (58,600)
Gravel Road Conversion Decewesville Road - Townline Rd to village - Phase 1 completed in 2012 New/Enhanced 224,000 196,000 (28,000)
Gravel Road Conversion Townline Rd E - Road 54 to Brooks Rd - Phase 1 completed in 2012 New/Enhanced 448,000 336,560 (111,440)
Gravel Road Conversion Townline Rd E - River to Road 54 - Phase 1 completed in 2012 New/Enhanced 128,000 112,000 (16,000)
Storm Sewer MaintenanceCal-Caithness St W-Firehall to Ross - Engineering component increased to $46,000 and Construction
reduced to $310,000 due to updated estimateSOGR 400,000 356,000 (44,000)
Storm Sewer MaintenanceDun-Alder St - Niagara to West - overall $314,000 added to project, for engineering requirements, and
adjustments in estimated project costs.SOGR 2,417,000 2,731,000 314,000
Pg 4 of 5
A-2
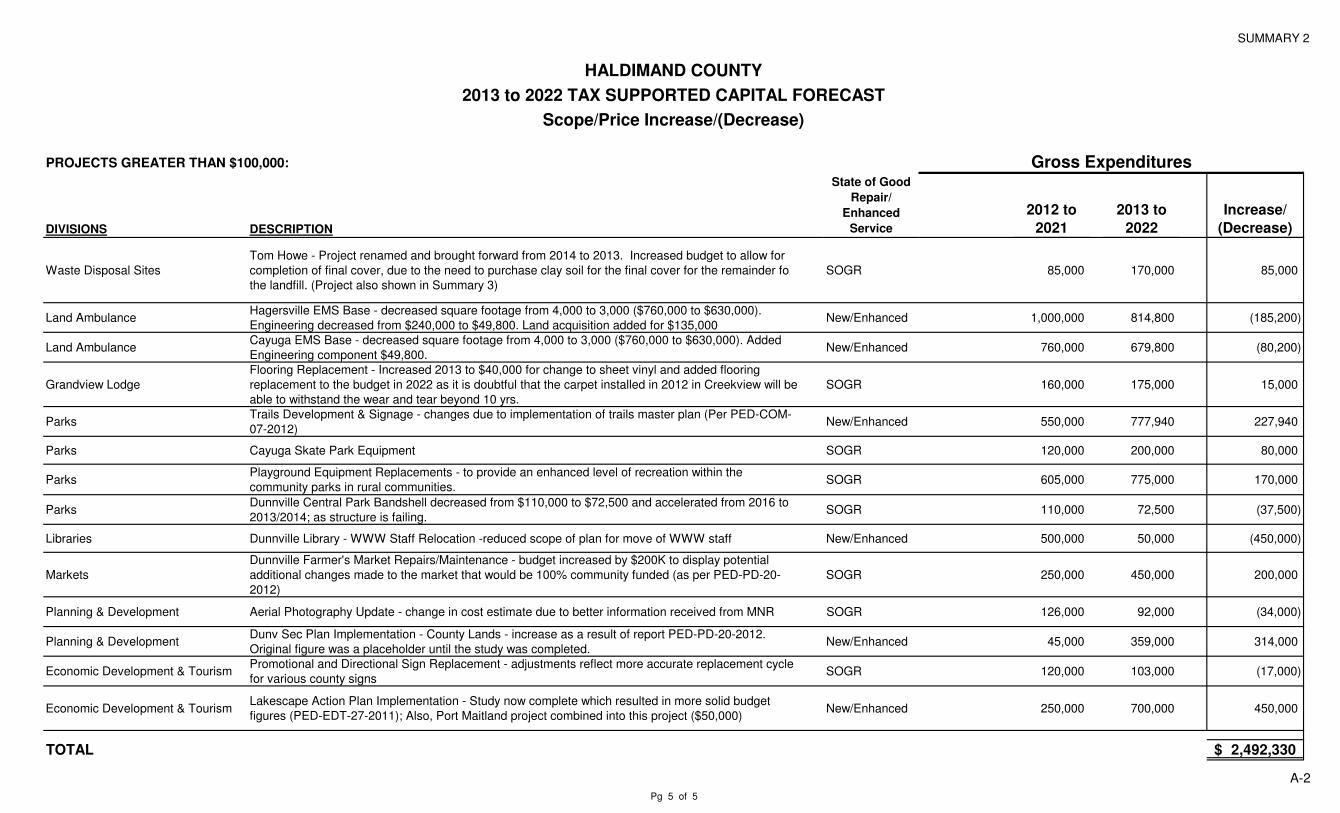
SUMMARY 2
PROJECTS GREATER THAN $100,000:
DIVISIONS DESCRIPTION
State of Good
Repair/
Enhanced
Service
2012 to
2021
2013 to
2022
Increase/
(Decrease)
Gross Expenditures
HALDIMAND COUNTY
2013 to 2022 TAX SUPPORTED CAPITAL FORECAST
Scope/Price Increase/(Decrease)
Waste Disposal Sites
Tom Howe - Project renamed and brought forward from 2014 to 2013. Increased budget to allow for
completion of final cover, due to the need to purchase clay soil for the final cover for the remainder fo
the landfill. (Project also shown in Summary 3)
SOGR 85,000 170,000 85,000
Land AmbulanceHagersville EMS Base - decreased square footage from 4,000 to 3,000 ($760,000 to $630,000).
Engineering decreased from $240,000 to $49,800. Land acquisition added for $135,000New/Enhanced 1,000,000 814,800 (185,200)
Land AmbulanceCayuga EMS Base - decreased square footage from 4,000 to 3,000 ($760,000 to $630,000). Added
Engineering component $49,800.New/Enhanced 760,000 679,800 (80,200)
Grandview Lodge
Flooring Replacement - Increased 2013 to $40,000 for change to sheet vinyl and added flooring
replacement to the budget in 2022 as it is doubtful that the carpet installed in 2012 in Creekview will be
able to withstand the wear and tear beyond 10 yrs.
SOGR 160,000 175,000 15,000
ParksTrails Development & Signage - changes due to implementation of trails master plan (Per PED-COM-
07-2012)New/Enhanced 550,000 777,940 227,940
Parks Cayuga Skate Park Equipment SOGR 120,000 200,000 80,000
ParksPlayground Equipment Replacements - to provide an enhanced level of recreation within the
community parks in rural communities. SOGR 605,000 775,000 170,000
ParksDunnville Central Park Bandshell decreased from $110,000 to $72,500 and accelerated from 2016 to
2013/2014; as structure is failing.SOGR 110,000 72,500 (37,500)
Libraries Dunnville Library - WWW Staff Relocation -reduced scope of plan for move of WWW staff New/Enhanced 500,000 50,000 (450,000)
Markets
Dunnville Farmer's Market Repairs/Maintenance - budget increased by $200K to display potential
additional changes made to the market that would be 100% community funded (as per PED-PD-20-
2012)
SOGR 250,000 450,000 200,000
Planning & Development Aerial Photography Update - change in cost estimate due to better information received from MNR SOGR 126,000 92,000 (34,000)
Planning & DevelopmentDunv Sec Plan Implementation - County Lands - increase as a result of report PED-PD-20-2012.
Original figure was a placeholder until the study was completed.New/Enhanced 45,000 359,000 314,000
Economic Development & TourismPromotional and Directional Sign Replacement - adjustments reflect more accurate replacement cycle
for various county signsSOGR 120,000 103,000 (17,000)
Economic Development & TourismLakescape Action Plan Implementation - Study now complete which resulted in more solid budget
figures (PED-EDT-27-2011); Also, Port Maitland project combined into this project ($50,000)New/Enhanced 250,000 700,000 450,000
TOTAL 2,492,330$
Pg 5 of 5
A-2

SUMMARY 3
PROJECTS GREATER THAN $100,000: 2013 2014 2015 2016 2017 2018 2019 2020 2021 2022 TotalGross Expenditures
State of Good
Repair/ Enhanced
Service
HALDIMAND COUNTY
2013 to 2022 TAX SUPPORTED CAPITAL FORECAST
Projects Moved - Shifts in Timing
Projects moved - shifts in timing:
Information SystemsDesktop Operating System - shifted from 2013/2018 to 2014/2019 as new version of MS
Office Suite does not have many added benefits over the current 2007 versionSOGR 160,000 160,000 320,000
Facilities Cayuga Administration - Energy Conservation Measures shifted from 2013 to 2017 25,000 25,000 25,000 25,000 100,000
Fleet and Equipment PoolCars, Vans, Pickups - Unit 07-0360 - Club Cab Pickup, $31,000 shifted from 2013 to 2015,
Unit 00-0150 - Full size Extended Van, $27,000 shifted from 2013 to 2014SOGR 27,000 31,000 58,000
Fleet and Equipment Pool
(1) - Addition of 1 Loader / Back Hoe in 2013 - Moved forward from 2024 - unit 09-1281 12b
$130K has experienced hydraulic / boom problems. The additional time needed for repair,
has affected the services levels. In the 2012 budget unit was scheduled for 2024
replacement. Project also shown as a New Project (Summary 1). (2) - Unit 99-0469,
originally scheduled for 2013, moved to 2014, to accomodate the replacement of 09-1281 in
2013.
SOGR 130,000 130,000 260,000
Fleet and Equipment Pool
Fire Apparatus Equipment - Support Vehicle - $10,000, shifts from 2013 to 2014. Trailer-
Utility Single Axle - $3,000, shifts from 2013 to 2014. Fire Rescue Boat and Motor -
$35,000, shifts from 2013 to 2014. Fire Rescue Boat Trailer - $2,500 shifts from 2013 to SOGR 92,500 92,500
$35,000, shifts from 2013 to 2014. Fire Rescue Boat Trailer - $2,500 shifts from 2013 to
2014. ERU Full Size - $42,000 shifts from 2013 to 2014.
Fleet and Equipment Pool
Fire Apparatus Pumper - Proceeding with the purchase of a Rescue/Pumper Unit rather than
a Pumper Unit. As well as being a change in Scope, the project has been accellerated from
2017 to 2013. Project also included in Projects Change in Scope (Summary 2)
SOGR 440,000 440,000
Fleet and Equipment Pool Fire Apparatus Rescue - Project shifted from 2013 to 2014 SOGR 220,000 220,000
Fleet and Equipment Pool
Ice Equipment - Ice Resurfacer (06-2202, Class 22b) Twin Pad resurfacer, was brought
forward for replacement in 2012 due to service hours. Based on an 8 year replacement
cycle, the new 2012 Ice Resurfacer will be replaced in 2020.
SOGR 90,000 90,000
Other RoadworkAbandoned Rail Crossing Rehab Program -$50K from 2014 now combined with $50 in 2013
as work is in one location in Hagersville SOGR 100,000 100,000
Other RoadworkHaldibrook Rd - Hwy 6 to Tyneside Rd - shifted from 2013 to 2014 as awaiting to hear from
City of Hamilton on their portion of the roadSOGR 400,000 400,000
Other Roadwork Roads Needs Study - changed to once every four years rather than once every five years SOGR 130,000 130,000 130,000 390,000
Road ReconstructionCal-Caithness St W - Fire hall to Ross - shifted from 2015/2016 to 2013/2014 per Council
Resolution (August 7, 2012)SOGR 244,000 2,000,000 2,244,000
Road ReconstructionDun-Ramsey Ext Ph II & Industrial Drive - moved from 2016 to 2020 due to further servicing
requirementsSOGR 1,193,000 1,193,000
Hot Mix ResurfacingCayuga - Thorburn St S - Talbot St S - Talbot to 230m S of Joseph - shifted from 2018 to
2015 to align with Talbot Street ReconstructionSOGR 225,000 225,000
Marshagan Rd - Hwy 3 - Niagara Townline - Was in 2013 and 2014, project has been Hot Mix Resurfacing
Marshagan Rd - Hwy 3 - Niagara Townline - Was in 2013 and 2014, project has been
combined into 2013 and budget changed to reflect anticipated construction costsSOGR 1,362,000 1,362,000
Hot Mix ResurfacingDiltz Road - Niagara to Concession - Project moved from surface and expanded to include
the entire Diltz road. Arterial Road in need of rehabilitation.SOGR 1,400,000 1,400,000
Hot Mix ResurfacingJar-Main N - Highway 3 to 1.3km N - moved from 2019 to 2016 to coordinate all four road
resurfacing projects at highway 6 and highway 3 intersectionSOGR 260,000 260,000
Hot Mix ResurfacingJar-Main S Hwy 3 to 760m S - moved from 2019 to 2016 to coordinate all four road
resurfacing projects at highway 6 and highway 3 intersectionSOGR 152,400 152,400
Hot Mix ResurfacingMines Rd - Greens Rd W to Greens Rd E - shifted from 2021 to 2020 to balance staff
workloadSOGR 315,560 315,560
Hot Mix ResurfacingMines Rd - Greens Rd W to Haldibrook Rd - shifted from 2021 to 2020 to balance staff
workloadSOGR 576,740 576,740
Pg 1 of 3
A-3

SUMMARY 3
PROJECTS GREATER THAN $100,000: 2013 2014 2015 2016 2017 2018 2019 2020 2021 2022 TotalGross Expenditures
State of Good
Repair/ Enhanced
Service
HALDIMAND COUNTY
2013 to 2022 TAX SUPPORTED CAPITAL FORECAST
Projects Moved - Shifts in Timing
Structure ProjectsStelco Bridge Rehab - shifted from 2013 to 2014 based on 2011 OSIM inspection and bridge
conditionSOGR 410,000 410,000
Structure ProjectsNanticoke Creek Pkwy Bridge Rehab - shifted from 2015 to 2014 based on OSIM inspection
and bridge conditionSOGR 150,000 150,000
Structure Projects
Junction Road Culvert Rehab (000051) - Project moved from 2016 to 2019 based on 2011
OSIM inspection. Budget increase due to detailed costing estimate including analysis of
2011/2012 tender results.
SOGR 300,000 300,000
Structure ProjectsDennis Bridge Rehab - shifted from 2013 to 2019 based on 2011 OSIM inspection and
bridge conditionSOGR 260,000 260,000
Structure ProjectsCal-Argyle St Bridge Replacement (MTO) - shifted from 2015 to 2017 to align with timing of
MTO Argyle bridge projectSOGR 1,300,000 1,300,000
Urban PavingCayuga - Echo St - Martin to Monture - shifted from 2018 to 2016 to better align with projects
in same geographical areaSOGR 119,000 119,000
Urban PavingDunnville - Pine St - North Cayuga to Conc - shifted from 2016 to 2015 to better align with
projects in same geographical areaSOGR 318,000 318,000
Urban PavingDunnville - Lock St - Chestnut to Pine - shifted from 2015 to 2014 to better align with projects
in same geographical areaSOGR 118,000 118,000
Urban PavingDunnville - Queen St - Maple to Chestnue - shifted from 2015 to 2014 to better align with
SOGR 100,000 100,000Urban PavingDunnville - Queen St - Maple to Chestnue - shifted from 2015 to 2014 to better align with
projects in same geographical areaSOGR 100,000 100,000
Urban PavingJarvis - Marley Cres - Craddock to Lafayette - shifted from 2015 to 2013 to better align with
projects in same geographical areaSOGR 100,000 100,000
Urban PavingHagersville - Alma from King to Marathon - shifted from 2020 to 2018 to better align with
projects in same geographical areaSOGR 175,000 175,000
Gravel Road ConversionConc 4 - Stoney Creek Rd to Road 56 - Phase 3 and 4 shifted forward to 2013 and 2014 due
to the acceleration of various projects in 2012New/Enhanced 315,000 49,060 364,060
Gravel Road ConversionConc 10 Walpole - Hwy 6 to Sandusk Road - Phase 3 and 4 shifted forward to 2013 and
2014 due to acceleration of various projects in 2012New/Enhanced 230,000 36,520 266,520
Gravel Road Conversion Conc 4 Rainham - Road 8 to Road 20 - shifted out from 2012 to 2014 due to wind turbines New/Enhanced 142,100 53,900 196,000
Gravel Road ConversionConc 2 Road S - Road 32 to Junction Rd - shifted to 2013 due to acceleration of various
projects in 2012New/Enhanced 147,000 142,100 53,900 343,000
Gravel Road ConversionWainfleet Line - Hwy 3 to Poth Rod - shifted to 2013 due to acceleration of various projects in
2012New/Enhanced 270,000 261,000 99,000 630,000
Gravel Road Conversion4th Line Oneida - Broad Rd to end - shifted to 2013 due to acceleration of various projects in
2012, including drainage works for this projectNew/Enhanced 44,400 42,900 16,280 103,580
Gravel Road ConversionBroad Road - 4th Line to River Road - shifted to 2013 due to acceleration of various projects
in 2012, including drainage works for this projectNew/Enhanced 177,600 171,680 65,120 414,400
Gravel Road ConversionDecewsville Rd - Townline Rd to village - shifted to 2013 due to acceleration of various
projects in 2012, including drainage works for this projectNew/Enhanced 84,000 81,200 30,800 196,000
Gravel Road ConversionTownline Rd E - Road 54 to Brooks Rd - shifted to 2013 due to acceleration of various
projects in 2012, including drainage works for this projectNew/Enhanced 168,000 162,400 6,160 336,560
Gravel Road ConversionTownline Rd W - Dry Lake to Road 20 - shifted to 2013 due to acceleration of various
projects in 2012New/Enhanced 66,400 199,200 192,560 73,040 531,200
Gravel Road ConversionTownline Rd W - Dry Lake to River Road - shifted to 2013 due to acceleration of various
projects in 2012New/Enhanced 102,400 307,200 293,960 112,640 816,200Gravel Road Conversion
projects in 2012New/Enhanced 102,400 307,200 293,960 112,640 816,200
Gravel Road ConversionTownline Rd E - River to Road 54 - shifted to 2013 due to acceleration of various projects in
2012, including drainage works for this projectNew/Enhanced 48,000 46,400 17,600 112,000
Gravel Road ConversionHines Road - McLaughlin to Comfort Rd - shifted from 2017 to 2016 to keep project budget
within $1.2M per yearNew/Enhanced 41,000 123,000 118,900 45,100 328,000
Gravel Road ConversionCrown Road - Hwy 3 to Aiken Road - shifted from 2017 to 2016 ti keep project budget within
$1.2M per yearNew/Enhanced 56,000 168,000 162,400 61,600 448,000
Municipal DrainsMiddaugh Drain Phase 1 - Construction - project has fallen out of favour with land owners.
Currently working on re-establishing the projectNew/Enhanced 157,730 157,730
Municipal DrainsMiddaugh Drain Phase 2 - Construction - project has fallen out of favour with land owners.
Currently working on re-establishing the projectNew/Enhanced 101,760 101,760
Storm Sewer MaintenanceCal-Caithness St W - Fire hall to Ross - shifted from 2015/2016 to 2013/2014 per Council
Resolution (August 7, 2012)SOGR 46,000 310,000 356,000
Pg 2 of 3
A-3

SUMMARY 3
PROJECTS GREATER THAN $100,000: 2013 2014 2015 2016 2017 2018 2019 2020 2021 2022 TotalGross Expenditures
State of Good
Repair/ Enhanced
Service
HALDIMAND COUNTY
2013 to 2022 TAX SUPPORTED CAPITAL FORECAST
Projects Moved - Shifts in Timing
Storm Sewer MaintenanceDun-Ramsey Ext Ph II & Industrial Drive - moved from 2016 to 2020 due to further servicing
requirementsSOGR 255,000 255,000
Storm Sewer Maintenance
Ramsey Dr. Stormwater Management - shifted from 2013 to 2014 as project is required for
furture development of Frank Marshall Business Park, nothing scheduled for development at
this time
New/Enhanced 378,000 378,000
Waste Disposal Sites
Tom Howe-Final Cover - from 2014 to 2013. Increased budget to allow for completion of
final cover, due to the need to purchase clay soils for the final cover for the remainder fo the
landfill. (Project also shown in Summary 2)
SOGR 170,000 170,000
Arenas HCCC Parking Lot Repaving & Lining - repairs completed in 2012 have extended the life. SOGR 450,000 450,000
MarketsDunnville Farmer's Market Repairs/Maintenance - shifted from 2013 to 2016 to align with
timelines/plan outline in PED-PD-20-2012SOGR 450,000 450,000
Planning & DevelopmentAerial Photography Update - Change in timing due to new provider (RFP every 5 years vs. 3
years)SOGR 46,000 46,000 92,000
Planning & DevelopmentDunv Sec Plan Implementation - County Lands - shifted from 2013 to 2015 given the
increased scope of the projectNew/Enhanced 359,000 359,000
Economic Development & TourismTourism Product Development - Birding - shifted from 2014 to 2015 due to time
commitments on Lakescape Action PlanNew/Enhanced 200,000 200,000Economic Development & Tourism
commitments on Lakescape Action PlanNew/Enhanced 200,000 200,000
Pg 3 of 3
A-3

SUMMARY 4
2012 2013 2014 2015 2016 2017 2018 2019 2020 2021 2022
DEBT CHARGES (Existing Debt)
- Gross debt repayments 2,137,789 2,091,885 1,466,023 1,421,229 1,377,845 1,334,276 1,285,555 1,240,944 1,198,174 1,152,458 1,152,458
- Balloon debt repayments 3,276,000 0 0 0 0 0 0 0 0
- Less funding from:
- Norfolk County 0 0 0 0 0 0 0 0 0 0 0
- Reissue balloon debt (3,276,000) 445,000 445,000 445,000 445,000 445,000 445,000 445,000 445,000 445,000
- MOHLTC (GVL) (484,877) (483,552) (483,552) (483,552) (484,877) (483,552) (483,552) (483,552) (483,552) (483,552) (483,552)
- Reserves
- Development Charges Reserve Fund (176,800) (176,800) (176,800) (176,800) (176,800) (176,800) (176,800) (176,800) (176,800) (176,800) (176,800)
Net Existing Debt Charges 1,476,112 1,431,533 1,250,671 1,205,877 1,161,168 1,118,924 1,070,203 1,025,592 982,822 937,106 937,106
DEBT CHARGES (Proposed Debt for Completed Projects) 458,500 977,000 977,000 977,000 977,000 977,000 977,000 977,000 977,000 977,000
DEBT CHARGES (Proposed New Debt) 449,000 449,000 449,000 449,000 449,000 449,000 449,000 449,000 449,000
DEBT CHARGES SUB-TOTAL 0 458,500 1,426,000 1,426,000 1,426,000 1,426,000 1,426,000 1,426,000 1,426,000 1,426,000 1,426,000
TOTAL DEBT CHARGES 1,476,112 1,890,033 2,676,671 2,631,877 2,587,168 2,544,924 2,496,203 2,451,592 2,408,822 2,363,106 2,363,106
CAPITAL REPLACEMENT RESERVES
- Budgeted contribution - Fleet 1,820,750 1,771,840 1,771,840 1,771,840 1,771,840 1,771,840 1,771,840 1,771,840 1,771,840 1,771,840 1,771,840
HALDIMAND COUNTY
2013 CAPITAL BUDGET AND FORECAST
Net Capital Financing from Tax Rates
- Budgeted contribution - Fleet 1,820,750 1,771,840 1,771,840 1,771,840 1,771,840 1,771,840 1,771,840 1,771,840 1,771,840 1,771,840 1,771,840
- Budgeted contribution - Roads Infrastructure 7,136,000 6,886,000 6,886,000 6,886,000 6,886,000 6,886,000 6,886,000 6,886,000 6,886,000 6,886,000 6,886,000
- Budgeted contribution - WMRF 583,000 583,000 583,000 583,000 583,000 583,000 583,000 583,000 583,000 583,000 583,000
- Budgeted contribution - Storm Sewer 1,000,000 1,000,000 1,000,000 1,000,000 1,000,000 1,000,000 1,000,000 1,000,000 1,000,000 1,000,000 1,000,000
- Budgeted contribution - IT 396,660 435,960 435,960 435,960 435,960 435,960 435,960 435,960 435,960 435,960 435,960
- Budgeted contribution - General 2,415,520 2,465,990 2,465,990 2,465,990 2,465,990 2,465,990 2,465,990 2,465,990 2,465,990 2,465,990 2,465,990
- CRR Arena Contribution
- Budgeted contribution - Municipal Drains 44,000 44,000 44,000 44,000 44,000 44,000 44,000 44,000 44,000 44,000 44,000
Net Transfers to Capital Reserves 13,395,930 13,186,790 13,186,790 13,186,790 13,186,790 13,186,790 13,186,790 13,186,790 13,186,790 13,186,790 13,186,790
ADDITIONAL RESERVE CONTRIBUTIONS
- additional contribution to CRR-Roads Infrastructure 500,000 500,000 500,000 500,000 500,000 500,000 500,000 500,000 500,000 500,000
- reduce contribution to CRR - Storm Sewer (500,000) (500,000) (500,000) (500,000) (500,000) (500,000) (500,000) (500,000) (500,000) (500,000)
- reallocate Road Development tsf to CRR-General Fire/EMS (250,000)
- additional contribution to CRR-General
- additional contribution to CRR-Fire Fleet 346,200
- addtnl contrib. to CRR-General for Fire/EMS facilities ramp up of debt required250,000 250,000
- inc. Capital levy contrib. to CRR-General for Fire/EMS facilities ramp up of debt required125,000 125,000
- Increase/(Decrease) to Capital Replacement Reserves 391,483 479,909 1,024,768 1,569,541 1,770,536 1,819,258 1,863,869 1,906,639 1,952,355 1,952,355
Additional Annual Contributions to Reserve 471,200 766,483 479,909 1,024,768 1,569,541 1,770,536 1,819,258 1,863,869 1,906,639 1,952,355 1,952,355
TOTAL CONTRIBUTION TO RESERVES 13,867,130 13,953,273 13,666,699 14,211,558 14,756,331 14,957,326 15,006,048 15,050,659 15,093,429 15,139,145 15,139,145
TOTAL CAPITAL-RELATED EXPENDITURES 15,343,242 15,843,306 16,343,370 16,843,435 17,343,499 17,502,251 17,502,251 17,502,251 17,502,251 17,502,251 17,502,251
IMPACT ON TAX LEVY:IMPACT ON TAX LEVY:
Total Capital Related Expenditure Requirement 15,343,242 15,843,306 16,343,370 16,843,435 17,343,499 17,502,251 17,502,251 17,502,251 17,502,251 17,502,251 17,502,251
$ Impact on Tax Levy 124,161 500,064 500,064 500,064 500,064 158,752 0 0 0 0 0
Estimated Levy 0.00% increase 48,367,440 50,006,430 50,006,430 50,006,430 50,006,430 50,006,430 50,006,430 50,006,430 50,006,430 50,006,430 50,006,430
% Impact on Tax Rates based Levy 0.26% 1.00% 1.00% 1.00% 1.00% 0.32% 0.00% 0.00% 0.00% 0.00% 0.00%
31.72% 31.68% 32.68% 33.68% 34.68% 35.00% 35.00% 35.00% 35.00% 35.00% 35.00%
NOTE: Existing Debt made up of debenture payments required for Dunnville Multi Purpose Facility, HCCC, and Grandview Lodge (partial issue).
Proposed New Debt for Completed Projects includes debenture payments required for the following existing capital projects: HCCC, Grandview Lodge (final issue), Lowbanks Fire Station, and Cayuga
and Dunnville Arenas. New Debt is also proposed for the Cayuga Library, Cayuga and Hagersville Fire/EMS beginning in 2014.
TOTAL CAPITAL-RELATED EXPENDITURES AS % OF TOTAL
LEVY
A-4

SUMMARY 5
2012 Open
Projects 10 Year Forecast
2012 Open
Projects 10 Year Forecast
2012 Open
Projects 10 Year Forecast
2012 Open
Projects 10 Year Forecast
Dunnville
Master Servicing Plan 2014; 2020 0 60,000 0 60,000 0 60,000 0 60,000 240,000
Alder St-Niagara to West 2017 - 2019 2,561,490 1,885,000 1,494,200 2,731,000 747,320 897,100 781,840 898,200 11,996,150
Ramsey Drive 2020 115,000 1,193,000 0 255,000 0 194,000 0 65,000 1,822,000
Caledonia
Master Servicing Plan 2013; 2018 0 100,000 0 60,000 0 100,000 0 100,000 360,000
Caithness St. W. - Firehall to Ross 2013-2014 0 2,244,000 0 356,000 0 690,000 0 225,000 3,515,000
Wigton St - Haddington to Argyle 2013 100,000 1,850,000 45,000 650,000 50,000 510,000 3,205,000
River Road 2017 0 1,200,000 0 450,000 0 400,000 0 450,000 2,500,000
Aberdeen Street 2013 0 75,000 0 136,000 211,000
Cayuga
Master Servicing Plan 2016; 2021 0 60,000 0 30,000 0 50,000 0 50,000 190,000
Talbot St. - Thorburn to Bridge - includes Reconstruction,
Street Lighting & Streetscaping 2014 172,000 1,850,000 0 500,000 75,000 620,000 15,000 150,000 3,382,000
Jarvis
Master Servicing Plan 2016; 2021 0 30,000 0 30,000 0 40,000 0 30,000 130,000
Hagersville
Master Servicing Plan 2014; 2020 0 60,000 0 30,000 0 50,000 0 50,000 190,000
County-wide
CCTV Inspection Program - Structural Assess'ts 2013-2022 25,000 250,000 70,510 500,000 845,510
Facility Condition Assessments 2013-2022 8,750 250,000 60,790 250,000 569,540
SCADA Master Plan 2015; 2021 0 150,000 0 150,000 300,000
SCADA Maintenance 2013-2022 0 400,000 0 400,000 800,000
SCADA Programming & Technical Support 2013-2022 60,000 300,000 60,000 300,000 720,000
TOTAL 2,948,490 10,607,000 1,519,200 4,752,000 936,070 4,987,100 1,038,140 4,188,200 30,976,200
-
Note - does not include prior year closed projects.
Project Timing
TAX CAPITAL WATER AND WASTEWATER CAPITAL (preliminary information)
Roads Storm Water Wastewater
Project Total
HALDIMAND COUNTY2013 to 2022 TAX SUPPORTED CAPITAL FORECAST
CO-ORDINATED PROJECTS
A-5

SUMMARY 5
2012 Open
Projects 10 Year Forecast
2012 Open
Projects 10 Year Forecast
2012 Open
Projects 10 Year Forecast
2012 Open
Projects 10 Year Forecast
Dunnville
Library Expansion/WWW Staff Relocation 2014 0 1,200,000 0 50,000 1,250,000
Cayuga
EMS/Fire Station/Admin Offices/Relocation and Demo
Parks Yard/Replacement Library 2013 0 2,712,500 0 679,800 0 1,060,000 4,452,300
Hagersville
EMS/Fire Station 2013 0 2,012,500 0 814,800 2,827,300
Planning and Economic DevelopmentDunnville Secondary Plan/Implementation and Special
Policy Area
2011/2012;
2015 84,500 359,000 443,500
Dunnville Market Structure 2016 450,000 450,000
-
TOTAL - 4,725,000 - 1,494,600 - 2,260,000 84,500 859,000 9,423,100
HALDIMAND COUNTY
2013 to 2022 TAX SUPPORTED CAPITAL FORECAST
CO-ORDINATED PROJECTS
Project Timing
Fire EMS
Project Total
Libraries
TAX CAPITAL
Other
A-5

HALDIMAND COUNTY COUNCIL
2010 - 2014
MAYOR --------------------------------------------------------------------------- KEN HEWITT
WARD 1 -------------------------------------------------------------------- LEROY BARTLETT WARD 2 ---------------------------------------------------------------------- FRED MORISON WARD 3 ------------------------------------------------------------------------- CRAIG GRICE WARD 4 -------------------------------------------------------------------- TONY DALIMONTE WARD 5 ------------------------------------------------------------------------ ROB SHIRTON WARD 6 ----------------------------------------------------------------------- LORNE BOYKO
1

HALDIMAND COUNTY SENIOR STAFF
CHIEF ADMINISTRATIVE OFFICER -------------------------------------------- DON BOYLE
GENERAL MANAGER CORPORATE SERVICES ------------------------------------------------ KAREN GENERAL
GENERAL MANAGER COMMUNITY SERVICES ------------------------------------------------------ HUGH HANLY
GENERAL MANAGER PUBLIC WORKS ------------------------------------------------------------- PAUL MUNGAR DIRECTOR ENGINEERING SERVICES ----------------------------------------------- TYSON HAEDRICH
GENERAL MANAGER PLANNING & ECONOMIC DEVELOPMENT ------------------------------- CRAIG MANLEY
2

2013 2014 2015 2016 2017 2018 2019 2020 2021 2022 Total Grants External Development Federal Reserves/ Debenture
Expenditures Subsidies Financing Charges Gas Tax Reserve Financing
Rsve Funds Rsve Fund Funds
General Government 983,200 1,008,500 1,077,800 650,100 423,700 856,000 674,900 585,300 406,000 423,200 7,088,700 (81,000) (126,000) (6,881,700)
Protection Services 5,592,700 377,500 409,500 336,200 327,500 269,500 294,500 304,500 288,200 289,500 8,489,600 (300,000) (1,268,630) (4,963,900) (1,957,070)
Transportation Services 13,969,400 13,142,300 8,525,680 9,631,980 11,328,850 8,460,580 9,852,870 8,149,720 6,378,710 7,385,300 96,825,390 (50,300) (2,869,540) (2,729,000) (12,438,320) (78,738,230)
Environmental Services 1,043,000 7,368,000 937,000 242,700 846,550 2,527,000 1,215,000 616,000 312,000 225,000 15,332,250 (1,295,900) (1,586,700) (2,380,000) (10,069,650)
Health Services 1,650,600 329,800 274,000 144,000 228,250 219,000 66,000 79,000 49,000 208,000 3,247,650 (147,000) (606,340) (1,454,820) (1,039,490)
Social and Family Services 219,410 183,760 123,800 171,100 118,300 100,900 90,900 165,900 119,900 144,800 1,438,770 (32,220) (1,406,550)
Recreation and Cultural Services 2,111,390 2,718,530 1,866,890 1,230,250 1,083,490 740,490 763,990 971,290 761,750 1,362,990 13,611,060 (800,000) (467,000) (1,240,300) (10,361,760) (742,000)
Planning and Development 727,400 626,400 840,000 480,000 200,000 36,000 19,000 190,000 95,000 3,213,800 (216,800) (243,040) (2,753,960)
Total Tax Supported Capital Departments 26,297,100 25,754,790 14,054,670 12,886,330 14,556,640 13,209,470 12,977,160 11,061,710 8,315,560 10,133,790 149,247,220 (997,300) (5,181,460) (7,755,010) (14,944,320) (116,630,570) (3,738,560)
2013 2014 2015 2016 2017 2018 2019 2020 2021 2022 Total
Grants/Subsidies $50,300 $800,000 $0 $0 $0 $50,000 $42,000 $30,000 $25,000 $0 $997,300
Other External Financing $862,090 $1,257,660 $749,940 $484,390 $363,400 $345,000 $245,150 $333,580 $219,540 $320,710 $5,181,460
Development Charges Reserve Fund $2,087,350 $1,034,220 $217,600 $252,990 $2,243,200 $561,900 $315,000 $839,000 $178,750 $25,000 $7,755,010
Federal Gas Tax Reserve Fund $1,983,600 $4,276,120 $1,337,320 $671,980 $646,600 $819,480 $1,008,120 $1,066,140 $1,278,420 $1,856,540 $14,944,320
Reserves/Reserve Funds $17,575,200 $18,386,790 $11,749,810 $11,476,970 $11,303,440 $11,433,090 $11,366,890 $8,792,990 $6,613,850 $7,931,540 $116,630,570
Debentures $3,738,560 $0 $0 $0 $0 $0 $0 $0 $0 $0 $3,738,560
Total Tax Supported Capital $26,297,100 $25,754,790 $14,054,670 $12,886,330 $14,556,640 $13,209,470 $12,977,160 $11,061,710 $8,315,560 $10,133,790 $149,247,220
3

GENERAL GOVERNMENT
4
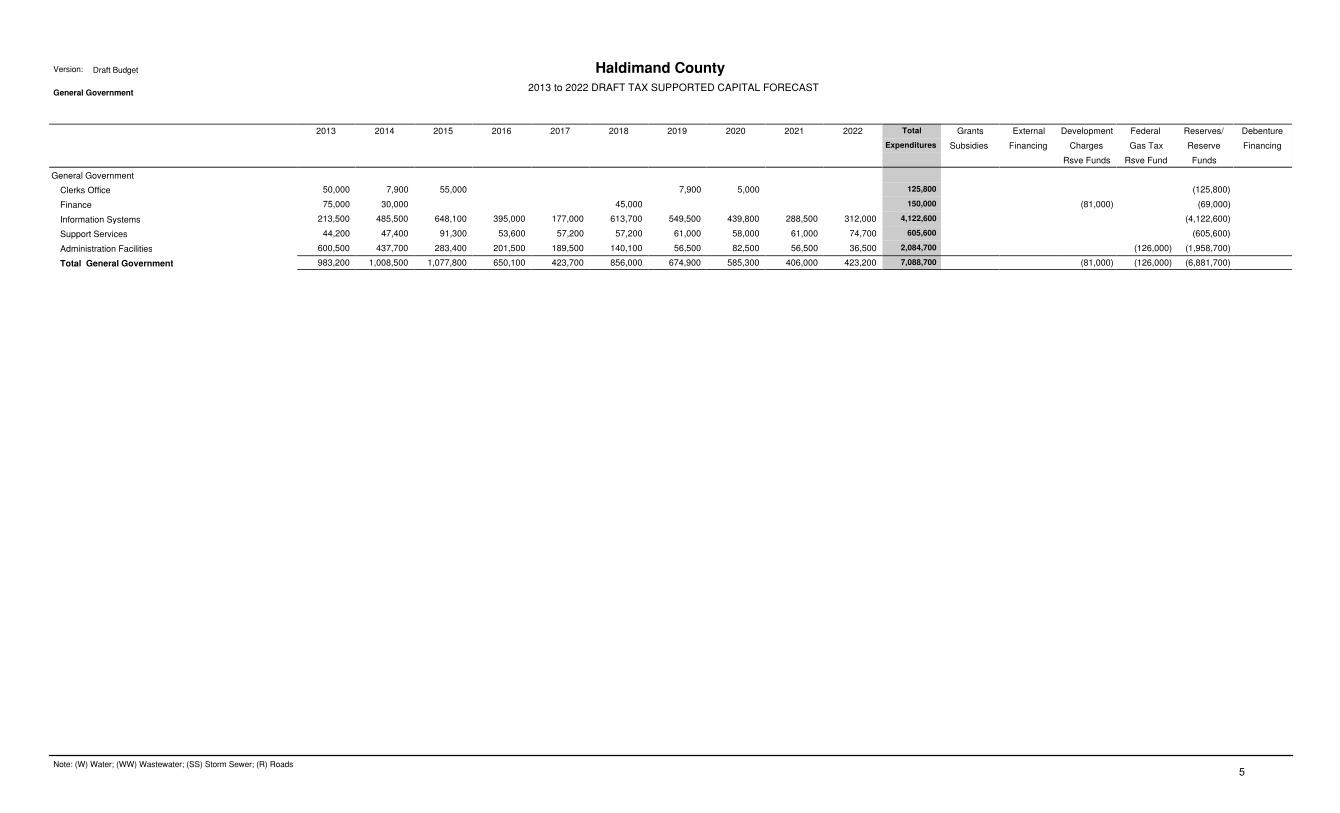
General Government
Clerks Office 50,000 7,900 55,000 7,900 5,000 125,800 (125,800)
Finance 75,000 30,000 45,000 150,000 (81,000) (69,000)
Information Systems 213,500 485,500 648,100 395,000 177,000 613,700 549,500 439,800 288,500 312,000 4,122,600 (4,122,600)
Support Services 44,200 47,400 91,300 53,600 57,200 57,200 61,000 58,000 61,000 74,700 605,600 (605,600)
Administration Facilities 600,500 437,700 283,400 201,500 189,500 140,100 56,500 82,500 56,500 36,500 2,084,700 (126,000) (1,958,700)
Total General Government 983,200 1,008,500 1,077,800 650,100 423,700 856,000 674,900 585,300 406,000 423,200 7,088,700 (81,000) (126,000) (6,881,700)
2013 2014 2015 2016 2017 2018 2019 2020 2021 2022 Total
Expenditures
Grants
Subsidies
External
Financing
Development
Charges
Rsve Funds
Federal
Gas Tax
Rsve Fund
Reserves/
Reserve
Funds
Debenture
Financing
Draft Budget Haldimand County2013 to 2022 DRAFT TAX SUPPORTED CAPITAL FORECAST
Version:
General Government
Note: (W) Water; (WW) Wastewater; (SS) Storm Sewer; (R) Roads5

Clerk’s Office
Replacement/State of Good Repair
Postage Machine−Hagersville 5,000 5,000 10,000 (10,000)
Postage Machine−Cayuga 7,900 7,900 15,800 (15,800)
Total Replacement/State of Good Repair 7,900 5,000 7,900 5,000 25,800 (25,800)
New/Enhanced Service
Records Management − Content Mgmt System 50,000 50,000 (50,000)
Electronic Meeting Management 50,000 50,000 (50,000)
Total New/Enhanced Service 50,000 50,000 100,000 (100,000)
Total Clerk’s Office 50,000 7,900 55,000 7,900 5,000 125,800 (125,800)
2013 2014 2015 2016 2017 2018 2019 2020 2021 2022 Total
Expenditures
Grants
Subsidies
External
Financing
Development
Charges
Rsve Funds
Federal
Gas Tax
Rsve Fund
Reserves/
Reserve
Funds
Debenture
Financing
Draft Budget Haldimand County
2013 to 2022 DRAFT TAX SUPPORTED CAPITAL FORECAST
Version:
Division: Clerks Office
Note: (W) Water; (WW) Wastewater; (SS) Storm Sewer; (R) Roads6
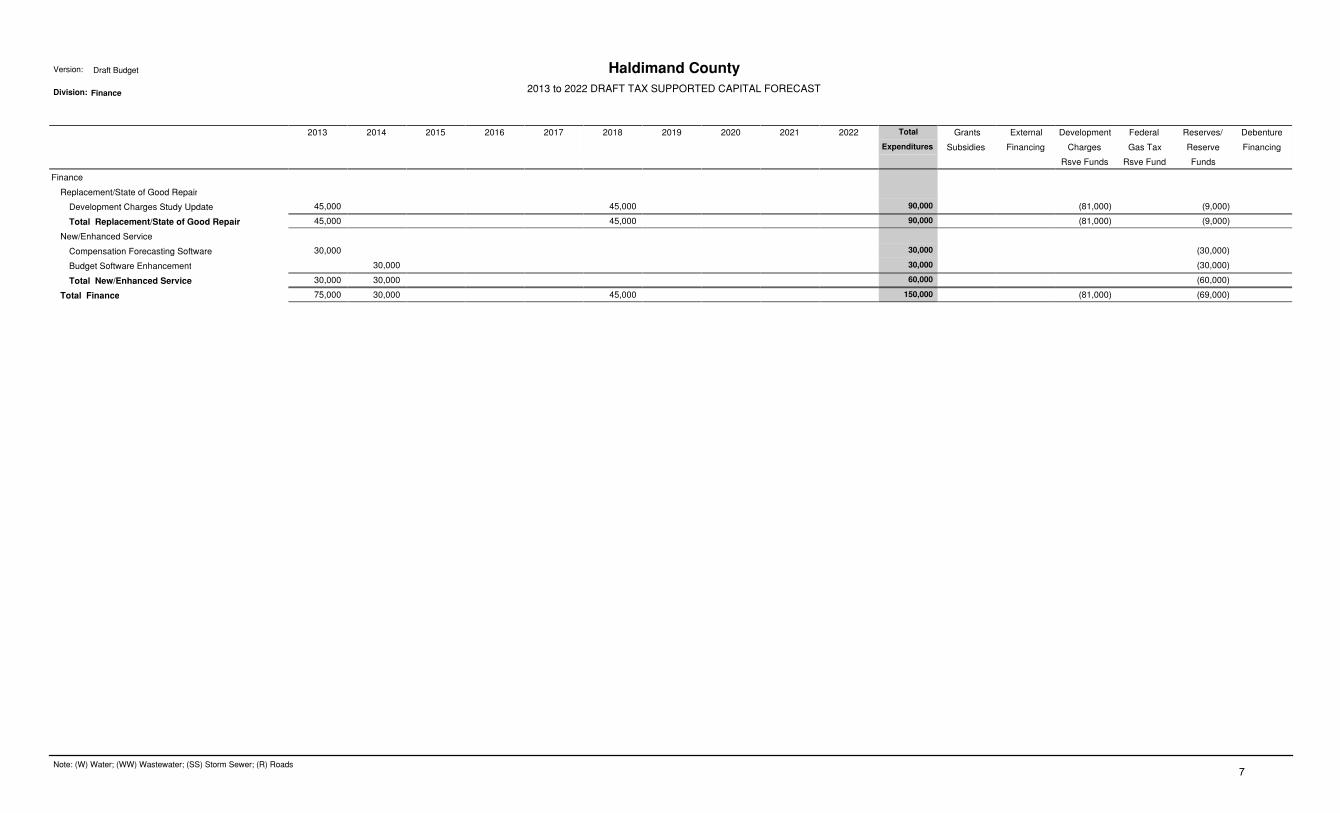
Finance
Replacement/State of Good Repair
Development Charges Study Update 45,000 45,000 90,000 (81,000) (9,000)
Total Replacement/State of Good Repair 45,000 45,000 90,000 (81,000) (9,000)
New/Enhanced Service
Compensation Forecasting Software 30,000 30,000 (30,000)
Budget Software Enhancement 30,000 30,000 (30,000)
Total New/Enhanced Service 30,000 30,000 60,000 (60,000)
Total Finance 75,000 30,000 45,000 150,000 (81,000) (69,000)
2013 2014 2015 2016 2017 2018 2019 2020 2021 2022 Total
Expenditures
Grants
Subsidies
External
Financing
Development
Charges
Rsve Funds
Federal
Gas Tax
Rsve Fund
Reserves/
Reserve
Funds
Debenture
Financing
Draft Budget Haldimand County
2013 to 2022 DRAFT TAX SUPPORTED CAPITAL FORECAST
Version:
Division: Finance
Note: (W) Water; (WW) Wastewater; (SS) Storm Sewer; (R) Roads7

Information Systems
Replacement/State of Good Repair
Desktops (58) 75,400 89,700 71,500 101,400 75,400 75,400 89,700 71,500 101,400 75,400 826,800 (826,800)
Laptops (6) 11,400 20,900 17,100 19,000 26,600 13,300 20,900 17,100 19,000 26,600 191,900 (191,900)
Laser & Desk Jet Printers 5,000 5,000 5,000 5,000 5,000 5,000 5,000 5,000 5,000 5,000 50,000 (50,000)
Colour Printers 3,000 3,000 3,000 3,000 12,000 (12,000)
Scanners 3,600 3,600 7,200 (7,200)
Connectivity Equipment 6,000 6,000 9,000 17,400 6,000 6,000 5,000 8,000 16,400 5,000 84,800 (84,800)
Servers 108,000 128,000 108,000 128,000 472,000 (472,000)
Low End Servers 20,000 20,000 40,000 (40,000)
Digital Cameras 300 800 300 800 2,200 (2,200)
Telephone System Hardware − GVL 15,000 15,000 (15,000)
Telephone System (voice mail) − GVL 17,000 17,000 34,000 (34,000)
Plotters 17,000 17,000 (17,000)
Plotter/Scanner 25,000 25,000 (25,000)
LCD Projectors (1) 1,200 2,400 1,200 1,200 2,400 1,200 2,400 1,200 1,200 2,400 16,800 (16,800)
UPS’s (uninterupted power supply protection) 6,500 10,000 7,500 5,500 6,500 10,000 7,500 5,500 59,000 (59,000)
Rugged Laptop 2,000 2,000 4,000 (4,000)
Digital Camcorder 500 500 1,000 (1,000)
Desktop Operating System Software 160,000 160,000 320,000 (320,000)
Software Replacement 80,000 300,000 10,000 5,000 138,000 200,000 120,000 75,000 15,000 943,000 (943,000)
Cell Phone/Smartphone Upgrade/Replacement 7,500 27,500 18,000 2,500 27,500 18,000 2,500 27,500 18,000 2,500 151,500 (151,500)
Multi−function Units(printers/copiers) (3) 45,200 36,000 55,000 58,000 12,000 40,000 36,000 46,200 40,000 18,000 386,400 (386,400)
Telephone System − Voice over IP 200,000 200,000 (200,000)
Work Mgmt System Improvements/Upgrades 10,000 28,000 30,000 68,000 (68,000)
Backup Solution Replacement 30,000 30,000 60,000 (60,000)
Total Replacement/State of Good Repair 198,500 480,500 643,100 390,000 172,000 533,700 544,500 434,800 283,500 307,000 3,987,600 (3,987,600)
New/Enhanced Service
Software/Applications/Development 5,000 5,000 5,000 5,000 5,000 5,000 5,000 5,000 5,000 5,000 50,000 (50,000)
Info. Tech. Strategic Plan Review 75,000 75,000 (75,000)
Back−up Air Conditioning Unit 10,000 10,000 (10,000)
Total New/Enhanced Service 15,000 5,000 5,000 5,000 5,000 80,000 5,000 5,000 5,000 5,000 135,000 (135,000)
Total Information Systems 213,500 485,500 648,100 395,000 177,000 613,700 549,500 439,800 288,500 312,000 4,122,600 (4,122,600)
2013 2014 2015 2016 2017 2018 2019 2020 2021 2022 Total
Expenditures
Grants
Subsidies
External
Financing
Development
Charges
Rsve Funds
Federal
Gas Tax
Rsve Fund
Reserves/
Reserve
Funds
Debenture
Financing
Draft Budget Haldimand County
2013 to 2022 DRAFT TAX SUPPORTED CAPITAL FORECAST
Version:
Division: Information Systems
Note: (W) Water; (WW) Wastewater; (SS) Storm Sewer; (R) Roads8

Support Services
Replacement/State of Good Repair
Equipment Replacements 5,000 5,000 5,000 5,000 5,000 5,000 5,000 5,000 5,000 5,000 50,000 (50,000)
Furniture Replacements 6,000 42,400 86,300 48,600 52,200 52,200 56,000 53,000 56,000 69,700 522,400 (522,400)
Workstations/Desks (3) 6,000 6,000 (6,000)
Chairs (61) 24,500 24,500 (24,500)
Misc Furniture Replacements 2,700 2,700 (2,700)
Total Replacement/State of Good Repair 44,200 47,400 91,300 53,600 57,200 57,200 61,000 58,000 61,000 74,700 605,600 (605,600)
Total Support Services 44,200 47,400 91,300 53,600 57,200 57,200 61,000 58,000 61,000 74,700 605,600 (605,600)
2013 2014 2015 2016 2017 2018 2019 2020 2021 2022 Total
Expenditures
Grants
Subsidies
External
Financing
Development
Charges
Rsve Funds
Federal
Gas Tax
Rsve Fund
Reserves/
Reserve
Funds
Debenture
Financing
Draft Budget Haldimand County
2013 to 2022 DRAFT TAX SUPPORTED CAPITAL FORECAST
Version:
Division: Support Services
Note: (W) Water; (WW) Wastewater; (SS) Storm Sewer; (R) Roads9

Administration Facilities
Other/General Admin Facilities
Replacement/State of Good Repair
Lock System Remedial Work 10,000 10,000 20,000 40,000 (40,000)
Exterior Environments − Accessibility Plan 14,000 4,500 5,500 24,000 (24,000)
Interior Environments − Accessibility Plan 2,000 12,500 37,500 122,500 32,500 36,300 12,500 12,500 12,500 12,500 293,300 (293,300)
Bldg Sys, Controls & Communications − Accessibility Plan 20,000 8,000 28,000 (28,000)
Building Condition Assessments 25,000 25,000 24,000 25,000 24,000 24,000 24,000 25,000 22,000 24,000 242,000 (242,000)
Total Replacement/State of Good Repair 51,000 72,000 95,000 147,500 56,500 60,300 36,500 37,500 34,500 36,500 627,300 (627,300)
New/Enhanced Service
Adm Fac−Building Control Automation 35,000 35,000 70,000 (70,000)
Carbon Monoxide Detectors and Alarms 6,000 6,000 (6,000)
Asbestos Management Program 332,000 332,000 (332,000)
Roof Assessment Program 150,000 150,000 (150,000)
Total New/Enhanced Service 482,000 6,000 35,000 35,000 558,000 (558,000)
Total Other/General Admin Facilities 533,000 78,000 130,000 147,500 56,500 60,300 36,500 72,500 34,500 36,500 1,185,300 (1,185,300)
Cayuga Administration Building
Replacement/State of Good Repair
Fire Systems 5,000 5,000 (5,000)
Rear Parking Lot 150,000 150,000 (150,000)
Doors, Hardware, Locks & Hinges 4,500 4,500 (4,500)
Carpet & Floor Tiles 12,000 10,000 8,000 10,000 12,000 52,000 (52,000)
Washroom & Lunchroom Fixtures 4,000 4,000 (4,000)
CAB HVAC System Replacement 15,000 100,000 115,000 (115,000)
Total Replacement/State of Good Repair 27,000 259,500 10,000 4,000 8,000 10,000 12,000 330,500 (330,500)
New/Enhanced Service
Energy Conservation Measures 25,000 25,000 25,000 25,000 100,000 (100,000)
Total New/Enhanced Service 25,000 25,000 25,000 25,000 100,000 (100,000)
Total Cayuga Administration Building 27,000 284,500 35,000 29,000 33,000 10,000 12,000 430,500 (100,000) (330,500)
Hagersville Satellite Office
Replacement/State of Good Repair
Window Glazing Repair/Replacement 50,000 50,000 (50,000)
Roof Replacement/Repair 15,000 15,000 (15,000)
Carpet and Floor Tiles 10,000 10,000 20,000 (20,000)
HVAC Rooftop 16,000 16,000 (16,000)
Total Replacement/State of Good Repair 25,000 60,000 16,000 101,000 (101,000)
New/Enhanced Service
Energy Conservation Measures 7,700 7,700 (7,700)
2013 2014 2015 2016 2017 2018 2019 2020 2021 2022 Total
Expenditures
Grants
Subsidies
External
Financing
Development
Charges
Rsve Funds
Federal
Gas Tax
Rsve Fund
Reserves/
Reserve
Funds
Debenture
Financing
Draft Budget Haldimand County
2013 to 2022 DRAFT TAX SUPPORTED CAPITAL FORECAST
Version:
Division: Administration Facilities
Note: (W) Water; (WW) Wastewater; (SS) Storm Sewer; (R) Roads10

Total New/Enhanced Service 7,700 7,700 (7,700)
Total Hagersville Satellite Office 32,700 60,000 16,000 108,700 (108,700)
Dunnville Multi−Purpose Facility
Replacement/State of Good Repair
Security System 4,500 4,500 (4,500)
Parking Lot Repair/General Crack Sealing(11) 6,000 6,000 (6,000)
Lighting (Parking Lot & Grounds) 6,000 6,000 (6,000)
Painting the Flashing & Trim 4,500 4,500 (4,500)
Garage Door 9,400 9,800 19,200 (19,200)
Carpet and Floor Tiles 10,000 10,000 10,000 10,000 40,000 (40,000)
Washroom & Lunchroom Fixtures 4,000 4,000 (4,000)
HVAC Rooftop 30,000 45,000 75,000 (75,000)
Total Replacement/State of Good Repair 20,500 10,500 19,400 30,000 58,800 10,000 10,000 159,200 (159,200)
New/Enhanced Service
Energy Conservation Measures 11,000 11,000 (11,000)
Total New/Enhanced Service 11,000 11,000 (11,000)
Total Dunnville Multi−Purpose Facility 20,500 21,500 19,400 30,000 58,800 10,000 10,000 170,200 (11,000) (159,200)
Caledonia Satellite Office
Replacement/State of Good Repair
Security System 4,000 4,000 (4,000)
Carpet & Floor Tiles 10,000 10,000 20,000 (20,000)
Washroom & Lunchroom Fixtures 4,000 4,000 (4,000)
HVAC Rooftop 15,000 15,000 (15,000)
Total Replacement/State of Good Repair 14,000 15,000 4,000 10,000 43,000 (43,000)
New/Enhanced Service
Energy Conservation Measures 6,000 6,000 (6,000)
Total New/Enhanced Service 6,000 6,000 (6,000)
Total Caledonia Satellite Office 6,000 14,000 15,000 4,000 10,000 49,000 (49,000)
Dunnville Satellite Office
Replacement/State of Good Repair
Fire Systems 5,000 5,000 (5,000)
Security System 3,000 3,000 (3,000)
Parking Lot Complete Resurfacing (Paving) 25,000 25,000 (25,000)
Window Glazing Repair/Replacement 50,000 50,000 (50,000)
Sanitary System & Floor Drains & Piping 3,000 3,000 (3,000)
Carpet & Floor Tiles 10,000 10,000 20,000 (20,000)
Total Replacement/State of Good Repair 25,000 10,000 50,000 21,000 106,000 (106,000)
New/Enhanced Service
2013 2014 2015 2016 2017 2018 2019 2020 2021 2022 Total
Expenditures
Grants
Subsidies
External
Financing
Development
Charges
Rsve Funds
Federal
Gas Tax
Rsve Fund
Reserves/
Reserve
Funds
Debenture
Financing
Draft Budget Haldimand County
2013 to 2022 DRAFT TAX SUPPORTED CAPITAL FORECAST
Version:
Division: Administration Facilities
Note: (W) Water; (WW) Wastewater; (SS) Storm Sewer; (R) Roads11

Energy Conservation Measures 15,000 15,000 (15,000)
Total New/Enhanced Service 15,000 15,000 (15,000)
Total Dunnville Satellite Office 15,000 25,000 10,000 50,000 21,000 121,000 (15,000) (106,000)
Communication Towers
Replacement/State of Good Repair
Moulton Communication Tower Repairs 10,000 10,000 (10,000)
Kohler Communication Tower Repairs 10,000 10,000 (10,000)
Total Replacement/State of Good Repair 20,000 20,000 (20,000)
Total Communication Towers 20,000 20,000 (20,000)
Total Administration Facilities 600,500 437,700 283,400 201,500 189,500 140,100 56,500 82,500 56,500 36,500 2,084,700 (126,000) (1,958,700)
2013 2014 2015 2016 2017 2018 2019 2020 2021 2022 Total
Expenditures
Grants
Subsidies
External
Financing
Development
Charges
Rsve Funds
Federal
Gas Tax
Rsve Fund
Reserves/
Reserve
Funds
Debenture
Financing
Draft Budget Haldimand County
2013 to 2022 DRAFT TAX SUPPORTED CAPITAL FORECAST
Version:
Division: Administration Facilities
Note: (W) Water; (WW) Wastewater; (SS) Storm Sewer; (R) Roads12

PROTECTION SERVICES
13

Protection Services
Emergency Management 47,000 3,700 3,700 54,400 (54,400)
Fire Services 5,587,700 330,500 409,500 332,500 327,500 269,500 294,500 304,500 284,500 289,500 8,430,200 (300,000) (1,268,630) (4,904,500) (1,957,070)
By−Law Enforcement 5,000 5,000 (5,000)
Total Protection Services 5,592,700 377,500 409,500 336,200 327,500 269,500 294,500 304,500 288,200 289,500 8,489,600 (300,000) (1,268,630) (4,963,900) (1,957,070)
2013 2014 2015 2016 2017 2018 2019 2020 2021 2022 Total
Expenditures
Grants
Subsidies
External
Financing
Development
Charges
Rsve Funds
Federal
Gas Tax
Rsve Fund
Reserves/
Reserve
Funds
Debenture
Financing
Draft Budget Haldimand County2013 to 2022 DRAFT TAX SUPPORTED CAPITAL FORECAST
Version:
Protection Services
Note: (W) Water; (WW) Wastewater; (SS) Storm Sewer; (R) Roads14

Community Emergency Management
Replacement/State of Good Repair
LCD TV’s 1,700 1,700 3,400 (3,400)
Interactive Whiteboard 2,000 2,000 4,000 (4,000)
Total Replacement/State of Good Repair 3,700 3,700 7,400 (7,400)
New/Enhanced Service
Trailer Mounted Portable Generator 47,000 47,000 (47,000)
Total New/Enhanced Service 47,000 47,000 (47,000)
Total Community Emergency Management 47,000 3,700 3,700 54,400 (54,400)
2013 2014 2015 2016 2017 2018 2019 2020 2021 2022 Total
Expenditures
Grants
Subsidies
External
Financing
Development
Charges
Rsve Funds
Federal
Gas Tax
Rsve Fund
Reserves/
Reserve
Funds
Debenture
Financing
Draft Budget Haldimand County
2013 to 2022 DRAFT TAX SUPPORTED CAPITAL FORECAST
Version:
Division: Emergency Management
Note: (W) Water; (WW) Wastewater; (SS) Storm Sewer; (R) Roads15

Fire Services
Fire General Administration
Replacement/State of Good Repair
Nozzles/Appliances 19,700 19,700 19,700 19,700 19,700 19,700 19,700 19,700 19,700 19,700 197,000 (197,000)
Portable Pumps 6,000 6,000 6,000 6,000 6,000 6,000 6,000 6,000 6,000 54,000 (54,000)
Gas Detection Equipment 10,000 5,000 5,000 5,000 5,000 5,000 5,000 5,000 5,000 5,000 55,000 (55,000)
Bunker Gear 44,400 44,400 44,400 44,400 44,400 44,400 44,400 44,400 44,400 44,400 444,000 (444,000)
Generators 5,000 5,000 5,000 5,000 20,000 (20,000)
Firefighting Tools 24,700 24,700 24,700 24,700 24,700 24,700 24,700 24,700 24,700 24,700 247,000 (247,000)
Hose 19,700 19,700 19,700 19,700 19,700 19,700 19,700 19,700 19,700 19,700 197,000 (197,000)
Pagers/Portable Radios− Com’n Equip’t 24,700 24,700 24,700 24,700 24,700 24,700 24,700 24,700 24,700 24,700 247,000 (247,000)
SCBA Equipment 59,300 59,300 59,300 59,300 59,300 59,300 59,300 59,300 59,300 59,300 593,000 (593,000)
Automatic External Defibrillators (14) 50,000 50,000 (50,000)
Ventilation Fans and Saws 6,000 6,000 6,000 6,000 6,000 6,000 6,000 6,000 6,000 6,000 60,000 (60,000)
Fire Dispatch Communication Equipment 100,000 100,000 (100,000)
Total Replacement/State of Good Repair 208,500 209,500 314,500 209,500 264,500 209,500 214,500 209,500 214,500 209,500 2,264,000 (2,264,000)
New/Enhanced Service
Purchases by Associations 30,000 30,000 30,000 30,000 30,000 30,000 30,000 30,000 30,000 30,000 300,000 (300,000)
Office Workstation for Fire Prevention Officer 2,400 2,400 (2,400)
Back−up Dispatch Generator 10,000 10,000 (10,000)
Total New/Enhanced Service 32,400 40,000 30,000 30,000 30,000 30,000 30,000 30,000 30,000 30,000 312,400 (300,000) (12,400)
Total Fire General Administration 240,900 249,500 344,500 239,500 294,500 239,500 244,500 239,500 244,500 239,500 2,576,400 (300,000) (2,276,400)
Caledonia Fire Hall Stn#1
Replacement/State of Good Repair
Roof Replacement 25,000 25,000 (25,000)
Parking Lot Replacement 18,000 18,000 (18,000)
Window Repairs 8,000 8,000 (8,000)
HVAC System 15,000 15,000 (15,000)
Auto Extrication Airbags 7,000 7,000 (7,000)
Man Doors & Frames 7,000 7,000 (7,000)
Bunker Gear Racks 7,000 7,000 (7,000)
Meeting Room Floor 3,000 3,000 (3,000)
Total Replacement/State of Good Repair 10,000 55,000 7,000 18,000 90,000 (90,000)
Total Caledonia Fire Hall Stn#1 10,000 55,000 7,000 18,000 90,000 (90,000)
Hagersville Fire Hall Stn#2
Replacement/State of Good Repair
Auto Extrication−Pump 13,000 13,000 (13,000)
Replacement Fire Station 2,012,500 2,012,500 (227,720) (385,090) (1,399,690)
2013 2014 2015 2016 2017 2018 2019 2020 2021 2022 Total
Expenditures
Grants
Subsidies
External
Financing
Development
Charges
Rsve Funds
Federal
Gas Tax
Rsve Fund
Reserves/
Reserve
Funds
Debenture
Financing
Draft Budget Haldimand County
2013 to 2022 DRAFT TAX SUPPORTED CAPITAL FORECAST
Version:
Division: Fire Services
Note: (W) Water; (WW) Wastewater; (SS) Storm Sewer; (R) Roads16
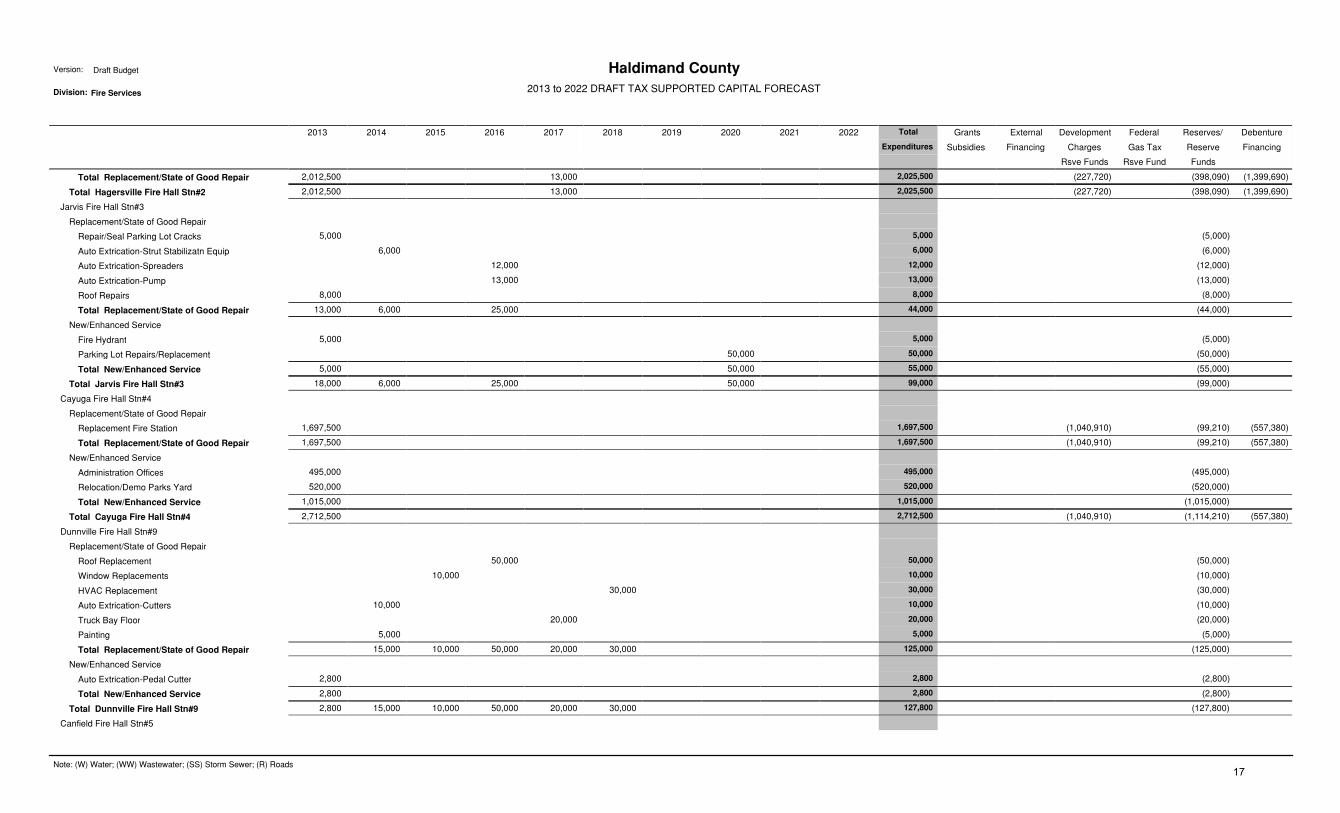
Total Replacement/State of Good Repair 2,012,500 13,000 2,025,500 (227,720) (398,090) (1,399,690)
Total Hagersville Fire Hall Stn#2 2,012,500 13,000 2,025,500 (227,720) (398,090) (1,399,690)
Jarvis Fire Hall Stn#3
Replacement/State of Good Repair
Repair/Seal Parking Lot Cracks 5,000 5,000 (5,000)
Auto Extrication−Strut Stabilizatn Equip 6,000 6,000 (6,000)
Auto Extrication−Spreaders 12,000 12,000 (12,000)
Auto Extrication−Pump 13,000 13,000 (13,000)
Roof Repairs 8,000 8,000 (8,000)
Total Replacement/State of Good Repair 13,000 6,000 25,000 44,000 (44,000)
New/Enhanced Service
Fire Hydrant 5,000 5,000 (5,000)
Parking Lot Repairs/Replacement 50,000 50,000 (50,000)
Total New/Enhanced Service 5,000 50,000 55,000 (55,000)
Total Jarvis Fire Hall Stn#3 18,000 6,000 25,000 50,000 99,000 (99,000)
Cayuga Fire Hall Stn#4
Replacement/State of Good Repair
Replacement Fire Station 1,697,500 1,697,500 (1,040,910) (99,210) (557,380)
Total Replacement/State of Good Repair 1,697,500 1,697,500 (1,040,910) (99,210) (557,380)
New/Enhanced Service
Administration Offices 495,000 495,000 (495,000)
Relocation/Demo Parks Yard 520,000 520,000 (520,000)
Total New/Enhanced Service 1,015,000 1,015,000 (1,015,000)
Total Cayuga Fire Hall Stn#4 2,712,500 2,712,500 (1,040,910) (1,114,210) (557,380)
Dunnville Fire Hall Stn#9
Replacement/State of Good Repair
Roof Replacement 50,000 50,000 (50,000)
Window Replacements 10,000 10,000 (10,000)
HVAC Replacement 30,000 30,000 (30,000)
Auto Extrication−Cutters 10,000 10,000 (10,000)
Truck Bay Floor 20,000 20,000 (20,000)
Painting 5,000 5,000 (5,000)
Total Replacement/State of Good Repair 15,000 10,000 50,000 20,000 30,000 125,000 (125,000)
New/Enhanced Service
Auto Extrication−Pedal Cutter 2,800 2,800 (2,800)
Total New/Enhanced Service 2,800 2,800 (2,800)
Total Dunnville Fire Hall Stn#9 2,800 15,000 10,000 50,000 20,000 30,000 127,800 (127,800)
Canfield Fire Hall Stn#5
2013 2014 2015 2016 2017 2018 2019 2020 2021 2022 Total
Expenditures
Grants
Subsidies
External
Financing
Development
Charges
Rsve Funds
Federal
Gas Tax
Rsve Fund
Reserves/
Reserve
Funds
Debenture
Financing
Draft Budget Haldimand County
2013 to 2022 DRAFT TAX SUPPORTED CAPITAL FORECAST
Version:
Division: Fire Services
Note: (W) Water; (WW) Wastewater; (SS) Storm Sewer; (R) Roads17

Replacement/State of Good Repair
Auto Extrication Pump 13,000 13,000 (13,000)
Auto Extrication Spreaders 12,000 12,000 (12,000)
Auto Extrication Stabilization Struts 6,000 6,000 (6,000)
Total Replacement/State of Good Repair 25,000 6,000 31,000 (31,000)
Total Canfield Fire Hall Stn#5 25,000 6,000 31,000 (31,000)
Selkirk Fire Hall Stn#13
Replacement/State of Good Repair
Roof Replacement 50,000 50,000 (50,000)
Parking Lot 50,000 50,000 (50,000)
Auto Extrication−Strut Stabilizatn Equip 6,000 6,000 (6,000)
Auto Extrication Airbags 7,000 7,000 (7,000)
Total Replacement/State of Good Repair 56,000 7,000 50,000 113,000 (113,000)
Total Selkirk Fire Hall Stn#13 56,000 7,000 50,000 113,000 (113,000)
Canborough Fire Hall Stn#6
Replacement/State of Good Repair
Furnace Replacement 15,000 15,000 (15,000)
Parking Lot Replacement 40,000 40,000 (40,000)
Man Doors & Frames 5,000 5,000 (5,000)
Roof 50,000 50,000 (50,000)
Washrooms 5,000 5,000 (5,000)
Total Replacement/State of Good Repair 5,000 5,000 15,000 40,000 50,000 115,000 (115,000)
Total Canborough Fire Hall Stn#6 5,000 5,000 15,000 40,000 50,000 115,000 (115,000)
South Haldimand Fire Hall Stn#11
Replacement/State of Good Repair
Interior Wall Repairs/Drywall/Paint 5,000 5,000 (5,000)
Total Replacement/State of Good Repair 5,000 5,000 (5,000)
New/Enhanced Service
Parking Lot Paving 35,000 35,000 (35,000)
Bay Construction 500,000 500,000 (500,000)
Total New/Enhanced Service 500,000 35,000 535,000 (535,000)
Total South Haldimand Fire Hall Stn#11 505,000 35,000 540,000 (540,000)
Total Fire Services 5,587,700 330,500 409,500 332,500 327,500 269,500 294,500 304,500 284,500 289,500 8,430,200 (300,000) (1,268,630) (4,904,500) (1,957,070)
2013 2014 2015 2016 2017 2018 2019 2020 2021 2022 Total
Expenditures
Grants
Subsidies
External
Financing
Development
Charges
Rsve Funds
Federal
Gas Tax
Rsve Fund
Reserves/
Reserve
Funds
Debenture
Financing
Draft Budget Haldimand County
2013 to 2022 DRAFT TAX SUPPORTED CAPITAL FORECAST
Version:
Division: Fire Services
Note: (W) Water; (WW) Wastewater; (SS) Storm Sewer; (R) Roads18
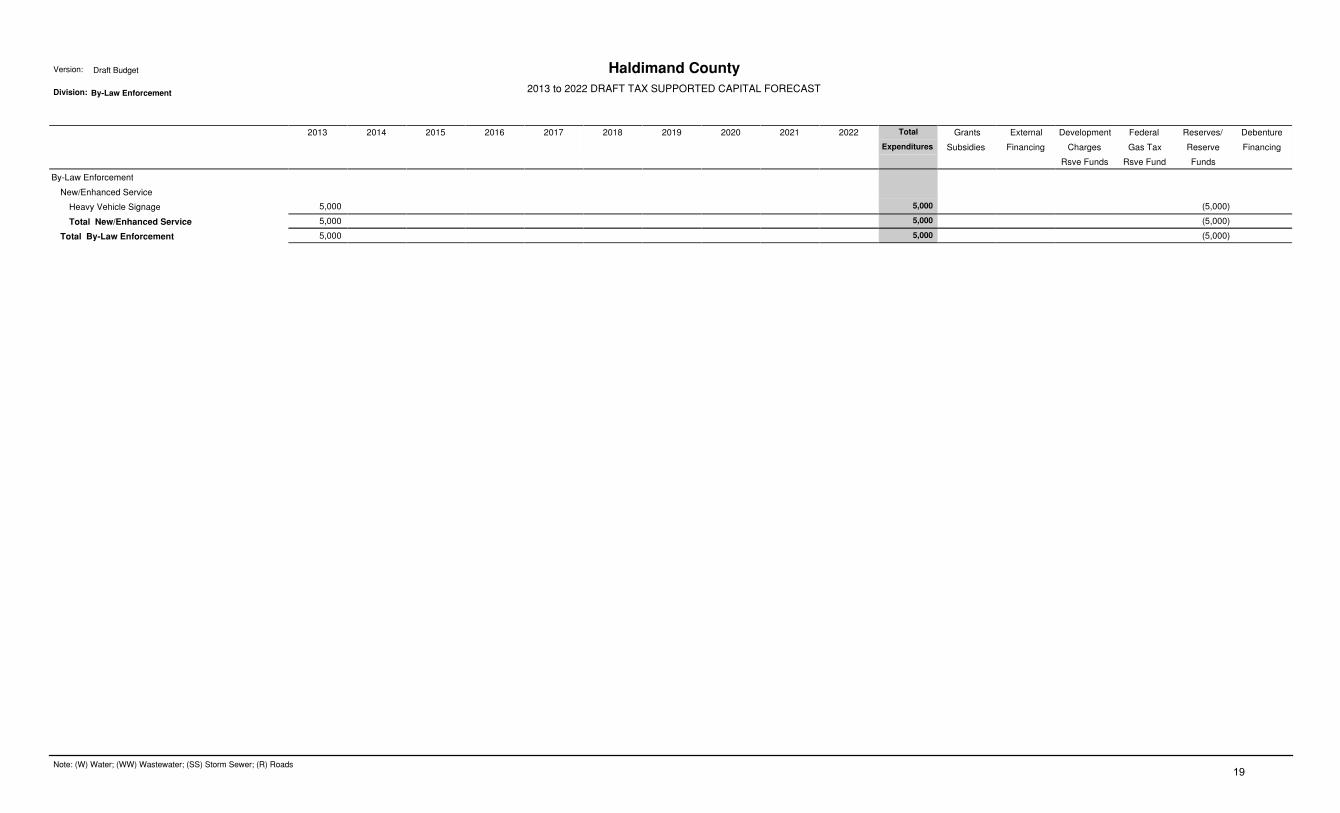
By−Law Enforcement
New/Enhanced Service
Heavy Vehicle Signage 5,000 5,000 (5,000)
Total New/Enhanced Service 5,000 5,000 (5,000)
Total By−Law Enforcement 5,000 5,000 (5,000)
2013 2014 2015 2016 2017 2018 2019 2020 2021 2022 Total
Expenditures
Grants
Subsidies
External
Financing
Development
Charges
Rsve Funds
Federal
Gas Tax
Rsve Fund
Reserves/
Reserve
Funds
Debenture
Financing
Draft Budget Haldimand County
2013 to 2022 DRAFT TAX SUPPORTED CAPITAL FORECAST
Version:
Division: By−Law Enforcement
Note: (W) Water; (WW) Wastewater; (SS) Storm Sewer; (R) Roads19
TRANSPORTATION SERVICES
20

Transportation Services
Fleet and Equipment Pool 1,074,500 1,244,950 1,131,300 1,468,500 1,610,750 1,055,700 2,839,750 1,804,600 959,600 1,205,850 14,395,500 (35,000) (14,360,500)
Roads Facilities 140,000 168,000 170,000 120,000 129,000 172,000 72,000 72,000 152,000 72,000 1,267,000 (1,267,000)
Other Roadwork 2,206,300 2,265,000 1,436,000 815,000 860,000 780,000 730,000 790,000 905,000 730,000 11,517,300 (50,300) (21,500) (232,500) (11,213,000)
Road Reconstruction 2,094,000 5,000,000 1,285,000 900,000 900,000 1,193,000 11,372,000 (841,350) (1,196,500) (9,334,150)
Hot Mix Resurfacing 3,400,000 1,205,000 3,783,600 2,860,400 2,321,200 2,221,000 1,832,300 1,377,390 1,953,500 20,954,390 (800,000) (20,154,390)
Structure Projects 2,715,000 1,910,000 2,385,000 2,155,000 3,290,000 1,830,000 1,530,000 990,000 1,220,000 940,000 18,965,000 (1,300,000) (17,665,000)
Urban Paving Program 898,000 305,000 617,000 400,500 447,000 337,000 380,700 284,380 358,200 290,710 4,318,490 (4,318,490)
Gravel Road Conversion 1,183,600 1,845,120 1,312,320 646,980 621,600 819,480 1,008,120 1,066,140 1,278,420 1,856,540 11,638,320 (11,638,320)
Municipal Drains 258,000 404,230 269,060 242,400 225,100 245,200 171,300 117,300 128,100 336,700 2,397,390 (1,971,690) (425,700)
Total Transportation Services 13,969,400 13,142,300 8,525,680 9,631,980 11,328,850 8,460,580 9,852,870 8,149,720 6,378,710 7,385,300 96,825,390 (50,300) (2,869,540) (2,729,000) (12,438,320) (78,738,230)
2013 2014 2015 2016 2017 2018 2019 2020 2021 2022 Total
Expenditures
Grants
Subsidies
External
Financing
Development
Charges
Rsve Funds
Federal
Gas Tax
Rsve Fund
Reserves/
Reserve
Funds
Debenture
Financing
Draft Budget Haldimand County2013 to 2022 DRAFT TAX SUPPORTED CAPITAL FORECAST
Version:
Transportation Services
Note: (W) Water; (WW) Wastewater; (SS) Storm Sewer; (R) Roads21

Fleet and Equipment Pool
Fleet & Equipment Pool Replacement
Replacement/State of Good Repair
Ambulance Equipment 140,000 140,000 285,000 280,000 140,000 140,000 140,000 5,000 1,270,000 (1,270,000)
Loaders, Tractors, Sweepers 200,000 306,000 85,000 470,000 270,000 1,331,000 (1,331,000)
Riding and Push Mowers 550 170,000 1,100 43,100 26,000 16,000 550 102,000 84,000 443,300 (443,300)
Misc Equip & Tools 34,900 24,550 8,000 57,600 32,000 7,750 78,500 21,150 264,450 (264,450)
Generators, Welders, Compressors 15,800 2,800 3,000 24,500 45,000 3,000 3,000 97,100 (97,100)
Saws and Trimmers 10,000 7,950 11,400 12,850 9,100 9,750 3,300 1,100 7,200 72,650 (72,650)
Cars, Vans, Pickups 108,000 127,000 54,000 134,000 172,000 260,000 201,000 85,000 270,000 1,411,000 (1,411,000)
Ice Equipment 10,000 90,000 5,000 5,000 90,000 90,000 10,000 300,000 (300,000)
One Tons and Special Equipment 50,000 62,000 250,000 256,000 187,000 60,000 865,000 (865,000)
Plow Trucks and Motor Graders 1,210,000 960,000 250,000 1,920,000 175,000 4,515,000 (4,515,000)
Trailers and Rollers 6,000 6,000 28,000 6,000 10,500 56,500 (56,500)
Fire Apparatus Equipment 50,500 42,000 37,000 37,500 84,000 42,000 293,000 (293,000)
Fire Apparatus Rescue 440,000 220,000 220,000 880,000 (880,000)
Fire Appartus Pumpers 380,000 380,000 (380,000)
Fire Appartus Tankers 135,000 540,000 135,000 810,000 (810,000)
Ambulance 140,000 140,000 (140,000)
Loader/Backhoe 130,000 130,000 260,000 (35,000) (225,000)
Mower (Dun Water Large Riding Mower) 26,000 26,000 (26,000)
Mower (2 push mowers − GVL & Cay Parks) 1,100 1,100 (1,100)
Mower (Dun Parks Small Riding Mower) 16,000 16,000 (16,000)
Lawn Attachment 9,000 9,000 (9,000)
Pulverizer (2) 5,000 5,000 (5,000)
Leaf Blower (3) 2,250 2,250 (2,250)
Cement Saw (2) 3,800 3,800 (3,800)
Chainsaw (3) 2,550 2,550 (2,550)
Stringtimmer (11) 5,500 5,500 (5,500)
Compact SUV (2 − By−law) 46,000 46,000 (46,000)
Pump 2,300 2,300 (2,300)
Ice Resurfacer (Dunnville) 90,000 90,000 (90,000)
Utility Vehicle (Tom Howe) 18,000 18,000 (18,000)
Pickups (4) (1 Water, 2 Facilities, 1 Roads) 158,000 158,000 (158,000)
One Ton Truck (Dunnville Water) 50,000 50,000 (50,000)
Grader 300,000 300,000 (300,000)
Total Replacement/State of Good Repair 1,005,500 1,129,950 1,101,300 1,464,500 1,572,750 1,052,700 2,836,750 1,801,600 956,600 1,202,850 14,124,500 (35,000) (14,089,500)
Total Fleet & Equipment Pool Replacement 1,005,500 1,129,950 1,101,300 1,464,500 1,572,750 1,052,700 2,836,750 1,801,600 956,600 1,202,850 14,124,500 (35,000) (14,089,500)
2013 2014 2015 2016 2017 2018 2019 2020 2021 2022 Total
Expenditures
Grants
Subsidies
External
Financing
Development
Charges
Rsve Funds
Federal
Gas Tax
Rsve Fund
Reserves/
Reserve
Funds
Debenture
Financing
Draft Budget Haldimand County
2013 to 2022 DRAFT TAX SUPPORTED CAPITAL FORECAST
Version:
Division: Fleet and Equipment Pool
Note: (W) Water; (WW) Wastewater; (SS) Storm Sewer; (R) Roads22

Fleet & Equipment New
New/Enhanced Service
Water Tank and Pump (Roads) (2) 22,000 22,000 (22,000)
Ambulance (1) FRU 37,000 37,000 (37,000)
Forklift (Fleet) (1) 10,000 10,000 (10,000)
Gator FAPO (1) 12,000 12,000 (12,000)
Total New/Enhanced Service 32,000 37,000 12,000 81,000 (81,000)
Total Fleet & Equipment New 32,000 37,000 12,000 81,000 (81,000)
Kohler Fleet Office
Replacement/State of Good Repair
Replace water pump, install new cistern 15,000 15,000 (15,000)
Roof Replacement/Repair 15,000 35,000 50,000 (50,000)
Building Repairs & Renovations 15,000 15,000 (15,000)
Total Replacement/State of Good Repair 30,000 15,000 35,000 80,000 (80,000)
Total Kohler Fleet Office 30,000 15,000 35,000 80,000 (80,000)
Kohler Fleet Garage
Replacement/State of Good Repair
Two−Way Radio Sys−Base Stn & Portables 3,000 3,000 3,000 4,000 3,000 3,000 3,000 3,000 3,000 3,000 31,000 (31,000)
Total Replacement/State of Good Repair 3,000 3,000 3,000 4,000 3,000 3,000 3,000 3,000 3,000 3,000 31,000 (31,000)
New/Enhanced Service
Build Storage & Parts Room 75,000 75,000 (75,000)
Facility Condition Assessment 4,000 4,000 (4,000)
Total New/Enhanced Service 4,000 75,000 79,000 (79,000)
Total Kohler Fleet Garage 7,000 78,000 3,000 4,000 3,000 3,000 3,000 3,000 3,000 3,000 110,000 (110,000)
Total Fleet and Equipment Pool 1,074,500 1,244,950 1,131,300 1,468,500 1,610,750 1,055,700 2,839,750 1,804,600 959,600 1,205,850 14,395,500 (35,000) (14,360,500)
2013 2014 2015 2016 2017 2018 2019 2020 2021 2022 Total
Expenditures
Grants
Subsidies
External
Financing
Development
Charges
Rsve Funds
Federal
Gas Tax
Rsve Fund
Reserves/
Reserve
Funds
Debenture
Financing
Draft Budget Haldimand County
2013 to 2022 DRAFT TAX SUPPORTED CAPITAL FORECAST
Version:
Division: Fleet and Equipment Pool
Note: (W) Water; (WW) Wastewater; (SS) Storm Sewer; (R) Roads23

Roads Facilities
Replacement/State of Good Repair
Sand and Salt Dome Minor Repairs 18,000 2,000 2,000 2,000 2,000 2,000 28,000 (28,000)
Oneida Building−Roof Replacement 24,000 100,000 124,000 (124,000)
Operations Buildings−Repairs/Renovations 140,000 120,000 120,000 100,000 90,000 70,000 70,000 70,000 70,000 70,000 920,000 (920,000)
Dunnville Roof Repairs 15,000 15,000 (15,000)
Facility Condition Assess (4) Facilities 80,000 80,000 (80,000)
Total Replacement/State of Good Repair 140,000 138,000 120,000 100,000 129,000 172,000 72,000 72,000 152,000 72,000 1,167,000 (1,167,000)
New/Enhanced Service
Cayuga Operations Yard Resurfacing 30,000 30,000 (30,000)
Dunnville Operations Yard Resurfacing 30,000 30,000 (30,000)
Walpole Operations Yard Resurfacing 20,000 20,000 (20,000)
Oneida Operations Yard Resurfacing 20,000 20,000 (20,000)
Total New/Enhanced Service 30,000 50,000 20,000 100,000 (100,000)
Total Roads Facilities 140,000 168,000 170,000 120,000 129,000 172,000 72,000 72,000 152,000 72,000 1,267,000 (1,267,000)
2013 2014 2015 2016 2017 2018 2019 2020 2021 2022 Total
Expenditures
Grants
Subsidies
External
Financing
Development
Charges
Rsve Funds
Federal
Gas Tax
Rsve Fund
Reserves/
Reserve
Funds
Debenture
Financing
Draft Budget Haldimand County
2013 to 2022 DRAFT TAX SUPPORTED CAPITAL FORECAST
Version:
Division: Roads Facilities
Note: (W) Water; (WW) Wastewater; (SS) Storm Sewer; (R) Roads24

Version: Draft
Division: Capital Infrastructure Summary
2013 2014 2015 2016 2017 2018 2019 2020 2021 2022 Total Grants External Development Federal Reserves/ Debenture
Expenditures Subsidies Financing Charges Gas Tax Reserve Financing
Rsve Funds Rsve Fund Funds
Capital Infrastructure Summary
Other Roadwork 2,206,300 2,265,000 1,436,000 815,000 860,000 780,000 730,000 790,000 905,000 730,000 11,517,300 (50,300) (21,500) (232,500) (11,213,000)
Road Reconstruction 2,094,000 5,000,000 1,285,000 900,000 900,000 1,193,000 11,372,000 (841,350) (1,196,500) (9,334,150)
Hot Mix Resurfacing 3,400,000 1,205,000 3,783,600 2,860,400 2,321,200 2,221,000 1,832,300 1,377,390 1,953,500 20,954,390 (800,000) (20,154,390)
Structure Projects 2,715,000 1,910,000 2,385,000 2,155,000 3,290,000 1,830,000 1,530,000 990,000 1,220,000 940,000 18,965,000 (1,300,000) (17,665,000)
Urban Paving Program 898,000 305,000 617,000 400,500 447,000 337,000 380,700 284,380 358,200 290,710 4,318,490 (4,318,490)
Gravel Road Conversion 1,183,600 1,845,120 1,312,320 646,980 621,600 819,480 1,008,120 1,066,140 1,278,420 1,856,540 11,638,320 (11,638,320)
Municipal Drains 258,000 404,230 269,060 242,400 225,100 245,200 171,300 117,300 128,100 336,700 2,397,390 (1,971,690) (425,700)
Total Capital Infrastructure Summary 12,754,900 11,729,350 7,224,380 8,043,480 9,589,100 7,232,880 6,941,120 6,273,120 5,267,110 6,107,450 81,162,890 (50,300) (2,834,540) (2,729,000) (12,438,320) (63,110,730)
Haldimand County 2013 to 2022 DRAFT TAX SUPPORTED CAPITAL FORECAST
25

Other Roadwork
Hardtop Surface & Shoulder Maint
Replacement/State of Good Repair
Raised Traffic Island and Curb Rehabilitation 30,000 30,000 30,000 30,000 30,000 30,000 30,000 30,000 30,000 30,000 300,000 (300,000)
Hot Mix Patching Program 50,000 50,000 50,000 50,000 50,000 50,000 50,000 50,000 50,000 50,000 500,000 (500,000)
Total Replacement/State of Good Repair 80,000 80,000 80,000 80,000 80,000 80,000 80,000 80,000 80,000 80,000 800,000 (800,000)
Total Hardtop Surface & Shoulder Maint 80,000 80,000 80,000 80,000 80,000 80,000 80,000 80,000 80,000 80,000 800,000 (800,000)
Gravel Surface & Shoulder Maint
Replacement/State of Good Repair
Sub−Surface Drainage Installation 100,000 100,000 100,000 100,000 100,000 100,000 100,000 100,000 100,000 900,000 (900,000)
Total Replacement/State of Good Repair 100,000 100,000 100,000 100,000 100,000 100,000 100,000 100,000 100,000 900,000 (900,000)
Total Gravel Surface & Shoulder Maint 100,000 100,000 100,000 100,000 100,000 100,000 100,000 100,000 100,000 900,000 (900,000)
Storm Sewer/Catch Basin Maint
Replacement/State of Good Repair
Storm Sewer/Culvert Rehabilitation 50,000 50,000 50,000 50,000 50,000 50,000 50,000 50,000 50,000 50,000 500,000 (500,000)
Total Replacement/State of Good Repair 50,000 50,000 50,000 50,000 50,000 50,000 50,000 50,000 50,000 50,000 500,000 (500,000)
Total Storm Sewer/Catch Basin Maint 50,000 50,000 50,000 50,000 50,000 50,000 50,000 50,000 50,000 50,000 500,000 (500,000)
Traffic Signals
Replacement/State of Good Repair
Traffic Signal Light Program 100,000 100,000 200,000 (200,000)
Total Replacement/State of Good Repair 100,000 100,000 200,000 (200,000)
Total Traffic Signals 100,000 100,000 200,000 (200,000)
Bridge & Culvert Maintenance
Replacement/State of Good Repair
Cross Culvert Placement and Lining Rehab 60,000 60,000 60,000 60,000 60,000 60,000 60,000 60,000 60,000 60,000 600,000 (600,000)
Roadside Barrier Program 55,000 55,000 55,000 55,000 55,000 55,000 55,000 55,000 55,000 55,000 550,000 (550,000)
Total Replacement/State of Good Repair 115,000 115,000 115,000 115,000 115,000 115,000 115,000 115,000 115,000 115,000 1,150,000 (1,150,000)
Total Bridge & Culvert Maintenance 115,000 115,000 115,000 115,000 115,000 115,000 115,000 115,000 115,000 115,000 1,150,000 (1,150,000)
Street Lighting
Replacement/State of Good Repair
Light Standard Repl Urban Areas 10,000 10,000 10,000 10,000 10,000 10,000 10,000 10,000 10,000 10,000 100,000 (100,000)
Cay−Downtown Streetlight Replac’t Program 100,000 100,000 (6,500) (93,500)
Total Replacement/State of Good Repair 10,000 110,000 10,000 10,000 10,000 10,000 10,000 10,000 10,000 10,000 200,000 (6,500) (193,500)
New/Enhanced Service
Energy Conservation St Light Conversion 30,000 30,000 30,000 30,000 30,000 30,000 30,000 30,000 30,000 30,000 300,000 (300,000)
Street Light Placement (Rural Intersections) 10,000 10,000 10,000 10,000 10,000 10,000 10,000 10,000 10,000 10,000 100,000 (100,000)
Total New/Enhanced Service 40,000 40,000 40,000 40,000 40,000 40,000 40,000 40,000 40,000 40,000 400,000 (400,000)
Total Street Lighting 50,000 150,000 50,000 50,000 50,000 50,000 50,000 50,000 50,000 50,000 600,000 (6,500) (593,500)
Miscellaneous Construction
2013 2014 2015 2016 2017 2018 2019 2020 2021 2022 Total
Expenditures
Grants
Subsidies
External
Financing
Development
Charges
Rsve Funds
Federal
Gas Tax
Rsve Fund
Reserves/
Reserve
Funds
Debenture
Financing
Draft Budget Haldimand County
2013 to 2022 DRAFT TAX SUPPORTED CAPITAL FORECAST
Version:
Division: Other Roadwork
Note: (W) Water; (WW) Wastewater; (SS) Storm Sewer; (R) Roads 26

Replacement/State of Good Repair
Sidewalk Replacement and Installation 150,000 150,000 150,000 150,000 150,000 150,000 150,000 150,000 150,000 150,000 1,500,000 (1,500,000)
Abandoned Rail Crossing Rehab Prgrm 100,000 100,000 (100,000)
Retaining Wall Replacement − Caledonia 40,000 40,000 (40,000)
Haldibrook Rd − Hwy 6 to Tyneside Rd 400,000 400,000 (400,000)
North Shore Road Culvert Replacement 40,000 40,000 (40,000)
Darling Road Culvert Replacement 35,000 35,000 (35,000)
Roadside Safety Program 75,000 75,000 (75,000)
Downtown Dunnville Tree Replacement 15,000 15,000 (5,000) (10,000)
Total Replacement/State of Good Repair 415,000 550,000 150,000 190,000 150,000 150,000 150,000 150,000 150,000 150,000 2,205,000 (5,000) (2,200,000)
New/Enhanced Service
Fisherville Sidewalk−Town Limits to Rainham Central School41,000 41,000 (10,000) (31,000)
Total New/Enhanced Service 41,000 41,000 (10,000) (31,000)
Total Miscellaneous Construction 456,000 550,000 150,000 190,000 150,000 150,000 150,000 150,000 150,000 150,000 2,246,000 (15,000) (2,231,000)
Technical Studies
Replacement/State of Good Repair
Master Servicing Plan Jarvis (W WW S) 15,000 15,000 30,000 (22,500) (7,500)
Master Servicing Plan Cayuga (W WW S) 30,000 30,000 60,000 (45,000) (15,000)
MSP Update Caledonia (W WW S) 50,000 50,000 100,000 (75,000) (25,000)
MSP Update Hagersville (W WW S) 30,000 30,000 60,000 (45,000) (15,000)
MSP Update Dunnville (W WW S) 30,000 30,000 60,000 (45,000) (15,000)
Preliminary Engineering Investigations 15,000 15,000 15,000 15,000 15,000 15,000 15,000 15,000 15,000 15,000 150,000 (150,000)
Roads Needs Study 130,000 130,000 130,000 390,000 (390,000)
Contract Technical Support 60,000 60,000 60,000 180,000 (180,000)
Total Replacement/State of Good Repair 255,000 135,000 75,000 60,000 145,000 65,000 15,000 75,000 190,000 15,000 1,030,000 (232,500) (797,500)
New/Enhanced Service
Asset Management Plan Development 50,300 50,300 (50,300)
Total New/Enhanced Service 50,300 50,300 (50,300)
Total Technical Studies 305,300 135,000 75,000 60,000 145,000 65,000 15,000 75,000 190,000 15,000 1,080,300 (50,300) (232,500) (797,500)
Surface Treatment
Replacement/State of Good Repair
Kohler Rd−Hald Rd 20 to Lakeshore Rd Pad & SST 435,000 435,000 (435,000)
Robinson Rd−Stringer Rd to Townline Rd, Pad & SST 816,000 816,000 (816,000)
Hald Rd. 70 − Rainham Road to Highway 6 450,000 450,000 (450,000)
Road Pulverizing−Resurfacing 170,000 170,000 170,000 170,000 170,000 170,000 170,000 1,190,000 (1,190,000)
Concession 13 Walpole − Rd 20 to Rd 74 600,000 550,000 1,150,000 (1,150,000)
Total Replacement/State of Good Repair 1,050,000 985,000 816,000 170,000 170,000 170,000 170,000 170,000 170,000 170,000 4,041,000 (4,041,000)
Total Surface Treatment 1,050,000 985,000 816,000 170,000 170,000 170,000 170,000 170,000 170,000 170,000 4,041,000 (4,041,000)
Total Other Roadwork 2,206,300 2,265,000 1,436,000 815,000 860,000 780,000 730,000 790,000 905,000 730,000 11,517,300 (50,300) (21,500) (232,500) (11,213,000)
2013 2014 2015 2016 2017 2018 2019 2020 2021 2022 Total
Expenditures
Grants
Subsidies
External
Financing
Development
Charges
Rsve Funds
Federal
Gas Tax
Rsve Fund
Reserves/
Reserve
Funds
Debenture
Financing
Draft Budget Haldimand County
2013 to 2022 DRAFT TAX SUPPORTED CAPITAL FORECAST
Version:
Division: Other Roadwork
Note: (W) Water; (WW) Wastewater; (SS) Storm Sewer; (R) Roads 27

Road Reconstruction
Replacement/State of Good Repair
Dun−Alder St − Niag to West (W WW S) 85,000 900,000 900,000 1,885,000 (1,885,000)
Cal−Caithness St W−Firehall to Ross (W WW SS) 244,000 2,000,000 2,244,000 (400,000) (1,844,000)
Cayuga Talbot Street − Ouse to Montour (W)(WW)(S) 1,500,000 1,500,000 (1,500,000)
Cal−Wigton St− Haddington to Argyle (W WW) 1,850,000 1,850,000 (350,000) (1,500,000)
Cal−River Road (W WW S) 1,200,000 1,200,000 (91,350) (600,000) (508,650)
Total Replacement/State of Good Repair 2,094,000 3,500,000 1,285,000 900,000 900,000 8,679,000 (841,350) (600,000) (7,237,650)
New/Enhanced Service
Conc 3 Walp − Hald Rd 18 to Hald Rd 55 1,500,000 1,500,000 (1,500,000)
Dun−Ramsey Ext Ph II & Indus Dr (W WW S) 1,193,000 1,193,000 (596,500) (596,500)
Total New/Enhanced Service 1,500,000 1,193,000 2,693,000 (596,500) (2,096,500)
Total Road Reconstruction 2,094,000 5,000,000 1,285,000 900,000 900,000 1,193,000 11,372,000 (841,350) (1,196,500) (9,334,150)
2013 2014 2015 2016 2017 2018 2019 2020 2021 2022 Total
Expenditures
Grants
Subsidies
External
Financing
Development
Charges
Rsve Funds
Federal
Gas Tax
Rsve Fund
Reserves/
Reserve
Funds
Debenture
Financing
Draft Budget Haldimand County
2013 to 2022 DRAFT TAX SUPPORTED CAPITAL FORECAST
Version:
Division: Road Reconstruction
Note: (W) Water; (WW) Wastewater; (SS) Storm Sewer; (R) Roads28

Hot Mix Resurfacing
Replacement/State of Good Repair
McKenzie Rd − 4th Line to Hald Rd 9 2,000,000 2,000,000 (800,000) (1,200,000)
Diltz Road − Niagara to Concession 1,400,000 1,400,000 (1,400,000)
Dun−Broad St − George to Pine 650,000 650,000 (650,000)
Marshagan Rd − Hwy 3 − Niagara Townline 1,400,000 1,400,000 (1,400,000)
Hald Rd 66 − Tineside Rd to Haldibrook Rd 1,600,000 1,600,000 (1,600,000)
Port Maitland Rd − Rainham Rd to Lighthouse Dr 1,321,000 1,321,000 (1,321,000)
Hald Rd 54−Mines Rd to Onondaga Townline Rd 655,000 655,000 (655,000)
Hald Rd 54 − McKinnon Dr to Mines Rd 285,000 285,000 (285,000)
Cay−Thorburn St S−Talbot to 230m S of Joseph 255,000 255,000 (255,000)
Hald Rd 3 − Hald Rd 55 to Norfolk Townline 738,000 738,000 (738,000)
Cay−Munsee St N − Talbot to Indian 500,000 500,000 (500,000)
Canb−Main St − Canborough Rd to Hwy 3 104,000 104,000 (104,000)
Dun−Main St W − Cedar to George 300,000 300,000 (300,000)
Hald Rd 20−Kohler Rd to Lot 12/13, S Cay 2,700,000 2,700,000 (2,700,000)
Nanticoke Creek Pky−Hald Rd 55 to Towsend 800,000 800,000 (800,000)
Rainham Rd−Cheapside Rd to Rd Sec 03230 900,000 900,000 (900,000)
Cay−Rainham Rd−Hald Rd 53 to Cheapside Rd 920,000 920,000 (920,000)
Jar−Rainham Rd−Sandusk Rd to Cheapside Rd 1,033,500 1,033,500 (1,033,500)
Hag−Main S−King to Parkview 160,400 160,400 (160,400)
Hag−Main N−King to Marathon 179,200 179,200 (179,200)
Jar−Talbot E−Hwy 6 to 740m E of Craddock 274,400 274,400 (274,400)
Jar−Main N−Hwy 3 to 1.3km N 260,000 260,000 (260,000)
Jar−Main S−Hwy 3 to 760m S 152,400 152,400 (152,400)
Jar−Talbot W−Hwy 6 to 470m W 96,800 96,800 (96,800)
Cal−6th Line Oneida−Argyle St to Oneida Rd 400,000 400,000 (400,000)
Mines Rd−Greens Rd W to Greens Rd E 315,560 315,560 (315,560)
Mines Rd−Greens Rd W to Haldibrook Rd 576,740 576,740 (576,740)
Caistorville Rd−Hald Rd 14 to Hald/Dunn Twln 977,390 977,390 (977,390)
Total Replacement/State of Good Repair 3,400,000 1,205,000 3,783,600 2,860,400 2,321,200 2,221,000 1,832,300 1,377,390 1,953,500 20,954,390 (800,000) (20,154,390)
Total Hot Mix Resurfacing 3,400,000 1,205,000 3,783,600 2,860,400 2,321,200 2,221,000 1,832,300 1,377,390 1,953,500 20,954,390 (800,000) (20,154,390)
2013 2014 2015 2016 2017 2018 2019 2020 2021 2022 Total
Expenditures
Grants
Subsidies
External
Financing
Development
Charges
Rsve Funds
Federal
Gas Tax
Rsve Fund
Reserves/
Reserve
Funds
Debenture
Financing
Draft Budget Haldimand County
2013 to 2022 DRAFT TAX SUPPORTED CAPITAL FORECAST
Version:
Division: Hot Mix Resurfacing
Note: (W) Water; (WW) Wastewater; (SS) Storm Sewer; (R) Roads29

Structure Projects
Replacement/State of Good Repair
Annual Bridge Engineering 300,000 300,000 300,000 300,000 300,000 300,000 300,000 300,000 300,000 300,000 3,000,000 (3,000,000)
OSIM Inspections 80,000 80,000 80,000 80,000 80,000 400,000 (400,000)
Load Limit Reviews 20,000 20,000 20,000 20,000 20,000 20,000 20,000 20,000 20,000 20,000 200,000 (200,000)
Deck Condition Surveys 60,000 60,000 20,000 60,000 20,000 20,000 20,000 20,000 280,000 (280,000)
Stelco Bridge Rehab (010026) 410,000 410,000 (410,000)
Towsend Parkway Bridge Rehab (987403) 200,000 200,000 (200,000)
Nanticoke Creek Pkwy Bridge Rehab (986909) 150,000 150,000 (150,000)
Woodlawn Bridge Rehab (010003) 1,115,000 1,115,000 (1,115,000)
Dennis Bridge Rehab (980305) 260,000 260,000 (260,000)
Second Line Bridge Oneida Rehab (000035) 500,000 500,000 (500,000)
Mattice Bridge Conc 3 Walpole Rehab (010010) 400,000 400,000 (400,000)
Gates Bridge Replacement (00005) 700,000 700,000 (700,000)
Peel Street Jarvis Replacement (010109) 300,000 300,000 (300,000)
Melick Rd Culvert Dunnville Replac (D00007) 365,000 365,000 (365,000)
Townline Bridge Replac (D00005) 650,000 650,000 (650,000)
Third Line Culvert Rehab (000072) 210,000 210,000 (210,000)
Conc 3 Bridge Rainham Rehab (00006) 300,000 300,000 (300,000)
Conc 3 Bridge Rainham Rehab (00007) 300,000 300,000 (300,000)
Conc 7 Bridge Rainham Rehab (000014) 300,000 300,000 (300,000)
River Rd Bridge N − Cayuga Rehab (000017) 300,000 300,000 (300,000)
Townline Bridge N − Cay/Sen Rehab (000023) 210,000 210,000 (210,000)
Peart Bridge − River Road Rehab (000032) 300,000 300,000 (300,000)
Junction Road Culvert Rehab (000051) 300,000 300,000 (300,000)
Junction Rd Culvert Rehab (000052) 210,000 210,000 (210,000)
Empire Rd Culvert Rehab (980909) 250,000 250,000 (250,000)
Conc 6 Bridge, Walpole Replacement (010076) 400,000 400,000 (400,000)
Conc 2 Culvert Seneca Rehab (000069) 300,000 300,000 (300,000)
Church St Jarvis Replacement (00008N) 400,000 400,000 (400,000)
Cheapside Rd Bridge Rehab (010004) 350,000 350,000 (350,000)
Townline Rd Bridge Rehab (010060) 400,000 400,000 (400,000)
Walpole St Culvert Replac Jarvis (010108) 400,000 400,000 (400,000)
Sandusk Crk Culvert Replac Walpole (030034) 300,000 300,000 (300,000)
Pedestrian Walkway (977402) 100,000 100,000 (100,000)
Townline Road Culvert (987406) 275,000 275,000 (275,000)
Conc. 9 Walpole Rehab (0100136) 300,000 300,000 (300,000)
Hart Road Drain Replacement (00005C) 200,000 200,000 (200,000)
2013 2014 2015 2016 2017 2018 2019 2020 2021 2022 Total
Expenditures
Grants
Subsidies
External
Financing
Development
Charges
Rsve Funds
Federal
Gas Tax
Rsve Fund
Reserves/
Reserve
Funds
Debenture
Financing
Draft Budget Haldimand County
2013 to 2022 DRAFT TAX SUPPORTED CAPITAL FORECAST
Version:
Division: Structure Projects
Note: (W) Water; (WW) Wastewater; (SS) Storm Sewer; (R) Roads30

Oswego Bridge Rehab (981501) 250,000 250,000 (250,000)
Removal of CNR Bridge (985402) 150,000 150,000 (150,000)
Removal of CNR Bridge (000016) 150,000 150,000 (150,000)
Mud Street Culvert Rehab (980907) 150,000 150,000 (150,000)
Indian Line Culvert Rehab (982002) 100,000 100,000 (100,000)
Townsend Parkway Culvert Rehab (987404) 200,000 200,000 (200,000)
Townsend Road 74 Culvert Rehab (987405) 100,000 100,000 (100,000)
Townsend Road 74 Culvert Rehab (987407) 100,000 100,000 (100,000)
Caithness Street Culvert Rehab (000006−C) 100,000 100,000 (100,000)
Conc 4 Rainham Bridge Rehab (000009) 100,000 100,000 (100,000)
Conc 4 Rainham Bridge Rehab (000045) 100,000 100,000 (100,000)
Sunny Bank Park − Bridge Rehab (000019) 300,000 300,000 (300,000)
Johnson Bridge Rehab (010022) 100,000 100,000 (100,000)
Balmoral Bridge Rehab (985301) 100,000 100,000 (100,000)
Grand River Bridge Pier Rehab (980309) 400,000 400,000 (400,000)
Sulphur Bridge Pier Rehab (980905) 200,000 200,000 (200,000)
Total Replacement/State of Good Repair 2,715,000 1,880,000 2,385,000 2,155,000 1,990,000 1,830,000 1,530,000 990,000 1,220,000 940,000 17,635,000 (17,635,000)
New/Enhanced Service
Cal−Argyle St Bridge Replacement (MTO) 1,300,000 1,300,000 (1,300,000)
Cayuga Hwy 3 Bridge − Approach Lighting 30,000 30,000 (30,000)
Total New/Enhanced Service 30,000 1,300,000 1,330,000 (1,300,000) (30,000)
Total Structure Projects 2,715,000 1,910,000 2,385,000 2,155,000 3,290,000 1,830,000 1,530,000 990,000 1,220,000 940,000 18,965,000 (1,300,000) (17,665,000)
2013 2014 2015 2016 2017 2018 2019 2020 2021 2022 Total
Expenditures
Grants
Subsidies
External
Financing
Development
Charges
Rsve Funds
Federal
Gas Tax
Rsve Fund
Reserves/
Reserve
Funds
Debenture
Financing
Draft Budget Haldimand County
2013 to 2022 DRAFT TAX SUPPORTED CAPITAL FORECAST
Version:
Division: Structure Projects
Note: (W) Water; (WW) Wastewater; (SS) Storm Sewer; (R) Roads31

Urban Paving Program
Hagersville Urban Paving
Replacement/State of Good Repair
Hag−Howard St−King to Walpole 70,000 70,000 (70,000)
Hag−John St−King to Walpole 70,000 70,000 (70,000)
Hag−Church St−Main to John 35,000 35,000 (35,000)
Hag−Walpole St−Main to John 35,000 35,000 (35,000)
Hag−Tuscarora St − King to end 87,500 87,500 (87,500)
Hag−Alma from King to Marathon 175,000 175,000 (175,000)
Hag−Church from Main to Sherring 52,500 52,500 (52,500)
Hag−Park Place from Alma to Main 22,000 22,000 (22,000)
Hag−Marathon from Main to Sherring 35,000 35,000 (35,000)
Hag−Carrick St from King to Athens 52,500 52,500 (52,500)
Hag−Hewitt Dr−Parkview to South 83,200 83,200 (83,200)
Total Replacement/State of Good Repair 337,000 380,700 717,700 (717,700)
Total Hagersville Urban Paving 337,000 380,700 717,700 (717,700)
Caledonia Urban Paving
Replacement/State of Good Repair
Cal−Heddle St − Haddington to Renfrew 270,000 270,000 (270,000)
Cal−Munro Ct−Ross to end 9,350 9,350 (9,350)
Cal−Ross St−Orkney W to Morrison 37,100 37,100 (37,100)
Cal−Haller Cres 137,640 137,640 (137,640)
Cal−Haddington−Wigton to River Rd 112,000 112,000 (112,000)
Cal−Braemar−Argyle to Kinross 120,000 120,000 (120,000)
Cal−Caledonia Dr−Tartan to Highland 48,000 48,000 (48,000)
Cal−Caledonia Dr−Highland to McKenzie 76,000 76,000 (76,000)
Cal−Douglas Dr−McKenzie to Highland 58,400 58,400 (58,400)
Cal−Morrison Rd−Ross St to east end 63,720 63,720 (63,720)
Cal−Stirling Street − Argyle Street to end 148,300 148,300 (148,300)
Cal−Tartan Dr − Highland to Buchanan 44,000 44,000 (44,000)
Cal−Highland Blvd − Tartan to Haddington 107,500 107,500 (107,500)
Cal−Dumfries − Orkney W to Morrison 42,900 42,900 (42,900)
Cal−Aberdeen Street (W) 75,000 75,000 (75,000)
Total Replacement/State of Good Repair 577,000 124,000 358,200 290,710 1,349,910 (1,349,910)
Total Caledonia Urban Paving 577,000 124,000 358,200 290,710 1,349,910 (1,349,910)
Jarvis Urban Paving
Replacement/State of Good Repair
Jar−Craddock Blvd − Talbot St to north end 92,000 92,000 (92,000)
2013 2014 2015 2016 2017 2018 2019 2020 2021 2022 Total
Expenditures
Grants
Subsidies
External
Financing
Development
Charges
Rsve Funds
Federal
Gas Tax
Rsve Fund
Reserves/
Reserve
Funds
Debenture
Financing
Draft Budget Haldimand County
2013 to 2022 DRAFT TAX SUPPORTED CAPITAL FORECAST
Version:
Division: Urban Paving Program
Note: (W) Water; (WW) Wastewater; (SS) Storm Sewer; (R) Roads32

Jar−Marley Cres − Craddock to Lafayette 100,000 100,000 (100,000)
Jar−Cabot Court − Marley to west end 10,000 10,000 (10,000)
Jar−Boyd St − Monson to Main 21,000 21,000 (21,000)
Jar−Lydia St−Main St to Mary St 30,000 30,000 (30,000)
Jar−Mary St−Elizabeth St to end 30,000 30,000 (30,000)
Jar−Church St−Peel St to end 60,000 60,000 (60,000)
Jar−Elizabeth St−Main St to Mary St 30,000 30,000 (30,000)
Jar−Keen St−Peel St to End 15,000 15,000 (15,000)
Jar−Peel St E−Walpole Dr to end 25,000 25,000 (25,000)
Total Replacement/State of Good Repair 321,000 92,000 413,000 (413,000)
Total Jarvis Urban Paving 321,000 92,000 413,000 (413,000)
Cayuga Urban Paving
Replacement/State of Good Repair
Cay−Indian St − Hald Rd 54 to end 65,500 65,500 (65,500)
Cay−Echo St − Martin to Monture 119,000 119,000 (119,000)
Total Replacement/State of Good Repair 184,500 184,500 (184,500)
Total Cayuga Urban Paving 184,500 184,500 (184,500)
Dunnville Urban Paving
Replacement/State of Good Repair
Dun−Brelus Dr − Brookfield to Cowan Ave 54,000 54,000 (54,000)
Dun−Brookfield Blvd − John St to end 115,000 115,000 (115,000)
Dun−Cowan Ave − John S to Brookfield Blvd 32,000 32,000 (32,000)
Dun−John St − Main W to Lock 41,000 41,000 (41,000)
Dun−Pine St − North Cayuga to Conc 318,000 318,000 (318,000)
Dun−Cross St Alleyways 73,000 73,000 (73,000)
Dunn−Chestnut−Queen to S Cayuga 185,000 185,000 (185,000)
Dunn−Pine−Main to Lock 30,000 30,000 (30,000)
Dunn−Cedar−Main to Broad 57,000 57,000 (57,000)
Dunn−Lock−Chestnut to Pine 118,000 118,000 (118,000)
Dunn−Queen−Maple to Chestnut 100,000 100,000 (100,000)
Total Replacement/State of Good Repair 305,000 617,000 201,000 1,123,000 (1,123,000)
Total Dunnville Urban Paving 305,000 617,000 201,000 1,123,000 (1,123,000)
Townsend Urban Paving
Replacement/State of Good Repair
Townsend−Burnhamwood−Edenridge to Nord 34,000 34,000 (34,000)
Townsend−Town Centre Dr−Townsend Pkwy to end 62,000 62,000 (62,000)
Tow−Stone Quarry Rd−Townsend Pkwy to End 71,140 71,140 (71,140)
Tow−Forest Park Dr−Townsend Pkwy to End 95,460 95,460 (95,460)
2013 2014 2015 2016 2017 2018 2019 2020 2021 2022 Total
Expenditures
Grants
Subsidies
External
Financing
Development
Charges
Rsve Funds
Federal
Gas Tax
Rsve Fund
Reserves/
Reserve
Funds
Debenture
Financing
Draft Budget Haldimand County
2013 to 2022 DRAFT TAX SUPPORTED CAPITAL FORECAST
Version:
Division: Urban Paving Program
Note: (W) Water; (WW) Wastewater; (SS) Storm Sewer; (R) Roads33
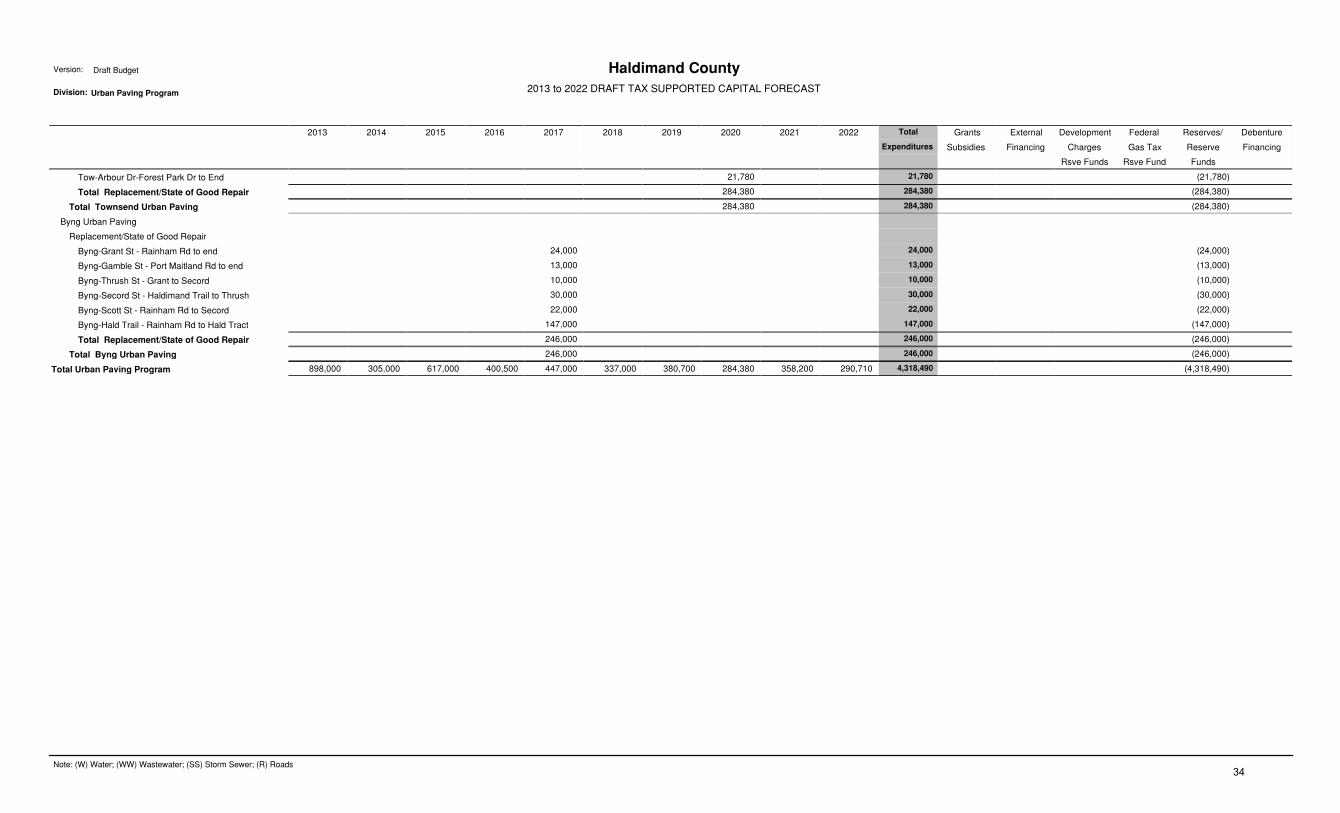
Tow−Arbour Dr−Forest Park Dr to End 21,780 21,780 (21,780)
Total Replacement/State of Good Repair 284,380 284,380 (284,380)
Total Townsend Urban Paving 284,380 284,380 (284,380)
Byng Urban Paving
Replacement/State of Good Repair
Byng−Grant St − Rainham Rd to end 24,000 24,000 (24,000)
Byng−Gamble St − Port Maitland Rd to end 13,000 13,000 (13,000)
Byng−Thrush St − Grant to Secord 10,000 10,000 (10,000)
Byng−Secord St − Haldimand Trail to Thrush 30,000 30,000 (30,000)
Byng−Scott St − Rainham Rd to Secord 22,000 22,000 (22,000)
Byng−Hald Trail − Rainham Rd to Hald Tract 147,000 147,000 (147,000)
Total Replacement/State of Good Repair 246,000 246,000 (246,000)
Total Byng Urban Paving 246,000 246,000 (246,000)
Total Urban Paving Program 898,000 305,000 617,000 400,500 447,000 337,000 380,700 284,380 358,200 290,710 4,318,490 (4,318,490)
2013 2014 2015 2016 2017 2018 2019 2020 2021 2022 Total
Expenditures
Grants
Subsidies
External
Financing
Development
Charges
Rsve Funds
Federal
Gas Tax
Rsve Fund
Reserves/
Reserve
Funds
Debenture
Financing
Draft Budget Haldimand County
2013 to 2022 DRAFT TAX SUPPORTED CAPITAL FORECAST
Version:
Division: Urban Paving Program
Note: (W) Water; (WW) Wastewater; (SS) Storm Sewer; (R) Roads34

Gravel Road Conversion
New/Enhanced Service
Conc 4 − Road 56 east to end 29,480 29,480 (29,480)
Nelles Road − River Rd east to end 8,800 8,800 (8,800)
Gowland Road − stub north of Road 9 5,500 5,500 (5,500)
Conc 4 Rainham − Road 12 to Road 8 80,300 80,300 (80,300)
River Rd − S. Cay Rd to Hald−Dunn Townline 63,800 63,800 (63,800)
Conc 9 Walpole, Hald Rd 18 to Cheapside Rd 73,800 221,400 295,200 (295,200)
Ramsey Road − stub west of Johnson Road 7,040 7,040 (7,040)
Townline Road E − Windecker to Hwy 56 55,000 55,000 (55,000)
Singer Road − Road 9 to end 9,460 9,460 (9,460)
Ramsey Road − stub east of Johnson 13,640 13,640 (13,640)
Conc 4 − Stoney Creek Rd to Road 56 315,000 49,060 364,060 (364,060)
Nelles Road − York Road to river 10,560 10,560 (10,560)
Conc 10 Walpole − Hwy 6 to Sandusk Rd 230,000 36,520 266,520 (266,520)
Conc 4 Rainham − Road 8 to Road 20 142,100 53,900 196,000 (196,000)
Old River Road − Road 17 to Road 17 13,200 13,200 (13,200)
Brooks Road − Indiana Rd to end 44,800 7,260 52,060 (52,060)
Conc 2 Road S − Road 32 to Junction Rd 147,000 142,100 53,900 343,000 (343,000)
Wainfleet Line − Hwy 3 to Poth Rd 270,000 261,000 99,000 630,000 (630,000)
4th Line Oneida − Broad Rd to end 44,400 42,920 16,280 103,600 (103,600)
Broad Road − 4th Line to River Rd 177,600 171,680 65,120 414,400 (414,400)
Decewsville Rd − Townline Rd to village 84,000 81,200 30,800 196,000 (196,000)
Townline Rd W − River Rd to end 8,000 24,000 23,200 8,800 64,000 (64,000)
Townline Rd E − Rd 54 to Brooks Rd 168,000 162,400 61,600 392,000 (392,000)
Townline Rd W − Dry Lake to Road 20 66,400 199,200 192,560 73,040 531,200 (531,200)
Townline Rd W − Dry Lake to River Rd 102,400 307,200 296,960 112,640 819,200 (819,200)
Townline Rd E − River to Road 54 48,000 46,400 17,600 112,000 (112,000)
York Road − Road 9 to McKenzie Rd 68,000 204,000 197,200 74,800 544,000 (544,000)
Crown Road − Hwy 3 to Aiken Rd 56,000 168,000 162,400 61,600 448,000 (448,000)
Hines Road − Hutchinson to Comfort Rd 32,200 96,600 93,380 35,420 257,600 (257,600)
Bartlett Road − stub west of Hines Rd 10,000 30,000 29,000 11,000 80,000 (80,000)
Hines Road − McLaughlin to Comfort Rd 41,000 123,000 118,900 45,100 328,000 (328,000)
Indiana Rd W − Road 9 to 3rd Line 55,000 165,000 159,500 60,500 440,000 (440,000)
Conc 2 Rd S − Junction to Hald−Dunn Townline 25,600 76,800 74,240 28,160 204,800 (204,800)
Ramsey Rd − stub west of Marshall Rd 30,400 91,200 88,160 33,440 243,200 (243,200)
Marshall Road − stub south of Kings Row 8,800 26,400 25,520 9,680 70,400 (70,400)
Haldimand Tract − Haldimand Trail to end 13,000 39,000 37,700 14,300 104,000 (104,000)
2013 2014 2015 2016 2017 2018 2019 2020 2021 2022 Total
Expenditures
Grants
Subsidies
External
Financing
Development
Charges
Rsve Funds
Federal
Gas Tax
Rsve Fund
Reserves/
Reserve
Funds
Debenture
Financing
Draft Budget Haldimand County
2013 to 2022 DRAFT TAX SUPPORTED CAPITAL FORECAST
Version:
Division: Gravel Road Conversion
Note: (W) Water; (WW) Wastewater; (SS) Storm Sewer; (R) Roads35

Conc 10 Walpole − Road 20 to Cheapside Rd 44,800 134,400 129,920 49,280 358,400 (358,400)
3rd Line Oneida − Road 9 to Indiana Rd 41,000 123,000 118,900 45,100 328,000 (328,000)
Jenny Jump Rd − stub east of Crown Rd 18,000 54,000 52,200 19,800 144,000 (144,000)
Jenny Jump Rd − Bird Rd to Crown Rd 33,400 100,200 96,860 36,740 267,200 (267,200)
Conc 10 Walpole − Sandusk to Cheapside 73,000 219,000 211,700 80,300 584,000 (584,000)
Abbey Road − Road 66 north to end 11,400 34,200 33,060 78,660 (78,660)
Stoneman Rd − Road 66 to Road 54 40,600 121,800 117,740 280,140 (280,140)
Abbey Rd − Haldibrook south to end 7,000 21,000 20,300 48,300 (48,300)
Conc 9 Walpole, Cheapside Rd to Hald Rd 53 73,000 219,000 292,000 (292,000)
Gibson Rd, Link Rd to end 3,600 10,800 14,400 (14,400)
Wilson Rd, Hald Rd 20 South to end 9,000 27,000 36,000 (36,000)
Conc 8 Walpole, Cheapside Rd to Sandusk 74,400 223,200 297,600 (297,600)
Wilson Rd, Hald Rd 20 North to end 5,000 15,000 20,000 (20,000)
Singer Rd, Indiana Rd to end 5,000 15,000 20,000 (20,000)
Dunnville Townline Rd, Caistorville Rd to Hwy 3 57,800 173,400 231,200 (231,200)
Conc 8 Rainham − Rd 53 to Rd 20 59,600 178,800 238,400 (238,400)
Wilson Rd − Bains Rd north to end 5,600 16,800 22,400 (22,400)
Swayze Rd − Hart Rd to Moote Rd 16,400 49,200 65,600 (65,600)
Conc 9 Wal − Hwy 6 to Hald Rd 18 64,000 192,000 256,000 (256,000)
Townline Rd E − Hwy 56 to Junction Rd 53,000 159,000 212,000 (212,000)
Conc 1 Seneca − Hwy 56 to Singer Rd 48,000 48,000 (48,000)
Total New/Enhanced Service 1,183,600 1,845,120 1,312,320 646,980 621,600 819,480 1,008,120 1,066,140 1,278,420 1,856,540 11,638,320 (11,638,320)
Total Gravel Road Conversion 1,183,600 1,845,120 1,312,320 646,980 621,600 819,480 1,008,120 1,066,140 1,278,420 1,856,540 11,638,320 (11,638,320)
2013 2014 2015 2016 2017 2018 2019 2020 2021 2022 Total
Expenditures
Grants
Subsidies
External
Financing
Development
Charges
Rsve Funds
Federal
Gas Tax
Rsve Fund
Reserves/
Reserve
Funds
Debenture
Financing
Draft Budget Haldimand County
2013 to 2022 DRAFT TAX SUPPORTED CAPITAL FORECAST
Version:
Division: Gravel Road Conversion
Note: (W) Water; (WW) Wastewater; (SS) Storm Sewer; (R) Roads36

Municipal Drains
Municipal Drains Maintenance
Replacement/State of Good Repair
McNichol Maintenance (Drn Mtc Pgm) 20,400 20,400 (14,420) (5,980)
Babiy Maintenance (Drn Mtc Pgm) 23,500 23,500 (22,650) (850)
Barry Maintenance (Drn Mtc Pgm) 25,500 25,500 (21,450) (4,050)
Sugar Creek Maintenance (Drn Mtc Pgm) 40,700 40,700 (38,170) (2,530)
Siddal Maintenance (Drn Mtc Pgm) 21,400 21,400 (20,180) (1,220)
Holtrop Maintenance (Drn Mtc Pgm) 15,300 15,300 (15,280) (20)
Allen Maintenance (Drn Mtc Pgm) 7,200 7,200 (7,200)
Moulton Station Maintenance (Drn Mtc Pgm) 17,300 17,300 (17,300)
Fred Buckner Maintenance (Drn Mtc Pgm) 25,500 25,500 (19,430) (6,070)
Buckner Maintenance (Drn Mtc Pgm) 22,400 22,400 (20,240) (2,160)
Broad Creek Maintenance (Drn Mtc Pgm) 33,600 33,600 (31,560) (2,040)
Lindsay Maintenance (Drn Mtc Pgm) 23,500 23,500 (19,510) (3,990)
Niece Maintenance (Drn Mtc Pgm) 16,300 16,300 (4,890) (11,410)
Stonehaven Maintenance (Drn Mtc Pgm) 5,800 5,800 (5,620) (180)
Horseshoe Bay Maintenance (Drn Mtc Pgm) 5,100 5,100 (4,000) (1,100)
Boyt Maintenance (Drn Mtc Pgm) 4,100 4,100 (2,400) (1,700)
James Maintenance (Drn Mtc Pgm) 66,200 66,200 (60,460) (5,740)
Waines Maintenance (Drn Mtc Pgm) 30,600 30,600 (30,070) (530)
Baker Main Maintenance (Drn Mtc Pgm) 25,500 25,500 (24,960) (540)
Sweets Corners Maintenance (Drn Mtc Pgm) 63,100 63,100 (18,730) (44,370)
Townline Br. of the Black Crk Maint (Drn Mtc Pgm) 12,300 12,300 (9,460) (2,840)
Michener #1 Maintenance (Drn Mtc Pgm) 22,400 22,400 (14,750) (7,650)
Michener Main Maintenance (Drn Mtc Pgm) 20,400 20,400 (18,730) (1,670)
Ordnance Reserve Maintenance (Drn Mtc Pgm) 42,200 42,200 (11,220) (30,980)
King Branch 1 & 2 Maintenance (Drn Mtc Pgm) 37,700 37,700 (29,490) (8,210)
Black Creek Maintenance (Drn Mtc Pgm) 66,200 66,200 (55,710) (10,490)
Baker East Maintenance (Drn Mtc Pgm) 22,400 22,400 (21,190) (1,210)
Baker West Maintenance (Drn Mtc Pgm 24,500 24,500 (23,170) (1,330)
Sixth Concession Maintenance (Drn Mtc Pgm) 40,800 40,800 (38,450) (2,350)
Weikman Maintenance (Drn Mtc Pgm) 26,500 26,500 (12,690) (13,810)
Seneca Greens Maintenance (Drn Mtc Pgm) 1,900 1,900 (1,520) (380)
Anderson Maintenance (Drn Mtc Pgm) 8,400 8,400 (6,720) (1,680)
Harrop Maintenance (Drn Mtc Pgm) 97,700 97,700 (82,340) (15,360)
Hunter Maintenance (Drn Mtc Pgm) 11,200 11,200 (8,960) (2,240)
Lundy Maintenance (Drn Mtc Pgm) 26,500 26,500 (21,200) (5,300)
North Forks Maintenance (Drn Mtc Pgm) 77,400 77,400 (61,920) (15,480)
2013 2014 2015 2016 2017 2018 2019 2020 2021 2022 Total
Expenditures
Grants
Subsidies
External
Financing
Development
Charges
Rsve Funds
Federal
Gas Tax
Rsve Fund
Reserves/
Reserve
Funds
Debenture
Financing
Draft Budget Haldimand County
2013 to 2022 DRAFT TAX SUPPORTED CAPITAL FORECAST
Version:
Division: Municipal Drains
Note: (W) Water; (WW) Wastewater; (SS) Storm Sewer; (R) Roads 37

South Forks Maintenance (Drn Mtc Pgm) 32,600 32,600 (26,080) (6,520)
Maple Creek Maintenance (Drn Mtc Pgm) 98,800 98,800 (79,040) (19,760)
Maple Creek Dunn Branch Maint (Drn Mtc Pgm) 16,300 16,300 (13,040) (3,260)
Bravin Maintenance (Drn Mtc Pgm) 40,800 40,800 (37,820) (2,980)
Chrysler Maintenance (Drn Mtc Pgm) 23,500 23,500 (21,010) (2,490)
Deamude Maintenance (Drn Mtc Pgm) 23,500 23,500 (18,800) (4,700)
West Kelly Maintenance (Drn Mtc Pgm) 61,100 61,100 (56,810) (4,290)
Byers Maintenance (Drn Mtc Pgm) 14,300 14,300 (11,440) (2,860)
Girling Maintenance (Drn Mtc Pgm) 4,100 4,100 (3,280) (820)
Pat Warren Maintenance (Drn Mtc Pgm) 21,400 21,400 (17,120) (4,280)
Boulton Maintenance (Drn Mtc Pgm) 14,300 14,300 (11,440) (2,860)
Ellsworth Maintenance (Drn Mtc Pgm) 30,600 30,600 (27,480) (3,120)
Furry Maintenance (Drn Mtc Pgm) 45,800 45,800 (38,550) (7,250)
Mackeigan Maintenance (Drn Mtc Pgm) 9,100 9,100 (7,280) (1,820)
Tweed Maintenance (Drn Mtc Pgm) 47,900 47,900 (43,680) (4,220)
Hoover Creek Maintenance (Drn Mtc Pgm) 39,700 39,700 (31,760) (7,940)
Wolf Creek Maintenance (Drn Mtc Pgm) 9,200 9,200 (7,360) (1,840)
Crow Road Maintenance (Drn Mtc Pgm) 17,300 17,300 (13,840) (3,460)
East Kelly Maintenance (Drn Mtc Pgm) 28,500 28,500 (22,800) (5,700)
Chalmers Dickout Maintenance (Drn Mtc Pgm) 31,600 31,600 (17,940) (13,660)
H.E. Dickout Maintenance (Drn Mtc Pgm) 22,400 22,400 (15,130) (7,270)
Bouck & Moyer Maintenance (Drn Mtc Pgm) 50,900 50,900 (43,550) (7,350)
Brown Maintenance (Drn Mtc Pgm) 20,400 20,400 (18,440) (1,960)
Boorsma Maintenance (Drn Mtc Pgm) 16,300 16,300 (15,030) (1,270)
Charles Angle Maintenance (Drn Mtc Pgm) 8,200 8,200 (6,900) (1,300)
Felgner Maintenance (Drn Mtc Pgm) 9,900 9,900 (7,920) (1,980)
Harvey Maintenance (Drn Mtc Pgm) 12,300 12,300 (9,840) (2,460)
Jones Maintenance (Drn Mtc Pgm) 6,200 6,200 (4,960) (1,240)
Farr Maintenance (Drn Mtc Pgm) 12,300 12,300 (9,840) (2,460)
Dent Maintenance (Drn Mtc Pgm) 46,900 46,900 (43,840) (3,060)
Chick Hartnett Maintenance (Drn Mtc Pgm) 35,700 35,700 (34,510) (1,190)
Hartnett Branch #1 Maintenance (Drn Mtc Pgm) 11,200 11,200 (10,920) (280)
Hartnett Branch #2 Maintenance (Drn Mtc Pgm) 8,100 8,100 (7,890) (210)
Hartnett Main Maintenance (Drn Mtc Pgm) 17,300 17,300 (16,870) (430)
Chick Main Maintenance (Drn Mtc Pgm) 16,300 16,300 (15,750) (550)
Chick Branch #1 Maintenance (Drn Mtc Pgm) 8,600 8,600 (8,310) (290)
Chick Branch #2 Maintenance (Drn Mtc Pgm) 8,400 8,400 (8,120) (280)
North Hutchinson N. Maintenance (Drn Mtc Pgm) 14,300 14,300 (11,730) (2,570)
North Hutchinson S Maintenance (Drn Mtc Pgm) 17,300 17,300 (13,130) (4,170)
2013 2014 2015 2016 2017 2018 2019 2020 2021 2022 Total
Expenditures
Grants
Subsidies
External
Financing
Development
Charges
Rsve Funds
Federal
Gas Tax
Rsve Fund
Reserves/
Reserve
Funds
Debenture
Financing
Draft Budget Haldimand County
2013 to 2022 DRAFT TAX SUPPORTED CAPITAL FORECAST
Version:
Division: Municipal Drains
Note: (W) Water; (WW) Wastewater; (SS) Storm Sewer; (R) Roads 38

South Hutchinson Maintenance (Drn Mtc Pgm) 26,500 26,500 (19,180) (7,320)
Jarvis 1 Maintenance (Drn Mtc Pgm) 51,900 51,900 (36,010) (15,890)
Jarvis 2 Maintenance (Drn Mtc Pgm) 29,600 29,600 (23,680) (5,920)
Total Replacement/State of Good Repair 213,000 246,500 167,300 242,400 225,100 245,200 171,300 117,300 128,100 336,700 2,092,900 (1,704,160) (388,740)
Total Municipal Drains Maintenance 213,000 246,500 167,300 242,400 225,100 245,200 171,300 117,300 128,100 336,700 2,092,900 (1,704,160) (388,740)
Municipal Drains Construction
Replacement/State of Good Repair
Seneca Greens 45,000 45,000 (34,000) (11,000)
Total Replacement/State of Good Repair 45,000 45,000 (34,000) (11,000)
New/Enhanced Service
Middaugh Drain Phase 1 − Construction 157,730 157,730 (141,950) (15,780)
Middaugh Drain Phase 2 − Construction 101,760 101,760 (91,580) (10,180)
Total New/Enhanced Service 157,730 101,760 259,490 (233,530) (25,960)
Total Municipal Drains Construction 45,000 157,730 101,760 304,490 (267,530) (36,960)
Total Municipal Drains 258,000 404,230 269,060 242,400 225,100 245,200 171,300 117,300 128,100 336,700 2,397,390 (1,971,690) (425,700)
2013 2014 2015 2016 2017 2018 2019 2020 2021 2022 Total
Expenditures
Grants
Subsidies
External
Financing
Development
Charges
Rsve Funds
Federal
Gas Tax
Rsve Fund
Reserves/
Reserve
Funds
Debenture
Financing
Draft Budget Haldimand County
2013 to 2022 DRAFT TAX SUPPORTED CAPITAL FORECAST
Version:
Division: Municipal Drains
Note: (W) Water; (WW) Wastewater; (SS) Storm Sewer; (R) Roads 39

ENVIRONMENTAL SERVICES
40

Environmental Services
Storm Sewer Maintenance 486,000 1,363,000 130,000 160,000 711,000 1,760,000 1,130,000 430,000 160,000 130,000 6,460,000 (1,586,700) (4,873,300)
Waste Administration 21,000 7,700 550 1,000 22,000 52,250 (11,600) (40,650)
Waste Reduction Program 570,000 570,000 (570,000)
Waste Disposal Sites 557,000 6,005,000 786,000 75,000 135,000 197,000 85,000 185,000 130,000 95,000 8,250,000 (1,284,300) (2,380,000) (4,585,700)
Total Environmental Services 1,043,000 7,368,000 937,000 242,700 846,550 2,527,000 1,215,000 616,000 312,000 225,000 15,332,250 (1,295,900) (1,586,700) (2,380,000) (10,069,650)
2013 2014 2015 2016 2017 2018 2019 2020 2021 2022 Total
Expenditures
Grants
Subsidies
External
Financing
Development
Charges
Rsve Funds
Federal
Gas Tax
Rsve Fund
Reserves/
Reserve
Funds
Debenture
Financing
Draft Budget Haldimand County2013 to 2022 DRAFT TAX SUPPORTED CAPITAL FORECAST
Version:
Environmental Services
Note: (W) Water; (WW) Wastewater; (SS) Storm Sewer; (R) Roads41
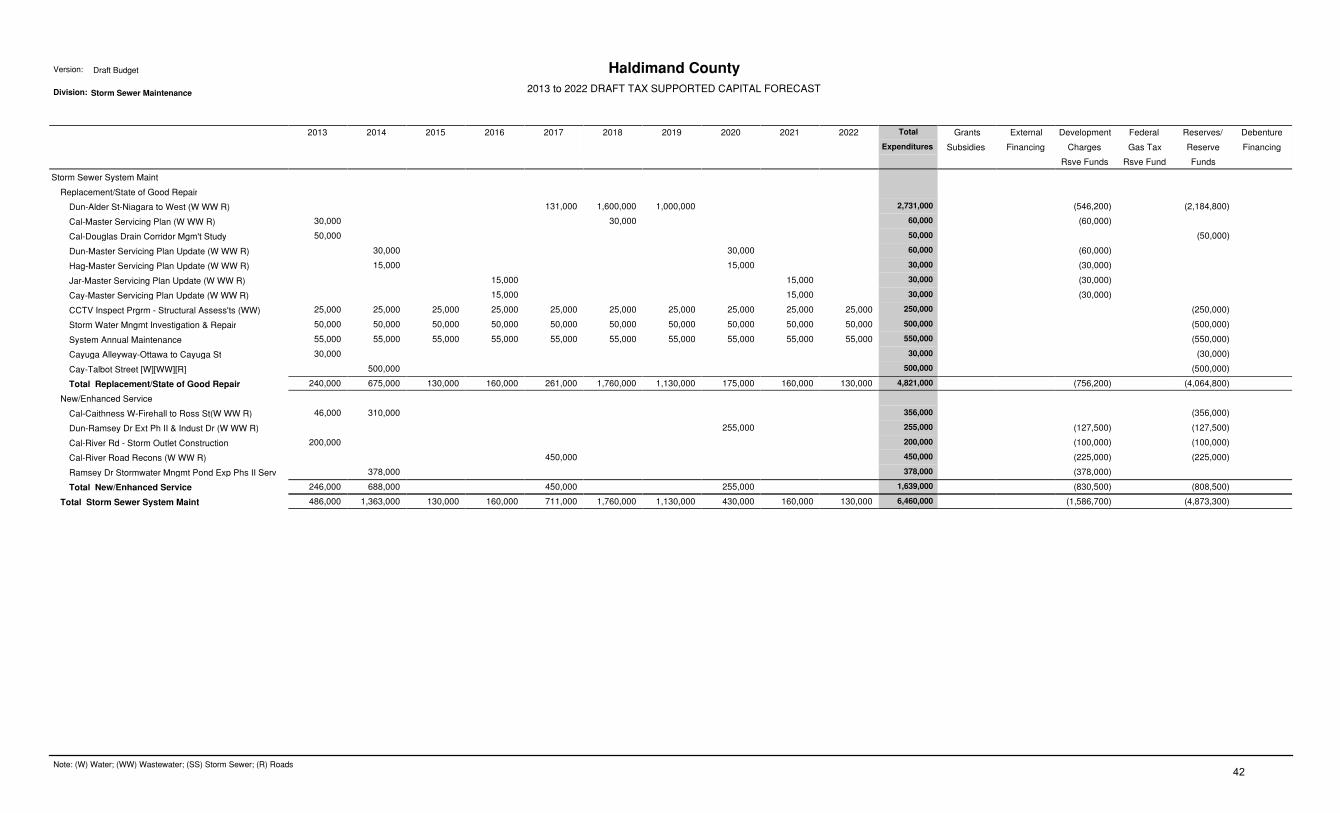
Storm Sewer System Maint
Replacement/State of Good Repair
Dun−Alder St−Niagara to West (W WW R) 131,000 1,600,000 1,000,000 2,731,000 (546,200) (2,184,800)
Cal−Master Servicing Plan (W WW R) 30,000 30,000 60,000 (60,000)
Cal−Douglas Drain Corridor Mgm’t Study 50,000 50,000 (50,000)
Dun−Master Servicing Plan Update (W WW R) 30,000 30,000 60,000 (60,000)
Hag−Master Servicing Plan Update (W WW R) 15,000 15,000 30,000 (30,000)
Jar−Master Servicing Plan Update (W WW R) 15,000 15,000 30,000 (30,000)
Cay−Master Servicing Plan Update (W WW R) 15,000 15,000 30,000 (30,000)
CCTV Inspect Prgrm − Structural Assess’ts (WW) 25,000 25,000 25,000 25,000 25,000 25,000 25,000 25,000 25,000 25,000 250,000 (250,000)
Storm Water Mngmt Investigation & Repair 50,000 50,000 50,000 50,000 50,000 50,000 50,000 50,000 50,000 50,000 500,000 (500,000)
System Annual Maintenance 55,000 55,000 55,000 55,000 55,000 55,000 55,000 55,000 55,000 55,000 550,000 (550,000)
Cayuga Alleyway−Ottawa to Cayuga St 30,000 30,000 (30,000)
Cay−Talbot Street [W][WW][R] 500,000 500,000 (500,000)
Total Replacement/State of Good Repair 240,000 675,000 130,000 160,000 261,000 1,760,000 1,130,000 175,000 160,000 130,000 4,821,000 (756,200) (4,064,800)
New/Enhanced Service
Cal−Caithness W−Firehall to Ross St(W WW R) 46,000 310,000 356,000 (356,000)
Dun−Ramsey Dr Ext Ph II & Indust Dr (W WW R) 255,000 255,000 (127,500) (127,500)
Cal−River Rd − Storm Outlet Construction 200,000 200,000 (100,000) (100,000)
Cal−River Road Recons (W WW R) 450,000 450,000 (225,000) (225,000)
Ramsey Dr Stormwater Mngmt Pond Exp Phs II Serv 378,000 378,000 (378,000)
Total New/Enhanced Service 246,000 688,000 450,000 255,000 1,639,000 (830,500) (808,500)
Total Storm Sewer System Maint 486,000 1,363,000 130,000 160,000 711,000 1,760,000 1,130,000 430,000 160,000 130,000 6,460,000 (1,586,700) (4,873,300)
2013 2014 2015 2016 2017 2018 2019 2020 2021 2022 Total
Expenditures
Grants
Subsidies
External
Financing
Development
Charges
Rsve Funds
Federal
Gas Tax
Rsve Fund
Reserves/
Reserve
Funds
Debenture
Financing
Draft Budget Haldimand County
2013 to 2022 DRAFT TAX SUPPORTED CAPITAL FORECAST
Version:
Division: Storm Sewer Maintenance
Note: (W) Water; (WW) Wastewater; (SS) Storm Sewer; (R) Roads42

Version: Draft
Division: Waste Summary
2013 2014 2015 2016 2017 2018 2019 2020 2021 2022 Total Grants External Development Federal Reserves/ Debenture
Expenditures Subsidies Financing Charges Gas Tax Reserve Financing
Rsve Funds Rsve Fund Funds
Waste Summary
Waste Administration 21,000 7,700 550 1,000 22,000 52,250 (11,600) (40,650)
Waste Reduction Program 570,000 570,000 (570,000)
Waste Disposal Sites 557,000 6,005,000 786,000 75,000 135,000 197,000 85,000 185,000 130,000 95,000 8,250,000 (1,284,300) (2,380,000) (4,585,700)
Total Waste 557,000 6,005,000 807,000 82,700 135,550 767,000 85,000 186,000 152,000 95,000 8,872,250 (1,295,900) 0 (2,380,000) (5,196,350)
Haldimand County 2013 to 2022 DRAFT TAX SUPPORTED CAPITAL FORECAST
43

Waste Administration
Replacement/State of Good Repair
Landfill Operations − Transition Plan 20,000 20,000 (11,600) (8,400)
Servers (SCADA) 6,200 6,200 12,400 (12,400)
Desktops (SCADA) 1,300 1,300 2,600 (2,600)
Connectivity Equipment (SCADA) 550 550 (550)
Printers (SCADA) 200 200 400 (400)
Software (SCADA) 1,000 1,000 14,300 16,300 (16,300)
Total Replacement/State of Good Repair 21,000 7,700 550 1,000 22,000 52,250 (11,600) (40,650)
Total Waste Administration 21,000 7,700 550 1,000 22,000 52,250 (11,600) (40,650)
2013 2014 2015 2016 2017 2018 2019 2020 2021 2022 Total
Expenditures
Grants
Subsidies
External
Financing
Development
Charges
Rsve Funds
Federal
Gas Tax
Rsve Fund
Reserves/
Reserve
Funds
Debenture
Financing
Draft Budget Haldimand County
2013 to 2022 DRAFT TAX SUPPORTED CAPITAL FORECAST
Version:
Division: Waste Administration
Note: (W) Water; (WW) Wastewater; (SS) Storm Sewer; (R) Roads44
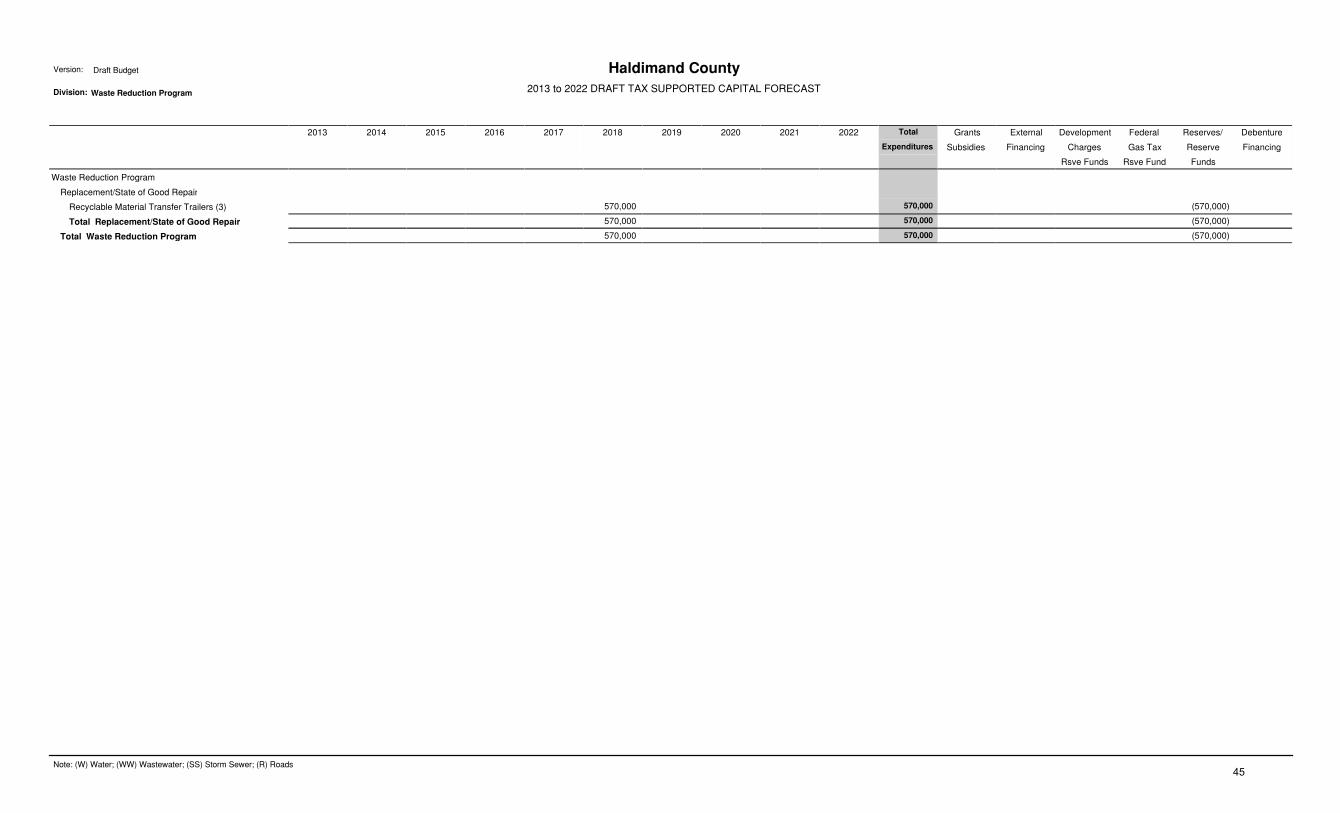
Waste Reduction Program
Replacement/State of Good Repair
Recyclable Material Transfer Trailers (3) 570,000 570,000 (570,000)
Total Replacement/State of Good Repair 570,000 570,000 (570,000)
Total Waste Reduction Program 570,000 570,000 (570,000)
2013 2014 2015 2016 2017 2018 2019 2020 2021 2022 Total
Expenditures
Grants
Subsidies
External
Financing
Development
Charges
Rsve Funds
Federal
Gas Tax
Rsve Fund
Reserves/
Reserve
Funds
Debenture
Financing
Draft Budget Haldimand County
2013 to 2022 DRAFT TAX SUPPORTED CAPITAL FORECAST
Version:
Division: Waste Reduction Program
Note: (W) Water; (WW) Wastewater; (SS) Storm Sewer; (R) Roads45

Waste Disposal Sites
Canborough
Replacement/State of Good Repair
Canborourgh WMF − Leachate Line Repair 10,000 10,000 (5,800) (4,200)
Waste Mgmt Facility Repairs 30,000 30,000 30,000 30,000 30,000 30,000 30,000 30,000 240,000 (240,000)
Total Replacement/State of Good Repair 10,000 30,000 30,000 30,000 30,000 30,000 30,000 30,000 30,000 250,000 (5,800) (244,200)
New/Enhanced Service
Waste Trsf Fac−Design/Contract Admin 200,000 200,000 (200,000)
Waste Transfer Station Development 5,350,000 5,350,000 (2,380,000) (2,970,000)
Waste Transfer Station Upgrades 25,000 100,000 125,000 (125,000)
Total New/Enhanced Service 200,000 5,350,000 25,000 100,000 5,675,000 (2,380,000) (3,295,000)
Total Canborough 210,000 5,350,000 30,000 30,000 30,000 55,000 30,000 130,000 30,000 30,000 5,925,000 (5,800) (2,380,000) (3,539,200)
Canborough Perpetual Care
Replacement/State of Good Repair
Final Cover System 10,000 10,000 10,000 10,000 10,000 10,000 10,000 10,000 80,000 (46,400) (33,600)
Leachate Management System 15,000 15,000 30,000 (17,400) (12,600)
Ground Water Monitoring−Well Repl 5,000 5,000 5,000 5,000 5,000 5,000 5,000 5,000 40,000 (23,200) (16,800)
General Maintenance 300,000 10,000 10,000 10,000 10,000 10,000 10,000 10,000 370,000 (214,600) (155,400)
Total Replacement/State of Good Repair 315,000 25,000 25,000 40,000 25,000 25,000 40,000 25,000 520,000 (301,600) (218,400)
Total Canborough Perpetual Care 315,000 25,000 25,000 40,000 25,000 25,000 40,000 25,000 520,000 (301,600) (218,400)
Tom Howe
Replacement/State of Good Repair
Final Grading and Seeding 350,000 350,000 (202,200) (147,800)
Surface Emission Sweep−Odour Remediation 50,000 50,000 (28,900) (21,100)
Final Cover 170,000 170,000 (98,200) (71,800)
LFG(landfill gas) Flare Shell/Insulation 22,000 22,000 (12,700) (9,300)
LFG Flare CT Pump 10,000 10,000 (5,800) (4,200)
LFG System TSSA 36,000 36,000 (20,800) (15,200)
Leachate Manhole Repairs 125,000 125,000 250,000 (144,400) (105,600)
Total Replacement/State of Good Repair 327,000 125,000 436,000 888,000 (513,000) (375,000)
New/Enhanced Service
LFG Collection System − Phase 3 Tom Howe 525,000 525,000 (303,300) (221,700)
Total New/Enhanced Service 525,000 525,000 (303,300) (221,700)
Total Tom Howe 327,000 650,000 436,000 1,413,000 (816,300) (596,700)
Tom Howe Perpetual Care
Replacement/State of Good Repair
Final Cover System 10,000 10,000 10,000 10,000 10,000 10,000 60,000 (34,800) (25,200)
LFG Collection and Flaring System 10,000 10,000 (5,800) (4,200)
2013 2014 2015 2016 2017 2018 2019 2020 2021 2022 Total
Expenditures
Grants
Subsidies
External
Financing
Development
Charges
Rsve Funds
Federal
Gas Tax
Rsve Fund
Reserves/
Reserve
Funds
Debenture
Financing
Draft Budget Haldimand County
2013 to 2022 DRAFT TAX SUPPORTED CAPITAL FORECAST
Version:
Division: Waste Disposal Sites
Note: (W) Water; (WW) Wastewater; (SS) Storm Sewer; (R) Roads46

Leachate Management System 30,000 30,000 60,000 (34,800) (25,200)
Ground Water Monitoring−Well Repl 5,000 5,000 5,000 5,000 5,000 5,000 5,000 35,000 (20,300) (14,700)
General Maintenance 10,000 10,000 10,000 10,000 10,000 10,000 10,000 70,000 (40,600) (29,400)
LFG Burner Tips 24,000 24,000 (13,900) (10,100)
LFG Flare VFD 18,000 18,000 (10,400) (7,600)
Total Replacement/State of Good Repair 15,000 25,000 97,000 25,000 25,000 55,000 35,000 277,000 (160,600) (116,400)
Total Tom Howe Perpetual Care 15,000 25,000 97,000 25,000 25,000 55,000 35,000 277,000 (160,600) (116,400)
Perpetual Site Care−Other Sites
Replacement/State of Good Repair
Monitoring Well Install’n and Data Managm’t 5,000 5,000 5,000 5,000 5,000 5,000 5,000 5,000 5,000 5,000 50,000 (50,000)
Total Replacement/State of Good Repair 5,000 5,000 5,000 5,000 5,000 5,000 5,000 5,000 5,000 5,000 50,000 (50,000)
New/Enhanced Service
Security Fence − Peebles Landfill 50,000 50,000 (50,000)
Observation Well − Oneida 15,000 15,000 (15,000)
Total New/Enhanced Service 15,000 50,000 65,000 (65,000)
Total Perpetual Site Care−Other Sites 20,000 5,000 5,000 5,000 55,000 5,000 5,000 5,000 5,000 5,000 115,000 (115,000)
Total Waste Disposal Sites 557,000 6,005,000 786,000 75,000 135,000 197,000 85,000 185,000 130,000 95,000 8,250,000 (1,284,300) (2,380,000) (4,585,700)
2013 2014 2015 2016 2017 2018 2019 2020 2021 2022 Total
Expenditures
Grants
Subsidies
External
Financing
Development
Charges
Rsve Funds
Federal
Gas Tax
Rsve Fund
Reserves/
Reserve
Funds
Debenture
Financing
Draft Budget Haldimand County
2013 to 2022 DRAFT TAX SUPPORTED CAPITAL FORECAST
Version:
Division: Waste Disposal Sites
Note: (W) Water; (WW) Wastewater; (SS) Storm Sewer; (R) Roads47
HEALTH SERVICES
48

Health Services
Land Ambulance Services 1,628,600 114,000 54,000 53,000 163,250 184,000 56,000 44,000 39,000 173,000 2,508,850 (147,000) (169,120) (1,153,240) (1,039,490)
Cemeteries 22,000 215,800 220,000 91,000 65,000 35,000 10,000 35,000 10,000 35,000 738,800 (437,220) (301,580)
Total Health Services 1,650,600 329,800 274,000 144,000 228,250 219,000 66,000 79,000 49,000 208,000 3,247,650 (147,000) (606,340) (1,454,820) (1,039,490)
2013 2014 2015 2016 2017 2018 2019 2020 2021 2022 Total
Expenditures
Grants
Subsidies
External
Financing
Development
Charges
Rsve Funds
Federal
Gas Tax
Rsve Fund
Reserves/
Reserve
Funds
Debenture
Financing
Draft Budget Haldimand County2013 to 2022 DRAFT TAX SUPPORTED CAPITAL FORECAST
Version:
Health Services
Note: (W) Water; (WW) Wastewater; (SS) Storm Sewer; (R) Roads49

Land Ambulance Services
Land Ambulance Services
Replacement/State of Good Repair
Land Ambulance − Med. Equip’t Replacm’t 12,000 12,000 12,000 12,000 12,000 12,000 12,000 12,000 12,000 12,000 120,000 (120,000)
Defibrillator Replacment 120,000 120,000 120,000 120,000 480,000 (480,000)
Paramedic PPE Replacement 40,000 40,000 (40,000)
Furniture/Appliances−Replacement 2,000 2,000 2,000 2,000 2,000 2,000 2,000 2,000 2,000 2,000 20,000 (20,000)
Stretcher Replacement 25,000 18,750 25,000 68,750 (68,750)
Stairchair Replacement 14,000 10,500 14,000 38,500 (38,500)
Public Access Automated External Defibrillator 50,000 42,000 30,000 25,000 147,000 (147,000)
Total Replacement/State of Good Repair 134,000 14,000 54,000 53,000 163,250 184,000 56,000 44,000 39,000 173,000 914,250 (147,000) (767,250)
New/Enhanced Service
Electronic Patient Care Reporting System 100,000 100,000 (100,000)
Total New/Enhanced Service 100,000 100,000 (100,000)
Total Land Ambulance Services 134,000 114,000 54,000 53,000 163,250 184,000 56,000 44,000 39,000 173,000 1,014,250 (147,000) (867,250)
Hagersville Ambulance Base
New/Enhanced Service
EMS Base−Hagersville 814,800 814,800 (92,200) (155,910) (566,690)
Total New/Enhanced Service 814,800 814,800 (92,200) (155,910) (566,690)
Total Hagersville Ambulance Base 814,800 814,800 (92,200) (155,910) (566,690)
Cayuga Ambulance Base
New/Enhanced Service
EMS Base−Cayuga 679,800 679,800 (76,920) (130,080) (472,800)
Total New/Enhanced Service 679,800 679,800 (76,920) (130,080) (472,800)
Total Cayuga Ambulance Base 679,800 679,800 (76,920) (130,080) (472,800)
Total Land Ambulance Services 1,628,600 114,000 54,000 53,000 163,250 184,000 56,000 44,000 39,000 173,000 2,508,850 (147,000) (169,120) (1,153,240) (1,039,490)
2013 2014 2015 2016 2017 2018 2019 2020 2021 2022 Total
Expenditures
Grants
Subsidies
External
Financing
Development
Charges
Rsve Funds
Federal
Gas Tax
Rsve Fund
Reserves/
Reserve
Funds
Debenture
Financing
Draft Budget Haldimand County
2013 to 2022 DRAFT TAX SUPPORTED CAPITAL FORECAST
Version:
Division: Land Ambulance Services
Note: (W) Water; (WW) Wastewater; (SS) Storm Sewer; (R) Roads 50

Cemeteries
Cemeteries Administration
Replacement/State of Good Repair
Cemetery & Headstone Restoration 10,000 10,000 10,000 10,000 10,000 10,000 10,000 10,000 10,000 10,000 100,000 (100,000)
Total Replacement/State of Good Repair 10,000 10,000 10,000 10,000 10,000 10,000 10,000 10,000 10,000 10,000 100,000 (100,000)
New/Enhanced Service
Cem. Dev’t (surve’g, walk’ys, lands’g, etc.) 25,000 25,000 25,000 25,000 100,000 (100,000)
Total New/Enhanced Service 25,000 25,000 25,000 25,000 100,000 (100,000)
Total Cemeteries Administration 10,000 10,000 10,000 35,000 10,000 35,000 10,000 35,000 10,000 35,000 200,000 (200,000)
Caledonia Cemeteries
Replacement/State of Good Repair
Cemetery Building − Doors & Windows 5,000 5,000 (5,000)
Cemetery Building − Replace Roof 6,000 6,000 (6,000)
Total Replacement/State of Good Repair 11,000 11,000 (11,000)
New/Enhanced Service
Iron Fencing Bordering Cemetery 12,000 12,000 (12,000)
Construction of New Section 89,800 150,000 56,000 30,000 325,800 (293,220) (32,580)
Total New/Enhanced Service 12,000 89,800 150,000 56,000 30,000 337,800 (293,220) (44,580)
Total Caledonia Cemeteries 12,000 100,800 150,000 56,000 30,000 348,800 (293,220) (55,580)
Hagersville Cemeteries
Replacement/State of Good Repair
Building − Replace Roof 5,000 5,000 (5,000)
Total Replacement/State of Good Repair 5,000 5,000 (5,000)
New/Enhanced Service
Columbarium & Pathways 50,000 50,000 (45,000) (5,000)
Survey, Layout, Drainage 25,000 25,000 (25,000)
Total New/Enhanced Service 50,000 25,000 75,000 (45,000) (30,000)
Total Hagersville Cemeteries 55,000 25,000 80,000 (45,000) (35,000)
Cayuga Cemeteries
New/Enhanced Service
Columbarium & Pathways 60,000 60,000 (54,000) (6,000)
Total New/Enhanced Service 60,000 60,000 (54,000) (6,000)
Total Cayuga Cemeteries 60,000 60,000 (54,000) (6,000)
Dunnville Cemeteries
New/Enhanced Service
Woodlawn − Columbarium & Pathways 50,000 50,000 (45,000) (5,000)
Total New/Enhanced Service 50,000 50,000 (45,000) (5,000)
Total Dunnville Cemeteries 50,000 50,000 (45,000) (5,000)
Total Cemeteries 22,000 215,800 220,000 91,000 65,000 35,000 10,000 35,000 10,000 35,000 738,800 (437,220) (301,580)
2013 2014 2015 2016 2017 2018 2019 2020 2021 2022 Total
Expenditures
Grants
Subsidies
External
Financing
Development
Charges
Rsve Funds
Federal
Gas Tax
Rsve Fund
Reserves/
Reserve
Funds
Debenture
Financing
Draft Budget Haldimand County
2013 to 2022 DRAFT TAX SUPPORTED CAPITAL FORECAST
Version:
Division: Cemeteries
Note: (W) Water; (WW) Wastewater; (SS) Storm Sewer; (R) Roads 51

HEALTH SERVICES
52

Social and Family Services
Grandview Lodge 219,410 183,760 123,800 171,100 118,300 100,900 90,900 165,900 119,900 144,800 1,438,770 (32,220) (1,406,550)
Total Social and Family Services 219,410 183,760 123,800 171,100 118,300 100,900 90,900 165,900 119,900 144,800 1,438,770 (32,220) (1,406,550)
2013 2014 2015 2016 2017 2018 2019 2020 2021 2022 Total
Expenditures
Grants
Subsidies
External
Financing
Development
Charges
Rsve Funds
Federal
Gas Tax
Rsve Fund
Reserves/
Reserve
Funds
Debenture
Financing
Draft Budget Haldimand County2013 to 2022 DRAFT TAX SUPPORTED CAPITAL FORECAST
Version:
Social and Family Services
Note: (W) Water; (WW) Wastewater; (SS) Storm Sewer; (R) Roads53

Grandview Lodge
GVL − Program & Support Services
Replacement/State of Good Repair
Televisions 2,000 2,000 3,000 2,000 2,000 2,000 2,000 2,000 2,000 2,000 21,000 (21,000)
Total Replacement/State of Good Repair 2,000 2,000 3,000 2,000 2,000 2,000 2,000 2,000 2,000 2,000 21,000 (21,000)
New/Enhanced Service
Snoezelen Therapy Travelling Cart 1,110 1,110 1,500 3,720 (3,720)
Total New/Enhanced Service 1,110 1,110 1,500 3,720 (3,720)
Total GVL − Program & Support Services 3,110 3,110 3,000 2,000 2,000 2,000 2,000 2,000 2,000 3,500 24,720 (24,720)
GVL − Dietary Services
Replacement/State of Good Repair
Main Kitchen Dishwasher 42,000 42,000 (42,000)
Galley Kitchen Dishwasher 12,500 12,500 25,000 (25,000)
Meat Slicer 7,500 7,500 (7,500)
Food Processor 5,000 5,000 5,000 15,000 (15,000)
Food Chopper 8,000 8,000 (8,000)
Galley Kitchen Toasters (2) 2,500 2,500 5,000 (5,000)
Galley Kitchen Ice Dispensers (2) 9,000 9,000 (9,000)
Galley Kitchen Refrigerator/Freezer 2,000 2,000 4,000 (4,000)
Main Kitchen Ice Machine 20,000 20,000 (20,000)
Galley Serveries Refrigerators (2) 2,000 2,000 4,000 (4,000)
Main Kitchen Refrigerator/Freezer 4,000 4,000 (4,000)
Coffee Brewers (2) 5,600 5,600 (5,600)
Hot Water Dispensers (2) 2,800 2,800 (2,800)
Total Replacement/State of Good Repair 47,000 39,500 12,500 7,000 2,000 31,000 2,000 10,900 151,900 (151,900)
Total GVL − Dietary Services 47,000 39,500 12,500 7,000 2,000 31,000 2,000 10,900 151,900 (151,900)
GVL − Nursing & Personal Care
Replacement/State of Good Repair
Nursing Pagers 3,600 3,600 3,600 3,600 3,600 3,600 3,600 3,600 3,600 3,600 36,000 (36,000)
Vital Machine 2,500 2,500 2,500 2,500 2,500 2,500 15,000 (15,000)
Nursing Treatment Cart 2,000 2,000 4,000 (4,000)
Health Care Aide Care Carts (2) 1,200 1,200 (1,200)
Sanitizer 13,000 13,000 13,000 13,000 52,000 (52,000)
Total Replacement/State of Good Repair 3,600 6,100 8,100 21,100 19,100 16,600 16,600 3,600 7,300 6,100 108,200 (108,200)
Total GVL − Nursing & Personal Care 3,600 6,100 8,100 21,100 19,100 16,600 16,600 3,600 7,300 6,100 108,200 (108,200)
GVL − Housekeeping
Replacement/State of Good Repair
Floor Lift 12,500 12,500 12,500 12,500 12,500 12,500 12,500 12,500 100,000 (100,000)
Floor Lift (sit to stand) 5,800 5,800 5,800 5,800 5,800 29,000 (29,000)
2013 2014 2015 2016 2017 2018 2019 2020 2021 2022 Total
Expenditures
Grants
Subsidies
External
Financing
Development
Charges
Rsve Funds
Federal
Gas Tax
Rsve Fund
Reserves/
Reserve
Funds
Debenture
Financing
Draft Budget Haldimand County
2013 to 2022 DRAFT TAX SUPPORTED CAPITAL FORECAST
Version:
Division: Grandview Lodge
Note: (W) Water; (WW) Wastewater; (SS) Storm Sewer; (R) Roads 54

Walk Behind Vacumn 3,500 3,500 3,500 3,500 3,500 3,500 3,500 3,500 28,000 (28,000)
Floor Scrubber 14,000 14,000 (14,000)
Mattress Replacement 8,000 8,000 8,000 8,000 8,000 8,000 8,000 8,000 8,000 8,000 80,000 (80,000)
Therapeutic Tubs (1 each year) 26,000 26,000 26,000 26,000 104,000 (104,000)
Tub Chairs 11,600 11,600 11,600 11,600 46,400 (46,400)
Lounge Furniture 10,000 10,000 10,000 10,000 10,000 10,000 10,000 10,000 10,000 10,000 100,000 (100,000)
Dining Room Furniture 10,000 10,000 10,000 10,000 40,000 (40,000)
Flooring Replacement 40,000 25,000 25,000 60,000 25,000 175,000 (175,000)
Total Replacement/State of Good Repair 111,600 73,000 69,000 109,800 46,300 37,300 27,300 71,600 77,400 93,100 716,400 (716,400)
New/Enhanced Service
Low to the Floor Electric Beds (10) 6,500 18,000 18,000 18,000 18,000 18,000 18,000 18,000 18,000 18,000 168,500 (168,500)
Ceiling Lifts/Tracks, Carriage for Beds 9,200 9,200 9,200 9,200 9,200 9,200 9,200 9,200 9,200 82,800 (82,800)
Outdoor Furniture 2,500 2,500 2,500 7,500 (7,500)
Total New/Enhanced Service 6,500 27,200 27,200 27,200 29,700 29,700 29,700 27,200 27,200 27,200 258,800 (7,500) (251,300)
Total GVL − Housekeeping 118,100 100,200 96,200 137,000 76,000 67,000 57,000 98,800 104,600 120,300 975,200 (7,500) (967,700)
GVL − Laundry & Linen
Replacement/State of Good Repair
Industrial Dryer 11,300 11,300 11,300 11,300 45,200 (45,200)
Industrial 75 lb Washer 15,200 15,200 15,200 45,600 (45,600)
Total Replacement/State of Good Repair 26,500 15,200 11,300 11,300 26,500 90,800 (90,800)
Total GVL − Laundry & Linen 26,500 15,200 11,300 11,300 26,500 90,800 (90,800)
GVL − Building & Property
Replacement/State of Good Repair
Replace Compressors 4,000 4,000 4,000 4,000 4,000 4,000 4,000 4,000 4,000 4,000 40,000 (40,000)
Cushion Tank 6,500 6,500 (6,500)
Total Replacement/State of Good Repair 10,500 4,000 4,000 4,000 4,000 4,000 4,000 4,000 4,000 4,000 46,500 (46,500)
New/Enhanced Service
Panic Buttons & Strobe Lights 4,350 4,350 (4,350)
Overhead Paging System 10,200 10,200 (10,200)
Fire Separation Wall 20,000 20,000 (20,000)
Keypad/Maglock Installation 1,800 1,800 (1,800)
Total New/Enhanced Service 32,000 4,350 36,350 (36,350)
Total GVL − Building & Property 42,500 8,350 4,000 4,000 4,000 4,000 4,000 4,000 4,000 4,000 82,850 (82,850)
GVL − Administration
New/Enhanced Service
Additional Nursing Station Computers (3) 5,100 5,100 (5,100)
Total New/Enhanced Service 5,100 5,100 (5,100)
Total GVL − Administration 5,100 5,100 (5,100)
Total Grandview Lodge 219,410 183,760 123,800 171,100 118,300 100,900 90,900 165,900 119,900 144,800 1,438,770 (32,220) (1,406,550)
2013 2014 2015 2016 2017 2018 2019 2020 2021 2022 Total
Expenditures
Grants
Subsidies
External
Financing
Development
Charges
Rsve Funds
Federal
Gas Tax
Rsve Fund
Reserves/
Reserve
Funds
Debenture
Financing
Draft Budget Haldimand County
2013 to 2022 DRAFT TAX SUPPORTED CAPITAL FORECAST
Version:
Division: Grandview Lodge
Note: (W) Water; (WW) Wastewater; (SS) Storm Sewer; (R) Roads 55

RECREATION AND CULTURAL SERVICES
56

Recreation and Cultural Services
Parks 313,900 740,040 606,000 375,500 384,000 325,000 150,000 295,000 162,000 265,000 3,616,440 (392,000) (610,000) (2,614,440)
Arenas 128,000 83,000 576,000 207,760 283,000 14,000 28,000 164,760 450,000 1,934,520 (1,934,520)
Pools 15,000 14,000 195,000 10,000 197,000 265,000 696,000 (696,000)
Library Summary 1,303,990 1,475,990 375,890 237,990 184,990 184,990 202,990 343,790 174,990 192,990 4,678,600 (800,000) (75,000) (630,300) (2,431,300) (742,000)
Heritage and Culture Summary 102,500 64,500 30,000 29,000 46,500 35,500 15,000 119,500 75,000 5,000 522,500 (522,500)
Community Halls Partnership Program 98,000 205,000 115,000 35,000 35,000 35,000 35,000 35,000 35,000 35,000 663,000 (663,000)
Community Partnership Program 150,000 150,000 150,000 150,000 150,000 150,000 150,000 150,000 150,000 150,000 1,500,000 (1,500,000)
Total Recreation and Cultural Services 2,111,390 2,718,530 1,866,890 1,230,250 1,083,490 740,490 763,990 971,290 761,750 1,362,990 13,611,060 (800,000) (467,000) (1,240,300) (10,361,760) (742,000)
2013 2014 2015 2016 2017 2018 2019 2020 2021 2022 Total
Expenditures
Grants
Subsidies
External
Financing
Development
Charges
Rsve Funds
Federal
Gas Tax
Rsve Fund
Reserves/
Reserve
Funds
Debenture
Financing
Draft Budget Haldimand County2013 to 2022 DRAFT TAX SUPPORTED CAPITAL FORECAST
Version:
Recreation and Cultural Services
Note: (W) Water; (WW) Wastewater; (SS) Storm Sewer; (R) Roads57

Parks
Trails and Pathways
Replacement/State of Good Repair
Townsend − Pathways, w lights, & Bridge 120,000 120,000 (120,000)
Total Replacement/State of Good Repair 120,000 120,000 (120,000)
New/Enhanced Service
Trail Development & Signage 93,900 284,040 50,000 50,000 50,000 50,000 50,000 50,000 50,000 50,000 777,940 (250,000) (250,000) (277,940)
Total New/Enhanced Service 93,900 284,040 50,000 50,000 50,000 50,000 50,000 50,000 50,000 50,000 777,940 (250,000) (250,000) (277,940)
Total Trails and Pathways 93,900 284,040 170,000 50,000 50,000 50,000 50,000 50,000 50,000 50,000 897,940 (250,000) (250,000) (397,940)
General Parks
New/Enhanced Service
Park Development & Master Plan Init’s 100,000 100,000 100,000 100,000 400,000 (360,000) (40,000)
Total New/Enhanced Service 100,000 100,000 100,000 100,000 400,000 (360,000) (40,000)
Total General Parks 100,000 100,000 100,000 100,000 400,000 (360,000) (40,000)
Caledonia Parks
Replacement/State of Good Repair
Kinsmen − Retrofit Washrooms 5,000 5,000 (5,000)
Kinsmen − Light Fixtures & Poles 30,000 30,000 (30,000)
McKinnon − Light Fixtures 30,000 30,000 (30,000)
McKinnon − Playground Equipment 75,000 75,000 (75,000)
Kinsmen − Tennis Court Fencing 30,000 30,000 (30,000)
Kinsmen − Resurface Tennis Courts 30,000 30,000 (30,000)
Kinsmen − Backstop and Fencing 20,000 20,000 (20,000)
McKinnon − Ball Park Backstop 15,000 15,000 (15,000)
Edinburgh Square −Ball Park Backstop 15,000 15,000 (15,000)
Kinsmen − Pavilion Siding 8,000 8,000 (8,000)
Total Replacement/State of Good Repair 73,000 30,000 80,000 75,000 258,000 (258,000)
Total Caledonia Parks 73,000 30,000 80,000 75,000 258,000 (258,000)
Hagersville Parks
Replacement/State of Good Repair
Grant Kett −Lights (#1 Diamond) 30,000 30,000 (30,000)
Oneida − Lights, Poles & Wiring (#1) 80,000 80,000 (80,000)
Grant Kett − Bleachers (#1 Diamond) 30,000 30,000 (30,000)
Grant Kett − Lights (#2 Diamond) 30,000 30,000 (30,000)
Oneida − Playground Equipment 75,000 75,000 (75,000)
Oneida − Bleachers (#1) 30,000 30,000 (30,000)
Oneida − Bleachers (#2) 10,000 10,000 (10,000)
Oneida − Backstop (#1) 20,000 20,000 (20,000)
Grant Kett − Pavilion Roof (#1) 20,000 20,000 (20,000)
2013 2014 2015 2016 2017 2018 2019 2020 2021 2022 Total
Expenditures
Grants
Subsidies
External
Financing
Development
Charges
Rsve Funds
Federal
Gas Tax
Rsve Fund
Reserves/
Reserve
Funds
Debenture
Financing
Draft Budget Haldimand County
2013 to 2022 DRAFT TAX SUPPORTED CAPITAL FORECAST
Version:
Division: Parks
Note: (W) Water; (WW) Wastewater; (SS) Storm Sewer; (R) Roads 58

Grant Kett − Concession/Washrooms 72,000 72,000 (72,000)
Oneida − Ball Park Fence (#1) 15,000 15,000 (15,000)
Oneida −Backstop/Ball Park Fence (#2) 30,000 30,000 (30,000)
Total Replacement/State of Good Repair 60,000 50,000 72,000 45,000 215,000 442,000 (442,000)
Total Hagersville Parks 60,000 50,000 72,000 45,000 215,000 442,000 (442,000)
Cayuga Parks
Replacement/State of Good Repair
Kinsmen Ball − Playground Equipment 75,000 75,000 (75,000)
Fisherville −Backstop/Ball Park Fencing (#2) 25,000 25,000 (25,000)
Kinsmen Ball − Backstop 15,000 15,000 (15,000)
Kinsmen Ball −Concession Siding 10,000 10,000 (10,000)
Skate Park Equipment 200,000 200,000 (142,000) (58,000)
Fisherville − Playground Equipment 100,000 100,000 (100,000)
Cayuga Kinsmen Conc/WR Siding Replacement 10,000 10,000 (10,000)
Total Replacement/State of Good Repair 15,000 195,000 25,000 200,000 435,000 (142,000) (293,000)
Total Cayuga Parks 15,000 195,000 25,000 200,000 435,000 (142,000) (293,000)
Dunnville Parks
Replacement/State of Good Repair
Kinsmen − Playground Equipment 75,000 75,000 (75,000)
Lions − Playground Equipment 75,000 75,000 (75,000)
Kinsmen Park (Diamond #1) bleachers 25,000 25,000 (25,000)
Kinsmen Park (Diamond #1) backstop 15,000 15,000 (15,000)
Kinsmen Park (Diamond #3) backstop 15,000 15,000 (15,000)
Dunnville Central Park Bandshell 72,500 72,500 (72,500)
Dunnville Parks Workshop 256,000 256,000 (256,000)
Total Replacement/State of Good Repair 40,000 256,000 147,500 15,000 75,000 533,500 (533,500)
Total Dunnville Parks 40,000 256,000 147,500 15,000 75,000 533,500 (533,500)
Nanticoke Parks
Replacement/State of Good Repair
Townsend − Playground Equipment 100,000 100,000 (100,000)
Jarvis − Playground Equipment 100,000 100,000 (100,000)
Selkirk − Playground Equipment 100,000 100,000 (100,000)
Townsend − Ball Park Fencing (#1) 15,000 15,000 (15,000)
Townsend − Ball Park Fencing (#2) 15,000 15,000 (15,000)
Selkirk − Repl Back Stop/Ball Pk Fencing (#2) 25,000 25,000 (25,000)
Total Replacement/State of Good Repair 130,000 100,000 25,000 100,000 355,000 (355,000)
Total Nanticoke Parks 130,000 100,000 25,000 100,000 355,000 (355,000)
Lafortune Park
Replacement/State of Good Repair
2013 2014 2015 2016 2017 2018 2019 2020 2021 2022 Total
Expenditures
Grants
Subsidies
External
Financing
Development
Charges
Rsve Funds
Federal
Gas Tax
Rsve Fund
Reserves/
Reserve
Funds
Debenture
Financing
Draft Budget Haldimand County
2013 to 2022 DRAFT TAX SUPPORTED CAPITAL FORECAST
Version:
Division: Parks
Note: (W) Water; (WW) Wastewater; (SS) Storm Sewer; (R) Roads 59

Boat Launch 12,000 12,000 (12,000)
Storage Building − Roof 15,000 15,000 (15,000)
Fencing 16,000 16,000 (16,000)
Lafortune Park Maintenance Shed 245,000 245,000 (245,000)
Total Replacement/State of Good Repair 31,000 245,000 12,000 288,000 (288,000)
Total Lafortune Park 31,000 245,000 12,000 288,000 (288,000)
Port Maitland Pier & Lighthouse
Replacement/State of Good Repair
Window Replacement 3,000 3,000 (3,000)
Light Standards and Electrical Systems 2,000 2,000 4,000 (4,000)
Total Replacement/State of Good Repair 2,000 3,000 2,000 7,000 (7,000)
Total Port Maitland Pier & Lighthouse 2,000 3,000 2,000 7,000 (7,000)
Total Parks 313,900 740,040 606,000 375,500 384,000 325,000 150,000 295,000 162,000 265,000 3,616,440 (392,000) (610,000) (2,614,440)
2013 2014 2015 2016 2017 2018 2019 2020 2021 2022 Total
Expenditures
Grants
Subsidies
External
Financing
Development
Charges
Rsve Funds
Federal
Gas Tax
Rsve Fund
Reserves/
Reserve
Funds
Debenture
Financing
Draft Budget Haldimand County
2013 to 2022 DRAFT TAX SUPPORTED CAPITAL FORECAST
Version:
Division: Parks
Note: (W) Water; (WW) Wastewater; (SS) Storm Sewer; (R) Roads 60

Arenas
Arenas − General
Replacement/State of Good Repair
Replace Arena Security Cameras 25,000 110,000 135,000 (135,000)
IP Security Cameras 60,960 60,960 121,920 (121,920)
Total Replacement/State of Good Repair 25,000 60,960 110,000 60,960 256,920 (256,920)
Total Arenas − General 25,000 60,960 110,000 60,960 256,920 (256,920)
Hagersville Arena
Replacement/State of Good Repair
Interior Work−Doors&Changeroom Benches 36,000 36,000 (36,000)
Replace Dehumidifiers (2) 40,000 40,000 (40,000)
Electrical Work 45,000 45,000 (45,000)
Mechanical Work 8,000 8,000 (8,000)
Replace Evaporator/Condensor 40,000 40,000 (40,000)
Replace HVAC Roof Top Unit (2) 50,000 50,000 (50,000)
Replace Skate Tile − Lobby & Dressing Rms 82,000 82,000 (82,000)
Concession − French Fry Machine 7,000 7,000 (7,000)
Rebuild Compressors 14,000 14,000 28,000 (28,000)
Total Replacement/State of Good Repair 54,000 43,000 175,000 50,000 14,000 336,000 (336,000)
New/Enhanced Service
Shop Exterior Expansion 25,000 25,000 (25,000)
Additional Dressing Rooms 40,000 360,000 400,000 (400,000)
Total New/Enhanced Service 40,000 385,000 425,000 (425,000)
Total Hagersville Arena 54,000 83,000 560,000 50,000 14,000 761,000 (761,000)
Haldimand County Caledonia Centre
Replacement/State of Good Repair
Replace Ceramic Floor Tile 25,000 25,000 (25,000)
Repl Hot Water Ht’r & Tank for Ice Resurf’r 8,000 8,000 (8,000)
Replace Skate Tile 80,000 80,000 (80,000)
Hot Water Heaters (2) 16,000 16,000 32,000 (32,000)
Booster Pump 5,000 5,000 (5,000)
Rebuild Compressors 32,000 32,000 64,000 (64,000)
Gaskets for Chiller 12,000 12,000 24,000 (24,000)
Concession Freezer 5,000 5,000 (5,000)
HCCC Parking Lot Repaving & Lining 450,000 450,000 (450,000)
Total Replacement/State of Good Repair 49,000 16,000 85,000 65,000 28,000 450,000 693,000 (693,000)
Total Haldimand County Caledonia Centre 49,000 16,000 85,000 65,000 28,000 450,000 693,000 (693,000)
Cayuga Arena
Replacement/State of Good Repair
2013 2014 2015 2016 2017 2018 2019 2020 2021 2022 Total
Expenditures
Grants
Subsidies
External
Financing
Development
Charges
Rsve Funds
Federal
Gas Tax
Rsve Fund
Reserves/
Reserve
Funds
Debenture
Financing
Draft Budget Haldimand County
2013 to 2022 DRAFT TAX SUPPORTED CAPITAL FORECAST
Version:
Division: Arenas
Note: (W) Water; (WW) Wastewater; (SS) Storm Sewer; (R) Roads 61

Repl HW Heater/Tank Ice Resurf’r 8,000 8,000 16,000 (16,000)
Replace Chiller Gaskets 12,000 12,000 (12,000)
Compressors (2 − 6 cylinder) 24,000 24,000 (24,000)
Floor Scrubber 9,000 9,000 (9,000)
HW Heaters (2) 16,000 16,000 32,000 (32,000)
Booster Pump 5,000 5,000 (5,000)
LCD TV’s 7,300 7,300 14,600 (14,600)
Total Replacement/State of Good Repair 31,300 29,000 52,300 112,600 (112,600)
Total Cayuga Arena 31,300 29,000 52,300 112,600 (112,600)
Dunnville Arena
Replacement/State of Good Repair
Hot Water Heater (Change Room) 16,000 16,000 32,000 (32,000)
Replace Chiller Gaskets 12,000 12,000 (12,000)
Compressors (2 − 6 cylinder) 24,000 24,000 (24,000)
Repl HW Heater&Tank Ice Resurf’r 8,000 8,000 16,000 (16,000)
Floor Scrubber 9,000 9,000 (9,000)
Booster Pump 5,000 5,000 (5,000)
LCD TV’s 6,500 6,500 13,000 (13,000)
Total Replacement/State of Good Repair 30,500 29,000 51,500 111,000 (111,000)
Total Dunnville Arena 30,500 29,000 51,500 111,000 (111,000)
Total Arenas 128,000 83,000 576,000 207,760 283,000 14,000 28,000 164,760 450,000 1,934,520 (1,934,520)
2013 2014 2015 2016 2017 2018 2019 2020 2021 2022 Total
Expenditures
Grants
Subsidies
External
Financing
Development
Charges
Rsve Funds
Federal
Gas Tax
Rsve Fund
Reserves/
Reserve
Funds
Debenture
Financing
Draft Budget Haldimand County
2013 to 2022 DRAFT TAX SUPPORTED CAPITAL FORECAST
Version:
Division: Arenas
Note: (W) Water; (WW) Wastewater; (SS) Storm Sewer; (R) Roads 62

Pools
Caledonia Pool
Replacement/State of Good Repair
Heater 15,000 15,000 (15,000)
Sandblast & Repaint Pool Bowls 75,000 75,000 (75,000)
Wading Pool Deck (Retrofit) 15,000 15,000 (15,000)
Filters 10,000 10,000 (10,000)
Total Replacement/State of Good Repair 115,000 115,000 (115,000)
Total Caledonia Pool 115,000 115,000 (115,000)
Hagersville Pool
Replacement/State of Good Repair
Sandblast & Repaint Pool Bowls 75,000 75,000 (75,000)
Replace Filters 10,000 10,000 (10,000)
Hagersville Pool Change House 197,000 197,000 (197,000)
Hagersville Wading Pool Storage Building 4,000 4,000 (4,000)
Total Replacement/State of Good Repair 14,000 197,000 75,000 286,000 (286,000)
Total Hagersville Pool 14,000 197,000 75,000 286,000 (286,000)
Dunnville Pool
Replacement/State of Good Repair
Filters 10,000 10,000 (10,000)
Dunnville Lions Pool House 140,000 140,000 (140,000)
Dunnville Pool Filter House 55,000 55,000 (55,000)
Dunnville − Sandblast/Repaint Pool Bowls 75,000 75,000 (75,000)
Dunnville Wading Pool Repairs 15,000 15,000 (15,000)
Total Replacement/State of Good Repair 15,000 195,000 10,000 75,000 295,000 (295,000)
Total Dunnville Pool 15,000 195,000 10,000 75,000 295,000 (295,000)
Total Pools 15,000 14,000 195,000 10,000 197,000 265,000 696,000 (696,000)
2013 2014 2015 2016 2017 2018 2019 2020 2021 2022 Total
Expenditures
Grants
Subsidies
External
Financing
Development
Charges
Rsve Funds
Federal
Gas Tax
Rsve Fund
Reserves/
Reserve
Funds
Debenture
Financing
Draft Budget Haldimand County
2013 to 2022 DRAFT TAX SUPPORTED CAPITAL FORECAST
Version:
Division: Pools
Note: (W) Water; (WW) Wastewater; (SS) Storm Sewer; (R) Roads 63
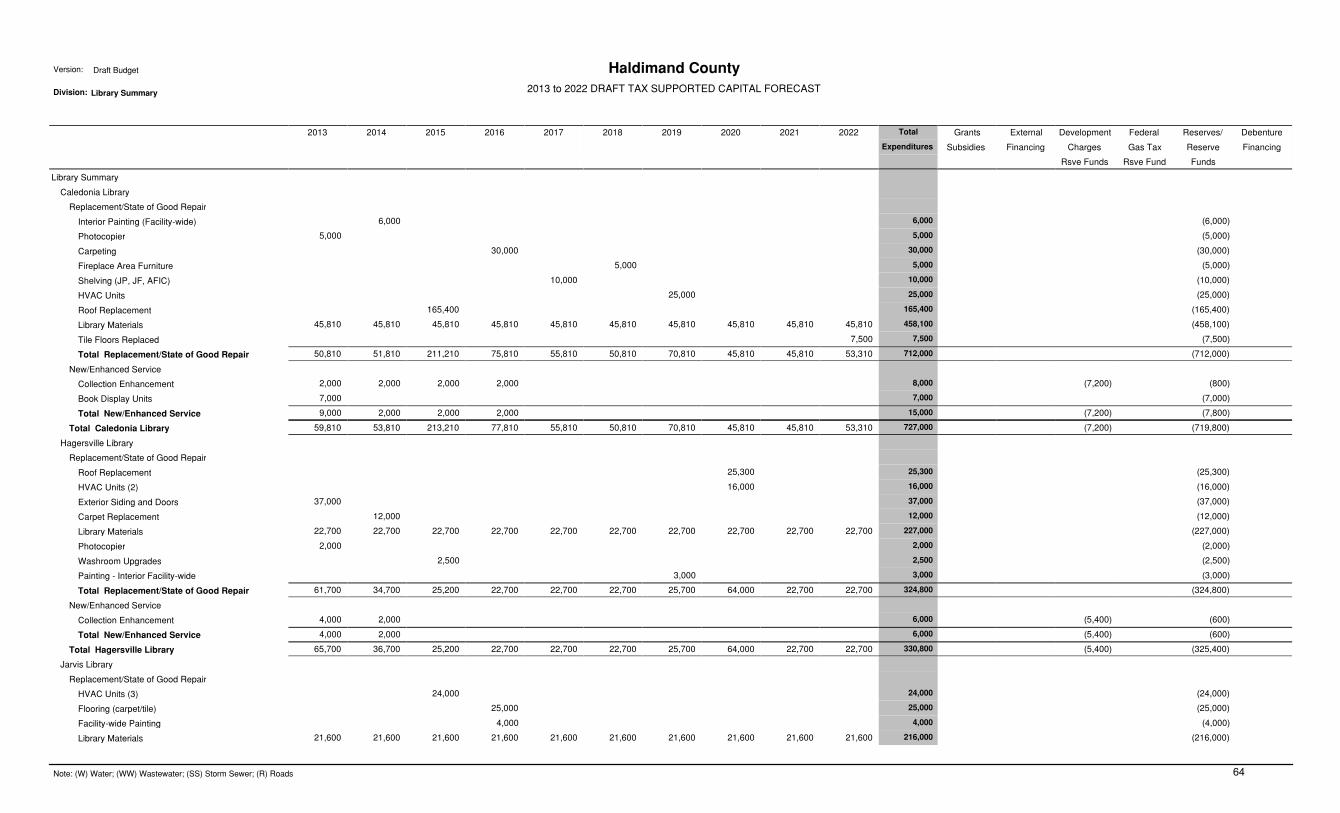
Library Summary
Caledonia Library
Replacement/State of Good Repair
Interior Painting (Facility−wide) 6,000 6,000 (6,000)
Photocopier 5,000 5,000 (5,000)
Carpeting 30,000 30,000 (30,000)
Fireplace Area Furniture 5,000 5,000 (5,000)
Shelving (JP, JF, AFIC) 10,000 10,000 (10,000)
HVAC Units 25,000 25,000 (25,000)
Roof Replacement 165,400 165,400 (165,400)
Library Materials 45,810 45,810 45,810 45,810 45,810 45,810 45,810 45,810 45,810 45,810 458,100 (458,100)
Tile Floors Replaced 7,500 7,500 (7,500)
Total Replacement/State of Good Repair 50,810 51,810 211,210 75,810 55,810 50,810 70,810 45,810 45,810 53,310 712,000 (712,000)
New/Enhanced Service
Collection Enhancement 2,000 2,000 2,000 2,000 8,000 (7,200) (800)
Book Display Units 7,000 7,000 (7,000)
Total New/Enhanced Service 9,000 2,000 2,000 2,000 15,000 (7,200) (7,800)
Total Caledonia Library 59,810 53,810 213,210 77,810 55,810 50,810 70,810 45,810 45,810 53,310 727,000 (7,200) (719,800)
Hagersville Library
Replacement/State of Good Repair
Roof Replacement 25,300 25,300 (25,300)
HVAC Units (2) 16,000 16,000 (16,000)
Exterior Siding and Doors 37,000 37,000 (37,000)
Carpet Replacement 12,000 12,000 (12,000)
Library Materials 22,700 22,700 22,700 22,700 22,700 22,700 22,700 22,700 22,700 22,700 227,000 (227,000)
Photocopier 2,000 2,000 (2,000)
Washroom Upgrades 2,500 2,500 (2,500)
Painting − Interior Facility−wide 3,000 3,000 (3,000)
Total Replacement/State of Good Repair 61,700 34,700 25,200 22,700 22,700 22,700 25,700 64,000 22,700 22,700 324,800 (324,800)
New/Enhanced Service
Collection Enhancement 4,000 2,000 6,000 (5,400) (600)
Total New/Enhanced Service 4,000 2,000 6,000 (5,400) (600)
Total Hagersville Library 65,700 36,700 25,200 22,700 22,700 22,700 25,700 64,000 22,700 22,700 330,800 (5,400) (325,400)
Jarvis Library
Replacement/State of Good Repair
HVAC Units (3) 24,000 24,000 (24,000)
Flooring (carpet/tile) 25,000 25,000 (25,000)
Facility−wide Painting 4,000 4,000 (4,000)
Library Materials 21,600 21,600 21,600 21,600 21,600 21,600 21,600 21,600 21,600 21,600 216,000 (216,000)
2013 2014 2015 2016 2017 2018 2019 2020 2021 2022 Total
Expenditures
Grants
Subsidies
External
Financing
Development
Charges
Rsve Funds
Federal
Gas Tax
Rsve Fund
Reserves/
Reserve
Funds
Debenture
Financing
Draft Budget Haldimand County
2013 to 2022 DRAFT TAX SUPPORTED CAPITAL FORECAST
Version:
Division: Library Summary
Note: (W) Water; (WW) Wastewater; (SS) Storm Sewer; (R) Roads 64
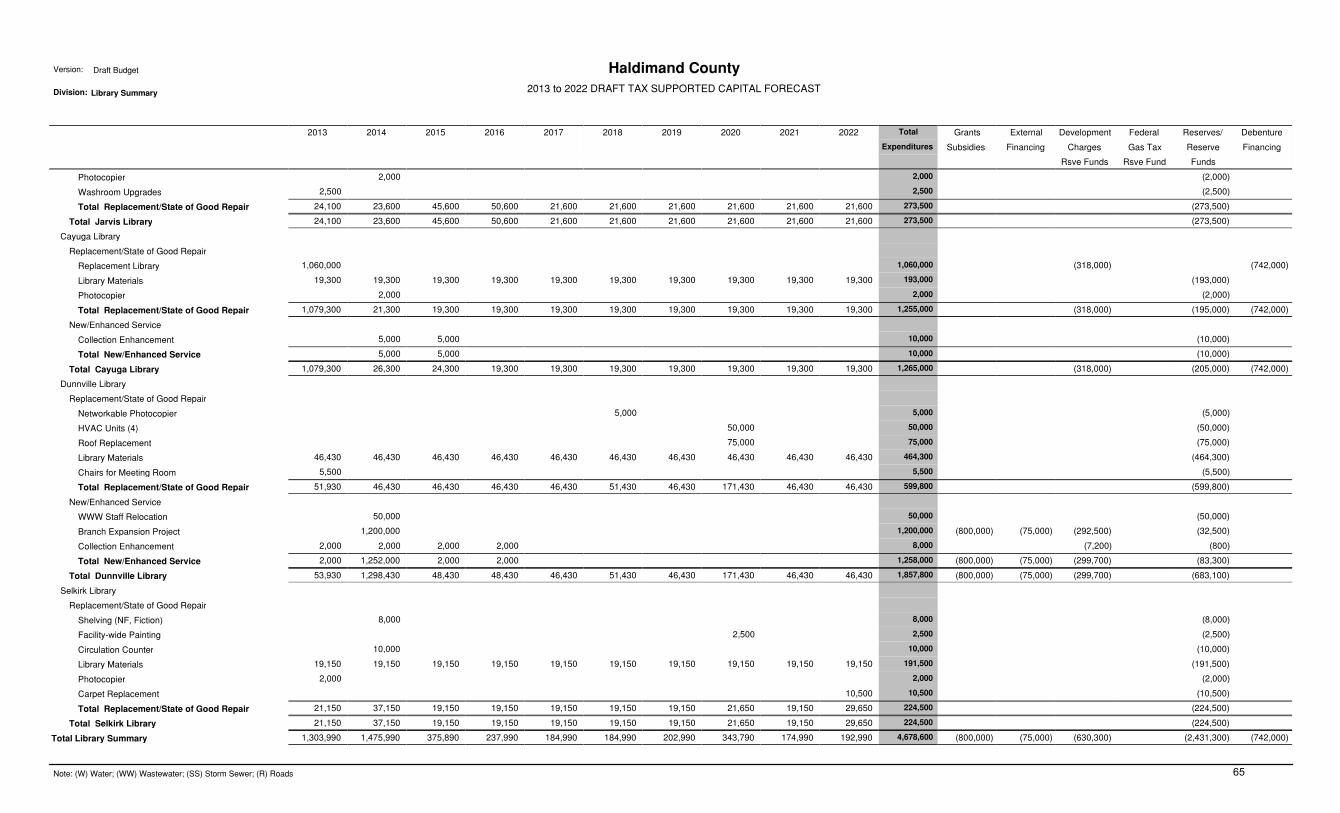
Photocopier 2,000 2,000 (2,000)
Washroom Upgrades 2,500 2,500 (2,500)
Total Replacement/State of Good Repair 24,100 23,600 45,600 50,600 21,600 21,600 21,600 21,600 21,600 21,600 273,500 (273,500)
Total Jarvis Library 24,100 23,600 45,600 50,600 21,600 21,600 21,600 21,600 21,600 21,600 273,500 (273,500)
Cayuga Library
Replacement/State of Good Repair
Replacement Library 1,060,000 1,060,000 (318,000) (742,000)
Library Materials 19,300 19,300 19,300 19,300 19,300 19,300 19,300 19,300 19,300 19,300 193,000 (193,000)
Photocopier 2,000 2,000 (2,000)
Total Replacement/State of Good Repair 1,079,300 21,300 19,300 19,300 19,300 19,300 19,300 19,300 19,300 19,300 1,255,000 (318,000) (195,000) (742,000)
New/Enhanced Service
Collection Enhancement 5,000 5,000 10,000 (10,000)
Total New/Enhanced Service 5,000 5,000 10,000 (10,000)
Total Cayuga Library 1,079,300 26,300 24,300 19,300 19,300 19,300 19,300 19,300 19,300 19,300 1,265,000 (318,000) (205,000) (742,000)
Dunnville Library
Replacement/State of Good Repair
Networkable Photocopier 5,000 5,000 (5,000)
HVAC Units (4) 50,000 50,000 (50,000)
Roof Replacement 75,000 75,000 (75,000)
Library Materials 46,430 46,430 46,430 46,430 46,430 46,430 46,430 46,430 46,430 46,430 464,300 (464,300)
Chairs for Meeting Room 5,500 5,500 (5,500)
Total Replacement/State of Good Repair 51,930 46,430 46,430 46,430 46,430 51,430 46,430 171,430 46,430 46,430 599,800 (599,800)
New/Enhanced Service
WWW Staff Relocation 50,000 50,000 (50,000)
Branch Expansion Project 1,200,000 1,200,000 (800,000) (75,000) (292,500) (32,500)
Collection Enhancement 2,000 2,000 2,000 2,000 8,000 (7,200) (800)
Total New/Enhanced Service 2,000 1,252,000 2,000 2,000 1,258,000 (800,000) (75,000) (299,700) (83,300)
Total Dunnville Library 53,930 1,298,430 48,430 48,430 46,430 51,430 46,430 171,430 46,430 46,430 1,857,800 (800,000) (75,000) (299,700) (683,100)
Selkirk Library
Replacement/State of Good Repair
Shelving (NF, Fiction) 8,000 8,000 (8,000)
Facility−wide Painting 2,500 2,500 (2,500)
Circulation Counter 10,000 10,000 (10,000)
Library Materials 19,150 19,150 19,150 19,150 19,150 19,150 19,150 19,150 19,150 19,150 191,500 (191,500)
Photocopier 2,000 2,000 (2,000)
Carpet Replacement 10,500 10,500 (10,500)
Total Replacement/State of Good Repair 21,150 37,150 19,150 19,150 19,150 19,150 19,150 21,650 19,150 29,650 224,500 (224,500)
Total Selkirk Library 21,150 37,150 19,150 19,150 19,150 19,150 19,150 21,650 19,150 29,650 224,500 (224,500)
Total Library Summary 1,303,990 1,475,990 375,890 237,990 184,990 184,990 202,990 343,790 174,990 192,990 4,678,600 (800,000) (75,000) (630,300) (2,431,300) (742,000)
2013 2014 2015 2016 2017 2018 2019 2020 2021 2022 Total
Expenditures
Grants
Subsidies
External
Financing
Development
Charges
Rsve Funds
Federal
Gas Tax
Rsve Fund
Reserves/
Reserve
Funds
Debenture
Financing
Draft Budget Haldimand County
2013 to 2022 DRAFT TAX SUPPORTED CAPITAL FORECAST
Version:
Division: Library Summary
Note: (W) Water; (WW) Wastewater; (SS) Storm Sewer; (R) Roads 65

Heritage and Culture Summary
Heritage & Culture General
Replacement/State of Good Repair
General Repairs/Maintenance 5,000 5,000 5,000 5,000 5,000 5,000 30,000 (30,000)
Total Replacement/State of Good Repair 5,000 5,000 5,000 5,000 5,000 5,000 30,000 (30,000)
Total Heritage & Culture General 5,000 5,000 5,000 5,000 5,000 5,000 30,000 (30,000)
Edinburgh Square
Replacement/State of Good Repair
Interior Painting (stairwell and archives) 4,500 4,500 (4,500)
Refinish Hardw’d Floor’g(mtg room&archives) 4,500 4,500 (4,500)
Remove and Reconstruct Accessibility Ramp 58,000 58,000 (58,000)
Exterior Painting 26,000 26,000 (26,000)
Replace HVAC (second floor unit) 12,500 12,500 (12,500)
Engineering Analysis 5,000 5,000 (5,000)
Emergency Exit Door Replacement 4,500 4,500 (4,500)
Repair Drains & Basement Leak 1,000 3,500 4,500 (4,500)
Brick Re−Pointing 3,000 3,000 (3,000)
Stair Riser Replacement 12,000 12,000 (12,000)
Window Replacement 80,000 80,000 (80,000)
Parking Lot Paving 30,000 30,000 (30,000)
Chimney Replacement 20,000 20,000 (20,000)
Total Replacement/State of Good Repair 87,000 26,000 13,500 9,500 6,500 12,000 80,000 30,000 264,500 (264,500)
Total Edinburgh Square 87,000 26,000 13,500 9,500 6,500 12,000 80,000 30,000 264,500 (264,500)
Haldimand Museum & Archives
Replacement/State of Good Repair
Painting Interior of Museum 10,500 10,500 (10,500)
Exterior Painting and staining 5,000 5,000 10,000 (10,000)
Repave walkway/ repair stairs 5,000 5,000 (5,000)
Archive Area Flooring 13,000 13,000 (13,000)
Replace Windows 15,000 15,000 (15,000)
Replace Roof 21,500 21,500 (21,500)
Hald Museum: Barrier Free Front Doors 6,000 6,000 (6,000)
Engineering Analysis 5,000 5,000 (5,000)
Washroom Plumbing 5,000 5,000 (5,000)
Washroom Accessibility 5,000 5,000 (5,000)
Kitchenette plumb, elect, cabinetry, venting 25,000 25,000 (25,000)
Appliance Replacement (fridge/stove) 1,500 1,500 (1,500)
Total Replacement/State of Good Repair 10,500 34,500 5,000 11,000 10,000 26,500 25,000 122,500 (122,500)
Total Haldimand Museum & Archives 10,500 34,500 5,000 11,000 10,000 26,500 25,000 122,500 (122,500)
2013 2014 2015 2016 2017 2018 2019 2020 2021 2022 Total
Expenditures
Grants
Subsidies
External
Financing
Development
Charges
Rsve Funds
Federal
Gas Tax
Rsve Fund
Reserves/
Reserve
Funds
Debenture
Financing
Draft Budget Haldimand County
2013 to 2022 DRAFT TAX SUPPORTED CAPITAL FORECAST
Version:
Division: Heritage and Culture Summary
Note: (W) Water; (WW) Wastewater; (SS) Storm Sewer; (R) Roads 66

W. M. Memorial School Museum
Replacement/State of Good Repair
Painting: Exterior and Shutter Repair 4,000 4,000 (4,000)
Paint New Addition and Schoolhouse (Interior) 5,000 5,000 (5,000)
HVAC Replacement 14,500 14,500 (14,500)
Roof Replacement 15,000 15,000 (15,000)
Septic Bed and Tile Replacement 25,000 25,000 (25,000)
Exterior Brick Repair 16,500 16,500 (16,500)
Engineering Analysis 5,000 5,000 (5,000)
Wheelchair Access, Guardrails and Pathway 7,500 7,500 (7,500)
Washroom Accessibility 5,000 5,000 (5,000)
Flooring Replacement 8,000 8,000 (8,000)
Total Replacement/State of Good Repair 5,000 4,000 16,500 14,500 30,000 7,500 5,000 8,000 15,000 105,500 (105,500)
Total W. M. Memorial School Museum 5,000 4,000 16,500 14,500 30,000 7,500 5,000 8,000 15,000 105,500 (105,500)
Total Heritage and Culture Summary 102,500 64,500 30,000 29,000 46,500 35,500 15,000 119,500 75,000 5,000 522,500 (522,500)
2013 2014 2015 2016 2017 2018 2019 2020 2021 2022 Total
Expenditures
Grants
Subsidies
External
Financing
Development
Charges
Rsve Funds
Federal
Gas Tax
Rsve Fund
Reserves/
Reserve
Funds
Debenture
Financing
Draft Budget Haldimand County
2013 to 2022 DRAFT TAX SUPPORTED CAPITAL FORECAST
Version:
Division: Heritage and Culture Summary
Note: (W) Water; (WW) Wastewater; (SS) Storm Sewer; (R) Roads 67

Community Halls Partnership Program
Replacement/State of Good Repair
Annual Community Hall Projects − Capital Repairs 35,000 35,000 35,000 35,000 35,000 35,000 35,000 35,000 35,000 35,000 350,000 (350,000)
Caledonia Lions Hall Structural Repairs 20,000 80,000 100,000 (100,000)
Jarvis Hall Roof Replacement 43,000 43,000 (43,000)
Fisherville Hall Roof Replacement 170,000 170,000 (170,000)
Total Replacement/State of Good Repair 98,000 205,000 115,000 35,000 35,000 35,000 35,000 35,000 35,000 35,000 663,000 (663,000)
Total Community Halls Partnership Program 98,000 205,000 115,000 35,000 35,000 35,000 35,000 35,000 35,000 35,000 663,000 (663,000)
2013 2014 2015 2016 2017 2018 2019 2020 2021 2022 Total
Expenditures
Grants
Subsidies
External
Financing
Development
Charges
Rsve Funds
Federal
Gas Tax
Rsve Fund
Reserves/
Reserve
Funds
Debenture
Financing
Draft Budget Haldimand County
2013 to 2022 DRAFT TAX SUPPORTED CAPITAL FORECAST
Version:
Division: Community Halls Partnership Program
Note: (W) Water; (WW) Wastewater; (SS) Storm Sewer; (R) Roads68
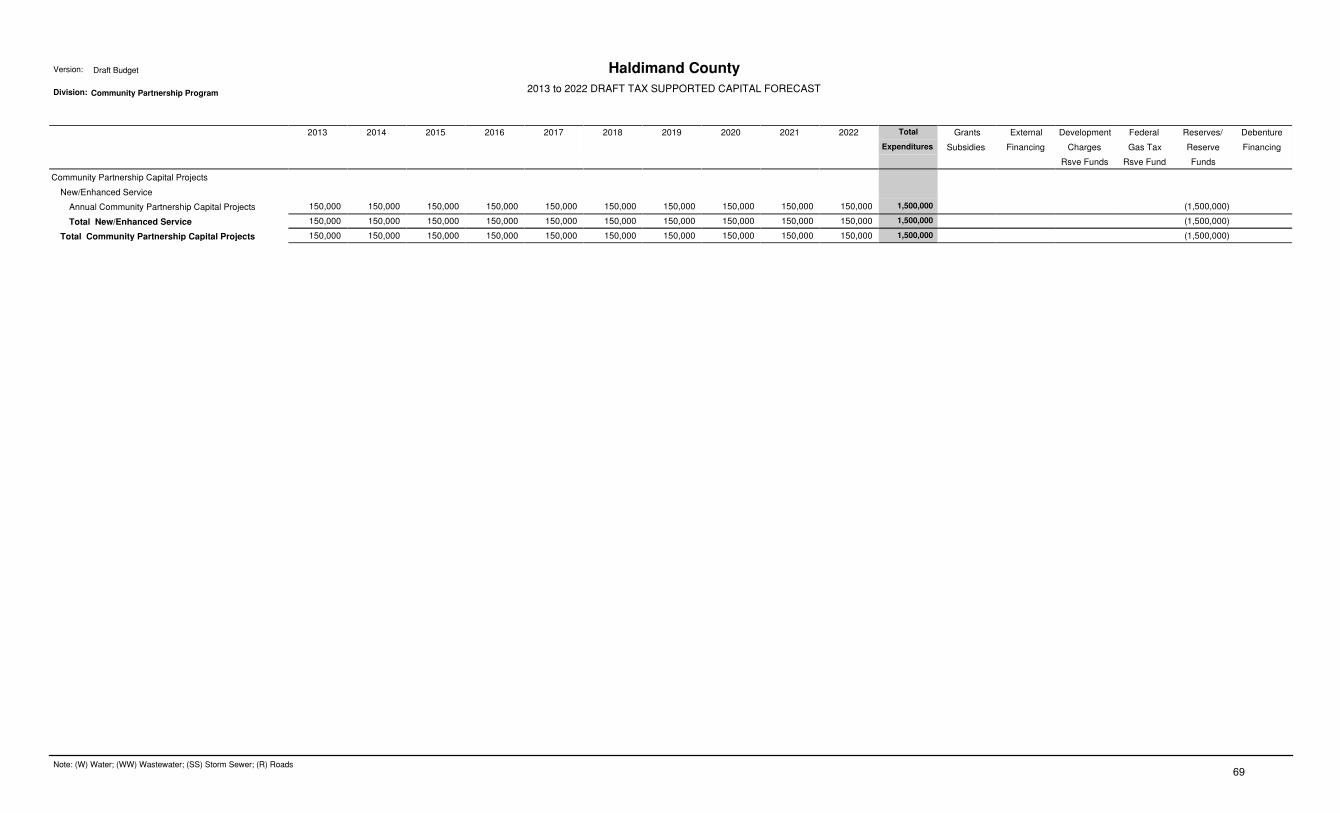
Community Partnership Capital Projects
New/Enhanced Service
Annual Community Partnership Capital Projects 150,000 150,000 150,000 150,000 150,000 150,000 150,000 150,000 150,000 150,000 1,500,000 (1,500,000)
Total New/Enhanced Service 150,000 150,000 150,000 150,000 150,000 150,000 150,000 150,000 150,000 150,000 1,500,000 (1,500,000)
Total Community Partnership Capital Projects 150,000 150,000 150,000 150,000 150,000 150,000 150,000 150,000 150,000 150,000 1,500,000 (1,500,000)
2013 2014 2015 2016 2017 2018 2019 2020 2021 2022 Total
Expenditures
Grants
Subsidies
External
Financing
Development
Charges
Rsve Funds
Federal
Gas Tax
Rsve Fund
Reserves/
Reserve
Funds
Debenture
Financing
Draft Budget Haldimand County
2013 to 2022 DRAFT TAX SUPPORTED CAPITAL FORECAST
Version:
Division: Community Partnership Program
Note: (W) Water; (WW) Wastewater; (SS) Storm Sewer; (R) Roads69

PLANNING AND DEVELOPMENT SERVICES
70

Planning and Development
Markets 20,000 10,000 450,000 480,000 (200,000) (280,000)
Planning and Development Division 321,000 300,000 550,000 30,000 200,000 21,000 141,000 75,000 1,638,000 (10,000) (243,040) (1,384,960)
Economic Development/Tourism Division 406,400 306,400 280,000 15,000 19,000 49,000 20,000 1,095,800 (6,800) (1,089,000)
Total Planning and Development 727,400 626,400 840,000 480,000 200,000 36,000 19,000 190,000 95,000 3,213,800 (216,800) (243,040) (2,753,960)
2013 2014 2015 2016 2017 2018 2019 2020 2021 2022 Total
Expenditures
Grants
Subsidies
External
Financing
Development
Charges
Rsve Funds
Federal
Gas Tax
Rsve Fund
Reserves/
Reserve
Funds
Debenture
Financing
Draft Budget Haldimand County2013 to 2022 DRAFT TAX SUPPORTED CAPITAL FORECAST
Version:
Planning and Development
Note: (W) Water; (WW) Wastewater; (SS) Storm Sewer; (R) Roads71

Markets
Replacement/State of Good Repair
Dunnville Farmer’s Market Repairs/Maintenance 450,000 450,000 (200,000) (250,000)
Hagersville Farmer’s Market Repairs/Maintenance 20,000 10,000 30,000 (30,000)
Total Replacement/State of Good Repair 20,000 10,000 450,000 480,000 (200,000) (280,000)
Total Markets 20,000 10,000 450,000 480,000 (200,000) (280,000)
2013 2014 2015 2016 2017 2018 2019 2020 2021 2022 Total
Expenditures
Grants
Subsidies
External
Financing
Development
Charges
Rsve Funds
Federal
Gas Tax
Rsve Fund
Reserves/
Reserve
Funds
Debenture
Financing
Draft Budget Haldimand County
2013 to 2022 DRAFT TAX SUPPORTED CAPITAL FORECAST
Version:
Division: Markets
Note: (W) Water; (WW) Wastewater; (SS) Storm Sewer; (R) Roads72

Planning & Development Division
Replacement/State of Good Repair
Aerial Photography Update 46,000 46,000 92,000 (10,000) (82,000)
OP 5 yr. Review & Update Nat’l Areas Inventry 145,000 70,000 215,000 (215,000)
Population & Employment Forecast Update 21,000 21,000 42,000 (37,800) (4,200)
Zoning By−Law Update 75,000 75,000 (75,000)
Comprehensive Zoning By−law Phase I 50,000 50,000 (10,000) (40,000)
Comprehensive Zoning By−law Phase II 50,000 50,000 (10,000) (40,000)
Total Replacement/State of Good Repair 71,000 50,000 191,000 21,000 116,000 75,000 524,000 (10,000) (57,800) (456,200)
New/Enhanced Service
Dev. Permits−Lakeshore Area & Urban Dow’tns 50,000 25,000 75,000 (10,000) (65,000)
Sec. Plan − Cal − Official Plan Amend’t 30,000 30,000 (20,240) (9,760)
Downtown Streetscaping−Construction 250,000 250,000 500,000 (125,000) (375,000)
Dunv Sec Plan Implementation−County Lands 359,000 359,000 (359,000)
Dunv Sec Plan Implementation−Special Policy Area 150,000 150,000 (30,000) (120,000)
Total New/Enhanced Service 250,000 250,000 359,000 30,000 200,000 25,000 1,114,000 (185,240) (928,760)
Total Planning & Development Division 321,000 300,000 550,000 30,000 200,000 21,000 141,000 75,000 1,638,000 (10,000) (243,040) (1,384,960)
2013 2014 2015 2016 2017 2018 2019 2020 2021 2022 Total
Expenditures
Grants
Subsidies
External
Financing
Development
Charges
Rsve Funds
Federal
Gas Tax
Rsve Fund
Reserves/
Reserve
Funds
Debenture
Financing
Draft Budget Haldimand County
2013 to 2022 DRAFT TAX SUPPORTED CAPITAL FORECAST
Version:
Division: Planning and Development Division
Note: (W) Water; (WW) Wastewater; (SS) Storm Sewer; (R) Roads73

Tourism
Replacement/State of Good Repair
Promotional & Directional Sign Repl. 15,000 19,000 49,000 20,000 103,000 (103,000)
Tourism Way−Finding Program 6,400 6,400 12,800 (6,800) (6,000)
Total Replacement/State of Good Repair 6,400 6,400 15,000 19,000 49,000 20,000 115,800 (6,800) (109,000)
New/Enhanced Service
Lakescape Action Plan Implementation 400,000 300,000 700,000 (700,000)
Tourism Product Development − Birding 200,000 200,000 (200,000)
Urban Wayfinding Signage Program 40,000 40,000 (40,000)
Tourism Product Development − Cycling 40,000 40,000 (40,000)
Total New/Enhanced Service 400,000 300,000 280,000 980,000 (980,000)
Total Tourism 406,400 306,400 280,000 15,000 19,000 49,000 20,000 1,095,800 (6,800) (1,089,000)
2013 2014 2015 2016 2017 2018 2019 2020 2021 2022 Total
Expenditures
Grants
Subsidies
External
Financing
Development
Charges
Rsve Funds
Federal
Gas Tax
Rsve Fund
Reserves/
Reserve
Funds
Debenture
Financing
Draft Budget Haldimand County
2013 to 2022 DRAFT TAX SUPPORTED CAPITAL FORECAST
Version:
Division: Economic Development/Tourism Division
Note: (W) Water; (WW) Wastewater; (SS) Storm Sewer; (R) Roads74

APPENDICES
75

APPENDIX A
Principles
Source Sub-category
Debt Financing
County Reserves/Reserve Funds Capital Replacement Reserves/Reserve Funds
Land Sales Reserve
Parkland Dedication Reserve fund
Development Charge Reserve Funds
Grants Allocation of Federal Gas Tax Funds
Other Grants
External Sources External Financing - Donation/Contributions
External Financing - Donation towards Decorative
Streetlights
External Financing - Municipal Recoveries
Application of Funding Sources for Specific Capital Projects
Nature of Project Hierarchy of Funding Source
Replacements/SOGR External Revenues
Specific Capital Replacement Reserve/Reserve Funds
Development Charges (if applicable)
Applicable Grants
Debt Financing
New Initiatives/Enhancements External Revenues
Development Charges (if applicable)
Applicable Grants
Specific Capital Replacement Reserve/Reserve Funds
Debt Financing
Annual debt repayments will not exceed 10% of own source revenues. Debt will only
be applied to projects under the following principles:
Gross Project Costs < $1 million: Not eligible for debt
Gross Project Costs between $1 Million and $10 Million : Debt financed for a period of
10 years.
Gross Project Costs > $10 million and asset life >20 years: Debt financed for a period
of 20 years.
Engineering components less than 25% of project cost, if initiated more than 2 years
before construction, will not be eligible for debt financing.
HALDIMAND COUNTY
Principle
2013 DRAFT CAPITAL BUDGET AND FORECAST
CAPITAL FINANCING PRINCIPLES
As available based on eligibility of funds
Municipal Drains based on legislative assessment. Partnership with community
groups based on Community Partnership Framework for new service/enhanced
infrastructure projects, or acceleration of replacement of infrastructure.
Based on agreed cost sharing principles
upgrades from standard to decorative streetlights will be funded by BIA or community
group, based on $650/light
Capital Replacement Reserves/Reserve Funds will have a positive balance at the end
of the 10 year forecast. Interim financing during the forecast will not exceed 25% of
annual contributions in any given year. All projects requiring interim financing will
have interest charges applied to the capital project.
to be utilized for to provide a source of funds for land purchases, building construction
or major capital improvements to County-owned buildings.
Development Charges reserve funds will remain positive in aggregate over the 10 year
forecast.
Allocate 50/50 between water/wastewater and tax supported capital projects. Apply
to incremental projects, new/enhanced services. Gas Tax will be used in order to
avoid debt financing. Need to ensure the project meets eligibility requirements for
Gas Tax funding.
to be utilized for to provide a source of funds for acquisition (50%) and development
(50%) of public parks, recreation facilities and trails.
76
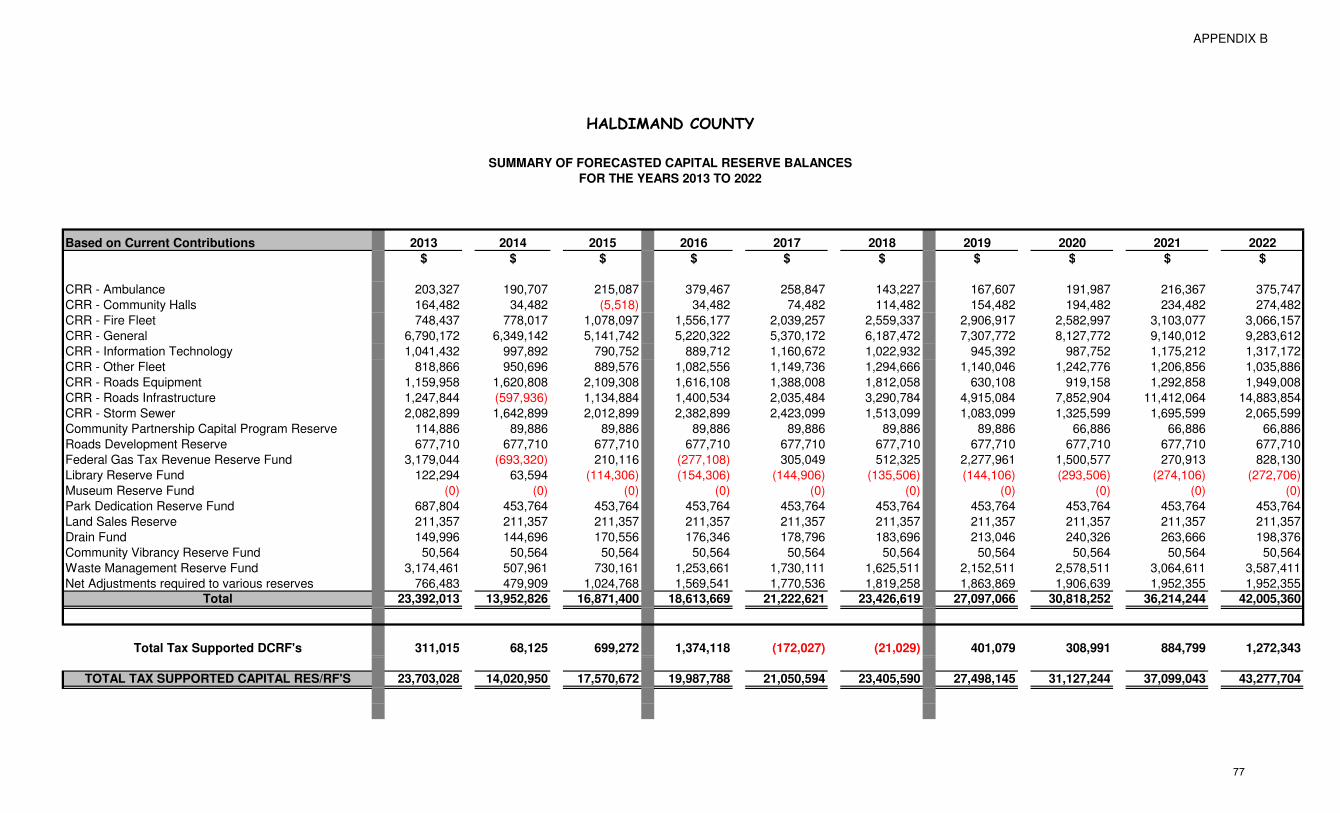
APPENDIX B
Based on Current Contributions 2013 2014 2015 2016 2017 2018 2019 2020 2021 2022
$ $ $ $ $ $ $ $ $ $
CRR - Ambulance 203,327 190,707 215,087 379,467 258,847 143,227 167,607 191,987 216,367 375,747
CRR - Community Halls 164,482 34,482 (5,518) 34,482 74,482 114,482 154,482 194,482 234,482 274,482
CRR - Fire Fleet 748,437 778,017 1,078,097 1,556,177 2,039,257 2,559,337 2,906,917 2,582,997 3,103,077 3,066,157
CRR - General 6,790,172 6,349,142 5,141,742 5,220,322 5,370,172 6,187,472 7,307,772 8,127,772 9,140,012 9,283,612
CRR - Information Technology 1,041,432 997,892 790,752 889,712 1,160,672 1,022,932 945,392 987,752 1,175,212 1,317,172
HALDIMAND COUNTY
SUMMARY OF FORECASTED CAPITAL RESERVE BALANCES
FOR THE YEARS 2013 TO 2022
CRR - Other Fleet 818,866 950,696 889,576 1,082,556 1,149,736 1,294,666 1,140,046 1,242,776 1,206,856 1,035,886
CRR - Roads Equipment 1,159,958 1,620,808 2,109,308 1,616,108 1,388,008 1,812,058 630,108 919,158 1,292,858 1,949,008
CRR - Roads Infrastructure 1,247,844 (597,936) 1,134,884 1,400,534 2,035,484 3,290,784 4,915,084 7,852,904 11,412,064 14,883,854
CRR - Storm Sewer 2,082,899 1,642,899 2,012,899 2,382,899 2,423,099 1,513,099 1,083,099 1,325,599 1,695,599 2,065,599
Community Partnership Capital Program Reserve 114,886 89,886 89,886 89,886 89,886 89,886 89,886 66,886 66,886 66,886
Roads Development Reserve 677,710 677,710 677,710 677,710 677,710 677,710 677,710 677,710 677,710 677,710
Federal Gas Tax Revenue Reserve Fund 3,179,044 (693,320) 210,116 (277,108) 305,049 512,325 2,277,961 1,500,577 270,913 828,130
Library Reserve Fund 122,294 63,594 (114,306) (154,306) (144,906) (135,506) (144,106) (293,506) (274,106) (272,706)
Museum Reserve Fund (0) (0) (0) (0) (0) (0) (0) (0) (0) (0)
Park Dedication Reserve Fund 687,804 453,764 453,764 453,764 453,764 453,764 453,764 453,764 453,764 453,764
Land Sales Reserve 211,357 211,357 211,357 211,357 211,357 211,357 211,357 211,357 211,357 211,357
Drain Fund 149,996 144,696 170,556 176,346 178,796 183,696 213,046 240,326 263,666 198,376
Community Vibrancy Reserve Fund 50,564 50,564 50,564 50,564 50,564 50,564 50,564 50,564 50,564 50,564
Waste Management Reserve Fund 3,174,461 507,961 730,161 1,253,661 1,730,111 1,625,511 2,152,511 2,578,511 3,064,611 3,587,411
Net Adjustments required to various reserves 766,483 479,909 1,024,768 1,569,541 1,770,536 1,819,258 1,863,869 1,906,639 1,952,355 1,952,355
Total 23,392,013 13,952,826 16,871,400 18,613,669 21,222,621 23,426,619 27,097,066 30,818,252 36,214,244 42,005,360
Total Tax Supported DCRF's 311,015 68,125 699,272 1,374,118 (172,027) (21,029) 401,079 308,991 884,799 1,272,343
TOTAL TAX SUPPORTED CAPITAL RES/RF'S 23,703,028 14,020,950 17,570,672 19,987,788 21,050,594 23,405,590 27,498,145 31,127,244 37,099,043 43,277,704
77

APPENDIX B
2012 2013 2014 2015 2016 2017 2018 2019 2020 2021 2022
$ $ $ $ $ $ $ $ $ $ $
Opening Balance January 1st 294,567 178,947 203,327 190,707 215,087 379,467 258,847 143,227 167,607 191,987 216,367
Source of Funds:
Budgeted Contribution 164,380 164,380 164,380 164,380 164,380 164,380 164,380 164,380 164,380 164,380 164,380
Total Source of Funds 164,380 164,380 164,380 164,380 164,380 164,380 164,380 164,380 164,380 164,380 164,380
Use of Funds:
Commitment for Active Projects
Contribution to State of Good Repair Projects 280,000 140,000 140,000 140,000 285,000 280,000 140,000 140,000 140,000 5,000
Contribution to New Initiatives/Enhanced Service Projects 37,000
Total Use of Funds 280,000 140,000 177,000 140,000 0 285,000 280,000 140,000 140,000 140,000 5,000
Closing Balance December 31st 178,947 203,327 190,707 215,087 379,467 258,847 143,227 167,607 191,987 216,367 375,747
HALDIMAND COUNTY
FORECAST OF CRR-AMBULANCE
FOR THE YEARS 2013 TO 2022
78

APPENDIX B
2012 2013 2014 2015 2016 2017 2018 2019 2020 2021 2022
$ $ $ $ $ $ $ $ $ $ $
Opening Balance January 1st 168,152 187,482 164,482 34,482 (5,518) 34,482 74,482 114,482 154,482 194,482 234,482
Source of Funds:
Budgeted Contribution 75,000 75,000 75,000 75,000 75,000 75,000 75,000 75,000 75,000 75,000 75,000
Total Source of Funds 75,000 75,000 75,000 75,000 75,000 75,000 75,000 75,000 75,000 75,000 75,000
Use of Funds:
Commitment for Active Projects 55,670
Contribution to State of Good Repair Projects 98,000 205,000 115,000 35,000 35,000 35,000 35,000 35,000 35,000 35,000
Contribution to New Initiatives/Enhanced Service Projects
Total Use of Funds 55,670 98,000 205,000 115,000 35,000 35,000 35,000 35,000 35,000 35,000 35,000
Closing Balance December 31st 187,482 164,482 34,482 (5,518) 34,482 74,482 114,482 154,482 194,482 234,482 274,482
HALDIMAND COUNTY
FORECAST OF CRR - COMMUNITY HALLS
FOR THE YEARS 2013 TO 2022
79

APPENDIX B
2012 2013 2014 2015 2016 2017 2018 2019 2020 2021 2022
$ $ $ $ $ $ $ $ $ $ $
FOR THE YEARS 2013 TO 2022
HALDIMAND COUNTY
FORECAST OF CRR-FIRE FLEET
$ $ $ $ $ $ $ $ $ $ $
Opening Balance January 1st 633,297 228,357 748,437 778,017 1,078,097 1,556,177 2,039,257 2,559,337 2,906,917 2,582,997 3,103,077
Source of Funds:
Budgeted Contribution 592,860 520,080 520,080 520,080 520,080 520,080 520,080 520,080 520,080 520,080 520,080
Additional One-time contribution 346,200
Total Source of Funds 939,060 520,080 520,080 520,080 520,080 520,080 520,080 520,080 520,080 520,080 520,080
Use of Funds:
Commitment for Active Projects
Contribution to State of Good Repair Projects 1,344,000 490,500 220,000 42,000 37,000 172,500 844,000 557,000
Contribution to New Initiatives/Enhanced Service Projects
Total Use of Funds 1,344,000 0 490,500 220,000 42,000 37,000 0 172,500 844,000 0 557,000
Closing Balance December 31st 228,357 748,437 778,017 1,078,097 1,556,177 2,039,257 2,559,337 2,906,917 2,582,997 3,103,077 3,066,157
80

APPENDIX B
2012 2013 2014 2015 2016 2017 2018 2019 2020 2021 2022
$ $ $ $ $ $ $ $ $ $ $
HALDIMAND COUNTY
FORECAST OF CAPITAL REPLACEMENT RESERVE - GENERAL
FOR THE YEARS 2013 TO 2022
$ $ $ $ $ $ $ $ $ $ $
Opening Balance January 1st 10,967,026 9,211,291 6,790,172 6,349,142 5,141,742 5,220,322 5,370,172 6,187,472 7,307,772 8,127,772 9,140,012
Source of Funds:
Budgeted Contribution 1,986,600 1,986,600 1,986,600 1,986,600 1,986,600 1,986,600 1,986,600 1,986,600 1,986,600 1,986,600 1,986,600
Additional Contribution for Fire/EMS fac ramp up (12 & 13) 250,000 250,000
Increase for Firehalls (.25% of Capital levy (12 & 13) 125,000 125,000
Total Source of Funds 2,361,600 2,361,600 1,986,600 1,986,600 1,986,600 1,986,600 1,986,600 1,986,600 1,986,600 1,986,600 1,986,600
Use of Funds:
Commitment for Active Projects 4,117,335
Contribution to State of Good Repair Projects 1,974,929 1,705,400 2,001,800 1,810,460 1,621,550 1,107,100 829,100 1,004,400 937,160 1,790,800
Contribution to New Initiatives/Enhanced Service Projects 2,807,790 722,230 1,192,200 97,560 215,200 62,200 37,200 162,200 37,200 52,200
Total Use of Funds 4,117,335 4,782,719 2,427,630 3,194,000 1,908,020 1,836,750 1,169,300 866,300 1,166,600 974,360 1,843,000
Closing Balance December 31st 9,211,291 6,790,172 6,349,142 5,141,742 5,220,322 5,370,172 6,187,472 7,307,772 8,127,772 9,140,012 9,283,612
81

APPENDIX B
2012 2013 2014 2015 2016 2017 2018 2019 2020 2021 2022
$ $ $ $ $ $ $ $ $ $ $
HALDIMAND COUNTY
FORECAST OF CRR-INFORMATION TECHNOLOGY
FOR THE YEARS 2013 TO 2022
$ $ $ $ $ $ $ $ $ $ $
Opening Balance January 1st 832,775 803,772 1,041,432 997,892 790,752 889,712 1,160,672 1,022,932 945,392 987,752 1,175,212
Source of Funds:
Budgeted Contribution 396,660 435,960 435,960 435,960 435,960 435,960 435,960 435,960 435,960 435,960 435,960
Total Source of Funds 396,660 435,960 435,960 435,960 435,960 435,960 435,960 435,960 435,960 435,960 435,960
Use of Funds:
Commitment for Active Projects 425,663
Contribution to State of Good Repair Projects 153,300 444,500 588,100 332,000 160,000 493,700 508,500 388,600 243,500 289,000
Contribution to New Initiatives/Enhanced Service Projects 45,000 35,000 55,000 5,000 5,000 80,000 5,000 5,000 5,000 5,000
Total Use of Funds 425,663 198,300 479,500 643,100 337,000 165,000 573,700 513,500 393,600 248,500 294,000
Closing Balance December 31st 803,772 1,041,432 997,892 790,752 889,712 1,160,672 1,022,932 945,392 987,752 1,175,212 1,317,172
82

APPENDIX B
2012 2013 2014 2015 2016 2017 2018 2019 2020 2021 2022
$ $ $ $ $ $ $ $ $ $ $
Opening Balance January 1st 1,079,026 893,636 818,866 950,696 889,576 1,082,556 1,149,736 1,294,666 1,140,046 1,242,776 1,206,856
Source of Funds:
Budgeted Contribution 225,310 228,780 228,780 228,780 228,780 228,780 228,780 228,780 228,780 228,780 228,780
Total Source of Funds 225,310 228,780 228,780 228,780 228,780 228,780 228,780 228,780 228,780 228,780 228,780
Use of Funds:
Commitment for Active Projects 410,700
Contribution to State of Good Repair Projects 293,550 96,950 289,900 35,800 161,600 83,850 383,400 126,050 264,700 399,750
Contribution to New Initiatives/Enhanced Service Projects 10,000
Total Use of Funds 410,700 303,550 96,950 289,900 35,800 161,600 83,850 383,400 126,050 264,700 399,750
Closing Balance December 31st 893,636 818,866 950,696 889,576 1,082,556 1,149,736 1,294,666 1,140,046 1,242,776 1,206,856 1,035,886
HALDIMAND COUNTY
FORECAST OF CRR-OTHER FLEET
FOR THE YEARS 2013 TO 2022
83

APPENDIX B
2012 2013 2014 2015 2016 2017 2018 2019 2020 2021 2022
HALDIMAND COUNTY
FORECAST OF CRR-ROADS EQUIPMENT
FOR THE YEARS 2013 TO 2022
2012 2013 2014 2015 2016 2017 2018 2019 2020 2021 2022
$ $ $ $ $ $ $ $ $ $ $
Opening Balance January 1st 1,970,572 749,258 1,159,958 1,620,808 2,109,308 1,616,108 1,388,008 1,812,058 630,108 919,158 1,292,858
Source of Funds:
Budgeted Contribution 861,395 858,600 858,600 858,600 858,600 858,600 858,600 858,600 858,600 858,600 858,600
Total Source of Funds 861,395 858,600 858,600 858,600 858,600 858,600 858,600 858,600 858,600 858,600 858,600
Use of Funds:
Commitment for Active Projects 2,082,709
Contribution to State of Good Repair Projects 425,900 397,750 370,100 1,351,800 1,086,700 434,550 2,040,550 569,550 484,900 202,450
Contribution to New Initiatives/Enhanced Service Projects 22,000
Total Use of Funds 2,082,709 447,900 397,750 370,100 1,351,800 1,086,700 434,550 2,040,550 569,550 484,900 202,450
Closing Balance December 31st 749,258 1,159,958 1,620,808 2,109,308 1,616,108 1,388,008 1,812,058 630,108 919,158 1,292,858 1,949,008
84

APPENDIX B
2012 2013 2014 2015 2016 2017 2018 2019 2020 2021 2022
$ $ $ $ $ $ $ $ $ $ $
HALDIMAND COUNTY
FORECAST OF CRR-ROADS INFRASTRUCTURE
FOR THE YEARS 2013 TO 2022
$ $ $ $ $ $ $ $ $ $ $
Opening Balance January 1st 8,578,207 4,120,844 1,247,844 (597,936) 1,134,884 1,400,534 2,035,484 3,290,784 4,915,084 7,852,904 11,412,064
Source of Funds:
Budgeted Contribution 6,886,000 6,886,000 6,886,000 6,886,000 6,886,000 6,886,000 6,886,000 6,886,000 6,886,000 6,886,000 6,886,000
Additional Contributions 1,042,000 500,000 500,000 500,000 500,000 500,000 500,000 500,000 500,000 500,000 500,000
Total Source of Funds 7,928,000 7,386,000 7,386,000 7,386,000 7,386,000 7,386,000 7,386,000 7,386,000 7,386,000 7,386,000 7,386,000
Use of Funds:
Commitment for Active Projects 12,385,363
Contribution to State of Good Repair Projects 10,000,500 7,458,500 5,603,000 7,080,350 6,711,050 6,090,700 5,721,700 3,811,680 3,786,840 3,874,210
Contribution to New Initiatives/Enhanced Service Projects 258,500 1,773,280 50,180 40,000 40,000 40,000 40,000 636,500 40,000 40,000
Total Use of Funds 12,385,363 10,259,000 9,231,780 5,653,180 7,120,350 6,751,050 6,130,700 5,761,700 4,448,180 3,826,840 3,914,210
Closing Balance December 31st 4,120,844 1,247,844 (597,936) 1,134,884 1,400,534 2,035,484 3,290,784 4,915,084 7,852,904 11,412,064 14,883,854
85

APPENDIX B
2012 2013 2014 2015 2016 2017 2018 2019 2020 2021 2022
$ $ $ $ $ $ $ $ $ $ $
Opening Balance January 1st 2,293,253 1,938,899 2,082,899 1,642,899 2,012,899 2,382,899 2,423,099 1,513,099 1,083,099 1,325,599 1,695,599
Source of Funds:
Budgeted Contribution 1,000,000 1,000,000 1,000,000 1,000,000 1,000,000 1,000,000 1,000,000 1,000,000 1,000,000 1,000,000 1,000,000
Additional Contribution (500,000) (500,000) (500,000) (500,000) (500,000) (500,000) (500,000) (500,000) (500,000) (500,000)
Total Source of Funds 1,000,000 500,000 500,000 500,000 500,000 500,000 500,000 500,000 500,000 500,000 500,000
Use of Funds:
Commitment for Active Projects 1,354,355
Contribution to State of Good Repair Projects 210,000 630,000 130,000 130,000 234,800 1,410,000 930,000 130,000 130,000 130,000
Contribution to New Initiatives/Enhanced Service Projects 146,000 310,000 225,000 127,500
Total Use of Funds 1,354,355 356,000 940,000 130,000 130,000 459,800 1,410,000 930,000 257,500 130,000 130,000
Closing Balance December 31st 1,938,899 2,082,899 1,642,899 2,012,899 2,382,899 2,423,099 1,513,099 1,083,099 1,325,599 1,695,599 2,065,599
HALDIMAND COUNTY
FORECAST OF CRR-STORM SEWER
FOR THE YEARS 2013 TO 2022
86

APPENDIX B
2012 2013 2014 2015 2016 2017 2018 2019 2020 2021 2022
$ $ $ $ $ $ $ $ $ $ $
HALDIMAND COUNTY
FORECAST OF COMMUNITY PARTNERSHIP CAPITAL PROGRAM RESERVE
FOR THE YEARS 2013 TO 2022
$ $ $ $ $ $ $ $ $ $ $
Opening Balance January 1st 138,880 186,886 114,886 89,886 89,886 89,886 89,886 89,886 89,886 66,886 66,886
Source of Funds:
Budgeted Contribution 150,000 150,000 150,000 150,000 150,000 150,000 150,000 150,000 150,000 150,000 150,000
Total Source of Funds 150,000 150,000 150,000 150,000 150,000 150,000 150,000 150,000 150,000 150,000 150,000
Use of Funds:
Yearly Placeholder for projects 150,000 150,000 150,000 150,000 150,000 150,000 150,000 150,000 150,000 150,000
Commitment for Active Projects 101,994 72,000 25,000
Contribution to State of Good Repair Projects 23,000
Contribution to New Initiatives/Enhanced Service Projects
Total Use of Funds 101,994 222,000 175,000 150,000 150,000 150,000 150,000 150,000 173,000 150,000 150,000
Closing Balance December 31st 186,886 114,886 89,886 89,886 89,886 89,886 89,886 89,886 66,886 66,886 66,886
87

APPENDIX B
2012 2013 2014 2015 2016 2017 2018 2019 2020 2021 2022
$ $ $ $ $ $ $ $ $ $ $
Opening Balance January 1st 2,977,321 677,710 677,710 677,710 677,710 677,710 677,710 677,710 677,710 677,710 677,710
Source of Funds:
Budgeted Contribution 0 0 0 0 0 0 0 0 0 0
Total Source of Funds 0 0 0 0 0 0 0 0 0 0 0
Use of Funds:
Commitment for Active Projects 299,611
Contribution to Accelerated Projects (CAO-01-2012) 2,000,000
Contribution to State of Good Repair Projects
Contribution to New Initiatives/Enhanced Service Projects
Total Use of Funds 2,299,611 0 0 0 0 0 0 0 0 0 0
Closing Balance December 31st 677,710 677,710 677,710 677,710 677,710 677,710 677,710 677,710 677,710 677,710 677,710
HALDIMAND COUNTY
FORECAST OF ROADS DEVELOPMENT RESERVE
FOR THE YEARS 2013 TO 2022
88

APPENDIX B
2012 2013 2014 2015 2016 2017 2018 2019 2020 2021 2022
$ $ $ $ $ $ $ $ $ $ $
Opening Balance January 1st 4,754,577 3,290,888 3,179,044 (693,320) 210,116 (277,108) 305,049 512,325 2,277,961 1,500,577 270,913
HALDIMAND COUNTY
FORECAST OF FEDERAL GAS TAX REVENUE RESERVE FUND
FOR THE YEARS 2013 TO 2022
Opening Balance January 1st 4,754,577 3,290,888 3,179,044 (693,320) 210,116 (277,108) 305,049 512,325 2,277,961 1,500,577 270,913
Source of Funds:
Budgeted Contribution 2,773,756 2,773,756 2,773,756 2,773,756 2,773,756 2,773,756 2,773,756 2,773,756 2,773,756 2,773,756 2,773,756
Interest Earned
Total Source of Funds 2,773,756 2,773,756 2,773,756 2,773,756 2,773,756 2,773,756 2,773,756 2,773,756 2,773,756 2,773,756 2,773,756
Use of Funds:
Commitment for Active Projects 4,237,446
Contribution to State of Good Repair Projects (Tax Supported) 800,000
Contribution to New Initiatives/Enhanced Service Projects (Tax Supported) 1,183,600 4,276,120 1,337,320 671,980 646,600 819,480 1,008,120 1,066,140 1,278,420 1,856,540
Contribution to New Initiatives/Enhanced Service Projects (Water) 390,000
Contribution to State of Good Repair Projects (Water) 452,000 1,620,000 283,000 2,339,000 1,155,000 1,747,000 2,485,000 2,335,000 360,000
Contribution to State of Good Repair Projects (Wastewater) 450,000 750,000 250,000 250,000 390,000
Total Use of Funds 4,237,446 2,885,600 6,646,120 1,870,320 3,260,980 2,191,600 2,566,480 1,008,120 3,551,140 4,003,420 2,216,540
Closing Balance December 31st 3,290,888 3,179,044 (693,320) 210,116 (277,108) 305,049 512,325 2,277,961 1,500,577 270,913 828,130
89

APPENDIX B
2012 2013 2014 2015 2016 2017 2018 2019 2020 2021 2022
$ $ $ $ $ $ $ $ $ $ $
Opening Balance January 1st 289,938 164,694 122,294 63,594 (114,306) (154,306) (144,906) (135,506) (144,106) (293,506) (274,106)
Source of Funds:
Budgeted Contribution 19,400 19,400 19,400 19,400 19,400 19,400 19,400 19,400 19,400 19,400 19,400
Other Contributions from Operations (Library Materials) 139,190 174,990 174,990 174,990 174,990 174,990 174,990 174,990 174,990 174,990 174,990
Interest Earned
Total Source of Funds 158,590 194,390 194,390 194,390 194,390 194,390 194,390 194,390 194,390 194,390 194,390
Use of Funds:
Commitment for Active Projects 283,833
Contribution to State of Good Repair Projects 228,990 214,990 366,890 233,990 184,990 184,990 202,990 343,790 174,990 192,990
Contribution to New Initiatives/Enhanced Service Projects 7,800 38,100 5,400 400
Total Use of Funds 283,833 236,790 253,090 372,290 234,390 184,990 184,990 202,990 343,790 174,990 192,990
Closing Balance December 31st 164,694 122,294 63,594 (114,306) (154,306) (144,906) (135,506) (144,106) (293,506) (274,106) (272,706)
HALDIMAND COUNTY
FORECAST OF LIBRARY RESERVE FUND
FOR THE YEARS 2013 TO 2022
90

APPENDIX B
2012 2013 2014 2015 2016 2017 2018 2019 2020 2021 2022
$ $ $ $ $ $ $ $ $ $ $
Opening Balance January 1st 44,571 44,571 (0) (0) (0) (0) (0) (0) (0) (0) (0)
Source of Funds:
Budgeted Contribution
Interest Earned
Total Source of Funds 0 0 0 0 0 0 0 0 0 0 0
Use of Funds:
Commitment for Active Projects
Contribution to State of Good Repair Projects 44,571
Contribution to New Initiatives/Enhanced Service Projects
Total Use of Funds 0 44,571 0 0 0 0 0 0 0 0 0
Closing Balance December 31st 44,571 (0) (0) (0) (0) (0) (0) (0) (0) (0) (0)
HALDIMAND COUNTY
FORECAST OF MUSEUM RESERVE FUND
FOR THE YEARS 2013 TO 2022
91

APPENDIX B
2012 2013 2014 2015 2016 2017 2018 2019 2020 2021 2022
$ $ $ $ $ $ $ $ $ $ $
HALDIMAND COUNTY
FORECAST OF PARK DEDICATION RESERVE FUND
FOR THE YEARS 2013 TO 2022
$ $ $ $ $ $ $ $ $ $ $
Opening Balance January 1st 720,282 731,704 687,804 453,764 453,764 453,764 453,764 453,764 453,764 453,764 453,764
Source of Funds:
Budgeted Contribution 23,050
Interest Earned
Total Source of Funds 23,050 0 0 0 0 0 0 0 0 0 0
Use of Funds:
Commitment for Active Projects 11,628
Contribution to State of Good Repair Projects
Contribution to New Initiatives/Enhanced Service Projects 43,900 234,040
Total Use of Funds 11,628 43,900 234,040 0 0 0 0 0 0 0 0
Closing Balance December 31st 731,704 687,804 453,764 453,764 453,764 453,764 453,764 453,764 453,764 453,764 453,764
92

APPENDIX B
2012 2013 2014 2015 2016 2017 2018 2019 2020 2021 2022
HALDIMAND COUNTY
FORECAST OF LAND SALES RESERVE
FOR THE YEARS 2013 TO 2022
2012 2013 2014 2015 2016 2017 2018 2019 2020 2021 2022
$ $ $ $ $ $ $ $ $ $ $
Opening Balance January 1st 163,080 211,357 211,357 211,357 211,357 211,357 211,357 211,357 211,357 211,357 211,357
Source of Funds:
Budgeted Contribution 65,000
Total Source of Funds 65,000 0 0 0 0 0 0 0 0 0 0
Use of Funds:
Commitment for Active Projects 16,722
Contribution to State of Good Repair Projects
Contribution to New Initiatives/Enhanced Service Projects
Total Use of Funds 16,722 0 0 0 0 0 0 0 0 0 0
Closing Balance December 31st 211,357 211,357 211,357 211,357 211,357 211,357 211,357 211,357 211,357 211,357 211,357
93

APPENDIX B
2012 2013 2014 2015 2016 2017 2018 2019 2020 2021 2022
$ $ $ $ $ $ $ $ $ $ $
Opening Balance January 1st 333,016 147,116 149,996 144,696 170,556 176,346 178,796 183,696 213,046 240,326 263,666
Source of Funds:
Contribution from Land Sales
Budgeted Contributions 44,000 44,000 44,000 44,000 44,000 44,000 44,000 44,000 44,000 44,000 44,000
Total Source of Funds 44,000 44,000 44,000 44,000 44,000 44,000 44,000 44,000 44,000 44,000 44,000
Use of Funds:
Commitment for Active Projects 229,900
Contribution to State of Good Repair Projects 41,120 49,300 18,140 38,210 41,550 39,100 14,650 16,720 20,660 109,290
Contribution to New Initiatives/Enhanced Service Projects
Total Use of Funds 229,900 41,120 49,300 18,140 38,210 41,550 39,100 14,650 16,720 20,660 109,290
Closing Balance December 31st 147,116 149,996 144,696 170,556 176,346 178,796 183,696 213,046 240,326 263,666 198,376
HALDIMAND COUNTY
FORECAST OF DRAIN FUND
FOR THE YEARS 2013 TO 2022
94
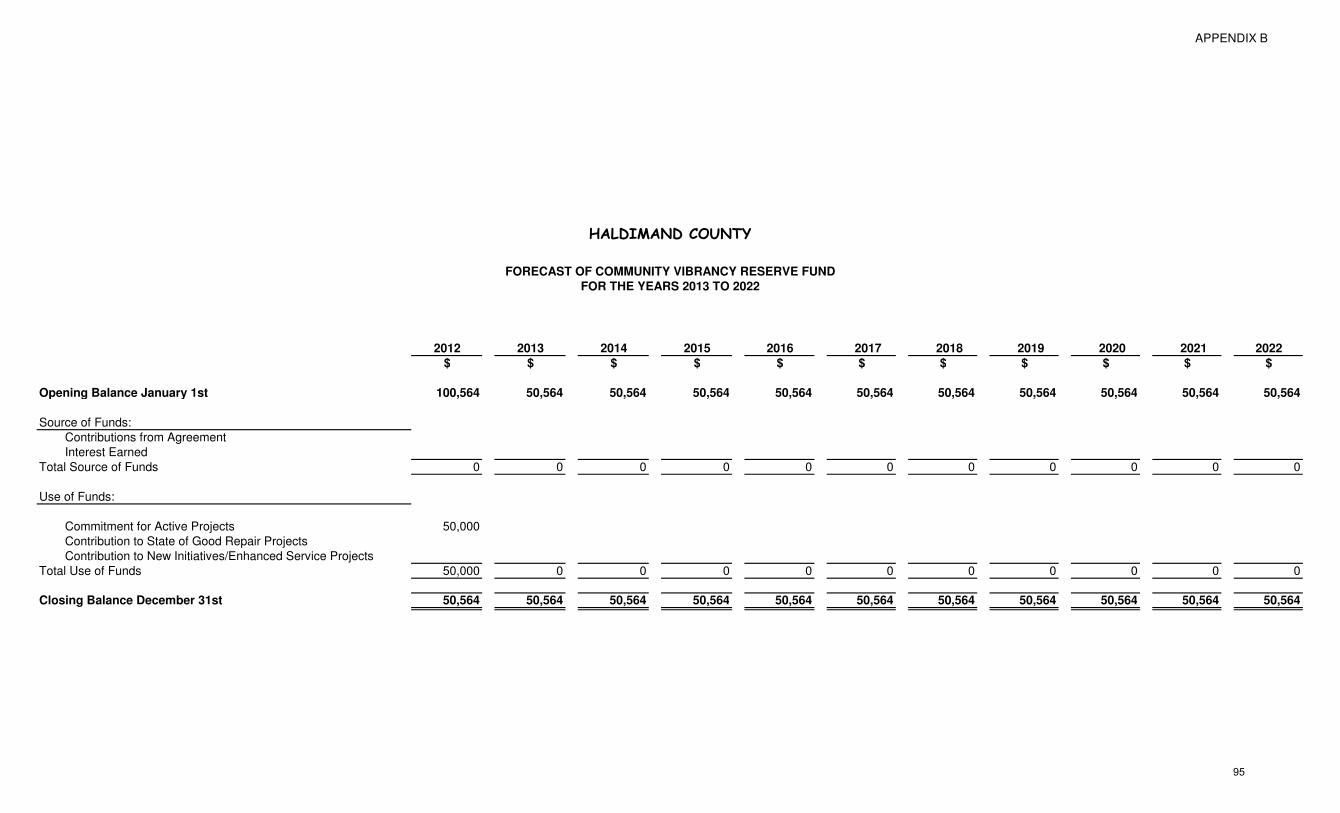
APPENDIX B
2012 2013 2014 2015 2016 2017 2018 2019 2020 2021 2022
$ $ $ $ $ $ $ $ $ $ $
Opening Balance January 1st 100,564 50,564 50,564 50,564 50,564 50,564 50,564 50,564 50,564 50,564 50,564
Source of Funds:
Contributions from Agreement
Interest Earned
Total Source of Funds 0 0 0 0 0 0 0 0 0 0 0
Use of Funds:
Commitment for Active Projects 50,000
Contribution to State of Good Repair Projects
Contribution to New Initiatives/Enhanced Service Projects
Total Use of Funds 50,000 0 0 0 0 0 0 0 0 0 0
Closing Balance December 31st 50,564 50,564 50,564 50,564 50,564 50,564 50,564 50,564 50,564 50,564 50,564
FORECAST OF COMMUNITY VIBRANCY RESERVE FUND
HALDIMAND COUNTY
FOR THE YEARS 2013 TO 2022
95

APPENDIX B
2012 2013 2014 2015 2016 2017 2018 2019 2020 2021 2022
$ $ $ $ $ $ $ $ $ $ $
Opening Balance January 1st 2,971,559 2,953,761 3,174,461 507,961 730,161 1,253,661 1,730,111 1,625,511 2,152,511 2,578,511 3,064,611
Source of Funds:
Budgeted Contribution 583,000 583,000 583,000 583,000 583,000 583,000 583,000 583,000 583,000 583,000 583,000
Other Contributions from Operations
Interest Earned
Total Source of Funds 583,000 583,000 583,000 583,000 583,000 583,000 583,000 583,000 583,000 583,000 583,000
Use of Funds:
Contribution to Operations 7,480
Commitment for Active Projects 593,318
Contribution to State of Good Repair Projects 147,300 57,800 360,800 59,500 56,550 662,600 56,000 57,000 96,900 60,200
Contribution to New Initiatives/Enhanced Service Projects 215,000 3,191,700 50,000 25,000 100,000
Total Use of Funds 600,798 362,300 3,249,500 360,800 59,500 106,550 687,600 56,000 157,000 96,900 60,200
Closing Balance December 31st 2,953,761 3,174,461 507,961 730,161 1,253,661 1,730,111 1,625,511 2,152,511 2,578,511 3,064,611 3,587,411
FOR THE YEARS 2013 TO 2022
HALDIMAND COUNTY
FORECAST OF WASTE MANAGEMENT RESERVE FUND
96

APPENDIX C
Based on Current Contributions 2013 2014 2015 2016 2017 2018 2019 2020 2021 2022
$ $ $ $ $ $ $ $ $ $
DCRF - Ambulance Services (131,771) (133,524) (135,271) (136,912) (139,558) (142,146) (144,673) (147,339) (150,152) (153,119)
DCRF - Fire Services (456,239) (351,906) (236,645) (110,874) 1,363 123,206 254,705 390,808 531,673 677,469
DCRF - General Government 41,968 (54,915) (161,097) (148,834) (145,929) (112,237) (33,246) 50,091 137,009 137,009
DCRF - Leisure Services 2,047,095 2,211,336 2,406,967 2,544,426 2,681,506 2,754,295 2,842,784 3,026,022 3,124,021 3,317,102
DCRF - Library Services 66,994 (101,123) 28,439 169,239 301,638 442,638 590,915 744,380 903,217 1,067,614
DCRF - Public Works - Buildings & Fleet 123,861 174,900 228,844 285,388 335,975 388,841 447,627 508,471 571,445 636,623
DCRF - Roads & Related (883,364) (773,423) (537,166) (313,607) (2,035,478) (1,933,144) (1,779,597) (2,266,384) (2,149,837) (2,268,078)
DCRF - Stormwater (497,531) (903,221) (894,798) (914,708) (1,171,545) (1,542,483) (1,777,437) (1,997,058) (2,082,578) (2,142,276)
Total 311,015 68,125 699,272 1,374,118 (172,027) (21,029) 401,079 308,991 884,799 1,272,343
NOTE: Includes interest earnings and/or financing charges based on DC Background Study formula
NOTE: Forecast calculated using 2013 to 2022 Tax Supported Capital Forecast and 2012 to 2021 Rate Supported Capital Forecast
NOTE: Development Charges revenue forecasts are provided by the Development Charges Background Study 2009
Per DC Background Study July 10, 2009 2013 2014 2015 2016 2017 2018 2019 2020 2021 2022
$ $ $ $ $ $ $ $ $ $
DCRF - Ambulance Services (17,600) (17,200) (12,600) (7,500) (3,000) 1,900 0 0 0 0
DCRF - Fire Services (548,600) (449,200) (339,300) (219,200) (113,000) 2,600 0 0 0 0
DCRF - General Government (231,000) (229,100) (163,100) (147,500) (76,400) 900 0 0 0 0
DCRF - Leisure Services (3,276,600) (2,692,900) (2,051,400) (1,348,100) (702,900) 500 0 0 0 0
DCRF - Library Services (329,700) (269,000) (201,700) (127,000) (66,500) 300 0 0 0 0
DCRF - Public Works - Buildings & Fleet 9,900 10,200 11,500 13,500 7,400 1,300 0 0 0 0
DCRF - Roads & Related (133,100) (1,344,700) (1,139,800) (1,616,200) (1,999,300) (1,856,800) (1,699,000) (1,525,000) (1,333,200) (1,231,300)
DCRF - Stormwater (47,400) 5,700 (4,900) (95,300) (31,800) 400 0 0 0 0
Total (4,574,100) (4,986,200) (3,901,300) (3,547,300) (2,985,500) (1,848,900) (1,699,000) (1,525,000) (1,333,200) (1,231,300)
HALDIMAND COUNTY
SUMMARY OF FORECASTED DEVELOPMENT CHARGES RESERVE FUNDS BALANCES for Tax Supported Capital Forecast
FOR THE YEARS 2013 TO 2022
97

APPENDIX C
2012 2013 2014 2015 2016 2017 2018 2019 2020 2021 2022
$ $ $ $ $ $ $ $ $ $ $
Opening Balance January 1st 29,400 35,517 (131,771) (133,524) (135,271) (136,912) (139,558) (142,146) (144,673) (147,339) (150,152)
Source of Funds:
Actual Receipts to Dec 31, 2010
Receipts expected per DC study 5,000 5,100 5,400 5,500 5,700 4,800 5,000 5,200 5,200 5,200 5,200
Interest Earned 1,117 (3,267) (7,153) (7,248) (7,340) (7,446) (7,588) (7,727) (7,866) (8,013) (8,167)
Total Source of Funds 6,117 1,833 (1,753) (1,748) (1,640) (2,646) (2,588) (2,527) (2,666) (2,813) (2,967)
Use of Funds:
DC debt repayment
Proposed Projects-Capital Forecast (Tax) 169,120
Proposed Projects-Capital Forecast (WWW)
Total Use of Funds 0 169,120 0 0 0 0 0 0 0 0 0
Closing Balance December 31st 35,517 (131,771) (133,524) (135,271) (136,912) (139,558) (142,146) (144,673) (147,339) (150,152) (153,119)
Closing Cash Balance per DC Background Study
July 10, 2009 (25,300) (21,600) (17,200) (12,600) (7,500) (3,000) 1,900
HALDIMAND COUNTY
DEVELOPMENT CHARGES RESERVE FUND - AMBULANCE
FOR THE YEARS 2013 TO 2022
98

APPENDIX C
2012 2013 2014 2015 2016 2017 2018 2019 2020 2021 2022
$ $ $ $ $ $ $ $ $ $ $
Opening Balance January 1st 554,904 696,121 (456,239) (351,906) (236,645) (110,874) 1,363 123,206 254,705 390,808 531,673
Source of Funds:
Actual Receipts to Dec. 31, 2010
Receipts expected per DC study 119,700 123,400 127,200 132,300 136,400 116,300 119,700 125,000 125,000 125,000 125,000
Interest Earned 21,516 (7,130) (22,867) (17,040) (10,628) (4,063) 2,142 6,500 11,102 15,866 20,796
Total Source of Funds 141,216 116,270 104,333 115,260 125,772 112,237 121,842 131,500 136,102 140,866 145,796
Use of Funds:
DC debt repayment
Proposed Projects-Capital Forecast (Tax) 1,268,630
Proposed Projects-Capital Forecast (WWW)
Total Use of Funds 0 1,268,630 0 0 0 0 0 0 0 0 0
Closing Balance December 31st 696,121 (456,239) (351,906) (236,645) (110,874) 1,363 123,206 254,705 390,808 531,673 677,469
Closing Cash Balance per DC Background Study
July 10, 2009 (638,900) (548,600) (449,200) (339,300) (219,200) (113,000) 2,600
HALDIMAND COUNTY
DEVELOPMENT CHARGES RESERVE FUND - FIRE
FOR THE YEARS 2013 TO 2022
99

APPENDIX C
2012 2013 2014 2015 2016 2017 2018 2019 2020 2021 2022
$ $ $ $ $ $ $ $ $ $ $
Opening Balance January 1st (69,941) 7,714 41,968 (54,915) (161,097) (148,834) (145,929) (112,237) (33,246) 50,091 137,009
Source of Funds:
Actual Receipts to Dec. 31, 2010
Receipts expected per DC study 80,100 82,500 85,100 88,600 91,400 77,900 80,100 83,700 83,700 83,700 83,700
Interest Earned (2,445) 854 (1,163) (5,781) (8,497) (7,995) (7,309) (4,708) (364) 3,218 6,260
Total Source of Funds 77,655 83,354 83,937 82,819 82,903 69,905 72,791 78,992 83,336 86,918
Use of Funds:
DC debt repayment
Proposed Projects-Capital Forecast (Tax) 49,100 180,820 189,000 70,640 67,000 39,100
Proposed Projects-Capital Forecast (WWW)
Total Use of Funds 0 49,100 180,820 189,000 70,640 67,000 39,100 0 0 0 0
Closing Balance December 31st 7,714 41,968 (54,915) (161,097) (148,834) (145,929) (112,237) (33,246) 50,091 137,009 137,009
Closing Cash Balance per DC Background Study
July 10, 2009 (251,500) (231,000) (229,100) (163,100) (147,500) (76,400) 900
HALDIMAND COUNTY
DEVELOPMENT CHARGES RESERVE FUND - GENERAL GOVERNMENT
FOR THE YEARS 2013 TO 2022
100

APPENDIX C
2012 2013 2014 2015 2016 2017 2018 2019 2020 2021 2022
$ $ $ $ $ $ $ $ $ $ $
Opening Balance January 1st 1,379,774 1,912,396 2,047,095 2,211,336 2,406,967 2,544,426 2,681,506 2,754,295 2,842,784 3,026,022 3,124,021
Source of Funds:
Actual Receipts to Dec. 31, 2010
Receipts expected per DC study 702,800 726,400 750,800 776,000 802,100 707,000 729,300 742,100 742,100 742,100 742,100
Interest Earned 56,622 68,099 73,241 79,430 85,159 89,881 93,289 96,189 100,938 105,699 110,781
Total Source of Funds 759,422 794,499 824,041 855,430 887,259 796,881 822,589 838,289 843,038 847,799 852,881
Use of Funds:
DC debt repayment 176,800 634,800 634,800 634,800 634,800 634,800 634,800 634,800 634,800 634,800 634,800
Proposed Projects-Capital Forecast (Tax) 50,000 25,000 25,000 25,000 115,000 25,000 115,000 115,000 25,000 115,000 25,000
Proposed Projects-Capital Forecast (WWW)
Total Use of Funds 226,800 659,800 659,800 659,800 749,800 659,800 749,800 749,800 659,800 749,800 659,800
Closing Balance December 31st 1,912,396 2,047,095 2,211,336 2,406,967 2,544,426 2,681,506 2,754,295 2,842,784 3,026,022 3,124,021 3,317,102
Debt repayment includes annual debt repayment of $176,800 for HCCC and starting in 2013 proposed annual debt repayments for Cayuga ($276,000) and Dunnville ($182,000)
Closing Cash Balance per DC Background Study
July 10, 2009 (1,558,500) (3,276,600) (2,692,900) (2,051,400) (1,348,100) (702,900) 500
HALDIMAND COUNTY
DEVELOPMENT CHARGES RESERVE FUND - LEISURE SERVICES
FOR THE YEARS 2013 TO 2022
101

APPENDIX C
2012 2013 2014 2015 2016 2017 2018 2019 2020 2021 2022
$ $ $ $ $ $ $ $ $ $ $
Opening Balance January 1st 141,086 260,798 66,994 (101,123) 28,439 169,239 301,638 442,638 590,915 744,380 903,217
Source of Funds:
Actual Receipts to Dec. 31, 2010
Receipts expected per DC study 123,600 127,700 132,000 136,400 141,000 124,300 128,200 130,500 130,500 130,500 130,500
Interest Earned 6,912 3,697 (2,217) (3,238) 3,400 8,099 12,801 17,776 22,966 28,337 33,896
Total Source of Funds 130,512 131,397 129,783 133,162 144,400 132,399 141,001 148,276 153,466 158,837 164,396
Use of Funds:
DC debt repayment
Proposed Projects-Capital Forecast (Tax) 10,800 325,200 297,900 3,600 3,600
Proposed Projects-Capital Forecast (WWW)
Total Use of Funds 10,800 325,200 297,900 3,600 3,600 0 0 0 0 0 0
Closing Balance December 31st 260,798 66,994 (101,123) 28,439 169,239 301,638 442,638 590,915 744,380 903,217 1,067,614
Closing Cash Balance per DC Background Study
July 10, 2009 (384,100) (329,700) (269,000) (201,700) (127,000) (66,500) 300
HALDIMAND COUNTY
DEVELOPMENT CHARGES RESERVE FUND - LIBRARY
FOR THE YEARS 2013 TO 2022
102
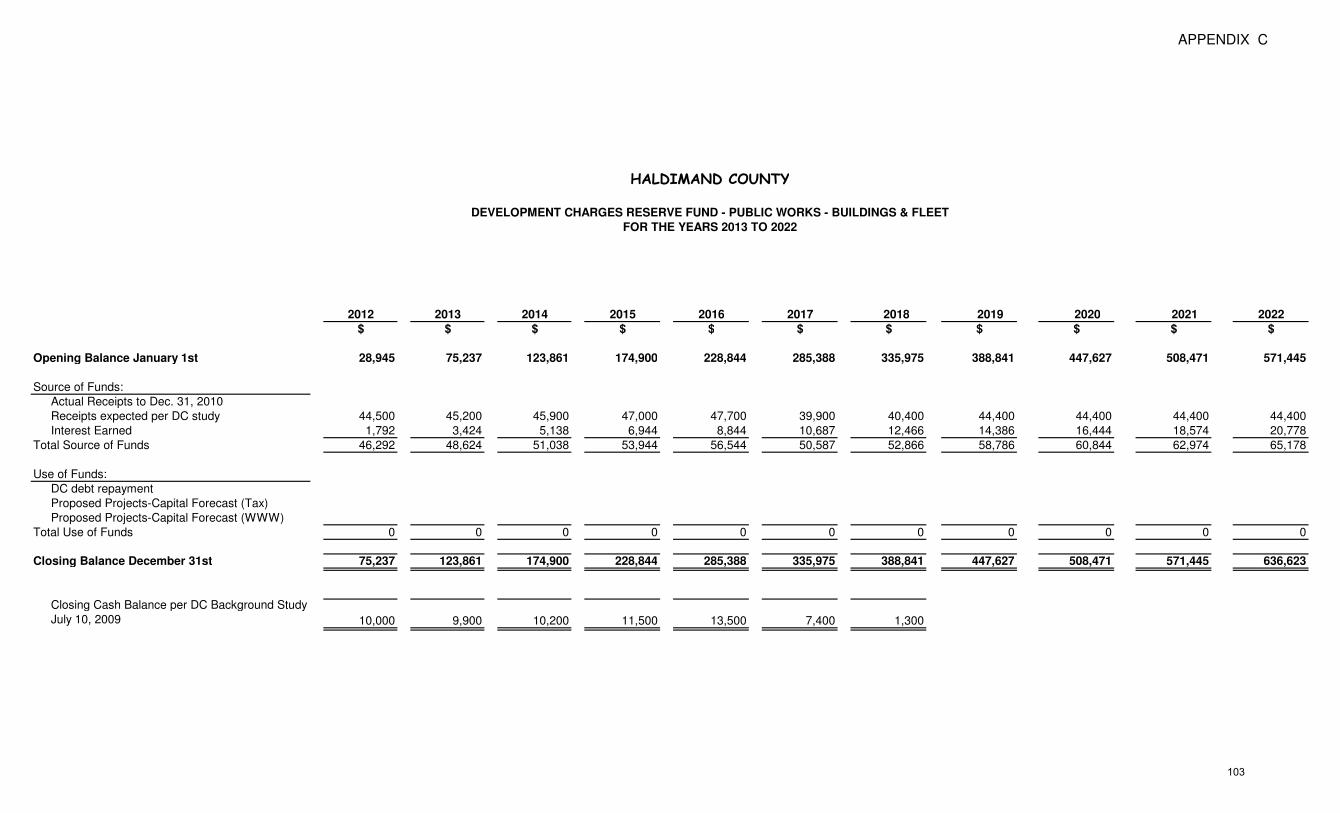
APPENDIX C
2012 2013 2014 2015 2016 2017 2018 2019 2020 2021 2022
$ $ $ $ $ $ $ $ $ $ $
Opening Balance January 1st 28,945 75,237 123,861 174,900 228,844 285,388 335,975 388,841 447,627 508,471 571,445
Source of Funds:
Actual Receipts to Dec. 31, 2010
Receipts expected per DC study 44,500 45,200 45,900 47,000 47,700 39,900 40,400 44,400 44,400 44,400 44,400
Interest Earned 1,792 3,424 5,138 6,944 8,844 10,687 12,466 14,386 16,444 18,574 20,778
Total Source of Funds 46,292 48,624 51,038 53,944 56,544 50,587 52,866 58,786 60,844 62,974 65,178
Use of Funds:
DC debt repayment
Proposed Projects-Capital Forecast (Tax)
Proposed Projects-Capital Forecast (WWW)
Total Use of Funds 0 0 0 0 0 0 0 0 0 0 0
Closing Balance December 31st 75,237 123,861 174,900 228,844 285,388 335,975 388,841 447,627 508,471 571,445 636,623
Closing Cash Balance per DC Background Study
July 10, 2009 10,000 9,900 10,200 11,500 13,500 7,400 1,300
HALDIMAND COUNTY
DEVELOPMENT CHARGES RESERVE FUND - PUBLIC WORKS - BUILDINGS & FLEET
FOR THE YEARS 2013 TO 2022
103

APPENDIX C
2012 2013 2014 2015 2016 2017 2018 2019 2020 2021 2022
$ $ $ $ $ $ $ $ $ $ $
Opening Balance January 1st (1,054,159) (987,188) (883,364) (773,423) (537,166) (313,607) (2,035,478) (1,933,144) (1,779,597) (2,266,384) (2,149,837)
Source of Funds:
Actual Receipts to Dec. 31, 2010
Receipts expected per DC study 247,800 255,400 263,300 274,000 282,500 241,000 248,100 255,400 263,000 270,800
Interest Earned (55,830) (51,576) (45,859) (37,743) (25,191) (62,871) (108,266) (101,853) (108,287) (120,503) (118,241)
Total Source of Funds 191,970 203,824 217,441 236,257 257,309 178,129 139,834 153,547 154,713 150,297 (118,241)
Use of Funds:
DC debt repayment
Proposed Projects-Capital Forecast (Tax) 125,000 100,000 107,500 33,750 1,900,000 37,500 641,500 33,750
Proposed Projects-Capital Forecast (WWW)
Total Use of Funds 125,000 100,000 107,500 0 33,750 1,900,000 37,500 0 641,500 33,750 0
Closing Balance December 31st (987,188) (883,364) (773,423) (537,166) (313,607) (2,035,478) (1,933,144) (1,779,597) (2,266,384) (2,149,837) (2,268,078)
Residential (237,400) (100,900) (1,130,000) (970,500) (1,384,500) (1,712,300) (1,598,200) (1,471,300) (1,330,700) (1,175,200) (1,067,500)
Non-Residential (69,900) (32,200) (214,700) (169,300) (231,700) (287,000) (258,600) (227,700) (194,300) (158,000) (163,800)Closing Cash Balance per DC Background Study
July 10, 2009 (307,300) (133,100) (1,344,700) (1,139,800) (1,616,200) (1,999,300) (1,856,800) (1,699,000) (1,525,000) (1,333,200) (1,231,300)
HALDIMAND COUNTY
DEVELOPMENT CHARGES RESERVE FUND - PUBLIC WORKS - ROADS & RELATED
FOR THE YEARS 2013 TO 2022
104

APPENDIX C
2012 2013 2014 2015 2016 2017 2018 2019 2020 2021 2022
$ $ $ $ $ $ $ $ $ $ $
Opening Balance January 1st (207,813) (396,795) (497,531) (903,221) (894,798) (914,708) (1,171,545) (1,542,483) (1,777,437) (1,997,058) (2,082,578)
Source of Funds:
Actual Receipts to Dec. 31, 2010
Receipts expected per DC study 51,600 53,200 54,800 57,100 58,800 50,200 51,700 53,900 53,900 53,900 53,900
Interest Earned (16,182) (23,936) (37,490) (48,678) (48,710) (55,836) (72,638) (88,854) (101,021) (109,420) (113,599)
Total Source of Funds 35,418 29,264 17,310 8,422 10,090 (5,636) (20,938) (34,954) (47,121) (55,520) (59,699)
Use of Funds:
DC debt repayment
Proposed Projects-Capital Forecast (Tax) 224,400 130,000 423,000 30,000 251,200 350,000 200,000 172,500 30,000
Proposed Projects-Capital Forecast (WWW)
Total Use of Funds 224,400 130,000 423,000 0 30,000 251,200 350,000 200,000 172,500 30,000 0
Closing Balance December 31st (396,795) (497,531) (903,221) (894,798) (914,708) (1,171,545) (1,542,483) (1,777,437) (1,997,058) (2,082,578) (2,142,276)
Closing Cash Balance per DC Background Study
July 10, 2009 57,100 (47,400) 5,700 (4,900) (95,300) (31,800) 400
HALDIMAND COUNTY
DEVELOPMENT CHARGES RESERVE FUND - STORMWATER
FOR THE YEARS 2013 TO 2022
105

APPENDIX D
PROJECTS DEFERRED or REMOVED DURING SENIOR MANAGEMENT REVIEW
NOTE: The following projects are shown as submitted, but have been cut or moved to future years.
HALDIMAND COUNTY
2013 to 2022 TAX SUPPORTED CAPITAL FORECAST
Gross Expenditure Financing
2013 2014 2015 2016 2017 2018 2019 2020 2021 2022 Total
Grants /
Subsidies
External
Financing
Development
Charges
Rsve Funds
Federal Gas
Tax Rsve
Fund
Reserves/
Reserve Funds
Debenture
Financing
DIVISIONS Description
Repair/
New
Cut/
Deferred
Support Services Constituent Relationship Management Software New Cut 105,000 105,000 105,000
Information Systems Info. Tech. Strategic Plan Review New Deferred 75,000 75,000 75,000
Fire Services - General Administration Various Fire Equipment Repair Cut 2,500 2,500 2,500 2,500 2,500 2,500 2,500 2,500 2,500 2,500 25,000 25,000
Fire Services - Moulton Fire Hall Stn 8 Various Repair Items Repair Cut 2,000 47,500 15,000 6,000 20,000 10,000 100,500 100,500
Fire Services - Byng Fire Hall Stn#10 Various Repair Items Repair Cut 4,000 5,000 5,000 45,000 10,000 69,000 69,000
Fire Services - Fisherville Fire Hall Stn#12 Various Repair Items Repair Cut 5,000 12,000 65,000 26,000 10,000 118,000 118,000
Fire Services - Fisherville Fire Hall Stn#12 Auto Extrication-Pedal Cutter New Cut 2,800 2,800 2,800
Fleet and Equipment Pool Fire Appartus Pumpers Repair Cut 440,000 380,000 380,000 1,200,000 1,200,000
Fleet and Equipment Pool Fire Appartus Tanker Repair Cut 135,000 135,000 135,000
Fleet and Equipment Pool Loader/Backhoe (2) Repair Deferred one unit 260,000 260,000 260,000
Fleet and Equipment - New Leaf Blower (Roads Sidewalk) New Cut 750 750 750
Fleet and Equipment - New Gator FAPO (1) New Deferred 12,000 12,000 12,000
Fleet and Equipment Pool-Kohler Fleet Garage Build Storage & Parts Room New Deferred 10,000 65,000 75,000 75,000
Other Roadwork-Miscellaneous Construction Roadside Safety Program Repair Cut 75,000 75,000 75,000
Hot Mix Resurfacing Diltz Road - Niagara to Concession Repair Deferred 1,400,000 1,400,000 560,000 840,000
Waste Disposal Sites-Perpetual Site Care-Other Security Fence-Peebles Landfill New Deferred 50,000 50,000 50,000
Land Ambulance Parking Lot Improvements-Caledonia New Cut 47,000 47,000 47,000
Grandview Lodge-Administration Computers & Desks (2) New Cut 4,800 4,800 4,800
Parks-Caledonia McKinnon-Trac.w/ Fr End L'der, Mid M't Mower Repair Cut 25,000 25,000 12,500 12,500
Parks-Caledonia McKinnon-Groomer Repair Cut 7,000 7,000 3,500 3,500
Library-Administration General Capital Requirements Repair Cut 10,000 20,000 30,000 30,000
Library-Dunnville WWW Staff Relocation New Cut-Scope change 450,000 450,000 450,000
Heritage & Culture General General Capital Requirements Repair Cut 5,000 5,000 5,000 15,000 30,000 30,000
Markets Dunnville Farmer's Market Repairs/Maintenance Repair Deferred 450,000 450,000 200,000 250,000
Planning and Development Dunv Sec Plan Implementation-Special Policy Area New Deferred 150,000 150,000 30,000 120,000
Community Halls Partnership Program Annual Building Assessments Repair Cut 5,000 5,000 5,000 5,000 5,000 5,000 5,000 5,000 5,000 5,000 50,000 50,000
Community Halls Partnership Program Annual Community Hallls Projects-Major Repairs Repair Cut 35,000 35,000 35,000 35,000 35,000 35,000 35,000 245,000 245,000
Total 923,050 2,194,800 644,500 113,500 468,500 97,500 582,500 62,500 62,500 42,500 5,191,850 0 216,000 30,000 560,000 4,385,850 0
106
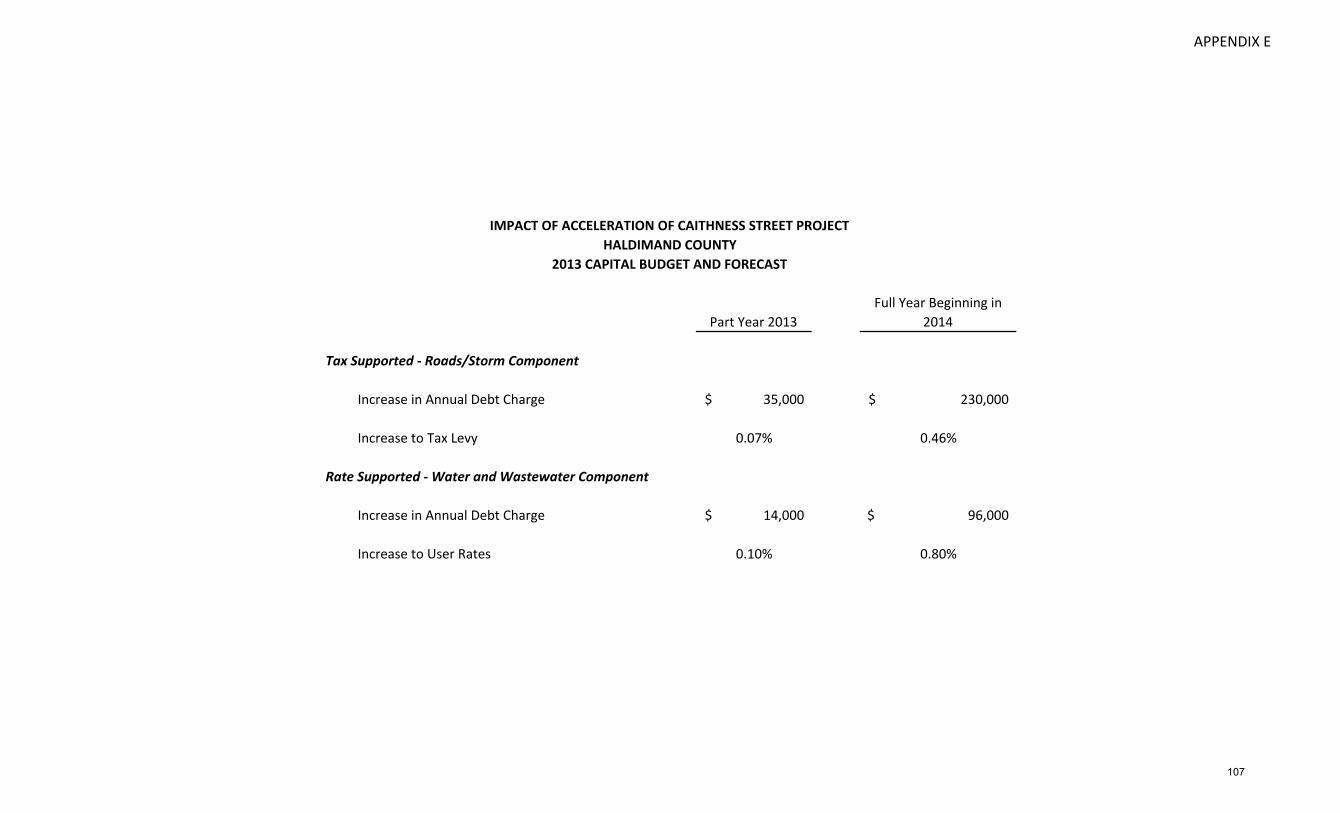
APPENDIX E
Part Year 2013
Full Year Beginning in
2014
Tax Supported - Roads/Storm Component
Increase in Annual Debt Charge 35,000$ 230,000$
Increase to Tax Levy 0.07% 0.46%
Rate Supported - Water and Wastewater Component
Increase in Annual Debt Charge 14,000$ 96,000$
Increase to User Rates 0.10% 0.80%
IMPACT OF ACCELERATION OF CAITHNESS STREET PROJECT
HALDIMAND COUNTY
2013 CAPITAL BUDGET AND FORECAST
107


