27
FOR INVESTMENT PROFESSIONAL USE ONLY DSM Global Equities Performance data as of 30/06/2017, gross of fees

FOR INVESTMENT PROFESSIONAL USE ONLY
DSM Global EquitiesPerformance data as of 30/06/2017, gross of fees

FOR INVESTMENT PROFESSIONAL USE ONLY
Agenda
1. About DSM Capital Partners
2. DSM’s Investment Style & Process
3. Performance & Characteristics
4. About Candoris
5. Important Information

FOR INVESTMENT PROFESSIONAL USE ONLY
Section One:
About DSM Capital Partners

FOR INVESTMENT PROFESSIONAL USE ONLY 4
About DSM Capital Partners, Ltd.A bottom-up, idea driven, growth stock firm
DSM: A growth firm with a value backbone
• 100% employee owned boutique founded in 2001, focusing exclusively on growth companies
• 24 employees currently managing over $6.7bn* in AUM long only, high-conviction growth strategies with 1 distinct philosophy:
• Global Growth
• Global Focus Growth
• Global Growth & Income
• U.S. Large Cap Growth
• DSM Global Growth and DSM Global Focus Growth are rated 5- and 4-stars overall (respectively) by Morningstar
• Clients include corporate pension plans, foundations and endowments, other institutions, and high net worth individuals.
• Firms headquarters is located in Palm Beach Gardens, FL.
Candoris & DSM
• Partnership dates to 2013
• Committed to growth in the Nordics and throughout Europe
• Provides capacity to grow in strategy, without jeopardizing performance
* As of 30/05/2017

FOR INVESTMENT PROFESSIONAL USE ONLY 5
Organizational StructureDSM Capital Partners
Steve Memishian, CFA
Founder, Co-Managing Partner
Daniel Strickberger
Founder, CIO,Co-Managing Partner
Research & Portfolio Management
Justin Burk, CFAHannah Chang JoJo Hu, CFA Pinaki Kar David McVey, CFA Takehiko Serai, CFA Steve Tish, CFAEric Woodworth, CFAKenneth Yang, CFA
Client Service & Operations
Patricia BonadioKristen D’AmbrosioVitas Martinenas
Patricia MichellSandra MontoyaNina PetrushevNina Renna
Trading
Chris BertoniShayn Logan
Legal & Compliance
Blair Barton, JDRussell Katz, JD
Client Service & Business Development
Stephen ConstantineMichael Wright

FOR INVESTMENT PROFESSIONAL USE ONLY 6
DSM’s Investment TeamExperienced team dedicated to one single philosophy
DSM’s ten person investment team specializes in quality growth companies worldwide
• Proprietary research used to identify and model quality growth companies, complemented by a rigorous valuation discipline used for both buying and selling positions
• 250 expert calls per year; buy-in research
• Analyst/PM’s compensated on quality of work and firm performance
• “Buy”, “Sell”, and “Avoid” recommendations are equally important
• Investment team has significant ownership of DSM portfolios
The team’s focus on proprietary research, in conjunction with a disciplined approach to valuation, results in a concentrated, benchmark-agnostic portfolio of 35-45 names
Industry DSM
Daniel Strickberger 36yrs 16yrs
Chief Investment Officer
Justin Burk, CFA 19yrs 15yrsMedical Technology, Enterprise Software, Computer Storage & Communications, Specialty Chemicals, Agriculture, Multi-Industry
Hannah Chiang 19yrs 2yrPayment Processing, Chinese Online Advertising, Retail, Apparel, Consumer Discretionary
JoJo Hu, CFA 10yrs 2yrChinese Internet, Chinese Capital Markets, Utilities, Consumer, Technology, Industrials, Healthcare
Pinaki Kar 9yrs 9yrsBiotech/Pharma, Consumer Staples, Discount Stores, Medical Technology, Industrial Glass, Business Software, Semiconductors
David McVey, CFA 21yrs 16yrsInternet Services, Payment Processing, Banking, Media/ Advertising, Energy Services, Investment Management
Takehiko Serai, CFA 21yrs 6yrs
Tobacco, Consumer Services, Industrial Distributors, Luxury Products
Steve Tish, CFA 26yrs 10yrs
Biotech, Pharmaceuticals, Restaurants, Gaming, Lodging, Travel
Eric Woodworth, CFA 16yrs 16yrs
Personal Computers, Railroads, Freight Forwarders, Aviation, Computer Services, Networking Software, Security Software
Kenneth Yang, CFA 19yrs 3yrsConsumer Discretionary, Industrials, Investment Management, Business Services, Instrumentation

FOR INVESTMENT PROFESSIONAL USE ONLY
Section Two:
DSM’s Investment Style & Process

FOR INVESTMENT PROFESSIONAL USE ONLY 8
DSM’s Investment PhilosophyA clear philosophy and a distinct investment style
DSM believes quality growth companies with predictable streams of earnings generate attractive rates of return over time when purchased at rational prices.
EPS Growth
Dividend Yield
∆ in P/E Ratio
ExpectedReturns
This philosophy drives DSM’s distinct investment process, built on three core principles:
• Identify quality growth companies and perform fundamental research on them
• Create and utilize proprietary earnings models
• Utilize valuation discipline
FOR INVESTMENT PROFESSIONAL USE ONLY 9
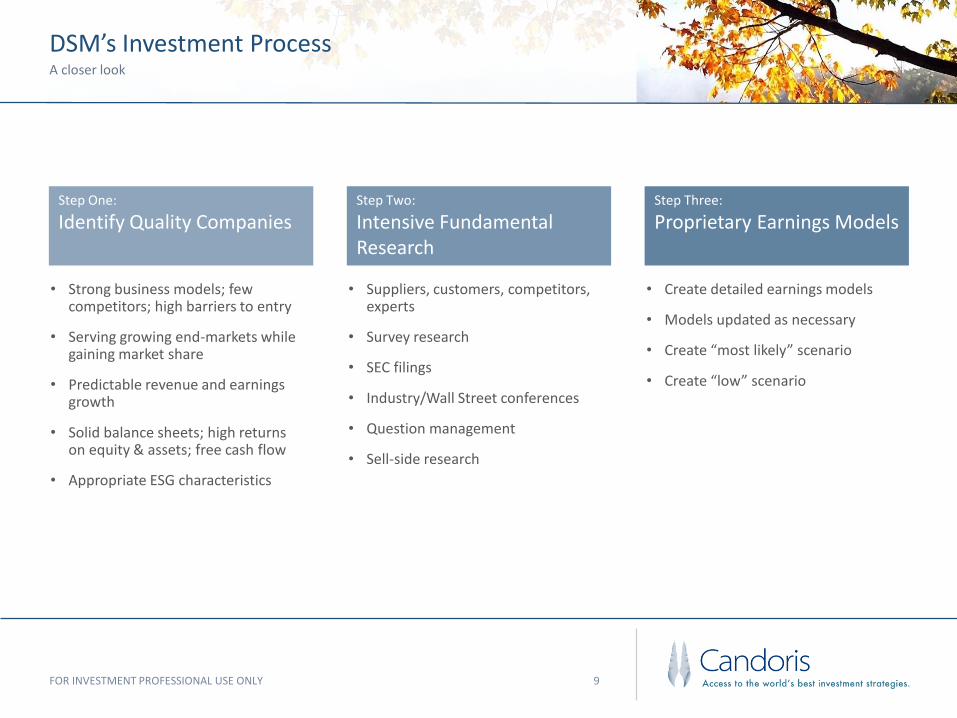
DSM’s Investment ProcessA closer look
Step One:
Identify Quality Companies
• Strong business models; few competitors; high barriers to entry
• Serving growing end-markets while gaining market share
• Predictable revenue and earnings growth
• Solid balance sheets; high returns on equity & assets; free cash flow
• Appropriate ESG characteristics
Step Two:
Intensive Fundamental Research
• Suppliers, customers, competitors, experts
• Survey research
• SEC filings
• Industry/Wall Street conferences
• Question management
• Sell-side research
Step Three:
Proprietary Earnings Models
• Create detailed earnings models
• Models updated as necessary
• Create “most likely” scenario
• Create “low” scenario

FOR INVESTMENT PROFESSIONAL USE ONLY 10
DSM’s Investment ProcessA closer look
Step Four:
Valuation Discipline
DSM will only purchase a new stock when they can reasonably project a higher P/E three years from now
• DSM estimates a reasonable “target” P/E three years forward
• Normally buy 10% below the target P/E to provide a margin of safety
• Avoid the “Growth Managers’ Trap of paying too high a P/E
• Projected Return = EPS Growth + Dividends + P/E Expansion
Step Five a:
Decision making:Why DSM buys
• Business fundamentals are strong
• Earnings growth appears predictable and sustainable
• P/E has potential to rise ≥10% over next three years
Step Five b:
Decision making:Why DSM sells
Valuation
• Price appreciation reduces “most likely” future return
• “On deck” stocks offer more attractive “most likely” returns
Business Prospects
• Proprietary research indicates that business prospects have deteriorated
• Disappointing quarterly earnings or reduced guidance

FOR INVESTMENT PROFESSIONAL USE ONLY 11
Portfolio ConstructionDSM Global Equities
Sector Weights
• Normally diversified among 5 to 7 sectors
• Evaluate commonalities among industries/sectors
• Approximately 35% sector weight maximum
• Monitor economic sensitivity
Regional Weights
• Normally diversified across developed and emerging markets:
• North America 30% -60%
• Other Developed Nations 20% -50%
• Emerging Markets 10% -30%
Typical Position Weights
• DSM Global Growth: 35 to 55 positions
• 1% to 2% “starter” positions
• 3% to 5% “average” positions at cost
• 5% to 6% position size at cost for select investments
• DSM Global Focus Growth: Approx. 10 positions
Active Share
• Trailing fiscal 5-year quarterly range
• Global Growth 92% - 97%
• Global Focus 95% - 99%
• Global Growth and Income 92% - 98%

FOR INVESTMENT PROFESSIONAL USE ONLY 12
Portfolio ConstructionDSM Global Equities
• Quality/concentrated portfolios generate alpha
• Ongoing research helps avoid disappointing earnings outcome
• Estimate “most likely” EPS growth and P/E target
• “Most likely” case is a projection that can be exceeded
• Estimate “low” EPS growth and P/E target
• Avoid companies with unpredictable earnings
• Reduces economic risk
• Reduces balance sheet and financial risks
• Reduces risk and enhances return
• Generated from many sources
Portfolio
Manage investment
risk
Most likelyanalysis
Low Growthanalysis
Invest in Quality
businesses
New Idea flow

FOR INVESTMENT PROFESSIONAL USE ONLY 13
Portfolio ConstructionDSM Global Equities
ESG Considerations
DSM incorporates ESG factors in its security selection process. If
DSM determines that ESG factors may have a material impact on the potential long-term returns of an
investment, DSM will complete in-depth research on those
issues.
DSM will invest in companies with ESG
issues when our research concludes
that the issues are not material to long-term
financial returns.
DSM will evaluate Board of Directors
independence, qualifications and procedures with
regard to achieving future financial
returns for shareholders.

FOR INVESTMENT PROFESSIONAL USE ONLY
Section Three:
Performance & Characteristics

FOR INVESTMENT PROFESSIONAL USE ONLY 15
DSM Global GrowthHistorical Performance
* PreliminaryThe content presented is for informational and supplemental purposes only. The performance presented represents a composite of the prior performance of discretionary accounts managed by DSM Capital Partners LLC(“DSM”) in accordance with its global growth strategy. You should not consider this performance data to be an indication of future performance of DSM’s global grow style. The performance figures presented do not reflectthe deduction of investment advisory fees actually charged to the accounts in the composite. Rather, the performance results presented reflect the deduction of a model advisory fee. The model advisory fee for global growthis 1% per annum. The net of fee returns calculated for the composite were created by deducting the monthly amount of the model annual fee from actual gross returns. DSM has prepared and presented this performancereport in compliance with the DSM has prepared and presented the global growth performance in compliance with the Global Investment Performance Standards (GIPS®) of the CFA Institute. The CFA Institute has not beeninvolved with the preparation or review of this report. Past performance is no guarantee of future results and individual accounts and results will vary. Different market or economic conditions could result in markedlydifferent performance, including the possibility of loss. There are also special risk considerations associated with international and global investing (especially emerging markets), small and mid-capitalization companies, orother growth and/or concentrated investment strategies. Comparative indexes are unmanaged, do not reflect the payment of advisory fees and other expenses associated with an investment and may not reflect thereinvestment of dividends. Investors cannot invest directly in an index.
GIPS Compliant Gross Composite Performance* - DSM Global GrowthUSD; As of 30/06/2017
YtD 1 Year 3 Year 5 Year Since Inception
Global Equity (in US$)
Global Growth (Inception – Oct 10) 27,02% 32,34% 12,10% 16,60% 14,15%
MSCI ACWI Net 11,48% 18,78% 4,82% 10,54% 8,71%
+/- MSCI ACWI Net 15,54% 13,56% 7,28% 6,06% 5,44%

FOR INVESTMENT PROFESSIONAL USE ONLY 16
Historical PerformanceDSM Global Growth v. Benchmark
Source: eVestmentData quoted is past performance gross of fees. Current performance may be lower or higher. Past performance is no guarantee of future results. Investment return and principal value of an investment will fluctuate.
Growth of US$ 100 – Since inception

FOR INVESTMENT PROFESSIONAL USE ONLY 17
Returns various periodsDSM Global Growth v. Benchmark and Peers
Source: eVestmentData quoted is past performance gross of fees. Current performance may be lower or higher. Past performance is no guarantee of future results. Investment return and principal value of an investment will fluctuate.
Consistent Outperformance

FOR INVESTMENT PROFESSIONAL USE ONLY 18
Upside/Downside CaptureDSM Global Growth v. Benchmark and Peers
Higher Upside Capture and lower Downside Capture leads to superior returns
Source: eVestmentData quoted is past performance gross of fees. Current performance may be lower or higher. Past performance is no guarantee of future results. Investment return and principal value of an investment will fluctuate.

FOR INVESTMENT PROFESSIONAL USE ONLY 19
Returns and Standard DeviationDSM Global Growth v. Benchmark and Peers
DSM Global Growth outperforms the benchmark and almost all peers.
Source: eVestmentData quoted is past performance gross of fees. Current performance may be lower or higher. Past performance is no guarantee of future results. Investment return and principal value of an investment will fluctuate.

FOR INVESTMENT PROFESSIONAL USE ONLY
Section Four:
About Candoris

FOR INVESTMENT PROFESSIONAL USE ONLY 21
About CandorisAccess to the world’s best investment strategies
Candoris pairs boutique investment managers with investors and distributors throughout the Nordics and the Netherlands. We are:
• A Dutch firm with two seasoned investment professionals
• Transparent about the managers we introduce, and the key criteria we use before partnering with them
• Transparent on price, and fund and separate account investment possibilities
• Honest and direct in our communication now and when you are a client
Can·dor“kandər-ˌ dôr”
noun: candour; candor
1. The quality of being open and honest in expression; frankness.
Synonyms: frankness, openness, honesty, candidness, truthfulness, sincerity, forthrightness, directness, plain-spokenness, bluntness, straightforwardness, outspokenness

FOR INVESTMENT PROFESSIONAL USE ONLY 22
Candoris matches clients’ needs with unique strategies and solutions.
For Investors in the Netherlands & the Nordics:
• Introduce and market investment strategies and styles that are unique
• Offer solutions to actual challenges for investors and distributors
• Present the investment strategy compared with peers, on an absolute and risk adjusted basis
• Ability to provide insight when including the strategy in portfolio context
• Facilitate European investment vehicles (funds) or mandates
• The organizations we introduce are boutiques, frequently employee-owned, and specialized
• Organizing roadshows at least twice a year through these markets
For Asset Managers:
• Access to Dutch and Nordic market at limited expense
• Asset managers can continue to manage assets without distraction
• Support in establishing funds
• Organize/fulfil regulatory requirements

FOR INVESTMENT PROFESSIONAL USE ONLY 23
Selected Strategies & ManagersAccess to the world’s best investment strategies
Candoris - Strategies & Managers
Global Equities DSM Capital Partners – Palm Beach Gardens, FL
US Equities Coho Partners - Philadelphia, PA
European Equities Eleva Capital - London
Senior Loans Pacific Asset Management - Newport Beach, CA
US High Yield Strategic Income Management (SiM) - Seattle, WA

FOR INVESTMENT PROFESSIONAL USE ONLY 24
Strategies & PerformanceAccess to the world’s best investment strategies
GIPS Compliant Gross Composite PerformanceUSD; As of 30/06/2017
Source: eVestmentData quoted is past performance gross of fees. Current performance may be lower or higher. Past performance is no guarantee of future results. Investment return and principal value of an investment will fluctuate.
YtD 1 Year 3 Year 5 Year 10 Year Since Inception
Global Equity (in US$)
Global Growth (Inception – Oct 10) 27,02% 32,34% 12,10% 16,60% 14,15%
MSCI ACWI Net 11,48% 18,78% 4,82% 10,54% 8,71%
US Equity (in US$)
US Equity (Inception – Oct 00) 7,14% 10,02% 8,84% 13,77% 9,75% 9,41%
S&P 500 TR 9,34% 17,90% 9,61% 14,63% 7,18% 5,23%
S&P 500 Value 4,85% 15,86% 7,79% 13,83% 5,25% 5,57%
European Equities (in €)
Eleva European Selection (Inception - Jan 15) 8,44% 22,63% 20,10%
STOXX Europe 600 EUR 7,04% 18,17% 9,72%
US Senior Loans (in US$)
US Senior Loans (Inception – Jan 07) 2,26% 7,76% 4,01% 5,26% 5,64% 5,76%
CS LL Index 1,96% 7,49% 3,49% 4,83% 4,16% 4,31%
US High Yield (in US$) until May 2017
US High Yield (Inception – Feb 11) 4,15% 12,44% 5,69% 9,24% 8,37%
BofA ML US High Yield Master II 4,80% 13,85% 4,74% 7,32% 6,79%

FOR INVESTMENT PROFESSIONAL USE ONLY 25
DSM UCITS FundFund Information
Fund Launch:
Global Growth: March 2014US Large Cap Growth: July 2016
Structure:UCITS
AUM:
Global Growth: $961 millionUS Large Cap Growth: $46million
Exchange:Luxembourg
Benchmark:MSCI ACWI
Liquidity:Daily
ISIN:
Global Growth: LU1016061043 US Large Cap Growth: LU1016061126
Management Fee
<€10 million 84 basis points
>€10 million 70 basis points
Larger Investments To be discussed
Other ExpensesCapped at 15 basis points for Institutional Investors; In reality, about 11 basis points
Custodian:
Northern Trust
Central Admin:
Northern Trust
Transfer Agent:
Northern Trust

FOR INVESTMENT PROFESSIONAL USE ONLY
Section Five:
Important Information

FOR INVESTMENT PROFESSIONAL USE ONLY 27
This information is proprietary and cannot be reproduced or distributed. Certain information may be received from sources Candoris B.V. considers reliable;Candoris B.V. does not represent that such information is accurate or complete. Certain statements contained herein may constitute “projections,”“forecasts” and other “forward-looking statements” which do not reflect actual results and are based primarily upon applying retroactively a hypothetical setof assumptions to certain historical financial data. Actual results, performance or events may differ materially from those in such statements. Any opinions,projections, forecasts and forward-looking statements presented herein are valid only as of the date of this document and are subject to change. Nothingcontained herein should be construed as (i) an offer to buy any security or (ii) a recommendation as to the advisability of investing in, purchasing or sellingany security. Candoris B.V. assumes no obligation to update any forward-looking information.
Past performance is no guarantee of future results.


