Earnings Management and the Long-Run Market Performance of Initial Public Offerings SIEW HONG TEOH, IVO WELCH, and T. J. WONG* ABSTRACT Issuers of initial public offerings ~IPOs! can report earnings in excess of cash f lows by taking positive accruals. This paper provides evidence that issuers with unusu- ally high accruals in the IPO year experience poor stock return performance in the three years thereafter. IPO issuers in the most “aggressive” quartile of earnings managers have a three-year aftermarket stock return of approximately 20 percent less than IPO issuers in the most “conservative” quartile. They also issue about 20 percent fewer seasoned equity offerings. These differences are statistically and economically significant in a variety of specifications. SEVERAL STUDIES F IND THAT INITIAL public offerings ~IPOs! underperform after the issue. 1 Over a three-year holding period after the offering, Ritter ~1991! reports substantially lower stock returns ~mean of 227 percent and median of 255 percent! for a sample of 1,526 IPOs going public between 1975 and *Teoh is at the University of Michigan, Welch is at the University of California, Los Angeles, and Wong is at the University of Science and Technology, Hong Kong. We thankAndrew Alford, Joe Aharony, John Barber, Vic Bernard, Shlomo Bernartzi, Robert Bowen, Laura Field, Steve Hansen, David Hirshleifer, Michael Kirschenheiter, Charles Lee, Tim Loughran, Susan Moyer, Gita Rao, Jay Ritter, Jake Thomas, Dan Tinkelman, Sheridan Titman, and workshop partici- pants at the University of British Columbia, Columbia University, New York University, and the University of Washington for helpful comments. Comments received on related papers pre- sented at the NBER 1995 Corporate Finance seminar, the 1995 CRSP Behavioral Finance con- ference, the 1995 Sixth Annual Finance, Economics and Accounting Conference, the 1996 AFA Conference, Ohio State University, the University of Michigan, and the University of Rochester were also helpful in shaping this paper. We thank Kent Daniel, Chris James, Mike Maher, and Jay Ritter for data. The accruals data used in this article will be made available at the Journal of Finance WWW site ~http://www.cob.ohio-state.edu/dept/fin/journal/jof.htm) and Ivo Welch’s WWW site ~http://linux.agsm.ucla.edu.edu). 1 For example, Stoll and Curley ~1970!, Stern and Borstein ~1985!, Ritter ~1991!, and Lough- ran and Ritter ~1995! find poor subsequent performance for IPOs. Ibbotson ~1975! reports sta- tistically insignificant negative performance in the second through fourth post-issue years and positive performance in the first and fifth years. In contrast, Buser and Chan ~1987! report positive performance in the first two post-issue years; Ritter ~1991! discusses possible reasons for the differences in the findings. Jain and Kini ~1994!, Mikkelson, Partch, and Shah ~1997!, and Teoh, Wong, and Rao ~1998! examine the accounting performance of issuers in detail. There is also now a growing literature explaining IPO stock return underperformance as related to institutional holdings ~Field ~1995!!, venture capital ~Brav and Gompers ~1997!!, investment banker recommendations, and analysts’ characteristics ~see footnote 4!. THE JOURNAL OF FINANCE • VOL. LIII, NO. 6 • DECEMBER 1998 1935
Issuers of initial public offerings ~IPOs! can report earnings in excess of cash f lowsby taking positive accruals. This paper provides evidence that issuers with unusu-ally high accruals in the IPO year experience poor stock return performance in thethree years thereafter. IPO issuers in the most “aggressive” quartile of earningsmanagers have a three-year aftermarket stock return of approximately 20 percentless than IPO issuers in the most “conservative” quartile. They also issue about 20percent fewer seasoned equity offerings. These differences are statistically andeconomically significant in a variety of specifications.
SEVERAL STUDIES FIND THAT INITIAL public offerings ~IPOs! underperform afterthe issue.1 Over a three-year holding period after the offering, Ritter ~1991!reports substantially lower stock returns ~mean of 227 percent and medianof 255 percent! for a sample of 1,526 IPOs going public between 1975 and
*Teoh is at the University of Michigan, Welch is at the University of California, Los Angeles,and Wong is at the University of Science and Technology, Hong Kong. We thank Andrew Alford,Joe Aharony, John Barber, Vic Bernard, Shlomo Bernartzi, Robert Bowen, Laura Field, SteveHansen, David Hirshleifer, Michael Kirschenheiter, Charles Lee, Tim Loughran, Susan Moyer,Gita Rao, Jay Ritter, Jake Thomas, Dan Tinkelman, Sheridan Titman, and workshop partici-pants at the University of British Columbia, Columbia University, New York University, andthe University of Washington for helpful comments. Comments received on related papers pre-sented at the NBER 1995 Corporate Finance seminar, the 1995 CRSP Behavioral Finance con-ference, the 1995 Sixth Annual Finance, Economics and Accounting Conference, the 1996 AFAConference, Ohio State University, the University of Michigan, and the University of Rochesterwere also helpful in shaping this paper. We thank Kent Daniel, Chris James, Mike Maher, andJay Ritter for data. The accruals data used in this article will be made available at the Journalof Finance WWW site ~http://www.cob.ohio-state.edu/dept/fin/journal/jof.htm) and Ivo Welch’sWWW site ~http://linux.agsm.ucla.edu.edu).
1 For example, Stoll and Curley ~1970!, Stern and Borstein ~1985!, Ritter ~1991!, and Lough-ran and Ritter ~1995! find poor subsequent performance for IPOs. Ibbotson ~1975! reports sta-tistically insignificant negative performance in the second through fourth post-issue years andpositive performance in the first and fifth years. In contrast, Buser and Chan ~1987! reportpositive performance in the first two post-issue years; Ritter ~1991! discusses possible reasonsfor the differences in the findings. Jain and Kini ~1994!, Mikkelson, Partch, and Shah ~1997!,and Teoh, Wong, and Rao ~1998! examine the accounting performance of issuers in detail. Thereis also now a growing literature explaining IPO stock return underperformance as related toinstitutional holdings ~Field ~1995!!, venture capital ~Brav and Gompers ~1997!!, investmentbanker recommendations, and analysts’ characteristics ~see footnote 4!.
THE JOURNAL OF FINANCE • VOL. LIII, NO. 6 • DECEMBER 1998
1935
1984 than for a size- and industry-matched sample of seasoned firms. Ritterconjectures that “investors are periodically overoptimistic about the earn-ings potential of young growth companies.”
Our paper explores a possible source for this overoptimism. Issuers canreport unusually high earnings by adopting discretionary accounting accrualadjustments that raise reported earnings relative to actual cash f lows. Ifbuyers are guided by earnings but are unaware that earnings are inf latedby the generous use of accruals, they could pay too high a price. As infor-mation about the firm is revealed over time by the media, analysts’ reports,and subsequent financial statements, investors may recognize that earningsare not maintaining momentum, and the investors may thus lose their op-timism. Other things equal, the greater the earnings management at thetime of the offering, the larger the ultimate price correction. Therefore, ourstudy examines whether discretionary accruals predict the cross-sectionalvariation in post-IPO long-run stock return performance.
Our accruals variable is reported in the fiscal year when the firm goespublic, which includes both pre-IPO and post-IPO months; thus, we onlypredict stock returns several months after this financial reporting date. Thelack of readily available machine-accessible data precludes us from doing alarge sample study using strictly pre-IPO data to measure earnings man-agement.2 Because the incentives to manage earnings are likely to persist inthe months immediately after the offering, we use accruals data from thefirst public financial statement, which includes both pre- and post-IPO months,to measure our earnings management proxy. As described in Section II, en-trepreneurs usually cannot dispose of their personal holdings until at leastseveral months after the IPO. Furthermore, firms face unusual legal andpossibly reputational scrutiny in the IPO aftermath. Immediate accountingreversals may render earnings management activities transparent enoughto trigger lawsuits against the firm and its management. Thus, issuers whoaggressively manage their pre-IPO earnings probably also manage their firstpost-IPO earnings.
We relate the accruals from the first fiscal year financial statements ofthe IPO firm to the stock market performance from three to six months afterthe fiscal year end ~which allows investors in the market to implement ourstrategy!. We focus on IPO firms’ current working capital accruals that areunusual when compared to industry peers ~termed “discretionary”!. We findthat these discretionary current accruals are good predictors of subsequentthree-year stock return performance in a wide variety of specifications. De-pending on benchmark specification, IPO firms that are ranked in the high-est quartile based on IPO-year discretionary current accruals ~“aggressive”
2 Two years of data are required to calculate the accruals variables, and full pre-IPO data arenot always available. A large sample study, such as ours, would not be feasible using onlypre-IPO data, especially for the early period of our sample. Qualitatively similar results wereobtained in an earlier draft ~May 1994! using pre-IPO year data to measure earnings manage-ment in a sample of 107 issuers.
1936 The Journal of Finance
IPOs! earn a cumulative abnormal return of approximately 20 to 30 percentless than the cumulative abnormal return of IPO firms ranked in the lowestquartile ~“conservative” IPOs!. The equivalent buy-and-hold return differen-tial between the aggressive and conservative quartiles is 15 to 30 percent.
We find that the differential performance between aggressive and conser-vative earnings managers is robust to a battery of alternative test specifi-cations and controls ~e.g., for market, size, book-to-market, expected returnbenchmark, holding period, and cumulation method effects!. The discretion-ary current accrual effect holds for IPOs smaller than $20 million in marketcapitalization ~at the time of the first post-IPO financial statement, in dol-lars of 1997 purchasing power!, for IPOs between $20 million and $100 mil-lion, and for IPOs larger than $100 million. The effect is strongest in themiddle category. ~In order to minimize problems in implementing our invest-ment strategies, most of our study considers only IPO firms with at least$20 million dollars of market value at the first financial statement dateafter the IPO.! Although the accruals effect is stronger in some years thanothers, there is no clear time trend. Additional tests suggest that the abilityof accruals to predict IPO stock price underperformance derives both from ageneral ability of accruals to predict returns in all firms and from an incre-mental special ability of IPO accruals to predict returns. Moreover, the for-mer effect ~general predictive ability of accruals! is more significant for IPOfirms because the discretionary current accruals of IPO firms are much largerthan those of average non-IPO firms. Finally, we find that managers of con-servative IPO firms raise equity more frequently in the aftermarket. Of theapproximately 412 IPO issuers in each quartile, 170 of the conservative quar-tile IPO firms ~compared to 152 of the aggressive quartile IPO firms! returnto the aftermarket to raise seasoned equity capital.
The rest of the paper is organized as follows. Section I describes theIPO process, and presents and motivates our measure of earnings manage-ment. Section II describes the sample selection and data. Section III showsthe empirical relation between the measures of earnings management andthe post-statement long-run stock price performance. Section IV tracks thepost-IPO seasoned equity issuing activity of issuers. Section V concludesthe paper.
I. Earnings Management in Initial Public Offerings
A. The IPO Process
The IPO process is particularly susceptible to earnings management, of-fering entrepreneurs both motivation and opportunities to manage earnings.There is high information asymmetry between investors and issuers at thetime of the offering. Rao ~1993! reports that there is almost no news mediacoverage of firms in the years before the IPO. This scarcity of informationabout the issuer forces investors to rely heavily on the prospectus, whichitself may contain only one to three years of financial statements.
Earnings Management of IPOs 1937
If, as we hypothesize, investors are unable to understand fully the extentto which IPO firms engage in earnings management by borrowing from ei-ther the past or the future, high reported earnings would translate directlyinto a higher offering price. But the firm also has an incentive to boostearnings soon after the IPO to maintain a high market price. The originalentrepreneurs may wish to sell some of their personal holdings in the sec-ondary market at the end of the lockup period. ~Entrepreneurs commit notto sell their personal holdings during a lockup period commonly lasting180 days or longer immediately after the IPO.! Furthermore, verbal earn-ings projections are also made to investors during road shows at the begin-ning of issue marketing.3 After trading begins, security analysts initiatecoverage of the firm and disseminate these earnings projections widely. Tokeep the aftermarket price from dropping below the initial offer price, an-alysts at the underwriting investment banking firms are under pressure tomake the most favorable earnings projections possible.4 In turn, the issuingfirm is under pressure to meet those projections in the aftermarket to safe-guard its reputation for reliability; to maintain the goodwill of investors,investment bankers, and analysts who made the initial earnings projections;and to avoid lawsuits by disgruntled shareholders after a shortfall in post-IPO earnings.
However, earnings are managed only if there are opportunities to do so. Akey regulatory limit on entrepreneurial discretion is a requirement that ac-counting reports presented in the offering prospectus be audited by an ex-ternal accounting firm to verify compliance with generally accepted accountingprinciples ~GAAP!.5 The “accrual accounting system” mandated by GAAPpermits firms to make adjustments when reporting earnings. Managers areafforded discretion in recognizing both the timing and amounts of revenuesand expenses.
These adjustments to cash f lows ~collectively called accruals! are supposedto ref lect the underlying business condition of the firm more accurately.Though cash f lows are the ultimate “bottom line” for valuation, many account-
3 The prospectus of U.S. IPOs does not include earnings projections due to possible legalrepercussions.
4 Recent evidence ~Ali ~1996!, Dechow, Hutton, and Sloan ~1997!, Lin and McNichols ~1997!,Michaely and Womack ~1996!, Rajan and Servaes ~1997!, Teoh and Wong ~1997!! indicates thatanalysts are overoptimistic about new issues. Some of these papers also suggest that analystswith underwriting relationships with the issuer may be more overoptimistic than nonaffiliatedanalysts. Furthermore, Teoh and Wong ~1997! provide evidence that analysts are insufficientlyskeptical about the accruals management of new issue firms but not for the general population;the post-issue forecasts do not fully impound information in issue-year discretionary accrualsfor post-issue earnings.
5 Our earnings management measure focuses on discretionary accounting choices and allowsfor either GAAP-consistent or fraudulent accounting choices. Relatively few firms are caught notcomplying with GAAP in the general population, and, of these, few are IPOs. Mike Maher gen-erously provided us with the names of 159 SEC-reporting violators for the period from January1980 to December 1985, and only six of our 485 IPO firms in this period overlapped with hissample of violators. ~Three of these were caught within the first three years of the offering.!
1938 The Journal of Finance
ants and market participants consider the change in cash position to be in-adequate for conveying the underlying business condition, because they areinf luenced by the timing of cash receipts and payments from both operationsand capital investment activities. However, when entrepreneurs have discre-tion over the accrual adjustments, it becomes difficult for investors to assesswhether reported earnings in a given period are appropriate or misleading.6
Furthermore, the Accounting Principles Board Opinion 20 allows IPO firmsto change their accounting choices retroactively for all the financial state-ments presented in the offering prospectus. This gives issuers exceptionalopportunities to “doctor” their time-series profile of accounting earnings forthe pre-issue fiscal years to show an increase in reported earnings.
Fear on the part of investment bankers, auditors, and entrepreneurs ofbecoming targets of lawsuits can also constrain firms from managing earn-ings. The auditor is responsible only for ensuring that the financial state-ments are in accordance with GAAP, and not that they are the most accuraterepresentation of the firm’s condition. ~Auditors have been required to takereasonable steps to detect fraud in financial statements only since 1989with the creation of Statement of Auditing Standards 53.! Discussions withinvestment bankers indicate that the underwriters’ due diligence processgenerally does not include their own independent verification of the firm’saudited financial statements. Finally, an additional constraint on earningsmanagement comes from reputational concerns of entrepreneurs. Evidencein Section IV indicates that IPO firms that are more conservative in theirfinancial statements appear marginally more likely to return to the capitalmarkets for a seasoned equity offering. Thus, an enhanced ability to raisecapital in the future could be either a direct or an indirect benefit to firmsthat manage their IPO earnings conservatively.
B. Measures of Earnings Management
Reported earnings consist of cash f lows from operations and accountingadjustments called accruals. We first decompose total accruals into currentand long-term components. We evaluate these two components separatelybecause entrepreneurs have more discretion over short-term than over long-term accruals ~see, e.g., Guenther ~1994!!. Current accrual adjustments in-volve short-term assets and liabilities that support the day-to-day operationsof the firm. Managers can increase current accruals, for example, by advanc-ing recognition of revenues with credit sales ~before cash is received!, bydelaying recognition of expenses through assumption of a low provision forbad debts, or by deferring recognition of expenses when cash is advanced tosuppliers. Long-term accrual adjustments, which involve long-term net as-
6 For example, firms that ship products can recognize sales revenues, even if the cash pay-ments can be delayed or if the product can be returned. Appendix B gives examples of howfirms can affect reported income in detail. For the reader interested in examining a particularfirm in more detail, Welch ~1997! discusses one IPO firm in the apparel business that hadunusually high accruals.
Earnings Management of IPOs 1939
sets, can be increased by decelerating depreciation, decreasing deferred taxes~the difference between tax expense recognized for financial reporting andactual taxes paid!, or realizing unusual gains.
Not surprisingly, firms are not eager to publicize accrual adjustments thatref lect their desire for a higher short-term share price rather than the eco-nomic realities of the mismatch between actual accounting events and thetiming of inf lows and outf lows. Thus, it is difficult for investors to infer howmuch of the accruals are discretionary ~i.e., unusual managerial choices giventhe underlying timing of cash f lows!. Given the business conditions typicallyfaced by the firm in the industry, some accrual adjustments are appropriateand necessary, and so are expected by investors. For example, fixed-asset-intensive firms have high depreciation, or rapidly growing firms may haverevenues that exceed cash sales. Thus, we need a model to decompose ac-cruals into two components, one that is dictated by firm and industry con-ditions and one that is presumed to be managed by the entrepreneur.
Following Teoh, Wong, and Rao ~1998!, we use an extension of the cross-sectional Jones ~1991! model for this purpose. The details of the procedureare described in Appendix A. In essence, current accruals ~CA! are regressedon the change in sales in a cross-sectional regression using all firms in thesame two-digit SIC code as the issuer, but excluding the issuer and otherfirms issuing IPO or seasoned equities within two years of the issuer.7
The cross-sectional regression is performed each fiscal year, and all vari-ables are scaled by lagged firm assets. The fitted current accruals of theissuer are calculated using the estimated coefficients from the regressionand the change in sales net of the change in trade receivables. The change intrade receivables is subtracted from the change in sales to allow for thepossibility of sales manipulation.8 The fitted current accruals are consideredto be the level necessary to support the firm’s sales increase and is termednondiscretionary current accruals ~NDCA!. The regression residual is pre-sumed not dictated by firm and industry conditions and is considered tohave been “managed,” and so is termed discretionary current accruals ~DCA!.The cross-sectional approach automatically adjusts for the effects of f luctu-ating industry-wide economic conditions that inf luence accruals indepen-dent of any earnings management in each year.9 An equivalent procedure, in
7 We exclude seasoned equity issuers in the industry Jones model regression when estimat-ing discretionary accruals because Teoh, Welch, and Wong ~1998! report earnings managementprior to seasoned equity issues. An earlier version ~using IPOs from 1980 through 1989! ex-cluded only the issuer and found similar results. Also, the correlation of discretionary currentaccruals obtained when excluding SEOs within two years of the issuer and when just excludingcontemporaneous SEO issuers is 99.9 percent.
8 In other words, any sales increase that results in an increase in trade receivables is con-sidered discretionary.
9 Investment bankers also price IPOs relative to “comparable companies” in cross section.The alternative time-series approach is infeasible because IPO firms do not have a long historyof financial statement data. Kim and Ritter ~1998! investigate this relative IPO pricing in moredetail.
1940 The Journal of Finance
which total accruals are related to the change in sales as well as property,plant, and equipment ~to adjust for depreciation! yields a decomposition intodiscretionary and nondiscretionary total accruals. The difference betweendiscretionary total accruals and discretionary current accruals is termed dis-cretionary long-term accruals ~DLA!, and the difference between nondiscre-tionary total accruals and nondiscretionary current accruals is termednondiscretionary long-term accruals ~NDLA!.
To summarize, accruals are decomposed into four components: discretion-ary and nondiscretionary current accruals, and discretionary and nondiscre-tionary long-term accruals. Nondiscretionary accruals are the asset-scaledproxies for unmanipulated accruals dictated by business conditions. Discre-tionary accruals are the asset-scaled proxies for manipulated earnings de-termined at the discretion of management.10 Given the earlier discussion,we expect that discretionary current accruals ~DCA! are the superior proxyfor earnings management.
C. Stock Prices and Earnings Management
Our hypothesis that accounting accruals predict post-IPO stock return un-derperformance requires the presence of both earnings management and in-vestor credulity. The presence of earnings management alone does notnecessarily imply that IPOs are overvalued in the aftermarket. On average,negative post-IPO abnormal stock returns would not be observed if the post-IPO stock market were fully efficient and we had the right model for ex-pected returns. Investors would adequately discount the stock price to ref lectearnings management observable from public information sources, and so-phisticated short-selling would drive aftermarket prices quickly to an ap-propriate level. Our hypothesis is that the marginal investor does not rationallydiscount for earnings management in forming expectations about future cashf lows. Ultimately, if the IPO underperformance is not merely an ex postchance event ~and international and other evidence suggest it is not!, it isunlikely that any fully rational theory will be able to explain why somerational investors are willing to hold IPOs in the aftermarket. Returns forwhat are likely to be risky and illiquid investments are simply too low to beexplained by known equilibrium models. Our own evidence is consistent witha stock market for IPO firms that uses some, but not all, of the earningsinformation available in the financial statements. Furthermore, our evi-dence is consistent with managers adjusting accruals to exploit market cre-dulity, but it does not prove that managers intentionally do so.
10 High discretionary accruals may result from opportunistic overoptimistic misrepresenta-tion of the firm’s potential cash f lows to inf luence investors, from unintentional overoptimismby the managers about future cash f lows, or from timing of high accruals that the managersexploit by taking the firm public at this juncture. ~We minimize the inf luence of the last effectby measuring discretionary accruals relative to industry peers who are likely to face similarbusiness conditions.!
Earnings Management of IPOs 1941
II. Sample Selection and Data
The initial sample of domestic U.S. initial public offerings consists of 1,974IPOs ~provided to us by Chris James and Jay Ritter! for the 1980 to 1984period, and 3,197 IPOs ~obtained from Securities Data Co. ~SDC!! for the1985 to 1992 period. For inclusion in the final sample, IPOs must haveavailable COMPUSTAT financial data both in the year of and the year priorto the offering, CRSP stock return data ~at least one-month’s return must beavailable during the three-year period beyond three months after the firstfiscal year-end!, an offer price exceeding one dollar, and a market capital-ization of at least $20 million in December 1997 purchasing power. Theseselection criteria yield a final sample size of 1,649 IPO firms. No closed-endfunds ~SIC code 6726! are in our final sample.
Figure 1 illustrates our timing convention. The fiscal year in which theIPO occurs is year 0. Thus, fiscal year 21 ends before the date of the IPO,and fiscal year 0 includes both pre- and post-IPO information. Our financialstatement information ~e.g., discretionary current accruals, and our marketcapitalization screen of $20 million! is taken from fiscal year 0. As discussedearlier, IPO firms have an incentive to manage both pre-and immediate post-IPO earnings. To allow for a reporting lag, aftermarket returns are calcu-lated beginning three to six months ~varying across specifications! after thefiscal year 0 ends. Thus, the accruals information necessary to compute ourearnings management measure is available prior to the return cumulationperiod. This data availability constraint on the accruals forces us to examinepost-issue returns beginning three to fifteen months later than the returnperiod in other studies, which measure the post-issue stock return perfor-mance beginning after the first-day return on the issue.
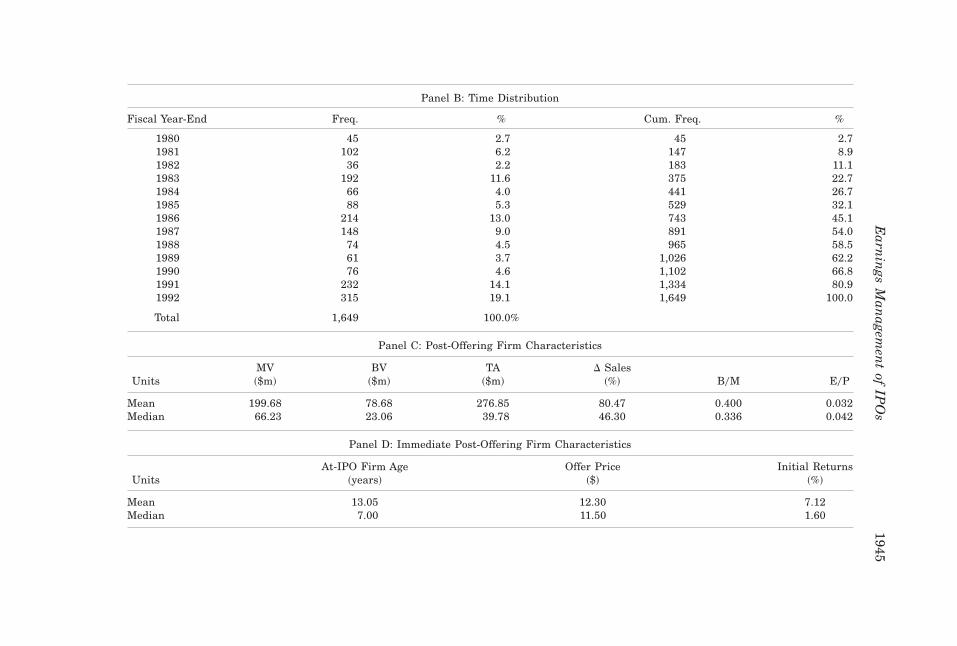
Table I provides descriptive statistics for the 1,649 IPO firms in our sam-ple. The presence of sixty-four separate two-digit SIC codes, with forty-twoof these representing at least 1 percent of the sample ~sixteen IPOs!, indi-cates a wide selection of industries. Not surprisingly for our sample period,there is a concentration of IPOs in the computer and electronics industries.There is a sizeable number of IPOs in each sample year, but 1983, 1986,1987, 1991, and 1992 are higher volume years. Oil and gas IPOs in oursample went public primarily in the first two years of our sample—declining
Figure 1. Time line.
1942 The Journal of Finance
oil prices in the 1980s reduced the f low of oil and gas IPOs. The samplecharacteristics are generally similar to those reported by Loughran and Rit-ter ~1995!, although the earlier years are undersampled due to increasingCOMPUSTAT coverage of small firms over time.
Panels C and D report the IPO and immediate post-IPO characteristicsthat are used as control variables in our cross-sectional regression. The meanmarket capitalization is about $200 million but the median is only $66 mil-lion, both about two and one-half to three times the post-issue book values.The mean and median total assets are $277 million and $40 million, respec-tively. IPO firms experience large increases in sales as a percentage of totalassets in year 21 ~mean 80 percent, median 46 percent!, two to three timesthe equivalent number for the average COMPUSTAT firm. The asset-scaledsales change is a key variable in the regression to estimate discretionaryaccruals. IPO firms are generally young firms, having existed for a mean ofthirteen years and a median of seven years before going public.11 The offer-ing prices average about $12.30 per share ~median $11.50!, and our sampleIPOs are underpriced, on average, by 7 percent ~median 1.6 percent!. Themean ~median! book-to-market ratio is 30 ~40! percent, and earnings pershare are 3 to 4 percent of the share price. In sum, our sample is represen-tative of IPO firms in the sample period.
Table II, Panel A, reports the time-series distribution from the issue yearto six years after for our key measure of earnings management, discretion-ary current accruals ~DCA!, and for two accounting performance measures,net income and cash f low from operations as a percentage of lagged totalassets. The median discretionary current accruals decline monotonically overtime from a significant positive 4.0 percent of beginning assets in the IPOyear to a level insignificantly different from zero by year 3. They then be-come significantly negative by year 5 and remain negative, though insigni-ficant, in year 6.12 The time series pattern of mean accruals exhibits a similarpeak in the issue year and a subsequent steady decline ~the numbers are notreported in the table!. The time series patterns of industry-adjusted netincome and cash f low from operations also hint at earnings management.The median net income is significantly positive in year 0 and then declinesmonotonically to be significantly negative by year 4. The cash f low fromoperations begins poorly in the issuance year and monotonically improvesthrough year 6. These patterns are consistent with managers advancing ac-cruals to increase reported net income in the issuance period. Subsequently,
11 We found age data for 1,601 IPOs from various sources: Jay Ritter for the early sampleperiod, 1980 to 1984, and Securities Data Co., EDGAR and LEXIS online services, Moody’sHandbook of Common Stocks, and Ward’s Business Directory of US Private and Public Compa-nies for IPOs from 1985 to 1992. Age is calculated as the number of years between IPO date andeither the founding date or incorporation date, whichever is the earlier.
12 We do not have data for year 6 for 1991 IPOs nor for years 5 and 6 for 1992 IPOs. Thesample sizes are therefore smaller in years 5 and 6. Moreover, poorer post-IPO performers aremore likely to disappear in the later years because they may go out of business, merge, or betaken over. Because relatively more firms merge when in distress, the reported post-issue datamay understate the true decline in accruals.
Earnings Management of IPOs 1943
Table I
Sample CharacteristicsThe sample consists of 1,649 domestic IPO firms going public in the period from 1980–1992 with an offering price of at least $1 and a marketcapitalization of $20 million in 1997 prices ~in year 0!. The sample firms must also have at least one-month post-issue stock return from CRSPbeyond three months after fiscal year 0 ~the fiscal year containing the issue date! and sufficient COMPUSTAT data to calculate four componentsof accruals in fiscal year 0 ~see Appendix A for required data items!. The distribution of the sample is reported in Panel A by two-digit SIC code,and in Panel B by IPO calendar year. Panel C characteristics of market value, book value of equity, total assets, and ratios D Sales ~saleschange0lagged assets!, B0M ~book value0market value!, and E0P ~earnings0price! are measured at the end of fiscal year 0. The change in salesis from year 21 to year 0 scaled by assets in year 21. Panel D characteristics are measured at the time of the IPO. Age is the number of yearsbetween the founding year or incorporation date ~whichever is earlier! and the IPO year.
Time-Series and Cross-sectional Characteristics of DiscretionaryCurrent Accruals, the Proxy for Earnings Management
The sample consists of 1,649 domestic IPO firms going public in the period from 1980 to 1992 with an offering price of at least$1 and a market capitalization of $20 million in 1997 prices ~in year 0!. Panel A reports time-series statistics on DCA and twoaccounting performance measures, net income and cash f low from operations, in percentage of lagged total assets. The account-ing performance measures are relative to their two-digit industry medians, e.g., NIi, t 0TAi, t21 2 NIt 0TAt21, where i indicates thefirm and overlined variables are industry medians, and TA is total assets. Reported net income consists of total accruals and cashf lows from operations ~CFO!. Accruals consist of current ~working-capital! accruals ~CA!, the change in noncash current assetsminus the change in current liabilities, and long-term accruals ~LA!. Discretionary current accruals ~DCA! are extracted fromcurrent accruals by a within two-digit SIC industry cross-sectional modified Jones ~1991! model. ~See Appendix A for details ofthe discretionary accruals model regressions and COMPUSTAT data items for calculating accruals.! DCA measures the amountof earnings management. All accrual variables and performance measures in Panels A and B are scaled by lagged total assets andare reported as a percentage of lagged assets. p-values for the Wilcoxon signed-rank tests in Panel A are two-tailed. Because ourCOMPUSTAT data end in 1996, 1991 IPOs are included with only five years of data, and 1992 IPOs with only four years of data.Panel B reports summary statistics by issue year DCA quartile for: discretionary current accruals ~always scaled by laggedassets!, inf lation-adjusted market capitalization ~MV* !, book-to-market ~B0M!, earnings-to-price ~E0P!, and net income~NI0TA21, scaled by lagged assets!.
1946T
he
Jou
rnal
ofF
inan
ce
Panel A: Time-Series Distribution of Accruals and Accounting Performance ~as a percentage of total assets in the prior year!
All firms 1,649 4.01 9.95 38.29 90.11 33.60 4.23 11.55
Earn
ings
Man
agemen
tof
IPO
s1947
even though the median cash f low from operations actually improves everyyear, the decline in post-issue accruals causes a post-IPO decline in earn-ings. These results are consistent with Teoh, Wong, and Rao ~1998!, whoshow that these patterns are robust with respect to alternative earningsmanagement and income performance measures.
At various points throughout the paper, we rely on a quartile classifica-tion of firms to avoid the linear parameterization of regressions. We sort the1,649 IPO firms by their asset-scaled discretionary accruals into four quar-tiles, containing either 412 or 413 IPOs. We label the quartile of IPO firmswith the lowest discretionary current accruals as “conservative” IPOs andthe quartile of IPOs with the highest discretionary current accruals as “ag-gressive” IPOs. ~Higher accruals increase reported earnings.! The conserva-tive quartile has discretionary current accruals of less than 25 percent, thesecond quartile has accruals of 25 percent to 14 percent, the third quartilehas accruals of 4 percent to 18.5 percent, and the aggressive quartile hasaccruals exceeding 18.5 percent.
Panel B reports sample characteristics within these quartiles. There isconsiderably higher cross-sectional variation within the conservative ~29.5percent! and aggressive quartiles ~42.0 percent! than within the two middlequartiles. The overall sample standard deviation is 38.3 percent. The twoquartiles with the lowest discretionary accruals contain larger firms thanthe two more aggressive quartiles, although this relation is not monotonicacross the four quartiles. In contrast, there are no visible systematic pat-terns between accrual quartiles and book-to-market ratio, earnings-to-priceratio, or net income scaled by lagged assets.
We also examine the intertemporal variation in discretionary current ac-cruals ~the results are not reported in the table!. We find that discretionarycurrent accruals decline from the earlier half of the sample ~pre-1987: me-dian 5.4 percent, mean 13.1 percent! to the latter half ~post-1987: median3.1 percent, mean 7.8 percent!. However, this decline over time is small com-pared to the within-period across-firms variation ~the standard deviation ofDCA is 36.4 percent pre-1987 and 39.4 percent post-1987!. Furthermore, wefind that the median ~mean! discretionary current accruals is 3.1 percent~8.3 percent! of lagged assets in high issue volume years and 6.3 percent~13.4 percent! during other years. ~Perhaps IPO investors pay less attentionto post-IPO earnings when they are busy investing in other IPOs, easing thepressure for firms to manage earnings during high volume periods.! Again,this year-by-year variation is swamped by the 38 percent cross-sectional stan-dard deviation in discretionary current accruals. Thus, the accruals effectthat we document is not likely to be a mere period-specific effect.
III. Empirical Results
Our key objective is to evaluate the extent to which managed accrualshave an inf luence on the long-run abnormal stock return performance ofIPO firms. This requires an appropriate measure for expected long-run re-
1948 The Journal of Finance
turns, an issue much debated in the asset pricing literature. We adopt anagnostic approach, and consider alternative measures of computing abnor-mal returns ~buy-and-hold and cumulative abnormal returns!, benchmarks~raw, market-adjusted, Fama–French ~1993! adjusted, matching firms ad-justed!, cumulation periods, sample partitions, and regression test specifi-cations ~cross-sectional, time-series, and Fama–MacBeth ~1973! typeregressions!. All tests indicate that discretionary current accruals reliablypredict post-IPO returns.
A. Distribution of Stock Returns by DCA Quartiles
Many studies on long-run performance report buy-and-hold returns ~BH!,because they are most relevant for an investor. But Fama ~1998! raises a setof concerns about the use of BH returns in long-run performance studies. Inparticular, buy-and-hold returns are problematic because their distributionis skewed, small initial differences can be exaggerated through compound-ing, and time-period overlap introduces cross-correlation problems.13 There-fore, we report both CAR and BH portfolio returns. Fama ~1998! furtherpoints out that long-horizon inference can be sensitive to equilibrium ex-pected return model specifications.14
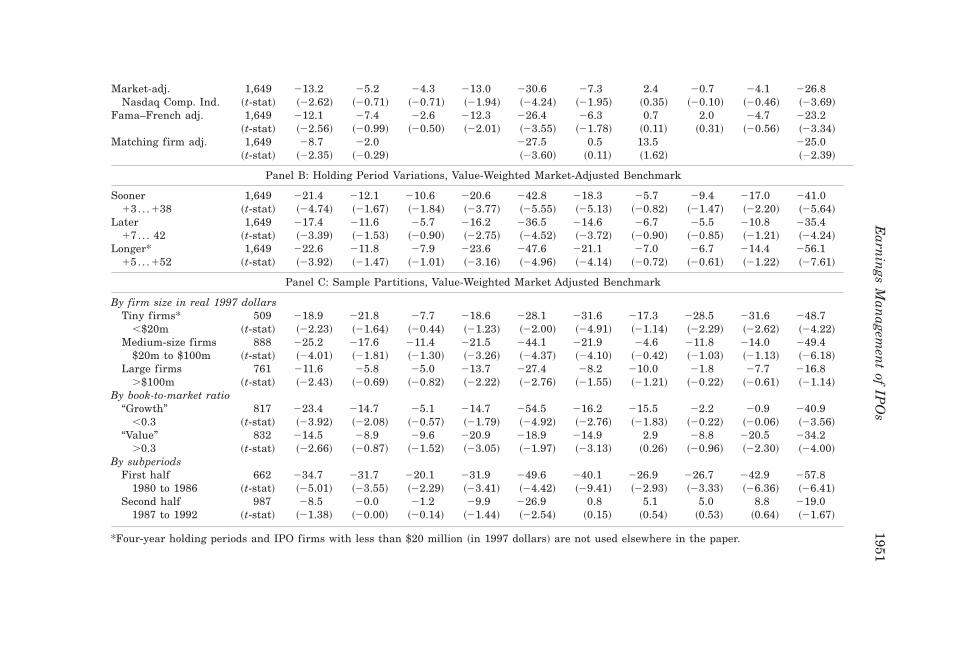
Given the controversy about the acceptable measure for long-run perfor-mance, Panel A in Table III reports abnormal long-run returns using a va-riety of benchmarks. We do not report the middle quartiles both for spacereasons and because quartile returns are generally monotonic. On a CARmeasure, the aggressive accruals portfolio underperforms the conservativeaccruals portfolio by 21.6 percent in raw returns, 26.2 percent in CRSP value-weighted market-adjusted returns, and 25.4 percent in Nasdaq compositeindex-adjusted returns. On a BH measure, the underperformance is some-what larger ~24.9 percent in raw returns, 30.7 percent in CRSP market-adjusted returns, and 29.2 percent in Nasdaq-adjusted returns!.
The fourth row in Panel A shows adjusted returns using the Fama andFrench ~1993! benchmark. For each firm, returns are constrained to be
13 BH and CAR standard errors are computed from the time-series of months rather thanfrom the cross section of firms. The same month’s returns for different firms enter into differentevent months, which could violate the uncorrelatedness assumption in time series. This prob-lem can be addressed, for example, with a Fama and MacBeth ~1973! procedure. Of course, ifthe equilibrium model is misspecified, even CAR standard errors, computed from the timeeries, are not correct.
14 Fama ~1998! also criticizes long-run performance studies with no directional predictions.He notes that half of all studies seem to find underperformance, half overperformance. Ourearnings management hypothesis is directional, applies both to seasoned and initial publicofferings, and is present in both contexts ~see Teoh, Welch, and Wong ~1998! for the evidence onSEOs!.
Earnings Management of IPOs 1949
Table III
Long-Horizon Mean Abnormal Returns (in percent) by Issue Year DCA Quartiles UsingAlternative Benchmarks, Reporting Lags, and Sample Partitions.
The sample consists of 1,649 domestic IPO firms going public in the period from 1980–1992 with an offering price of at least $1 and a marketcapitalization of $20 million in 1997 prices ~in year 0!. The benchmark for expected returns is the value-weighted market index in all panels exceptwhen noted otherwise in Panel A. The holding period is five to forty months after the release of the first post-IPO financial statements in all panelsexcept when noted otherwise in Panel B. Quartile 1 firms are most conservative, quartile 4 most aggressive, in the amount of earnings managementof the first post-IPO financial statements. The proxy for earnings management ~discretionary current accruals, DCA! is described in Table II, andAppendix A describes the details of computing it. Cumulative abnormal returns,
CART [ (t50
T 3 (i51
N
~ri, t 2 mi, t !
N4 ,
where ri, t and mi, t are monthly raw and benchmark returns, are statistics computed from the event time-series of firm-average monthly abnormalreturns and N is the number of surviving firms in month t. The CAR t-statistics have information on “bad” versus “good” event months. Buy-and-hold abnormal returns,
BHT [
(i51
N F)t50
T
~1 1 ri, t ! 2 )t50
T
~1 1 mi, t !GN
~when sample firm returns are missing, both ri, t and mi, t are set to zero!, are statistics computed from the cross section of multimonth returns netof multimonth benchmark returns. Their t-statistics have information on “bad” versus “good” firms. ~Due to cross-sectional correlation problems, thelatter t-statistics should not be translated into p values.!
*Four-year holding periods and IPO firms with less than $20 million ~in 1997 dollars! are not used elsewhere in the paper.
Earn
ings
Man
agemen
tof
IPO
s1951
where t is an event month index, Rt is the raw return for one firm, rft is therisk-free rate, Mt is the value-weighted market return, SMBt is the returndifference between a portfolio of small and a portfolio of large firms, andHMLt is the return difference between a portfolio of high book-to-marketand a portfolio of low book-to-market firms.15
Both the returns and exposure coefficients for IPO firms may be unreli-able because 8 percent of the firms disappear within 36 months. When thereare fewer than twelve monthly return observations—too few to reliably es-timate gamma coefficients—we compute abnormal return ~AR! as a market-adjusted return ~ARi, t 5 vRi, t 2 Mi, t! instead of the Fama–French abnormalreturn ~from equation ~1!! for this particular firm. The Fama–French pro-cedure suggests a smaller underperformance differential of 19.0 percent ona CAR basis and 23.9 percent on a BH basis.
The fifth row of Panel A adjusts returns using a set of matched firms asbenchmark. Following Ritter’s ~1991! procedure, each IPO firm is matchedwith a nonissuing firm from CRSP based on industry membership and mar-ket capitalization. ~Firms issuing seasoned equity are included as potentialmatches.! If the original matched firm drops out before the IPO firm, thenext best match as of the original match date is spliced in for the remainderof the cumulation period to avoid survivorship bias in the matched sample.If the sample firm drops out, both sample and matching firms are assignedzero returns for the remainder of the period. Barber and Lyon ~1997! reportthat this procedure is reasonably reliable. The matched-firm benchmark sug-gests a performance differential between aggressive and conservative ac-cruers of 25.5 percent on a CAR measure and 38.5 percent on a BH measure.In sum, the long-run performance differential between aggressive and con-servative earnings managers seems large and economically significant re-gardless of the benchmark used.
For brevity, the remainder of Table III reports only the value-weightedmarket-adjusted returns. Panel B shows that varying the starting monthsby either 12 or 22 months does not substantially impact our results. Nei-ther variation changes the conclusions. The third row extends the holdingperiod from three to four years. Conservative quartile firms have stabilizedafter three years ~as have the unreported quartiles 2 and 3!, but the aggres-sive quartile firms continue to deteriorate another 11.1 percent in CAR terms,and 20.7 percent in BH terms in the fourth year. ~We do not use four-yearreturns elsewhere in the paper.!
Panel C considers sample partitions by size, book-to-market ratios, andtime-period. The size partition is based on market capitalization measuredat the time of the first financial statement post-IPO with cutoffs at $20million and $100 million ~in December 1997 real dollars!. The differential inreturns between aggressive and conservative quartiles is apparent withinall size subgroups. The 509 small firms ~,$20m! have the smallest CARdifferential ~6.3 percent; BH 5 31.4 percent!; the 761 large firms ~.$100m!
15 Gene Fama and Ken French generously provided us with their factor returns.
1952 The Journal of Finance
have the smallest BH differential ~6.8 percent;16 CAR 5 21.6 percent!. Thelargest differentials between aggressive and conservative firms ~illustratingthe strongest accruals effect! occur in the 888 middle-sized firms: 26.5 per-cent in CAR terms and 44.8 percent in BH terms. ~Within-size quartile dif-ferences are explored further in Appendix C, Table AI.!
The next partition by market-to-book ratio uses a cutoff of 30 percent.Again, in both subsamples, aggressive firms underperform conservative firms.There is no distinct pattern in whether value firms or growth firms displaya greater differential. The final sample partition ~by time period! shows thatthe aggressive versus conservative stock return differential increases from17.9 percent pre-1987 to 26.9 percent post-1987 on a CAR basis. On a BHbasis, the differential decreases from 30.9 percent pre-1987 to 24.1 percentpost-1987. More detailed ~unreported! investigations show that the differen-tial is strong in seven of twelve years ~including 1992!, weak in four years~including 1990 and 1991!, and reverses in 1988 when there were relativelyfew IPOs following the 1987 stock market crash. The small number of ob-servations per year renders definite statements about time trends in theeffect of discretionary accruals on later returns unreliable.
In sum, even if inferences on the magnitude of IPO long-run underperfor-mance are sensitive to the abnormal return computation, the difference inperformance between firms employing different degrees of earnings man-agement is not. More conservative firms outperform more aggressive firmsby a margin that is economically significant.
Figure 2 plots the time series of buy-and-hold returns of the four quartileportfolios ~plus the overall average! net of the Nasdaq composite index bench-mark buy-and-hold returns. The figure shows that IPO firms in the conser-vative first quartile outperform the Nasdaq market by about 4 percent overthree years, whereas the aggressive fourth quartile IPO firms underperformby about 25 percent. ~Composed of many new IPOs and small firms itself,the Nasdaq index performed relatively poorly throughout the sample period,so the magnitude of IPO underperformance indicated by this benchmark isrelatively conservative. As noted previously, our focus is on explaining thecross-sectional variation in the underperformance with our accruals mea-sure, and not on the magnitude of the underperformance per se. The cumu-lated returns of the aggressive and conservative quartiles display a differentdrift if another benchmark is used, but the return differential itself is robustwith respect to alternative benchmarks.! The figure also shows that noncon-servative portfolios deteriorate in the first twelve months, with the aggres-sive quartile 4 portfolio ~and then the quartile 3 portfolio! performing worst.During the years thereafter, the nonaggressive portfolios show only a smalldrift, but the most aggressive quartile 4 portfolio enjoys only a six-monthreprieve before resuming its dramatic decline.
16 The unreported next conservative quartile 2 shows a BH underperformance of 1.8 percent,the unreported next aggressive quartile 3 shows a BH underperformance of 7.7 percent. We donot use these smallest firms elsewhere in the paper.
Earnings Management of IPOs 1953
B. Event-Time Cross-Sectional Regressions
To examine the incremental inf luence of the accrual variables on post-issue stock return underperformance, we add the four accrual variables tothe regression in Ritter ~1991, Table X!. The IPO three-year post-issue buy-and-hold returns are regressed on the four accrual variables and a set ofcontrol variables for other known potential predictors in one cross-sectionalregression. The control variables are year-dummies ~coefficients are not re-ported; these subsume the year-issuing-volume measure in Ritter ~1991!!; acontemporaneous three-year value-weighted buy-and-hold market return fromthe exchange that listed the IPO ~MktRet!; the IPO firm’s logged capitaliza-tion at December 1997 prices ~MV* ! and logged book-to-market ratio ~BV0MV!; the IPO first-day underpricing return ~Underpr!; one high-tech ~HiTech!and one oil&gas ~Oil&Gas! industry dummy; one plus the log of the firm’sage ~AGE!; lagged asset-scaled mean capital expenditure, D CapExp, mea-
Figure 2. Cumulative buy-and-hold return net of Nasdaq composite index return ofDCA quartiles by event month, in percent. The sample is of 1,649 IPOs from the 1980–92period. ~Details are described in Table I.! Firms are divided into quartiles based on how ag-gressively they manage their earnings. Our measure of earnings management is the firm’sdiscretionary current accruals ~DCA!, which adjusts for industry, size, and growth. Details aredescribed in Table II and Section I.B.
1954 The Journal of Finance
sured as asset-scaled mean capital expenditures in years 1, 2, and 3 less theasset-scaled mean capital expenditure in years 21 and 0; and the asset-scaled net income growth, D NetIncome in the IPO year.17 Although suchregressions ignore the contemporaneous correlations among variables, andcan lead to biased standard errors ~but not biased coefficient estimates!,Ritter’s results have been supported in other studies. Furthermore, this spec-ification provides regression coefficients that allow an easy interpretation ofthe economic significance. The estimated regression is
where Ri is the three-year post-issue buy-and-hold return calculated start-ing four months after the first fiscal year-end, and the independent vari-ables include the four accruals and controls. Three stars denote significanceat the 1 percent level ~if residuals are uncorrelated!. The regression statis-tics show that the regression is adequately specified. The F-statistic for re-gression fit is highly significant, the adjusted R-square of the regression is6.37 percent, and the chi-square test indicates no significant heteroskedas-ticity in the regression residuals.
The key variable, discretionary current accruals ~DCA!, has a signifi-cantly negative estimated coefficient of 20.227 ~ p-value 0.03!, indicatingthat firms with high earnings management proxy to boost earnings in theyear of the IPO subsequently show greater underperformance. With a mean~median! discretionary current accrual spread of about 78 percent ~55 per-cent! between quartiles 1 and 4, the estimated coefficient on DCA implies areturn difference of 17.7 percent ~12.5 percent using the median! betweenthe extreme quartiles. The estimated DCA coefficient increases when theregression specification is estimated without extreme observations of DCA~not reported!. For example, truncating the sample at the 1st and 99th per-
17 D CapExp, which controls for Cheng’s ~1995! documented mean effect, shows strong sig-nificance in our IPO sample, perhaps because it is measured using post-issue data and so hasa large timing advantage relative to the other variables. D NetIncome measures the incremen-tal effect of the accrual variables over an income growth variable. Thus, significance of theaccrual variables suggests that investors are credulous with respect to the accruals componentand not just merely to income growth.
Earnings Management of IPOs 1955
centiles increases the estimated DCA coefficient to 20.573 ~ p-value 0.000,t-statistic of 24.008!. Thus, a one-standard deviation increase in DCA ~about28.8 percent in the truncated sample! implies a 16.5 percent return difference.Finally, among the four accrual variables, only the DCA variable is consis-tently robust across a variety of alternative regression specifications.18
C. Time-Series Regressions Using Book-to-Market andMarket Capitalization Adjusted Returns
We vary the test specification in this subsection by using a calendar time-series approach ~shown to be reliable for random samples by Lyon, Barber,and Tsai ~1998!! and a novel portfolio membership selection procedure thatcontrols for size and book-to-market effects. We construct two portfolios thatdiffer in their discretionary current accruals, but not in their size and book-to-market characteristics. We then compare their estimated intercepts in aregression of portfolio returns on the Fama–French ~1993! three-factor re-turns in Table IV,
Rpt 2 Rft 5 a 1 b{~Rmt 2 Rft ! 1 s{SMBt 1 h{HMLt 1 et , ~3!
where t is a calendar ~not event!! month index; Rpt is the relevant conserva-tive or aggressive DCA portfolio return adjusted for size and book-to-marketdifferences to be explained below; Rmt is the return on the value-weightedCRSP index; Rft is the beginning-of-month three-month T-bill yield; SMBt isthe return on small firms minus the return on large firms; and HMLt is thereturn on high book-to-market stocks minus the return on low book-to-market stocks ~see Fama and French ~1993!!. IPO firm returns are includedin the portfolio returns only for the period from four to thirty-nine monthsafter the IPO fiscal year-end. If the Fama–French return model is an appro-priate expected return model, the intercepts are expected to be zero if DCAhas no effect. Thus, any remaining significant differences between inter-cepts of the two portfolios can be ascribed to differences in DCA.
To ensure minimal differences in size and in book-to-market while main-taining sufficient difference in discretionary current accruals between theportfolios, we sort IPO firms into two portfolios. For the size-adjusted port-folio regressions, all IPO firms are first ranked by market capitalization atthe end of the issue fiscal year ~adjusted to December 1997 prices!. Then,from each contiguous set of four IPO firms, we place the IPO firm with thehighest DCA into an aggressive DCA portfolio, and the IPO firm with thelowest DCA into a conservative DCA portfolio. Since contiguous size-ranked
18 A previous draft of our paper reports robustness of results for a sample of 1980 to 1989IPOs when ranked variable regressions are used and when IPOs are eliminated if the Jones~1991! industry cross-sectional regression coefficients are negative. For our current sample, theestimated coefficient and significance of the DCA variable are higher when we include IPOfirms with less than $20 million in the regression ~without sample truncation!.
1956 The Journal of Finance
Table IV
Fama–French Three-Factor Monthly Return Time SeriesRegressions for Size and Book-to-Market Equivalent
Conservative and Aggressive (DCA) PortfoliosThe sample consists of 1,649 domestic IPO firms going public in the period from 1980 to 1992 with anoffering price of at least $1 and a market capitalization of $20 million in 1997 prices ~in year 0!. The tablepresents time-series regression coefficients from
Rpt 2 Rft 5 a 1 b{~Rmt 2 Rft ! 1 s{SMBt 1 h{HMLt 1 et ,
where Rpt are the value-weighted or equally weighted returns of the aggressive and conservative portfoliosin calendar month t; Rmt is the return on the value-weighted CRSP index in month t; Rft is the beginning-of-month three-month T-bill yield in month t; SMBt is the return on small firms minus the return on largefirms in month t; HMLt is the return on high book-to-market stocks minus the return on low book-to-marketstocks in month t ~see Fama and French ~1993!!. Firms are considered IPOs from the fourth to the thirty-ninth month after the first fiscal year-end. IPO firms in the aggressive and conservative discretionary cur-rent accrual ~see Table II! portfolios are selected to minimize size and book-to-market differences in thefollowing way. For minimizing size differences, all IPO firms are first ranked by market capitalization at theend of the issue fiscal year adjusted to December 1997 prices. Then, for each contiguous group of four IPOfirms, the firm with the largest DCA is placed into an aggressive portfolio and the firm with the lowest DCAis placed into a conservative DCA portfolio. The book-to-market adjustment is done similarly by first rankingall IPO firms by their issue year-end book-to-market ratios. The t-statistic in the table is from the interceptin an ~unreported! equivalent regression of the difference between the conservative and aggressive portfolioreturns on the factor returns.
***, **, * denote significance at the 1, 5, and 10 percent levels, respectively.
Earnings Management of IPOs 1957
firms have very similar sizes, this selection ensures that size differences aresmall while discretionary accruals differences remain large between the twoportfolios. The book-to-market adjustment is done similarly by first rankingall IPO firms by their issue year-end book-to-market ratios.19 The time se-ries of equally weighted and value-weighted returns are calculated for eachportfolio from January 1983 through December 1995 and the Fama–Frenchthree-factor model regression is estimated.
For each aggressive and conservative portfolio, the regression produces asingle t-statistic on the estimated intercept that we use to test our hypoth-esis about the relation between DCA and post-issue stock return perfor-mance. Table IV indicates that the conservative DCA IPOs experience littleunderperformance while the aggressive DCA IPOs suffer significant post-issue underperformance. The estimated intercept for the conservative DCAIPOs ranges from 20.184 percent to 0.078 percent per month, implying arange of 22.23 percent to 10.94 percent abnormal performance per year.The aggressive DCA IPOs have intercepts ranging from 20.853 percent to20.554 percent per month, implying an underperformance range of 6.85 per-cent to 10.73 percent per year.
The estimated difference in intercepts between the conservative and ag-gressive portfolios and associated t-statistics is obtained from an unreportedtime-series regression of the difference in the returns between the conser-vative and aggressive portfolios on the factor returns. The estimated coeffi-cients in these regressions range from 20.71 percent to 20.63 percent permonth. These estimated coefficients imply abnormal trading profits rangingfrom 7.88 percent to 8.86 percent per year from a strategy of buying aggres-sive portfolio IPOs and shorting the conservative portfolio IPOs over theperiod when the IPOs remain in the respective portfolios. The t-statisticsassociated with these coefficients range from 21.7 to 23.1, suggesting thataggressive IPOs have statistically significantly poorer post-issue perfor-mance than conservative IPOs.20
D. Fama-MacBeth Panel Regressions
The test specification in this subsection focuses on controlling for contem-poraneous correlations in returns using the Fama and Macbeth ~1973! monthlyregressions. Moreover, we now use the firm’s own size and book-to-marketratios, which are recommended by Daniel and Titman ~1997! as better pre-dictors of returns than the Fama–French factor return sensitivities. A finalvariation is that this regression allows us to compare the DCA inf luence onIPO firm returns against its inf luence on non-IPO firm returns.
19 The members of the aggressive and conservative portfolios in this section differ from thosein earlier sections because here we control for size and book-to-market differences betweenportfolios.
20 The accruals effect increases if we truncate the sample at the 1st and 99th percentiles ofDCA.
1958 The Journal of Finance
One cross-sectional regression is run for each month, and overall statisticsare calculated by averaging the time series of estimated coefficients andt-statistics. For each month, the returns ~in percent! for all firms with ap-propriate data are regressed on lagged realizations of each firm’s own fouraccrual variables, and the firm’s own market-capitalization and book-to-market ratio as control variables. We include an extra size control for smallerfirms with equity capitalization of less than $100 million.
Our sample includes all firms ~with and without IPOs! that have suffi-cient CRSP and COMPUSTAT data to compute our variables. Additionally,firms must have a market capitalization entering the regression of at least$20 million ~in 1997 constant dollars!, and a two-digit SIC code that placesthem in an industry in which there is at least one IPO firm in our sample.These criteria allow 2,472 firms to enter the March 1982 regression, and4,230 firms to enter the February 1995 regression.
We run three sets of monthly cross-sectional regressions. The first set ofregressions, termed “16 to 1 17mo” regressions, contains 168 monthly cross-sectional regressions; the first of these regressions explains returns in March1982, the last explains returns in February 1995. The independent variablesare measured from financial statements closing six to seventeen monthsprior to the measured return. For example, the cross-sectional regressionthat explains returns in August 1985 uses accruals and other controls fromthe most recent financial statements that closed between March 1984 andFebruary 1985. This same accounting information ~for March 1984 to Feb-ruary 1985! is used in the “1 18 to 1 29mo” regression to explain August1986 returns, and in the “130 to 141mo” regression to explain August 1987returns. In sum, the first set of regressions uses independent variables fromfinancial statements in the fiscal year which lag six to seventeen monthsbehind the month of the dependent variable returns. The second set of re-gressions relates returns to accruals in the fiscal year which are laggedeighteen to twenty-nine months behind the returns. And the third set ofregressions relates returns to accruals that are lagged thirty to forty-onemonths behind.
Each row in Table V summarizes the results of about fourteen years ofregressions, with one coefficient and one t-statistic for each independentvariable. We report the overall time-series average of these 168 cross-sectional coefficients, and a t-statistic computed from the time-series of 168individual month t-statistics which assumes only uncorrelatedness acrossmonths ~but not unit-normality!.21 Using the t-statistics to compute signif-icance is more efficient than averaging the estimated coefficients; because
21 More precisely, they are computed as m~tm!0@s~tm!0%M 2 1# , where tm is the t-statistic inmonth m and M is the number of months ~168 or 166!. We also compute ~but do not report! anoverall t-statistic that assumes that each monthly t is itself normally distributed with meanzero and unit variance, computed as %M 2 1{m~tm!. This restriction would raise the t-statisticson our coefficient. For example, in the twelve independent variable regressions, the t-statisticon DCA changes from 22.19 to 22.78 in the first row, from 20.80 to 21.03 in the second row,and from 21.88 to 22.78 in the third row.
Earnings Management of IPOs 1959
Table V
Fama–MacBeth Panel RegressionsThe sample consists of 1,649 domestic IPO firms going public in the period from 1980 to 1992 with an offering price of at least$1 and a market capitalization of $20 million in 1997 prices ~in year 0!. Each row in Panel A summarizes the time-seriescoefficient averages ~multiplied by 100! and t-statistics computed as m~tm!0@s~tm!0%M 2 1# , where tm is the t-statistic in monthm and M is the number of months ~168 or 166! from Fama–MacBeth monthly cross-sectional regressions. Each row summarizescoefficients from 168 ~166! months of cross-sectional regressions. In the first row, the “16 to 117mo” ~3082–2095! regressions, thedependent variable is the firm’s raw return ~in percent! in a given month ~the first return is from 3082, the last is from 2095; tobe included, a regression had to contain at least five IPO realizations!. Independent variables are firm characteristics that aremeasured six to seventeen months earlier than each return month. The regressions contain 2,472 to 4,230 ~average 5 3,001.3!observations per month!. The second ~third! row summarizes equivalent regressions, in which the independent variables aremeasured 18 to 29 ~30 to 42! months before the stock return. The independent ~accruals! variables in the “IPO Accruals” columnare interacted with an issue dummy, i.e., they have nonzero values only if the relevant financial statement is the one immedi-ately following the IPO. The boldfaced IDCA variable measures issue year (0) earnings management of discretionary currentaccruals. Table II and Appendix A describe the details of computing the four accruals measures. Book-to-market and marketvalue act as controls for the Fama–French ~1993! variables. Both IPO and non-IPO firms are excluded in years in which theirlagged market value ~an included independent variable! is less than $20 million ~in 1997 dollars!, or when appropriate COM-PUSTAT or CRSP information is unavailable. “Coef.” is the average of the monthly regression coefficients, reported in percent~multiplied by 100!. Panel B provides time-series statistics for independent variables entering the monthly regressions of the “16to 117mo regressions,” that is, gathered from the 168 monthly cross sections from 3082 to 2095. In each month, we compute across-sectional mean and standard deviation for both DCA and IDCA. This panel then reports a time-series mean and a time-series standard deviation over these cross-sectional statistics.
1960T
he
Jou
rnal
ofF
inan
ce
Panel A: Summary Statistics for Sets of 168 Monthly Cross-Sectional Regression Coefficients
IPO Accruals All AccrualsOffset
Months InterceptlogS BV
MVD log~MV!log~MV!
if MV , 100 IDCA IDLA INDCA INDLA DCA DLA NDCA NDLA
Panel B: Univariate Statistics on DCA and IDCA Variables Entering the “16 to 117mo” Regressions ~in percent!
Time-Series over 168 Numbers
Description Mean Std. Dev. Range
DCA Time-series over 168 cross-sectional averages 1.94 0.82 0.2 to 4.0DCA Time-series over 168 cross-sectional standard deviations 33.73 25.18 12.5 to 119.9
IDCA Time-series over 168 cross-sectional averages 0.37 0.26 20.1 to 1.0IDCA Time-series over 168 cross-sectional standard deviations 7.08 2.67 1.2 to 12.7
Time-series over 168 “percentage of nonzero IDCA” 3.76Among nonzero IDCAs in each month, IDCA time-series over 168 cross-sectional averages 10.96 6.69 22.8 to 26.3Among nonzero IDCAs in each month, IDCA time-series over 168 cross-sectional standard deviations 36.40 6.88 23.3 to 54.5
Earn
ings
Man
agemen
tof
IPO
s1961
the early and late months with few observations are noisy and have lowt-statistics, these are appropriately down-weighted.22 We also impose an ad-ditional filter that at least five IPO firms must be available in a sampleperiod because such months have undue inf luence on univariate means andstandard deviations, and coefficient estimates ~but not on the aggregatedt-statistics!. This filter disqualifies twelve months preceding the reportedregressions.
Table V presents the results of these cross-sectional regressions. ~Coeffi-cients are quoted in percent.! IDCA is the accruals variable from the firstpost-IPO financial statement; this is zero for non-IPO accruals. It measuresthe inf luence of IPO accruals in explaining post-IPO accruals. Similarly, IN-DCA, IDLA, and INDLA measure the inf luence of other IPO accruals. Theaverage monthly IDCA coefficient in the “16 to 117mo” regressions is 21.569percent ~t 5 24.1!. As suggested by the time-series plot of abnormal returns~Figure 2!, the IDCA coefficient is smaller in “ 118 to 129mo” regressionsbut larger in “130 to 41mo” regressions. The average of the IDCA coeffi-cients over the three post-IPO years is 21.61 percent ~5 2~1.569 1 0.412 12.836!03!. ~Its three-year t-statistic is 24.88 assuming i.i.d. unit-normality.!To interpret the economic significance of this average coefficient, we makeuse of the univariate statistics in Panel B.
Averaging over the 3.76 percent of firm-return months that are issuemonths and so have nonzero IDCA, the average cross-sectional mean of IPOdiscretionary current accruals is 10.96 percent and its average cross-sectional standard deviation is 36.4 percent. This indicates that 2.11 percent~5 1.61%{10.96%{12! of annual stock return underperformance can be attrib-uted to an average level of earnings management in IPOs. As to performancedifferences across conservative versus aggressive issuers, the three-year av-erage IDCA coefficient ~21.61 percent! suggests that a one cross-sectionalstandard deviation in IDCA ~36.4 percent! explains a 27.0 percent~5 1.61%{36.2%{12! annualized return differential.
The cross-sectional regressions in the bottom half of Panel A address whetherthe observed predictive power of IDCA for future returns is unique to IPOsor is also common to non-issue-related DCA. Firms in other periods, outsideof the IPO event, may have other reasons to manage earnings, such as theavoidance of debt covenant constraints or regulatory restrictions, the pay-ment of executive bonuses, or the issuance of seasoned equity ~Teoh, Welch,and Wong ~1998!!. Sloan ~1996! reports that total accruals can predictone-year-ahead returns in the population of COMPUSTAT firms ~note thathe does not separate accruals into discretionary and nondiscretionary com-ponents!. We thus add a set of accrual variables, nonboldfaced, to denoteaccruals that are not IPO accruals ~all accruals for non-IPO firms, and non-IPO period accruals for IPO firms!. They measure whether accruals canpredict future returns in the general population of firms. ~General accrual
22 Fama and MacBeth ~1973! do not have this problem because their variables are not dummyvariables and are equally available in all months.
1962 The Journal of Finance
coefficients have smaller standard errors than IPO accrual coefficients be-cause there are many more non-IPO than IPO firms.! The coefficients on theIPO-related boldfaced accrual variables now measure the incremental pre-dictive ability of accruals to explain post-IPO returns, above and beyondwhat accruals can normally predict for all firms during non-IPO periods.
The estimated general DCA coefficients average to 20.47 percent overthree years. The average discretionary current accruals population mean~1.94 percent! implies that average earnings management accounts for 0.11 per-cent ~5 0.47%{1.94%{12! annual underperformance in the general pop-ulation. But, although IPO accruals are larger ~10.96 percent on average!,the generic 20.47 percent DCA coefficient can explain only 0.62 percent~5 0.47%{10.96%{12! of the post-IPO annual return underperformance, a smallamount of the rather large average post-IPO underperformance. A firm witha one cross-sectional standard deviation more aggressive earnings manage-ment measure ~36.4 percent! underperforms by 2.05 percent per year~5 0.47%{36.4%{12! over the three following years, which is a respectablebut not overwhelming return differential.
More important for us, the estimated coefficients suggest that only a smallpart of IDCA’s ability to explain post-IPO returns comes from a generalability of DCA to explain post-IPO returns. When the non-issue-specific DCAvariable is added, the three-year average IPO-specific IDCA coefficientchanges from 21.61 percent ~in the upper-half of Panel A! to 21.17 percent~in the lower half of Panel A!, and remains statistically and economicallysignificant.
Following the analysis above, the inclusion of non-IPO DCA accrualsreduces the implied mean IPO-specific IDCA effect from 2.11 percent to1.53 percent annualized return underperformance and reduces the impliedone-standard cross-sectional deviation IDCA effect ~i.e., the predicted returndifference between conservative and aggressive issues! from a return under-performance of 7.0 percent to 5.1 percent per year. This 5 percent returndifferential per year is still relatively large and in line with our earlier es-timates of economic significance. Note that when the IPO dummy equalsone, approximately 29 percent of the predicted underperformance is attrib-utable to the general DCA effect, and 71 percent to the IPO unique IDCAeffect. This decomposition can be computed from the ratio of the IDCA andDCA coefficients. Said differently, the estimated coefficients ascribe moreeconomic significance to the incremental IPO accruals inf luence on subse-quent returns than to the general population accruals inf luence on sub-sequent returns.
Our paper is concerned with the three-year, not one-year, effect. The summedthree-year total coefficient is always statistically significant. The weak DCAcoefficients in the middle regressions are consistent with Figure 2, whichillustrates only mild underperformance during post-event months 14 to 22for even the aggressive quartile. The evidence suggests that our effect isstrong in the first year immediately after the IPO, weak in the second year,and then picks up again strongly thereafter. ~The coefficient and t-statistic
Earnings Management of IPOs 1963
are also negative if we lag one more year, i.e., 42 to 59 months.! The U-patternin coefficients could be because of noise or because aggressive firms arediscovered either very soon or much later after their IPO.
To conclude, we find that the earnings management variable is incremen-tally important during an initial public offering in explaining post-IPO long-run performance.23
IV. Post-Issuing Activity
If our earnings management hypothesis is correct—that aggressive earn-ings management leads to poorer aftermarket performance as firms can nolonger maintain appearances and must thus disappoint their investors—wewould expect to see that conservative IPO accruers issue more seasonedequity offerings than aggressive IPO accruers, at least after the initial “de-ception” period. After all, issuers cannot borrow from future earnings toboost current earnings forever. The link between earnings management andpost-issuing activity could be mechanical ~in that aggressive earnings man-agers eventually earn such poor post-IPO returns that they are unable toraise capital in the SEO market!, or it could be direct ~in that aggressiveearnings managers lose the trust of market participants!. Both of these in-f luences would be consistent with our hypothesis.
To test this hypothesis, we obtain a sample of seasoned equity offeringsfrom SDC ~1980–1997!, and match ~by CRSP IPERM! seasoned equity offer-ings to their corresponding IPOs. Equity offerings later than five years afterthe first post-IPO financial statements are excluded. Figure 3 displays thetime-profile of seasoned equity offerings by post-issue quarter. For the 1,649initial public offerings, we find 635 IPOs returning to issue 868 seasonedequity offerings. This frequency of SEOs after IPOs is similar to the ratereported in Welch ~1989!, even though we examine only firms with sufficientdata to compute issue-year accruals. Issuing activity peaks about one yearafter the IPO for all quartiles ~the highest slope in Figure 3!. Of the 412firms in each quartile ~as defined in Table I!, 170 of the conservative IPOissuers returned within five years with a total of 238 offerings. In contrast,only 152 of the aggressive IPO issuers returned for a total of 199 issues. Putanother way, conservative issuers returned 20 percent more frequently thanaggressive issuers to raise funds in a seasoned equity offering. This differ-ence is large enough to be economically meaningful, although alone it is notlarge enough to serve as an earnings management deterrence for most IPO
23 We also experiment with a “venture-capital” variable ~VC! in our regression. SDC indi-cates that 41.4 percent of IPOs in our sample are venture-capital backed. These venture-capitalbacked IPOs are distributed evenly across the four quartiles from conservative quartile 1 toaggressive quartile 4 as follows: 27.1 percent, 23.7 percent, 24.6 percent, and 24.6 percent.Thus, VC-backed IPOs appear about as often in the conservative as in the aggressive quartiles.When VC-backing is added to the set of twelve independent variables, the coefficients on theVC dummy in the three yearly lags are 0.22 percent, 0.01 percent, and 0.36 percent, witht-statistics of 0.06, 20.45, and 1.28 respectively. These small effects are inconsistent with Bravand Gompers ~1997!.
1964 The Journal of Finance
firms. This evidence is also remarkable in light of the Welch ~1989! signal-ing model, which explains IPO underpricing with the desire of high-qualityfirms to separate themselves. Jegadeesh, Weinstein, and Welch ~1993! notethat high IPO initial returns cannot easily be attributed to issuer choicebecause either issuers set a deliberately low offering price or because themarket surprises issuers in its unexpectedly high post-IPO valuation of shares~“market feedback”!. They attribute higher reissuing frequency of underpric-ing IPOs to market feedback. Our evidence here, however, examines a vari-able ~earnings management! that is chosen by the issuer. If we equate “high-quality issuers” with “conservative accruers,” then our evidence suggests thathigher quality issuers may indeed forgo pretending higher quality and maybe rewarded by being able to reissue more frequently after the IPO.24
24 This evidence does not imply that more conservative firms expect to return to the marketwith higher probability. They may simply respond to the post-IPO stock return performance.
Figure 3. Cumulative seasoned equity offerings (SEOs) post-IPO by event month. Thesample are 1,649 IPOs from the 1980–92 period. Details are described in Table I. Firms are di-vided into quartiles based on how aggressively they manage their earnings. Our measure of earn-ings management is firms’ discretionary current accruals ~DCA!, which adjusts for industry, size,and growth. Details are described in Table II and Section I.B. The graph displays the total num-ber of seasoned equity offerings by quarter relative to the first post-IPO financial statements.
Earnings Management of IPOs 1965
V. Conclusion
This paper examines the relation between the long-run post-IPO returnunderperformance and IPO firms’ earnings management. We find that dis-cretionary current accruals—which are under the control of managementand proxy for earnings management—are high around the IPO relative tothose of nonissuers. The paper documents that issuers with higher discre-tionary accruals have poorer stock return performance in the subsequentthree years. A firm classified to be in the most aggressive quartile of IPOearnings managers experiences on average a 15 to 30 percent worse three-year performance after its earnings report than a firm classified to be in themost conservative quartile. This result is robust with respect to the inclu-sion of other explanatory variables documented in the underperformanceliterature, to alternative test specifications, and to alternative abnormal re-turns measures. The IPO issuers in the conservative quartile also return tothe capital market for a seasoned equity offering about 20 percent morefrequently over a five-year period than those in the aggressive quartile,indicating a potential post-issue benefit to less-aggressive IPO earnings man-agement. These results are consistent with an inability of investors to fullyunderstand managerial earnings choices. Because investors behave as if theyare fixated on these high earnings, they are disappointed later.
These findings have implications for investors, firms, and accounting stan-dard setters. Investors may want to use information contained in the pre-offering accounting accruals to discriminate among issuers. Entrepreneursmay want to consider how legitimate accounting choices can lower the firm’scost of equity capital or increase their own welfare. Finally, accounting stan-dard setters may find these results useful for evaluating how much discre-tion they should allow corporate managers to adjust reported earnings.
Appendix A: Calculation of Discretionary Accruals
The four accrual variables in the paper are: discretionary current accruals~DCA!, nondiscretionary current accruals ~NDCA!, discretionary long-termaccruals ~DLA!, and nondiscretionary long-term accruals ~NDLA!. Thesefour variables are components of total accruals AC, measured usingCOMPUSTAT annual item numbers in parentheses as follows:
AC [ Net Income ~172! 2 Cash Flows from Operations ~308!. ~A1!
When cash f low from operations ~308! is unavailable ~prior to 1987!, it ismeasured as funds f low from operations ~110! minus current accruals CA.Current accruals are defined as the change in noncash current assets minusthe change in operating current liabilities,
CA [ D@current assets ~4! 2 cash ~1!#
2 D@current liabilities ~5! 2 current maturity of long-term debt ~44!#.
~A2!
1966 The Journal of Finance
Our paper follows the accounting literature in calculating current accru-als as
CA [ D@accounts receivables ~2! 1 inventory ~3! 1 other current assets ~68!#
2 D@accounts payable ~70! 1 tax payable ~71!
1 other current liabilities ~72!#, ~A3!
which reduces the inf luence of nonstandard classifications of certain items.Nondiscretionary variables are expected accruals from a cross-sectional
modification of the Jones ~1991! model ~see Teoh, Wong, and Rao ~1998!! andthe discretionary variables are the residuals. Expected current accruals foran IPO firm in a given year are estimated from a cross-sectional regressionin that year of current accruals on the change in sales ~12! using an esti-mation sample of all two-digit SIC code peers. ~The IPO firm and otherfirms conducting an IPO or SEO firm in that year are not included in theregression.! Thus, for the expected current accruals of an IPO firm i in yeart, we run the following cross-sectional OLS regression:
CAj, t
TAj, t215 a0S 1
TAj, t21D 1 a1SD Salesj, t
TAj, t21D 1 ej, t , j [ estimation sample,
~A4!
where D Sales is the change in sales, and TA is total assets ~6!. Nondiscre-tionary current accruals are calculated as
NDCAi, t [ [a0S 1
TAi, t21D 1 [a1SD Salesi, t 2 DTRi, t
TAi, t21D, ~A5!
where [a0 is the estimated intercept and [a1 is the slope coefficient for IPOfirm i in year t, and DTRi, t is the change in trade receivables ~151! in yeart for issuer i. We subtract the increase in trade receivables from change insales to allow for the possibility of credit sales manipulation by the issuer~for example, by allowing generous credit policies to obtain high sales priorto the offering!. See Teoh, Wong, and Rao ~1998! for evaluation of the ro-bustness of this measure relative to other measures. The results of our paperare robust to omitting this adjustment.
Discretionary current accruals, DCAi, t , for IPO firm i for year t are rep-resented by the residual:
DCAi, t [CAi, t
TAi, t212 NDCAi, t . ~A6!
To obtain discretionary and nondiscretionary long-term accruals, discre-tionary and nondiscretionary total accruals are first estimated. The dis-cretionary total accrual, DACi, t , for IPO firm i for year t is calculated in a
Earnings Management of IPOs 1967
similar manner as for current accruals except that now total accruals AC isused as the dependent variable and the regression includes gross property,plant, and equipment ~PPE! as an additional explanatory variable.
S ACj, t
TAj, t21D 5 b0S 1
TAj, t21D 1 b1SD Salesj, t
TAj, t21D 1 b2S PPEj, t
TAj, t21D 1 ej, t ,
j [ estimation sample. ~A7!
Nondiscretionary total accruals or NDTAC are calculated as:
NDTACi, t [ Zb0S 1
TAi, t21D 1 Zb1SD Salesi, t 2 DTRi, t
TAi, t21D 1 Zb2S PPEi, t
TAi, t21D,
~A8!
where PPE is the gross property, plant, and equipment ~7!, Zb0 is the esti-mated intercept, and Zb1 and Zb2 are the estimated slope coefficients for IPOfirm i in year t. Thus, nondiscretionary long-term accrual is the differencebetween nondiscretionary total accrual and nondiscretionary current ac-crual. Finally, discretionary long-term accrual is the difference between asset-scaled long-term accrual and nondiscretionary long-term accrual.
We emphasize discretionary current accruals, DCA as the key variablerepresenting earnings management in the paper. Though discretionary long-term accruals also represent earnings management, managers have greaterf lexibility and control over current versus long-term accruals. The non-discretionary components measure expected accrual responses to changes infirm business conditions, and so are not considered proxies of earningsmanagement.
To illustrate the calculation of DCA, consider Integrated Waste ServicesInc., ticker IWSI, CUSIP 457952, CRSP IPERM 76170, and SIC code 17.IWSI went public in May 1990 and its fiscal year 0 month was December1990. The relevant accounting data items to compute DCA are shown inTable AI.
There were twenty-one firms in IWSI’s two-digit SIC industry: Amelco~CUSIP 023438!, Amre ~032153!, Apogee ~037598!, Canisco Resources ~137587!,Cerbco ~156713!, Diversified Communication ~254919!, Emcor Group ~29084Q!,Enviroq ~293941!, Gmx Communications ~361911!, Heist ~423076!, Insitu-form East ~457662!, Insituform Group ~457663!, Irex ~462683!, K D ~482447!,KDI ~482452!, MMR ~553100!, Metalclad ~591142!, Naylor ~639349!, RyanMurphy ~783508!, TD ~87299Y!, and Williams ~969493!. Repeating the CAcomputations for these firms, and estimating the Jones model yields thefitted equation ~see equation ~A4!!
CAj, t
TAj, t215 20.014S 1
TAj, t21D 1 0.121SD Salesj, t
TAj, t21D 1 ej, t .
1968 The Journal of Finance
Equation ~A6! gives IWSI’s discretionary accruals as
DCAi, t [CAi, t
TAi, t212 NDCAi, t
53.949
20.3752 F20.014
20.3751 0.121S9.767 2 3.837
20.375 DG 5 0.1593.
This places IWSI into accruals quartile 3, according to the quartile break-points in Table II.
Appendix B: Methods of Earnings Management
Accounting earnings that conform with GAAP can be manipulated becausealternative treatments for accounting events are permitted. This section brief lydiscusses earnings management by choice of accounting methods, applicationof accounting methods, and timing of asset acquisitions and dispositions.25
1. Accounting Method Choice. The choice of accounting methods affectsthe timing of when revenues and expenses are recognized in income.Choices that advance the recognition of revenues and delay the recog-nition of expenses increase reported income. For example, the“percentage-completion method” permits recognizing revenues in on-going projects, whereas the “completed-contract method” recognizesrevenues only at completion. If input prices are falling, LIFO ~last-in-first-out! costs of goods sold ~based on later lower prices! are lowerthan FIFO ~first-in-first-out! costs. For depreciable assets, straight-
25 Earnings can also be managed by “real” decisions, such as timing and choice of invest-ments, that have not only accounting but also economic implications. See Davidson, Stickney,and Weil ~1986!.
n IPO Current Accruals ~CA!: 3.949Trade receivable 5.985 2.148 3.837Sales 21.020 11.253 9.767Total assets — 20.375 —
Earnings Management of IPOs 1969
line depreciation charges lower depreciation expenses more than ac-celerated depreciation in the initial periods.
2. Accounting Method Application/Discretionary Estimates. Even after theentrepreneur has chosen the accounting methods, there remains dis-cretion in terms of how the accounting principles are applied. For ex-ample, the entrepreneur has discretion in the estimates of service livesand salvage values of depreciable assets, lives of intangibles, uncol-lectible rate on accounts receivable, cost of warranty plans, the degreeof completion of long-term projects for revenue recognition, the actu-arial cost basis for pension plan, and the interest rates for capitalizedleases and for pension accounting.
3. Accounting Method Timing. The entrepreneur also has discretion overwhen and how events are recognized as accounting events requiringdisclosure in the financial statements. For example, he has discretionover when and how much to write off bad loans and impaired assets, aswell as over the estimates of market values in the application of thelower-of-cost-or-market method for inventory. He decides intent ~long-term appreciation or short-term speculative classification! in the ap-plication of marked-to-market accounting for investments to affect therecognition of unrealized holding gains and losses. Furthermore, hedecides how events are classified. For example, a liability may be rec-ognized as contingent, even if it is almost certain, thus avoiding rec-ognition of an expense in the income statement. He may also classifyan indirect cost as a product cost rather than a period expense to avoidshowing the expenditure as an expense in the income statement.
4. Timing. The timing of asset acquisitions and dispositions can affectaccounting earnings as follows. The entrepreneur can choose when andhow much to invest in R & D, advertising, and maintenance costs, allthree of which are recognized as expenses in the period when the costsare incurred. The entrepreneur also decides the timing of the sale ofproperty, plant, and equipment to accelerate or delay recognition of gainor loss. The entrepreneur can accelerate or delay shipments of merchan-dise to customers at the end of a period to affect the timing of reve-nues. Finally, the entrepreneur’s own compensation schedule can bealtered to affect when compensation expenses are recognized in income.
The newsletter Financial Statement Alert, edited by Kellogg and Kellogg,reports suspicious examples of corporate earnings management, some of whichmay be fraudulent. The following summarizes some examples noted in Kelloggand Kellogg ~1994, Part 3!:
• Automatix overstated sales by including ~1! shipments of equipmentbefore providing necessary services and other equipment for customersto determine acceptance of product, ~2! shipments to foreign subsidiar-ies before they were subsequently relayed to end customers, and ~3!orders for goods to be shipped on trial.
• Alleghany International did not disclose facts about an unusual realestate sale.
1970 The Journal of Finance
• American Express and Fireman’s Fund swapped liabilities without trans-ferring risks, and recorded premiums as income.
• Cannon Group failed to write down inventory.• Cineplex Odeon Co. misclassified revenue items ~gains and losses from
asset sales are included in revenue from operations instead of otherrevenues!, through choice of a fixed-costs amortization policy that al-lows for significant managerial discretion ~fraction amortized dependson the manager’s estimates of future revenues!, mislabeling captionsand misclassifying items ~labeling bottom-line net income as income be-fore extraordinary items, hiding related party transactions in other cat-egories of revenues and accounts receivable, mislabeling cash f low fromoperations!, inf lating accounts receivables, and making inadequate pro-vision for bad debts.
• Light Street Income Fund traded equity securities around ex dividenddate, and bought and sold other securities at a loss in order to includedividend income as investment income and note capital loss, therebyinflating operating income ~focus of analysts! without any effect on bottom-line income.
• Marsh and McClellan failed to write down inventory, mark-to-marketequity investments, and record a material loss. In addition, they over-stated liabilities.
• Oak Industries smoothed earnings by establishing reserves, capitalizedlosses at start-up operations without proper establishment of reserves,refused to write down losses when appropriate, did not provide for losseson products that required further design work, and did not provide forlosses and write-offs of uncollectible accounts receivable.
• Prime Motor Inns included related party transactions in operating re-sults, inf lated receivables with inadequate provision for losses, inade-quately explained classification of asset categories, overstated revenues,inaccurately reported segment results, inadequately disclosed potentialliabilities with third party transactions and related party transactions,and deferred writing down impaired assets.
• Savin Co. capitalized research and development expenditures instead ofreporting them as expenses when incurred.
• Time Energy Systems reported management and incentive fee incomeand R & D income before providing services.
• Wespercorp recorded sales before assembly and shipment, used im-proper estimates of completion on long-term contracts, and unbundledhardware and software components to pick up sales on hardware ship-ments on long-term contracts.
Appendix C: Further Book-to-Market and Firm-Size Controls
Table CI cuts the sample into four categories based on book-to-marketratio, four categories based on equity capitalization, and sixteen cross-categories, and reports statistics on discretionary current accruals ~DCA!and relevant market-adjusted buy-and-hold returns. The All column indi-
Earnings Management of IPOs 1971
cates that stock return underperformance monotonically decreases with firmsize, but there is no apparent relation in the All row—that is, within book-to-market quartiles. The overall Pearson correlation of 20.065 and Spear-man correlation of 20.141 are both significant at less than the 1 percentlevel. The table shows that the predictive ability of DCA is not driven by asmall number of firms with certain firm size and book-to-market character-istics only. The accruals inf luence patterns are also observed looking withinthe cells. Thus, our findings differ from those in Brav and Gompers ~1997! inthat we do not find underperformance or the accruals effect isolated within
Table CI
Distribution of Discretionary Current Accruals Means,Three-Year Return Means, and their Correlations in
Portfolios Classified by Size and Book-to-Market Quartiles.The sample here is as described in Table I except that we do not apply the $20 million sizecutoff. Firms are first grouped into four equal-numbered quartiles based on each firm 's marketvalue adjusted to December 1997 prices ~MV* ! and into four equal-numbered quartiles based oneach firm's book-to-market ratio. Based on these quartile ranks, we construct subgroups ~“cells”!categorized jointly by both the market value and book-to-market ratios ~these subgroups haveunequal numbers of firms!. For each cell, we then report the mean of our earnings managementvariable ~mDCA!, the three-year buy-and-hold returns net of the respective market index ~mBH!,and the within-cell Pearson correlation ~ rpr! and Spearman correlation ~ rsp!.
the small size and book-to-market cells only. Our earnings management vari-able, DCA, shows some systematic relation with size ~larger for the twosmallest-sized quartiles! but not with book-to-market. ~It is not distinctlydifferent across book-to-market quartiles.! A strong correlation between re-turns and accruals is present in many of the sixteen cells and there is noapparent systematic pattern of where they are present. Thus, our DCA vari-able is unlikely to be just a proxy for small size and low book-to-market. Weare fairly confident that our test specifications and controls allow us to testthe incremental inf luence of accruals in predicting post-issue returns with-out significant contamination by size or book-to-market.
REFERENCES
Ali, Ashiq, 1996, Bias in analysts’ earnings forecasts as an explanation for the long-run under-performance of stocks following equity offerings, Working paper, University of Arizona.
Barber, Brad M., and John Lyon, 1997, Detecting long-run abnormal stock returns: The empir-ical power and specification of test statistics, Journal of Financial Economics 43, 341–372
Brav, Alon, and Paul A. Gompers, 1997, Myth or reality? The long-run underperformance ofinitial public offerings: Evidence from venture and nonventure capital-backed companies,Journal of Finance 52, 1791–1821
Buser, Stephen A., and K. C. Chan, 1987, Nasdaq/NMS Qualification Standards, Ohio Regis-tration Experience and the Price Performance of Initial Public Offerings, ~Columbus, Ohio,Department of Commerce and National Association of Securities Dealers, Inc.!.
Cheng, Li-Lan, 1995, Equity issue underperformance and the timing of security issues, Work-ing paper, Massachusetts Institute of Technology.
Daniel, Kent, and Sheridan Titman, 1997, Evidence on the characteristics of cross sectionalvariation in stock returns, Journal of Finance 52, 1–33.
Davidson, Sidney, Clyde Stickney, and Roman Weil, 1986, Accounting: The Language of Busi-ness ~Thomas Horton and Daughters, Sun Lakes, Arizona!.
Dechow, Patricia, Amy Hutton, and Richard Sloan, 1997, The relation between analysts’ long-term earnings forecasts and stock price performance following equity offerings, Workingpaper, University of Michigan.
Degeorge, Francois, and Richard Zeckhauser, 1993, The reverse LBO decision and firm perfor-mance: Theory and evidence, Journal of Finance 48, 1323–1348.
Fama, Eugene F., and Kenneth R. French, 1993, Common risk factors in the returns on stocksand bonds, Journal of Financial Economics 33, 3–56.
Fama, Eugene F., and James MacBeth, 1973, Risk, return and equilibrium: Empirical tests,Journal of Political Economy 81, 607–636.
Field, Laura, 1995, Is institutional investment in initial public offerings related to long-runperformance of these firms?, Working paper, University of California, Los Angeles.
Guenther, David A., 1994, Earnings management in response to corporate tax rate changes:Evidence from the 1986 tax reform act, Accounting Review 69, 230–243.
Ibbotson, Roger G., 1975, Price performance of common stock new issues, Journal of FinancialEconomics 2, 235–272.
Jain, Bharat, and Omesh Kini, 1994, The post-issue operating performance of IPO firms, Jour-nal of Finance 49, 1699–1726.
Jegadeesh, Narasimhan, Mark Weinstein, and Ivo Welch, 1993, IPO signaling and subsequentequity offerings: An empirical investigation, Journal of Financial Economics 34, 153–176.
Jones, Jennifer, 1991, Earnings management during import relief investigation, Journal ofAccounting Research 29, 193–228.
Kellogg, Irving, and Loren Kellogg, 1994, Fraud, Window Dressing, and Negligence in FinancialStatements (Shepard’s Commercial Law Series), McGraw-Hill Inc.
Earnings Management of IPOs 1973
Kim, Moonchul, and Jay Ritter, 1998, Valuing IPOs, Working paper, University of Florida.Lin, Hsou-wei, and Maureen McNichols, 1997, Underwriting relationships and analysts’ re-
search reports, Working paper, Stanford University.Loughran, Tim, and Jay Ritter, 1995, The new issues puzzle, Journal of Finance 50-1, 23–51.Lyon, John D., Brad M. Barber, and Chih-Ling Tsai, 1998, Improved methods for tests of long-
run abnormal stock returns, Journal of Finance, forthcoming.Michaely, Roni, and Kent Womack, 1996, Conf lict of interest and the credibility of underwriter
analysts recommendations, Working paper, Cornell University.Mikkelson, Wayne, Megan Partch, and Ken Shah, 1997, Ownership and operating performance
of companies that go public, Journal of Financial Economics 44, 281–307.Rajan, Raghuram, and Henri Servaes, 1997, Analyst following of initial public offerings, Jour-
nal of Finance 52, 507–529.Rao, Gita R., 1993, The relation between stock returns and earnings: A study of newly-public
firms, Working paper, Kidder Peabody and Co., New York.Ritter, Jay, 1991, The long-run performance of initial public offerings, Journal of Finance 46,
3–27.Sloan, Richard, 1996, Do stock prices fully impound information in accruals about future earn-
ings?, Accounting Review 71, 289–315.Stern, Richard, and Paul Borstein, 1985, Why new issues are lousy investments, Forbes 136,
159–190.Stoll, Hans, and Anthony Curley, 1970, Small business and the new issues market for equities,
Journal of Financial and Quantitative Analysis 5, 309–322.Teoh, Siew Hong, Ivo Welch, and T. J. Wong, 1998, Earnings management and the post-issue
underperformance in seasoned equity offerings, Journal of Financial Economics 50, 63–99.Teoh, Siew Hong, and T. J. Wong, 1998, Analysts’ credulity about reported earnings and the
overoptimism in new equity issues, Review of Financial Studies, forthcoming.Teoh, Siew Hong, T. J. Wong, and Gita R. Rao, 1998, Are earnings during initial public offerings
opportunistic?, Review of Accounting Studies, forthcoming.Welch, Ivo, 1989, Seasoned offerings, imitation costs, and the underpricing of initial public
offerings, Journal of Finance 44, 421–449.Welch, Ivo, 1997, G-III Apparel Group Inc, Case study, University of California, Los Angeles.