Economic Feasibility of Precision Irrigation in the Northern Texas High Plains Lal K. Almas West Texas A&M University, Division of Agriculture, WTAMU Box 60998, Canyon, Texas 79016 Steve H. Amosson Texas Cooperative Extension Texas A&M Research and Extension Center 6500 Amarillo Blvd West, Amarillo, Texas 79106 Thomas Marek Texas Agricultural Experiment Station Texas A&M Research and Extension Center 6500 Amarillo Blvd West, Amarillo, Texas 79106 W. Arden Colette West Texas A&M University; Division of Agriculture WTAMU Box 60998, Canyon, Texas 79016 Selected Paper prepared for presentation at the Southern Agricultural Economics Association Annual Meeting, Mobile, Alabama, February 1-5,2003 Copyright 2003 by [authors]. All rights reserved. Readers may make verbatim copies of this document for non- commercial purposes by any means, provided that this copyright notice appears on all such copies.
Transcript
Economic Feasibility of Precision Irrigation in the Northern Texas High Plains
Lal K. Almas West Texas A&M University, Division of Agriculture,
WTAMU Box 60998, Canyon, Texas 79016
Steve H. Amosson Texas Cooperative Extension
Texas A&M Research and Extension Center 6500 Amarillo Blvd West, Amarillo, Texas 79106
Thomas Marek
Texas Agricultural Experiment Station Texas A&M Research and Extension Center
6500 Amarillo Blvd West, Amarillo, Texas 79106
W. Arden Colette West Texas A&M University; Division of Agriculture
WTAMU Box 60998, Canyon, Texas 79016
Selected Paper prepared for presentation at the Southern Agricultural Economics Association Annual Meeting, Mobile, Alabama, February 1-5,2003
Copyright 2003 by [authors]. All rights reserved. Readers may make verbatim copies of this document for non-commercial purposes by any means, provided that this copyright notice appears on all such copies.
2
Economic Feasibility of Precision Irrigation in the Northern Texas High Plains Abstract:
The benefit of changing to Variable Rate Irrigation (VRI) from uniform application
methods needs to be assessed for technology adoption. Precision irrigation involves water
application in optimum amounts. Results indicate that feasibility of precision irrigation depends
on field variability, crop value, economies of scale, and useful life of the equipment.
3
Introduction:
Production agriculture is facing significant challenges such as escalating production cost,
limited irrigation water, and increased public concern about possible adverse impacts of
agricultural production on the environment. Farmers continue to strive to produce high-quality
products by using farm technologies that are profitable and environmentally friendly.
Precision farming recognizes variability in soil fertility, water availability, pest
concentrations, and crop characteristics within fields and seeks to optimize variable input use to
enhance enterprise profitability and minimize environmental impacts. Economic benefits of
switching to variable rate application (VRA) from uniform application methods depend on the
economic value of assessing and treating within-field variability. Several variables might be
responsible for yield variation in a specific field. These variables could include water, especially
for water sensitive crops such as corn, fertility, as well as tillage practices. Marek and Cox
(2000) assessed potential and future implementation of precision agriculture technologies in the
Northern Texas High Plains. Water was assessed to be the most significant factor in production
of corn, with plant population and depth of soil also responsible for significant variation in yield.
In the past the emphasis in precision farming research has been on VRA of fertilizers
when assessing the profitability of VRA. Swinton and Lowenberg-DeBoer (1998) compared
estimates for VRA of fertilizers for 54 sites in nine studies. Babcock and Pautsch (1998)
evaluated the profitability of VRA of nitrogen fertilization relative to uniform rate application.
Watkins et al. (1998) also performed an economic and environmental analysis of VRA of
nitrogen fertilizers for production of seed potatoes. Research on VRA of water is limited.
However, in their economics of precision agriculture study, Yu et al. (2000) included a fertilizer
and water interaction term in a yield estimation model of irrigated cotton production in the
4
Southern High Plains of Texas. Results indicated that the interaction of fertilizer and water
significantly affected yield. Marek and Cox (2000) in their assessment of VRI potential
determined that irrigation water was the most significant factor in the production of corn in the
Northern Texas High Plains.
A producer seeking to invest in VRA equipment is faced with the questions, “How much
will it cost? How much will yield potential be increased? Will additional returns offset the
investment cost?” Knowledge of spatial variability and yield increase can help a farmer make
appropriate economic decisions about adopting VRA. In the semi-arid region of the Texas High
Plains, research indicates that water is an important production input. In an earlier precision
farming study by Marek et al. (2001), analyses of producer yield maps revealed that yield was
variable enough to justify investment in precision irrigation technology.
Objectives:
The goal of this research was to assess economic feasibility of alternative VRI controller
technology. The specific objectives were to:
- identify and analyze the investment cost of VRI technology in Texas
- evaluate the breakeven variability in the field and estimate the breakeven yields of
grain crops to offset the cost of technology.
Methodology:
Studies of site-specific management have often focused on changes in crop input cost,
such as fertilizer or herbicide, while ignoring fixed investment costs. Fixed costs represent
annualized costs associated with durable capital investment required for VRA and other
necessary equipment. The cost estimate data for most of the equipment and technology used in
precision irrigation is collected from manufacturers and suppliers. Evaluating the feasibility of
5
investing in a new farm technology can be very complicated because of all the factors involved.
However, methodology involved in making the decision is relatively simple. First, the gross
investment cost should be estimated. Gross investment indicates the amount of capital that will
be required. However, net investment that adjusts gross investment by considering tax savings,
future salvage value and opportunity cost of investment provides an estimate of the “true”
economic cost.
The annual cost of using site-specific tools depends on the useful life of that equipment,
software and skill. If site-specific management tools are obsolete in three to four years, the
annual cost of use can be expensive. Because a dollar five years from now is not worth the
same as a dollar today, all annual costs and benefits need to be discounted to today’s dollar. This
will allow direct comparison of the costs and benefits of a site-specific management technology.
The fundamental analysis for the economic cost of investing in VRI technology and the benefits
generated from an increase in potential yield is conducted by applying a standard cost benefit
analysis. A farmer will break even if the expected additional returns above the input costs are
equal to the cost of VRI depending upon the spatial variability in the field.
To assess the economic feasibility of VRI, investments of $10,000, 15,000 and 20,000 are
assumed as possible bases for a VRI control setup on a center pivot systems. These values are
assumed for irrigation systems ¼, 3/8 and ½ mile long, respectively, and correspond to 125, 284
and 500-acre systems, respectively. Life expectancy of the system is assumed to be 5 years with
a discount factor of 4.2124 at the discount rate of 6%. This yields an additional investment cost
of $69.89, $46.30 and $34.94 per acre for each of the systems, respectively. (As new generation
control systems are developed, a 10- to 15- year life could be expected, improving the feasibility
prediction.)
6
Prices used in the economics portion of the analysis were based on 5-year average values
obtained from local markets. The average prices for the respective crops within the region are as
$3.51/bushel. Yield variability used in the respective economic analyses varied from 20 to 50%.
The future streams of returns over five years were discounted to present value (PV) using
a discount rate of six percent and compared with the initial cost for investing in the technology.
If PV is greater than the investment, adopting precision agriculture will be profitable. However,
if PV were less than the investment, precision agricultural technology would not be feasible to
implement. Given the average prices of the major crops grown in the area, corn, sorghum,
soybean, and wheat, and field variability assumption, breakeven additional yields were also
estimated for three center pivot irrigation systems.
Results and Discussion:
Before investing in variable rate irrigation technology, yield maps for each crop in each
field under each crop need to be reviewed carefully because not all fields are suitable for
implementation of variable rate irrigation on center pivot systems. A field with a center pivot
not suitable for VRI is presented in Figure 1. It indicates a nozzling problem rather than yield
deviation problem down the lateral and the problem could be corrected without using VRI.
However, the field represented by Figure 2 is considered more appropriate for use of VRI.
Figure 3 exhibits a corn yield map illustrating a production system that is a good candidate for
VRI. Such a field shows a potential for improvement with VRI. However, Figure 2 is
considered the best candidate for VRI because sectoring alone cannot fully solve the variable
yield problem. As an example, the breakeven requirement procedure using yield maps for center
pivot field can be illustrated in Figure 3 by outlining the sub level production area(s) within the
7
histogram bins by using the polygon tool available with most yield mapping software packages.
These tools compute the respective sub area(s) and associated yield. The 82-acre area
represented in Figure 3 is outlined by the black line polygon and indicates the improvement area
required for breakeven by using a VRI system. The outlined region, which is relatively small,
would require only 15 bushels per acre gain to breakeven wi th a VRI system cost of $20,000.
This improvement would have to be sustained for five years.
Breakeven additional yield levels required for justifying additional investment in VRI for
corn ranged from 12-30 bushels per acre for the ¼-mile and 6-15 bushels per acre for ½-mile
center pivot system depending on the variability in the field (Table 1). For soybean, the
breakeven yield ranged from 3-15 bushels per acre for the various systems (Table 2). For
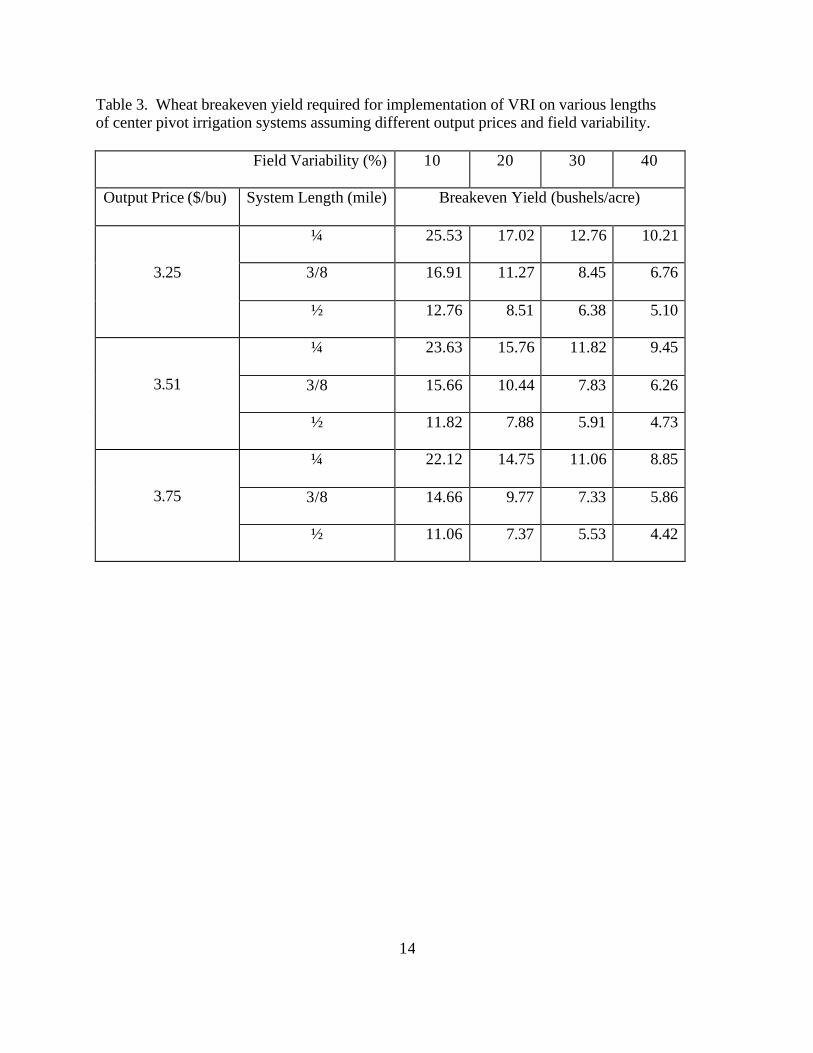
irrigated wheat, the expected breakeven yield ranged from 5-24 bushels per acre for the three
sizes of center pivot systems (Table 3). For sorghum, additional yield ranged from 380-1,900
pounds per acre for the three center pivot systems at various levels of field variability (Table 4).
The sensitivity analyses were conducted for each crop by varying the output prices. The
breakeven yield results at those output prices were also included in the respective tables.
Additionally, greater yields might be obtained from fields with much variability in
amounts of irrigation applied to different areas than from fields where irrigation was uniform.
Also, VRI would be feasible for crops of high value but low-value crops require substantially
greater yields to breakeven. Hence, substantial field variability and high crop prices are
required for VRI to be profitable.
Variable rate irrigation could be feasible and represent an important tool in the
technologies associated with precision agriculture in the northern Texas High Plains. This
8
feasibility is more apparent with higher value and more water-use sensitive crops. It seems that
VRI would be feasible for most crops grown in the region.
References:
Babcock, Bruce A. and Gregory R. Pautch. “Moving from Uniform to Variable Fertilizer Rates in Iowa Corn: Effects on Rates and Returns.” Journal of Agricultural and Resource Economics, 23, 2 (1998): 385-400.
Marek, T. and E. Cox. “Assessment of Variable Rate Irrigation Potential in the Northern Texas
High Plains.” Society for Engineering in Agriculture Conference in Australia. Adelaide, Australia. April 2000. 7 pp.
Marek, T., L. Almas, E. Cox, and S. Amosson. “The Feasibility of Variable Rate Irrigation with
Center Pivot Systems in the Northern Texas High Plains.” 2001 ASAE Annual International Meeting Paper No.01-1117, St. Joseph, MI: American Society for Agricultural Engineers.
Swinton, S. M. and J. Lowenberg-DeBoer. “Evaluating the Profitability of Site-Specific
Farming”. Journal of Production Agriculture, 11, 4 (1998): 439-446 Watkins, K. B., Yao-chi Lu, and Wen-yuan Huang. “Economic and Environmental Feasibility
of Variable Rate Nitrogen Fertilizer Application with Carry-Over Effects.” Journal of Agricultural and Resource Economics, 23, 2 (1998): 401-426.
Yu, M., E. Segarra, H. Li, R. J. Lascano, C. Chilcutt, L. T. Wilson, K. Bronson, and S. Searcy.
“The Economics of Precision Agricultural Practices in Cotton Production.” 2000 Beltwide Cotton Conferences Proceedings, National Cotton Council, Memphis, TN: 201-208.
9
Figure 1. Corn yield map illustrating a center pivot irrigation system that is not a suitable candidate for VRI.
10
Figure 2. Corn yield map illustrating a center pivot irrigation system that is an excellent candidate for VRI
11
Figure 3. Corn yield map illustrating a center pivot irrigation system that is a good candidate for variable rate irrigation.
12
Table 1. Corn breakeven yield required for implementation of VRI on various lengths of center pivot irrigation systems assuming different output prices and field variability.
Field Variability (%) 10 20 30 40
Output Price ($/bu) System Length (mile) Breakeven Yield (bushels/acre)
¼ 33.18 22.12 16.59 13.27
3/8 21.98 14.66 10.99 8.79
2.50
½ 16.59 11.06 8.29 6.64
¼ 29.84 19.89 14.92 11.94
3/8 19.77 13.18 9.88 7.91
2.78
½ 14.92 9.95 7.46 5.97
¼ 27.65 18.43 13.83 11.06
3/8 18.32 12.21 9.16 7.33
3.00
½ 13.82 9.22 6.91 5.53
13
Table 2. Soybeans breakeven yield required for implementation of VRI on various lengths of center pivot irrigation systems assuming different output prices and field variability.
Field Variability (%) 10 20 30 40
Output Price ($/bu) System Length (mile) Breakeven Yield (bushels/acre)
¼ 15.59 10.40 7.80 6.24
3/8 10.33 6.89 5.17 4.13
5.32
½ 7.80 5.20 3.90 3.12
¼ 14.66 9.77 7.33 5.86
3/8 9.71 6.47 4.85 3.88
5.66
½ 7.33 4.88 3.66 2.93
¼ 13.83 9.22 6.91 5.53
3/8 9.16 6.11 4.58 3.66
6.00
½ 6.91 4.61 3.46 2.76
14
Table 3. Wheat breakeven yield required for implementation of VRI on various lengths of center pivot irrigation systems assuming different output prices and field variability.
Field Variability (%) 10 20 30 40
Output Price ($/bu) System Length (mile) Breakeven Yield (bushels/acre)
¼ 25.53 17.02 12.76 10.21
3/8 16.91 11.27 8.45 6.76
3.25
½ 12.76 8.51 6.38 5.10
¼ 23.63 15.76 11.82 9.45
3/8 15.66 10.44 7.83 6.26
3.51
½ 11.82 7.88 5.91 4.73
¼ 22.12 14.75 11.06 8.85
3/8 14.66 9.77 7.33 5.86
3.75
½ 11.06 7.37 5.53 4.42
15
Table 4. Sorghum breakeven yield required for implementation of VRI on various lengths of center pivot irrigation systems assuming different output prices and field variability.
Field Variability (%) 10 20 30 40
Output Price ($/cwt) System Length (mile) Breakeven Yield (cwt/acre)