Policy Research Working Paper 6768 Economic Growth and Crime against Small and Medium Sized Enterprises in Developing Economies Asif Islam e World Bank Development Economics Global Indicators Group February 2014 WPS6768 Public Disclosure Authorized Public Disclosure Authorized Public Disclosure Authorized Public Disclosure Authorized
Transcript
Policy Research Working Paper 6768
Economic Growth and Crime against Small and Medium Sized Enterprises
in Developing EconomiesAsif Islam
The World BankDevelopment Economics Global Indicators GroupFebruary 2014
WPS6768P
ublic
Dis
clos
ure
Aut
horiz
edP
ublic
Dis
clos
ure
Aut
horiz
edP
ublic
Dis
clos
ure
Aut
horiz
edP
ublic
Dis
clos
ure
Aut
horiz
ed
Produced by the Research Support Team
Abstract
The Policy Research Working Paper Series disseminates the findings of work in progress to encourage the exchange of ideas about development issues. An objective of the series is to get the findings out quickly, even if the presentations are less than fully polished. The papers carry the names of the authors and should be cited accordingly. The findings, interpretations, and conclusions expressed in this paper are entirely those of the authors. They do not necessarily represent the views of the International Bank for Reconstruction and Development/World Bank and its affiliated organizations, or those of the Executive Directors of the World Bank or the governments they represent.
Policy Research Working Paper 6768
Several studies have explored the relationship between economy-level crime rates or individual-level crime and economic growth. However, few studies have examined the relationship between economic growth and crime against firms. This study uses data for about 12,000 firms in 27 developing countries and finds that
This paper is a product of the Global Indicators Group, Development Economics. It is part of a larger effort by the World Bank to provide open access to its research and make a contribution to development policy discussions around the world. Policy Research Working Papers are also posted on the Web at http://econ.worldbank.org. The author may be contacted at [email protected].
economic growth is negatively associated with crime. This relationship is stronger for small and medium firms than large firms. The study also explores several economy-wide factors and their influence on the growth-crime relationship for small and medium enterprises. The results are robust to various sensitivity checks.
Economic Growth and Crime against Small and Medium Sized Enterprises in Developing Economies
of individuals engaging in illegitimate activities (Becker, 1968). Along similar lines, per capita
economic growth may increase employment, further decreasing the rewards for criminal activity.
Generally, unemployment has been empirically associated with increases in criminal activity
(Machin and Meghir, 2000; Donohue and Levitt, 2001). Furthermore economic growth may
increase tax revenues resulting in higher government budgets for crime prevention (Cook, 2010;
Levitt, 2004). Both mechanisms propose an inverse relationship between economic growth and
crime. However, economic growth also serves as an indicator of increasing prosperity and thus
the effect on crime may depend on the level of risk aversion (Ehrlich, 1973). Increasing
prosperity may increase the number of options encouraging crime-prone behavior such as
individuals leaving their houses more often, increasing alcohol consumption, or owning more
cars. Furthermore economic growth can increase the reward for committing a crime as the
society gets wealthier. Finally legal institutions, being typically slow to adapt, may find it
difficult to deal with rapid economic growth and thus provide more leeway for criminals to
6
escape punishment, therefore reducing the costs of engaging in illegitimate activities. In general,
empirical findings have indicated a negative relationship between economic growth and crime
(Fajnzylber et al, 2002; Bourguignon, 1999; Dutta, 2009).
A few mechanisms translate well with regards to crime against firms. Economic growth resulting
in increasing economic opportunities of individuals makes firms less susceptible to theft, and
rising government spending on crime prevention may complement a firm’s security measures.
However, in terms of risk prone behavior induced by economic growth, it is unlikely that alcohol
consumption or increasing outings by individuals is highly correlated with crime against firms,
although there may be increases in firm spending on expensive property across all sizes of firms
that may attract criminal activity. Economic growth may also increase the number of firms of
various sizes, therefore increasing criminal activity given the larger number of options available
to criminals. It is expected that the rate at which legal institutions adapt to increasing economic
growth will determine the level of crime against firms. A fast growing economy may not have
the ability to cope with rapidly increasing crime. Furthermore, economic growth may allow firms
to spend more on security measures, thus reducing the losses due to crime. However, we do find
later in this study that controlling for security costs does not alter our main results.
The relationship between economic growth and crime experienced by firms may also depend on
the size of the firm. On one hand, economic growth may increase the ability of larger firms to
better protect themselves from theft and vandalism than small and medium firms which may lead
criminals to target small and medium enterprises. A key presumption of this mechanism is that
the benefits of economic growth are largely absorbed by large firms. On the other hand,
7
economic growth can increase the opportunities for small and medium firms to expand relative to
large firms that may have reached their optimal size. Such an expansion may allow small and
medium firms to protect themselves better, thereby reducing the degree of crime they face.
Given the wealth of theoretical mechanisms available in the literature, the objective of this study
is to provide empirical verification of the effect of per capita economic growth on crime
experienced by firms. Depending on which mechanisms dominate, we may have a positive or
negative association between crime and economic growth.
We structure the rest of the paper as follows. Section 2 describes the data, section 3 provides the
estimation and results, and sections 4, 5, and 6 provide instrumental variable estimations,
robustness checks, and conclusions, respectively.
2 Data and Main Variables
The data for firm level variables are collected by the World Bank’s Enterprise Surveys (ES). The
Enterprise Surveys use standard survey instruments to collect firm-level data on a country's
business environment from business owners and top managers. The surveys cover a broad range
of topics including access to finance, corruption, infrastructure, crime, competition, labor,
obstacles to growth and performance measures. The survey is designed to be representative of a
country’s private non-agricultural economy and only registered firms with at least five
employees are included in the sample. The data consist of a random sample of 12,000 firms
across 27 developing countries in different regions stratified by firm size, location, and sector
using a consistent methodology. The survey year ranges between 2007 and 2009. Police data are
8
obtained from the United Nations Survey on Crime Trends and the Operations of Criminal
Justice Systems. This police data set consists of an unbalanced panel covering years between
2003 and 2008 for both developing and developed economies. Due to the unbalanced nature of
the data set, only about 39 countries match between the ES firm level data and the UN country
level police data. Accounting for issues such as missing questions and incorrect data, the sample
size reduces to a cross-section of 27 developing economies.
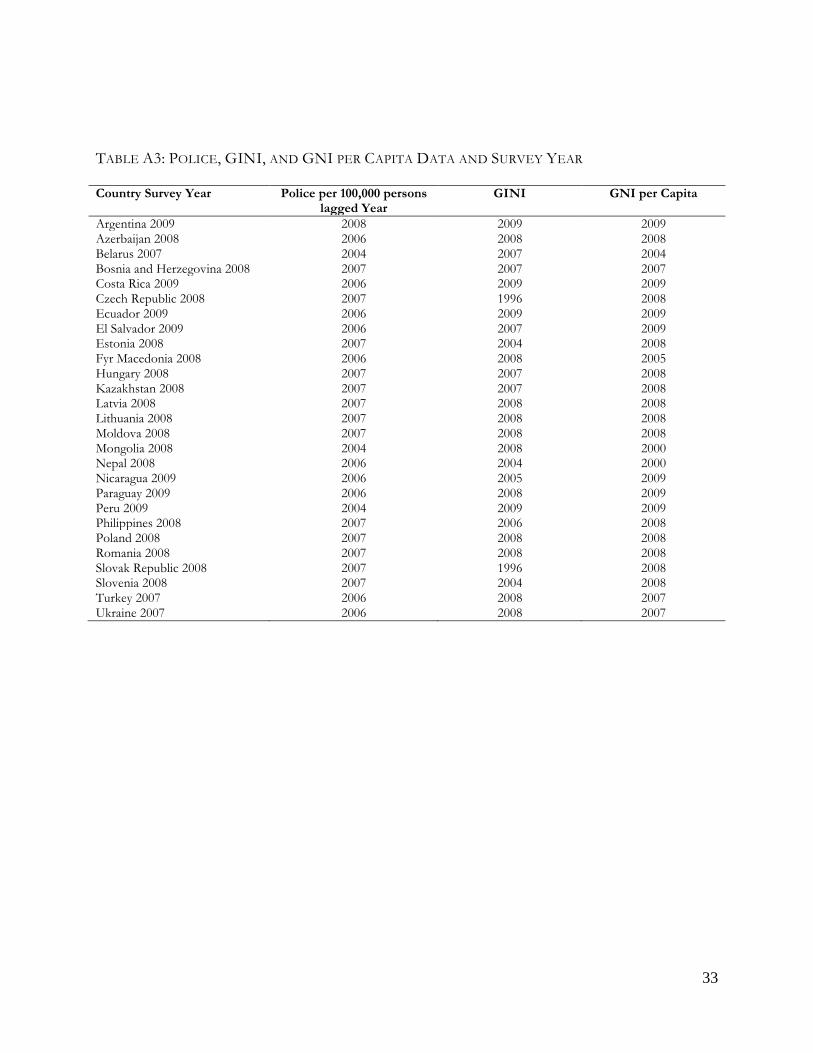
Details of countries in the main sample and their respective survey years can be found in the first
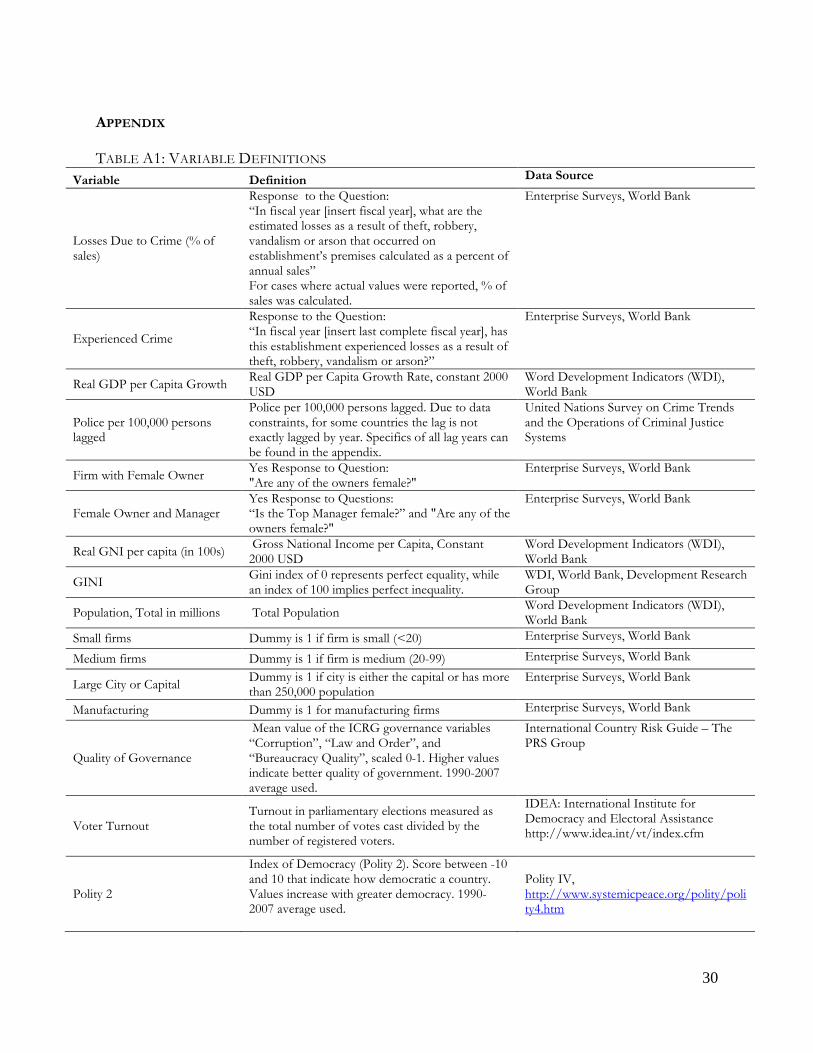
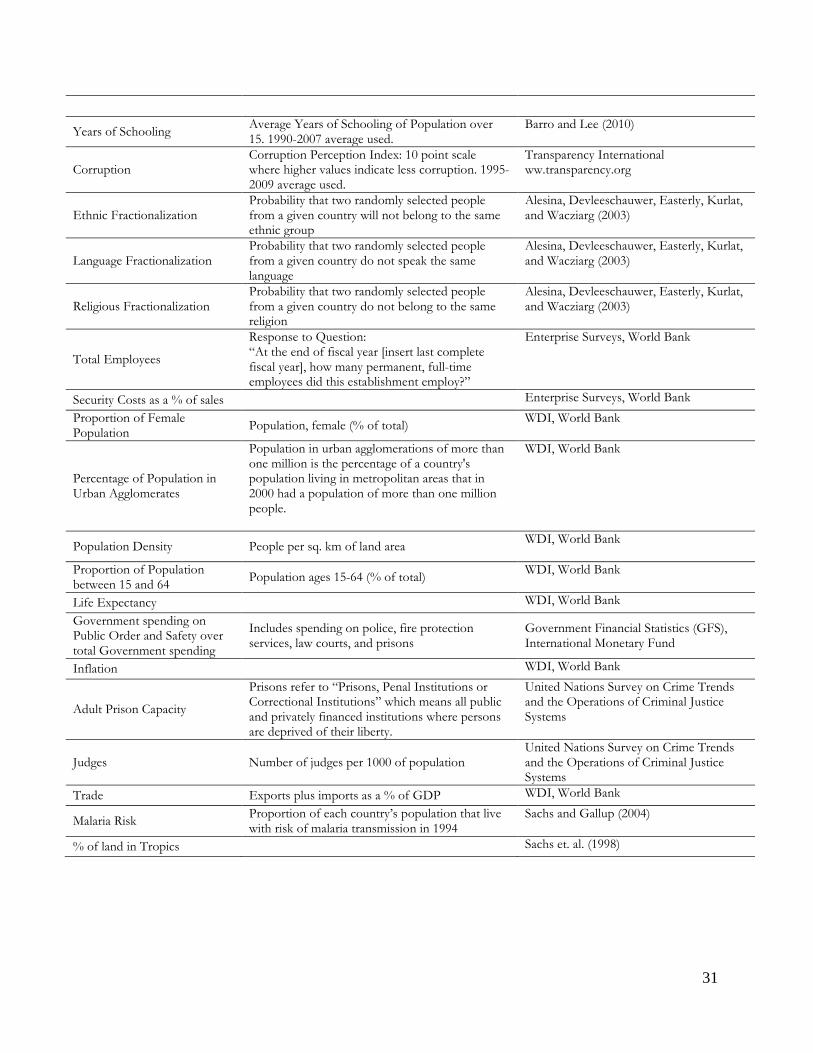
column of table A3 in the appendix. Data sources and descriptions of the variables can be found
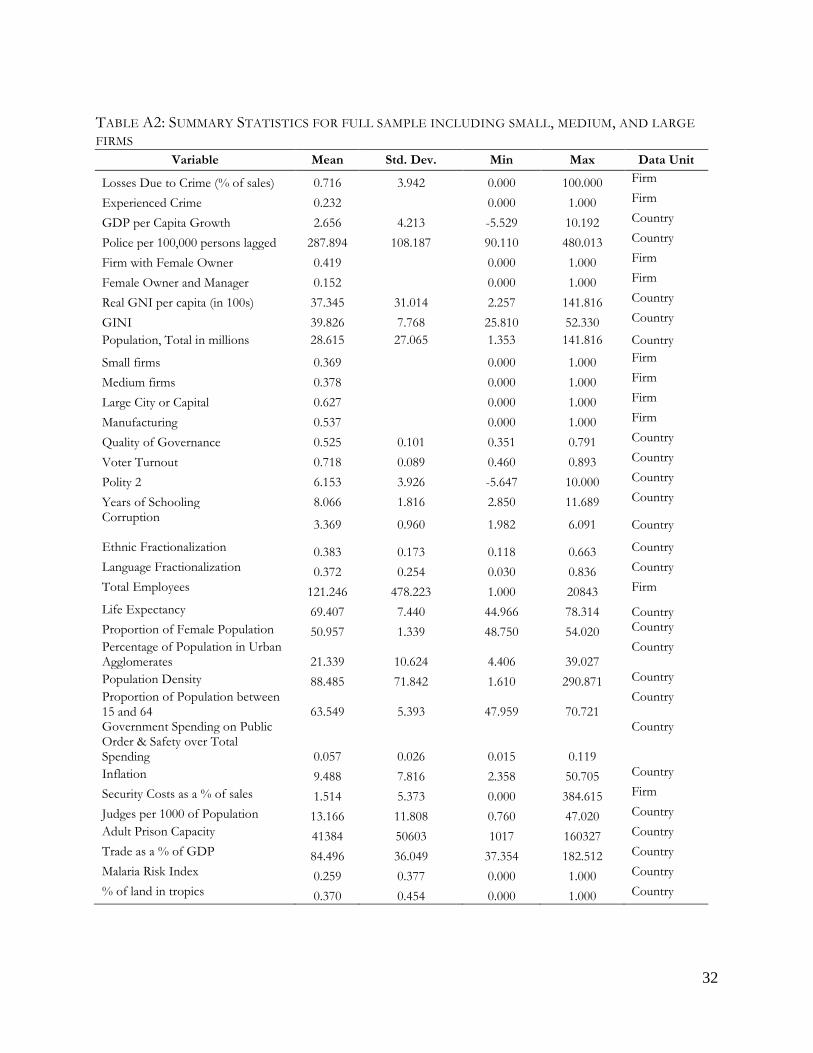
in table A1, with summary statistics in table A2.
2.1 Dependent Variable
The main dependent variable utilized is annual losses due to crime as a percentage of annual
sales. This variable is derived from the survey question: “In fiscal year [insert fiscal year], what
are the estimated losses as a result of theft, robbery, vandalism or arson that occurred on the
establishment’s premises calculated as a percent of annual sales?” In some instances the total
value of losses is reported, and in that case the share of losses due to crime over total sales is
manually calculated. Crime losses as a percentage of sales capture the intensity of crime. We
make no distinction between a firm that has experienced no crime and a firm that has
experienced crime but incurred no losses. Both firms get a zero value for the dependent variable.
This adjustment may not affect our estimations much since we retain the same results when we
examine the impact of per capita economic growth on the incidence of crime (see next
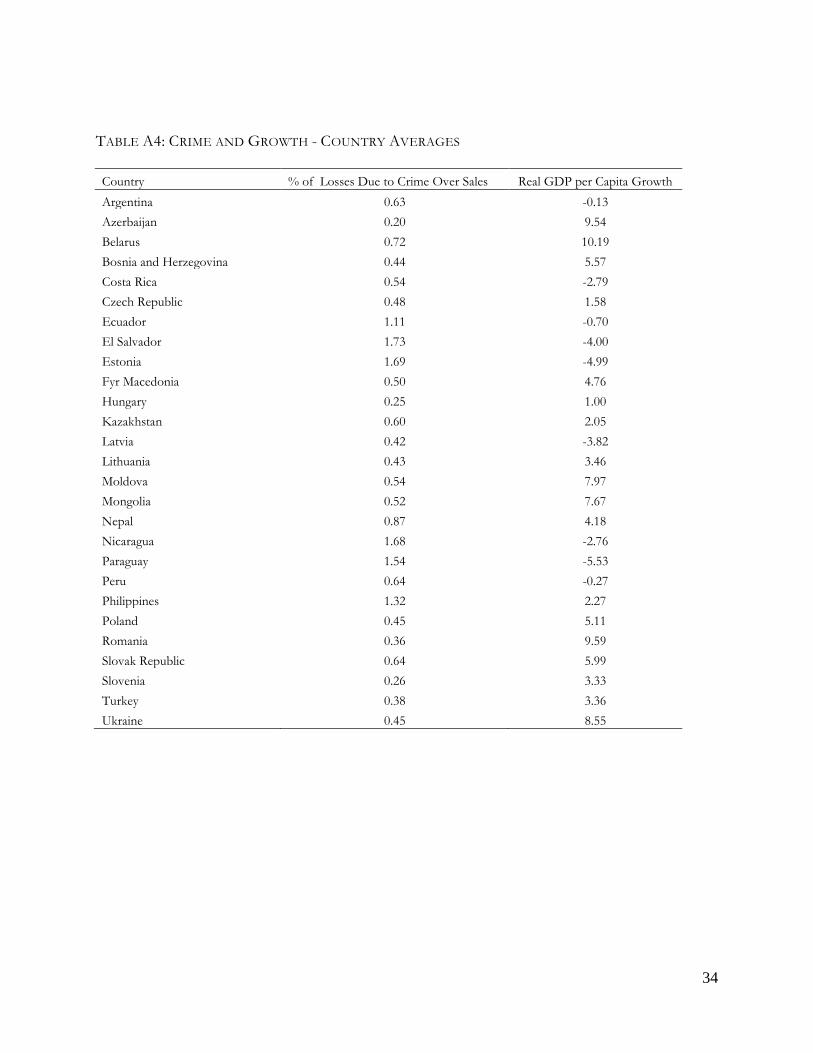
paragraph). The crime losses variable averages 0.72% in the sample with a standard deviation of
9
3.9%. Using country averages across all firms, Azerbaijan has the lowest amount of crime losses
at 0.20% of sales, while El Salvador has the highest with 1.73%.
We also estimate a model where the dependent variable is a dummy variable indicating whether
or not a firm has experienced crime in the last fiscal year. The survey question is phrased as
follows: “In fiscal year [insert last complete fiscal year], has this establishment experienced
losses as a result of theft, robbery, vandalism or arson?” This estimation elucidates the
relationship between economic growth and the incidence of crime as opposed to the burden of
crime.
2.2 Explanatory Variable
The main variable of interest is annual real GDP per capita growth rate, which is available for the
years the firm surveys were undertaken. The sample mean for the rate of economic growth is
2.66% and the standard deviation is 4.2%. Belarus and Romania are the fastest growing
economies in the sample with growth rates of 10.2% and 9.6% respectively. The country level
average of crime losses and economic growth rates are presented in table A4 for each country in
the appendix. We also use 5 year averages (2002-2007) of real GDP per capita growth and find
that the results are retained.
2.3 Other Explanatory Variables
We control for several firm level and country level variables. The degree of crime a firm faces
may depend on its size, the sector it belongs to, and its locale (Amin, 2009; Glaeser and
Sacerdote, 1999). The costs and benefits of criminal activity targeting firms may vary depending
10
on sector or size of the firm. Big cities tend to provide higher pecuniary benefits for criminals
and also criminal activity may involve lower costs due to the low probability of arrest and higher
probability of anonymity. We control for firm size using dummy variables for small and
medium firms. A small firm is defined as a firm with fewer than 20 employees, while a medium
firm has between 20 and 99 workers. Of course, when we examine the effect of economic growth
on crime for small and medium firms, we only control for small firms using a dummy variable as
we restrict the sample to only small and medium firms. We control for sector or industry by
using a dummy variable for manufacturing firms. A priori it is not clear whether a manufacturing
firm should have higher crime losses with respect to other sectors. We include a city size dummy
variable that takes the value of 1 if the city has a population of 250,000 or greater, or is a capital
city, and 0 otherwise. There is also evidence that female owned households as well as female
owned firms have a positive association with higher crime rates (Glaeser and Sacerdote, 1999;
Islam, 2013; Kelly 2000). We also include a dummy variable for whether a firm has at least one
female owner. All these variables are from the Enterprise Survey’s data set. We omit security
costs from the base estimations due to concerns of simultaneity bias between crime losses and
security costs, however later in the robustness section we do add it to the base specification and
we find that the base estimation results are unaffected.
At the country level we control for the number of police per 100,000 population. The variable is
obtained from the United Nations Survey on Crime Trends and the Operations of Criminal
Justice Systems. The variable is typically lagged by 1 year to reduce potential simultaneity bias
between crime losses and police presence. Due to data constraints, for some countries the
variable is lagged by more than one year. The specific details of the number of lags are available
11
in table A3 in the appendix. We also control the level of development of the economy using real
GNI per capita. Inequality is controlled for using the country-wide Gini index. Both variables are
prominent in the literature (Fajnzylber et al., 2002; Soares, 2004; Demombynes and Ozler,
2005). Increasing inequality typically increases the proportion of poor who may engage in
criminal activity as well as the greater reward for engaging in criminal activity. For cases where
data for the exact date are unavailable, we use data for the closest date available. The exact years
of data used for GNI per capita and the Gini index are presented in table A3 in the appendix. We
finally control for country size using the total population of the country. These data are available
from the World Bank’s World Development Indicators. Data source and description of the
variable can be found in table A1, with summary statistics in table A2.
3. Estimation
We estimate the following equation (1) using OLS when the dependent variable is crime losses
over sales, and Logit when the dependent variable is a dummy variable indicating whether a firm
experienced crime in the last fiscal year.
1 2 3 4 5 6 7 8
9 ij 10
(1)
LargeCityij j j ij j j j ij ij
ij ij
crime GDPgr Policelag Fem GNIcap GINI Population Small MediumManf
β β β β β β β β
β β ε
= + + + + + + +
+ + +
Where crime is the losses due to crime as a % of sales or a dummy variable representing whether
a firm experienced crime in the last fiscal year, GDPgr is the real GDP per capita growth rate,
Policelag is the lagged number of police per 100,000 population, Fem is a dummy representing
female ownership, GNIcap is the real Gross National Income per capita, GINI is the Gini
coefficient, Population is the total population of the economy, Small and Medium are firm size
12
dummies, LargeCity is a dummy variable for cities with population of 250,000 and greater, or
capital cities, and finally Manf is a dummy variable for manufacturing firms. When we restrict
the sample to only small and medium firms, we omit the medium firm size dummy variable.
There is, of course, some concern about whether this specification adequately captures the
economic growth-crime relationship. We include several other control variables, including
security costs, as a specification test in the robustness section and find that they do not affect the
results.
All estimates are based on standard errors clustered at the country level. In the later sections we
add additional variables and interact them with the variable of interest to elucidate several
relationships between these variables, economic growth, and crime faced by small and medium
sized firms. The usual econometric issues of endogeneity and omitted variable bias are of
concern. Reverse causality is an issue given that higher crime can lead to slower economic
growth. We also have the issue of omitted variable bias as economic growth may be correlated
with several factors. Both issues are challenging given data limitations. We address this by using
various checks as presented in the robustness section including instrumental variable estimation
and panel estimations using a panel data set.
3.1 Base Regression Results
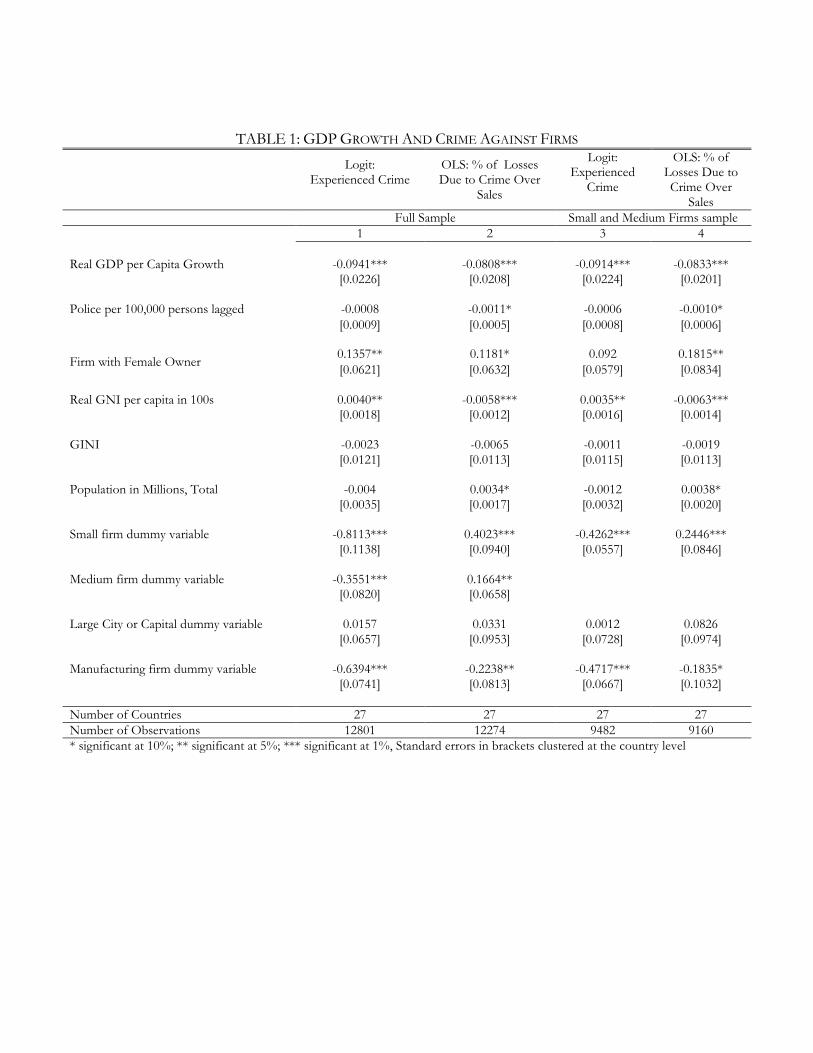
The base results are presented in table 1. Column1 indicates that firms in faster growing
economies are less likely to experience crime. Column 2 shows that an increase in GDP per
capita growth by 1 percent is associated with a 0.30 percent reduction in the losses due to crime
13
as a percentage of sales.1 Both results are significant at 1%. We repeat the estimations in column
1 and 2 with the restriction that the sample includes only small and medium firms. As shown in
columns 3 and 4 table 1, the results are largely the same. The sign and significance of the
estimation results in columns 1, 2, 3 and 4 of table 1 are unchanged when all controls are
excluded. A 1 percent increase in economic growth is associated with a reduction in crime loss
as a percentage of sales by 0.24 percent with a 1 % level of significance for the whole sample of
small, medium and large firms when all controls are excluded from the estimation. When
restricting the sample to just small and medium firms, the corresponding figure is a 0.25 percent
reduction in crime loss as a percentage of sales. These results indicate that economic growth may
be a deterrent for criminal activity against firms. One reason could be that economic growth
increases the opportunity cost of criminal activities leading to less crime. This is consistent with
studies for individual level crime (Bourguignon, 1999; Fajnzylber et al., 2002).
A few other results stand out. Small and medium firms are less likely to experience crime than
large firms, but face higher losses due to crime as a percentage of sales, which has been also
found in previous studies (Amin, 2009). Firms with female owners are both more likely to
experience crime, and also face a higher percentage of losses due to crime over sales. A couple
of results retain significance but switch signs when comparing the impact on likelihood of
experiencing crime (incidence of crime) and the losses due to crime as a percentage of sales
(burden of crime). GNI per capita is positively associated with the likelihood of experiencing
crime while negatively associated with the losses due to crime as a percentage of sales. That is,
with higher income, crime against firms may become more widespread but also more petty.
1 We replicated the estimations using a 5 year average of real GDP per capita growth. The results were retained and are available upon request.
14
Income per capita has generally shown non robust results with regards to individual level crime
in the literature (Fajnzylber et al., 2002; Soares, 2004).2 The size of the country in terms of
population is positively associated with losses due to crime as a percentage of sales, but no
significant association with the incidence of crime. Thus, in larger economies, firms may
experience higher losses due to crime.
We now consider how several country and firm-level factors may influence the relationship
between economic growth and the burden of crime on firms, particularly for small and medium
firms. We examine the strength of the relationship between economic growth and crime and how
it depends on factors such as firm size, police, female ownership and management, governance
and voter turnouts in elections. The effect of economic growth on crime may differ depending
on the size of the firm, as the ability for firms to protect themselves from criminal activity and
their attractiveness as potential targets of criminal activity vary by firm size. Economic growth
may not only increase labor market opportunities, but may also capture the quality of legal and
public institutions (Lederman et al., 2002). The effects of police and governance on crime have
been explored in the literature, and thus we expect the relationship between economic growth
and crime may be strengthened or weakened by these factors. We also use voter turnout as a
proxy for social organization, and thus we are able to examine whether the effect of economic
growth on crime losses is strengthened by social organization, or weakened by its presence.
Finally, given the robust positive relationship between female ownership and management and
crime, which is consistent with empirical relationship between female headed households and
crime, we examine whether economic growth weakens or strengthens this relationship. We do
2 Due to the lack of continuous data for GNI per capita for some countries, we use the GDP growth rate instead of the GNI growth rate as our indicator for economic growth. This is typical in the literature (Fajnzylber et al, 2002).
15
also comment on whether these relationships hold when considering the whole sample instead of
the restricted small and medium firm sample, and by and large this seems to be the case. We use
the OLS estimation results in table 1, column 4 as the base results for the small and medium firm
sample as with OLS estimations there is a more straightforward interpretation with regards to the
magnitude of the effects of interaction variables. However, it is worth noting that both the Logit
and OLS estimations provide qualitatively similar results for economic growth
3.2 Small and Medium Firms and per Capita Economic Growth Interaction
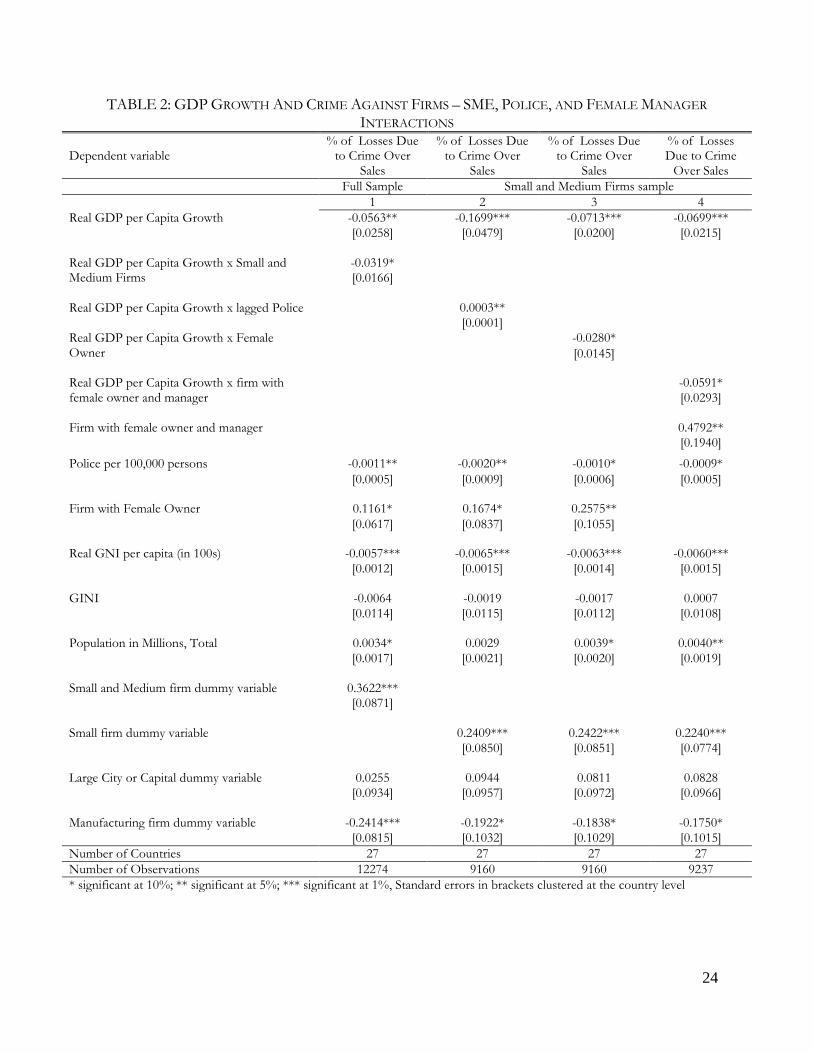
Column 1 of table 2 presents the estimation results of the interaction between small and medium
firms and economic growth using the full sample of small, medium, and large firms. The
interaction is negative, implying that economic growth reduces crime losses for small and
medium firms to a greater extent than large firms. A one percent increase in per capital economic
growth is associated with a 0.33 percent decline in crime losses for small and medium firms,
statistically significant at the 1% level. The corresponding figure for large firms is 0.21 percent,
statistically significant at the 5% level. The implication is that an increase in per capita economic
growth is far more beneficial for small and medium firms than large firm with regards to crime.
Thus pro-growth policies may be one way of insulating small and medium firms from crime.
3.3 Number of Police and per Capita Economic Growth Interaction
The interaction term between the number of police and economic growth is positive and
significant at the 5% level of significance for the sample of small and medium sized firms. The
overall association of economic growth with crime losses for small and medium sized firms is
still negative at the sample mean number of police after interacting economic growth with police.
16
However, looking at the extremes of the sample, economic growth has no significant association
with crime losses at the sample maximum number of police, but has a large and significant
negative association at the sample minimum number of police. The results are presented in
column 2 of table 2. The effect of increasing economic growth by 1 percent is associated with a
0.27 percent reduction in crime losses at the sample mean number of police and 0.48 percent
reduction in crime losses at the lowest number of police in the sample, both results statistically
significant at 1%. The number of police turning point, after which the association between
economic growth and crime losses is insignificant, in the sample is 430 per 100,000 of
population, which is at the 88th percentile of the sample. These results are retained when we use
the full sample of small, medium, and large firms. The implication of these results may indicate
that a larger police force may be a substitute for the economic growth when it comes to reducing
crime against firms. Thus during times of low economic growth and potentially high levels of
crime, expanding the police force may be a viable alternative.
3.4 Female Ownership, Female Management and per Capita Economic Growth Interaction
The interaction term between female ownership and management and economic growth is
positive and statistically significant at 10% for the sample of small and medium sized firms.
Economic growth is associated with a reduction in crime losses whether or not a firm has a
female or male owner, but the magnitude of the association is larger if the firm has a female
owner, or both a female manager and at least one female owner as shown in columns 3 and 4 of
table 2. The results indicate that a 1 percent increase in economic growth is associated with a
0.34 percent reduction in the dependent variable for female owned firms in contrast to 0.24
percent reduction in crime losses for firms that do not have a female owner. The magnitude is
17
even greater for firms with both a female owner and female manager at 0.44 percent reduction in
contrast to 0.24 percent reduction for firms that have all male owners and male managers. These
results are largely retained when using the full sample that includes large firms. An interpretation
of this result is that economic growth may benefit the more vulnerable or less well off in a
society and female owned or managed firms are less susceptible to crime.
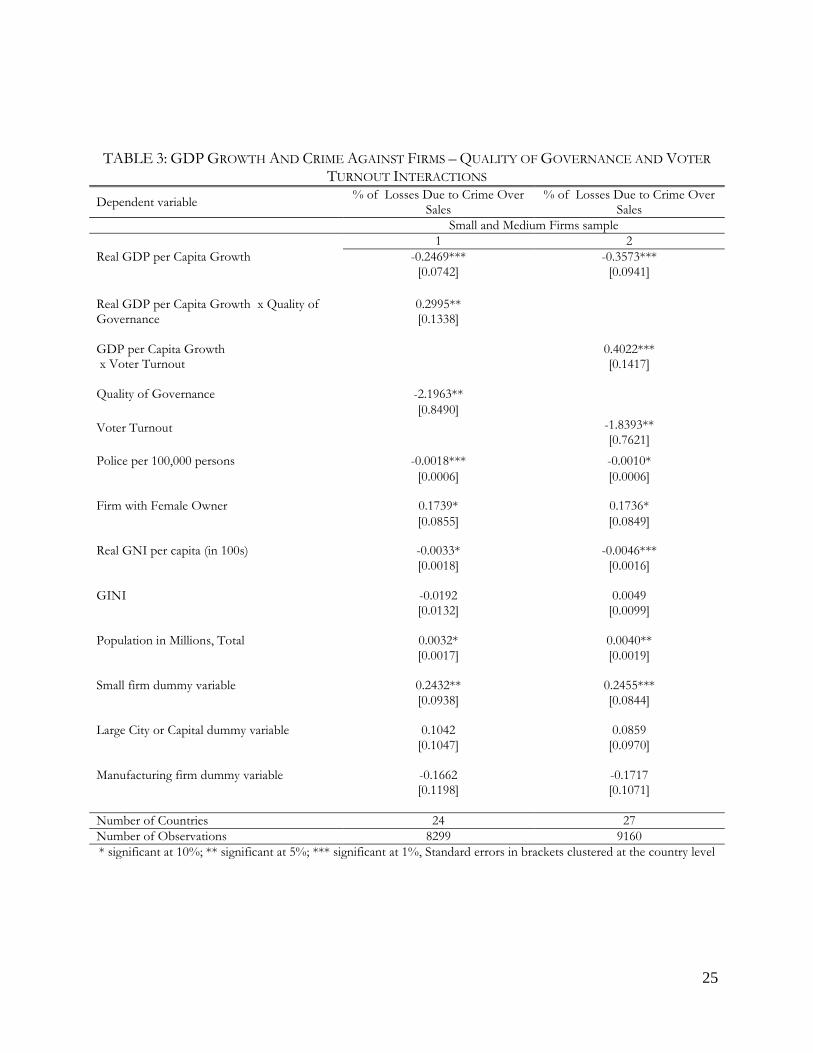
3.5 Governance and per Capita Economic Growth Interaction
We use ICRG’s Quality of government indicator as a measure of governance. The interaction
term between Quality of Government and Economic growth is positive and statistically
significant at 5 % as shown in column 1 of table 3. Economic growth has a negative and
significant association with crime losses experienced by small and medium sized firms at the
sample mean of the governance indicator. However, this relationship turns insignificant at the
sample maximum of the governance indicator. At the sample minimum level of governance, the
association of economic growth with crime losses has a larger magnitude while retaining
significance, when compared to the mean level of governance. A 1 percent increase in economic
growth is associated with an approximately 0.28 and 0.43 percent reduction in crime losses for
the sample mean and minimum quality of governance respectively. These results are largely
retained when extending the sample to large firms. One interpretation is that better governance is
a substitute for the crime-reducing effect of economic growth.
3.6 Voter Turnout and per Capita Economic Growth Interaction
Social disorganization theory indicates that factors that diminish the effectiveness of informal
social controls increase criminal activity (Kelly, 2000). Here we consider one indicator of social
18
disorganization – voter turnout in elections. The interaction term between voter turnout and
economic growth is positive and statistically significant at 1% as shown in column 2 of table 3.
An increase in economic growth is significantly associated with a decrease in crime losses
experienced by small and medium sized firms at the mean level of voter turnout. However, this
relationship loses significance at the sample minimum of voter turnout, but actually has a larger
magnitude and retains significance at the sample maximum of voter turnout. A 1 percent increase
in economic growth is associated with a 0.23 percent reduction in crime losses at the sample
mean level of voter turnout and a 0.59 percent reduction in crime at the minimum level of voter
turnout, both results statistically significant at 1%. The turning point where the effect of an
increase in the economic growth ceases to be significant is a voter turnout above 0.8, which is at
the 88th percentile of the firm sample. These results are largely retained when the sample is
extended to large firms. This result indicates that a higher voter turnout, possibly indicating
greater social organization, is a substitute for the effect of economic growth on crime.
Two major concerns about the estimation results are that the relationship between economic
growth and losses due to crime are reverse causality and omitted variable bias. Essentially, an
increase in losses due to crime can deter economic growth which would imply that economic
growth is correlated with the stochastic error term, hence biasing the estimates. Similarly,
economic growth may be capturing something else such as institutions that are not included in
the estimations, thus producing biased and inconsistent estimates. We mitigate this possibility by
using instrumental variable estimations and subjecting the base estimates to several robustness
checks.
19
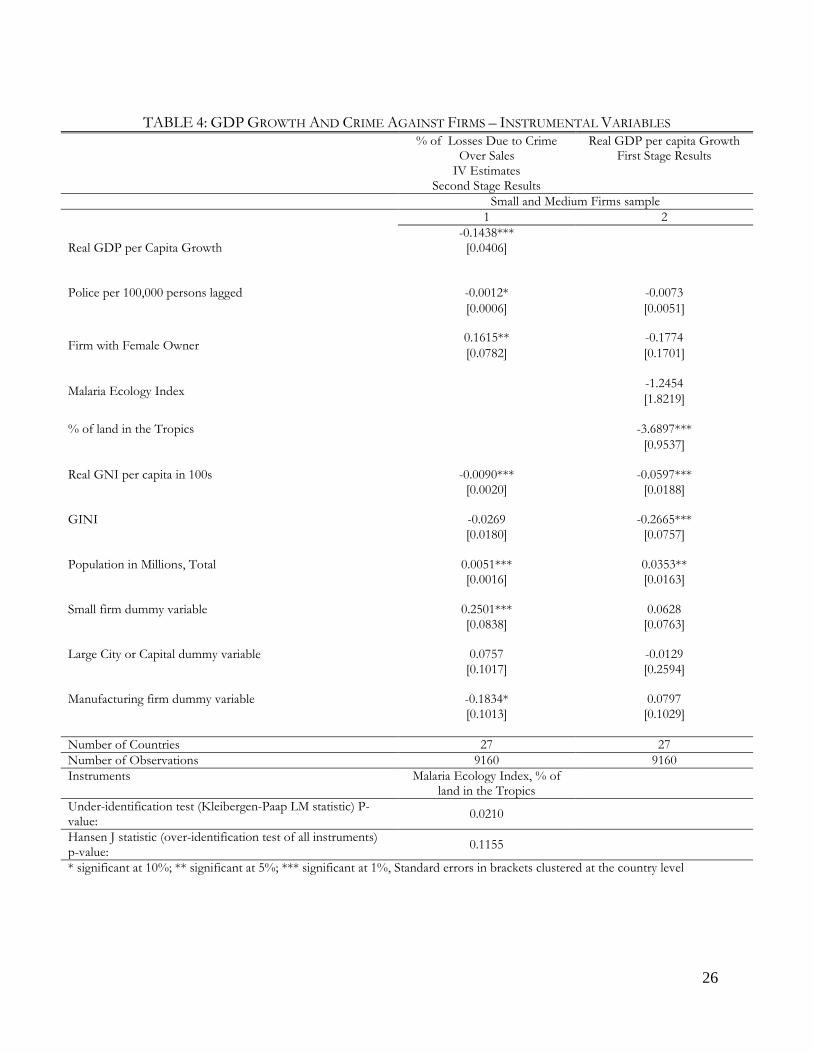
4. Instrumental Variables
We use two instruments for economic growth: the % of land in tropics for each country, and
malaria risk index, which is the proportion of each country’s population that live with risk of
malaria transmission in 1994 developed by Sachs and Gallup (2004). Both these variables have
been found to be an important determinant of economic growth (Sachs et al, 1998). We report
the results in table 4 for the sample of small and medium sized firms. The first stage estimation
results presented in column 2 shows that while % of land in tropics is significant, malaria
ecology is not. We include the latter variable in order to pass the test of overidentifying
restrictions. The overall results are retained without the malaria risk instrument. The second
stage estimation results are presented in column 1 of table 4. The coefficient of real GDP per
capita growth using instrumental variables estimation method retains the sign and significance of
the base estimations. The magnitude increases slightly from -0.08 in the base estimations to -0.14
in the estimations using the instrumental variables. As indicated in the bottom of table 4, the
Sargen-Hansen test of overidentifying restrictions is not rejected for all conventional levels of
significance. Thus we cannot reject the null that all the instruments are valid. We also reject that
the estimation is underidentified at 5% level of significance. We replicate the instrumental
variable estimations in table 4 by extending the sample to large firms. The results are largely
retained.
However, the results should be treated with caution. It is possible that the instruments may not
satisfy the exclusion restriction. Geographical factors such as % of land in tropics may be
correlated with institutional factors or other unobservables that may be correlated with crime.
20
Thus the potential endogeneity of our instruments cannot be ruled out completely, and these
results should be interpreted as a robustness check.
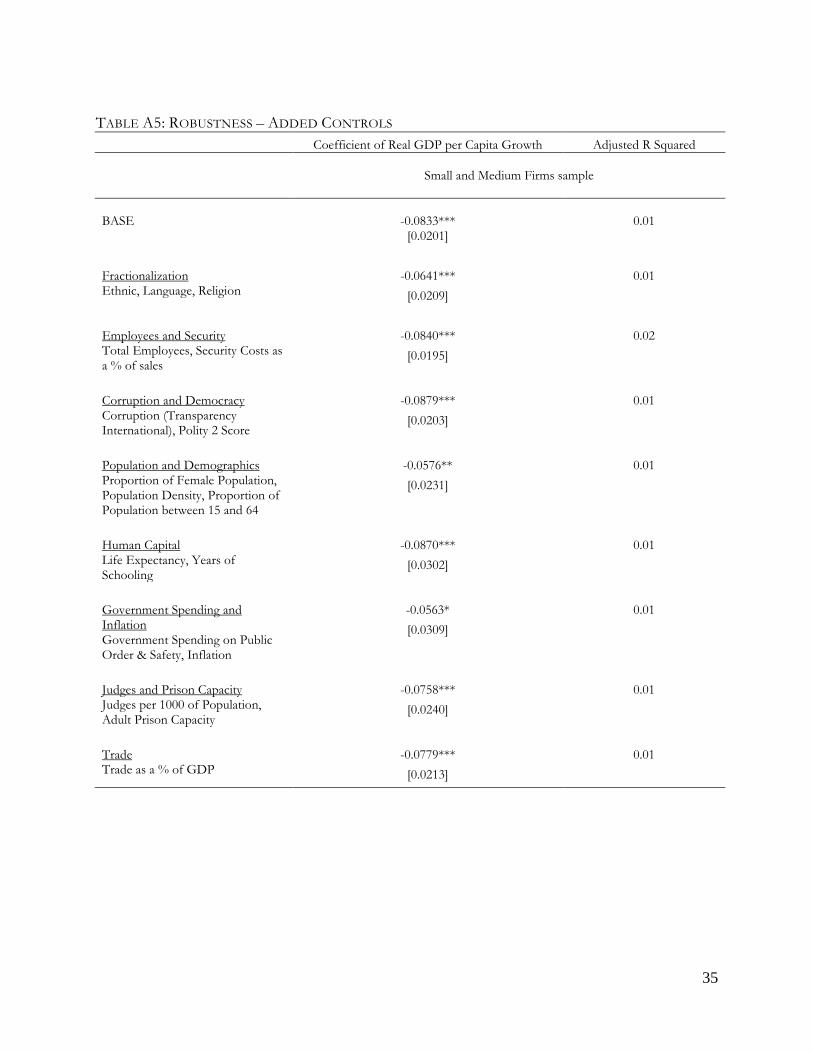
5. Robustness
We check for robustness in terms of model specification. Several studies have shown that
demographics and human capital (Kovandzic and Sloan, 2002; Kelly, 2000; Di Tella and
Number of Countries 27 27 27 27 Number of Observations 12801 12274 9482 9160 * significant at 10%; ** significant at 5%; *** significant at 1%, Standard errors in brackets clustered at the country level
24
TABLE 2: GDP GROWTH AND CRIME AGAINST FIRMS – SME, POLICE, AND FEMALE MANAGER INTERACTIONS
Dependent variable % of Losses Due
to Crime Over Sales
% of Losses Due to Crime Over
Sales
% of Losses Due to Crime Over
Sales
% of Losses Due to Crime
Over Sales Full Sample Small and Medium Firms sample 1 2 3 4 Real GDP per Capita Growth
Number of Countries 27 27 27 27 Number of Observations 12274 9160 9160 9237 * significant at 10%; ** significant at 5%; *** significant at 1%, Standard errors in brackets clustered at the country level
25
TABLE 3: GDP GROWTH AND CRIME AGAINST FIRMS – QUALITY OF GOVERNANCE AND VOTER TURNOUT INTERACTIONS
Dependent variable % of Losses Due to Crime Over Sales
% of Losses Due to Crime Over Sales
Small and Medium Firms sample 1 2 Real GDP per Capita Growth
-0.2469*** -0.3573*** [0.0742] [0.0941]
Real GDP per Capita Growth x Quality of Governance
0.2995**
[0.1338]
GDP per Capita Growth x Voter Turnout
0.4022*** [0.1417]
Quality of Governance
-2.1963** [0.8490]
Voter Turnout
-1.8393** [0.7621]
Police per 100,000 persons
-0.0018*** -0.0010* [0.0006] [0.0006]
Firm with Female Owner
0.1739* 0.1736* [0.0855] [0.0849]
Real GNI per capita (in 100s)
-0.0033* -0.0046*** [0.0018] [0.0016]
GINI
-0.0192 0.0049 [0.0132] [0.0099]
Population in Millions, Total
0.0032* 0.0040** [0.0017] [0.0019]
Small firm dummy variable
0.2432** 0.2455*** [0.0938] [0.0844]
Large City or Capital dummy variable
0.1042 0.0859 [0.1047] [0.0970]
Manufacturing firm dummy variable
-0.1662 -0.1717 [0.1198] [0.1071]
Number of Countries 24 27 Number of Observations 8299 9160 * significant at 10%; ** significant at 5%; *** significant at 1%, Standard errors in brackets clustered at the country level
26
TABLE 4: GDP GROWTH AND CRIME AGAINST FIRMS – INSTRUMENTAL VARIABLES
% of Losses Due to Crime Over Sales
IV Estimates Second Stage Results
Real GDP per capita Growth First Stage Results
Small and Medium Firms sample 1 2 Real GDP per Capita Growth
-0.1438*** [0.0406]
Police per 100,000 persons lagged
-0.0012* -0.0073 [0.0006] [0.0051]
Firm with Female Owner
0.1615** -0.1774 [0.0782] [0.1701]
Malaria Ecology Index
-1.2454 [1.8219]
% of land in the Tropics -3.6897***
[0.9537]
Real GNI per capita in 100s
-0.0090*** -0.0597*** [0.0020] [0.0188]
GINI
-0.0269 -0.2665*** [0.0180] [0.0757]
Population in Millions, Total
0.0051*** 0.0353** [0.0016] [0.0163]
Small firm dummy variable
0.2501*** 0.0628 [0.0838] [0.0763]
Large City or Capital dummy variable
0.0757 -0.0129 [0.1017] [0.2594]
Manufacturing firm dummy variable
-0.1834* 0.0797 [0.1013] [0.1029]
Number of Countries 27 27 Number of Observations 9160 9160 Instruments Malaria Ecology Index, % of
land in the Tropics
Under-identification test (Kleibergen-Paap LM statistic) P-value: 0.0210
Hansen J statistic (over-identification test of all instruments) p-value: 0.1155
* significant at 10%; ** significant at 5%; *** significant at 1%, Standard errors in brackets clustered at the country level
27
References
Aidis, R., S. Estrin, and T. M. Mickiewicz (2012). “Size Matters: Entrepreneurial Entry and Government.” Small Business Economics 38 (1): 119-139. Alesina, A., A. Devleeschauwer, W. Easterly, S. Kurlat, R. Wacziarg (2003). “Fractionalization” Journal of Economic Growth 8(2), 155–194 Amin, M. (2009). “Crime, Security and Firms in Latin America” (Short Note). Available at: http://works.bepress.com/mohammad_amin/11 (accessed October 31, 2011). Baliamoune-Lutz, M. and P. Garello (2014). “Tax Structure and Entrepreneurship.” Small Business Economics 42(1): 165-190. Barro, R., J-W. Lee. (2010). “A New Data Set of Educational Attainment in the World”, 1950-2010. NBER Working Paper No. 15902. Becker, G. (1968). “Crime and Punishment: An Economic Approach.” Journal of Political Economy 76, 169–217. Bourguignon, F. (1999). “Crime, Violence and Inequitable Development. Delta, Paris. manuscript. Bushway, S., P. J. Cook, and M. Phillips (2012), "The Overall Effect of the Business Cycle on Crime" German Economic Review 13(4): 436-4446 Cook, P. J. (2010). “Property Crime Yes violence No.” Criminology and Public Policy, 9(4), 693–697. Demombynes, G., B. Ozler. (2005). "Crime and local inequality in South Africa," Journal of Development Economics, Elsevier, vol. 76(2), pages 265-292. Di Tella, R., E. Schargrodsky. (2004). “Do Police Reduce Crime? Estimates Using the Allocation of Police Forces After a Terrorist Attack.” The American Economic Review 94, 115–133. Donohue, J., S. Levitt. (2001). “Legalized Abortion and Crime.” Quarterly Journal of Economics. 116:2, pp. 379 –420. Dutta, M., H. Zakir. (2009). “Determinants of Crime Rates: Crime Deterrence and Growth in Post-liberalized India.” MPRA Paper No. 14478. Ehrlich, I. (1973). “Participation in Illegitimate Activities: A Theoretical and Empirical Investigation.” Journal of Political Economy 81, 521–565.
28
Fanjzylber, P., D. Lederman, N. Loayza. (2002). “Inequality and Violent Crime.” Journal of Law and Economics 45(1), 1–39. Fanjzylber, P., D. Lederman, N. Loayza. (2000). Crime and Victimization: An Economic Perspective. Economia 1 (1), 219– 278 (Fall). Gaviria, A. (2002).” Assessing the Effects of Corruption and Crime on Firm performance: Evidence from Latin America.” Emerging Markets Review (3), 245-268. Glaeser, Edward L., Bruce Sacerdote (1999). Why is There More Crime in Cities. Journal of Political Economy 107(6), 225-258. Ghosh, A., P. E. Robertson, M-C Robitaille. (2011). “Crime, Factor Abundance and Globalization: Evidence from Cross-country Panel data.” Unpublished manuscript. Downloaded October 31, 2011 http://economics.adelaide.edu.au/events/ATW2011/Robertson.pdf Gould, E. D., B. A. Weinberg, D. B. Mustard (2002), ‘Crime Rates and Local Labor Market Opportunities in the United States: 1979–1997.’ Review of Economics and Statistics 84, 45–61 Hopkins, M. (2002). “Crimes against Businesses: The Way Forward for Future Research.” British Journal of Criminology, 42(4): 782-797. Islam, A.(2013), "Is There a Gender Bias in Crime Against Firms in Developing Economics?" Women's Studies International Forum 37(2013): 1-15 Kelly, M. (2000). “Inequality and Crime.” Review of Economics and Statistics 82 (4), 540– 554 (November). Kovandzic, T. V., J. J. Sloan. (2002). “Police Levels and Crime Rates Revisited - A county-level analysis from Florida (1980-1998).” Journal of Criminal Justice 30, 65-76. Lederman, D., Laoyza, N., and A. M. Menendez,(2002). “Violent Crime: Does Social Capital Matter? Economic Development and Cultural Change 50(3), 509-539 (April 2002). Levitt, S. (2004). “Understanding why crime fell in the 1990s: four factors that explain the decline and six that do not.” Journal of Economic Perspectives 18, 163–190. Lipuma, A. J., S. L. Newbert, and J. P. Doh (2013). “The Effect of Institutional Quality on Firm Export Performance in Emerging Economies: A Contingency Model of Firm Age and Size.” Small Business Economic 40 (4): 817-841. Machin, S., C. Meghir (2004). "Crime and Economic Incentives." Journal of Human Resources, 39(4): 958-979
29
McDowall, D. and C. Loftin (2009), “Do United States City Crime Rates Follow a National Trend? The Influence of Nationwide Conditions on Local Crime Patterns”, Journal of Quantitative Criminology 25, 307–324 Naidoo, J. (2006). “The Impact of HIV/AIDS on Crime in South Africa,” http://www.sarpn.org.za, date accessed on 31 October 2011. Sachs, J., J. L. Gallup. (2004). “The Economic Burden of Malaria.” The Supplement to The American Journal of Tropical Medicine & Hygiene, vol. 64, no. 1, 2, pp 85-96. Soares, R. R. (2004). “Development, crime and punishment: accounting for the international differences in crime rates.” Journal of Development Economics 73(1), 155–184. Sachs, J., J. L. Gallup, A.. Mellinger. (1998). “Geography and Economic Development,” in Pleskovic, Boris and Joseph E. Stiglitz (eds.), Annual World Bank Conference on Development Economics 1998 (April), The World Bank: Washington, DC.
Usher, D. (1997). “Education as a Deterrent to Crime,” Canadian Journal of Economics 30, 367-84
30
APPENDIX
TABLE A1: VARIABLE DEFINITIONS
Variable Definition Data Source
Losses Due to Crime (% of sales)
Response to the Question: “In fiscal year [insert fiscal year], what are the estimated losses as a result of theft, robbery, vandalism or arson that occurred on establishment’s premises calculated as a percent of annual sales” For cases where actual values were reported, % of sales was calculated.
Enterprise Surveys, World Bank
Experienced Crime
Response to the Question: “In fiscal year [insert last complete fiscal year], has this establishment experienced losses as a result of theft, robbery, vandalism or arson?”
Enterprise Surveys, World Bank
Real GDP per Capita Growth Real GDP per Capita Growth Rate, constant 2000 USD
Word Development Indicators (WDI), World Bank
Police per 100,000 persons lagged
Police per 100,000 persons lagged. Due to data constraints, for some countries the lag is not exactly lagged by year. Specifics of all lag years can be found in the appendix.
United Nations Survey on Crime Trends and the Operations of Criminal Justice Systems
Firm with Female Owner Yes Response to Question: "Are any of the owners female?"
Enterprise Surveys, World Bank
Female Owner and Manager Yes Response to Questions: “Is the Top Manager female?” and "Are any of the owners female?"
Enterprise Surveys, World Bank
Real GNI per capita (in 100s) Gross National Income per Capita, Constant 2000 USD
Word Development Indicators (WDI), World Bank
GINI Gini index of 0 represents perfect equality, while an index of 100 implies perfect inequality.
WDI, World Bank, Development Research Group
Population, Total in millions Total Population Word Development Indicators (WDI), World Bank
Small firms Dummy is 1 if firm is small (<20) Enterprise Surveys, World Bank
Medium firms Dummy is 1 if firm is medium (20-99) Enterprise Surveys, World Bank
Large City or Capital Dummy is 1 if city is either the capital or has more than 250,000 population
Enterprise Surveys, World Bank
Manufacturing Dummy is 1 for manufacturing firms Enterprise Surveys, World Bank
Quality of Governance
Mean value of the ICRG governance variables “Corruption”, “Law and Order”, and “Bureaucracy Quality”, scaled 0-1. Higher values indicate better quality of government. 1990-2007 average used.
International Country Risk Guide – The PRS Group
Voter Turnout Turnout in parliamentary elections measured as the total number of votes cast divided by the number of registered voters.
IDEA: International Institute for Democracy and Electoral Assistance http://www.idea.int/vt/index.cfm
Polity 2
Index of Democracy (Polity 2). Score between -10 and 10 that indicate how democratic a country. Values increase with greater democracy. 1990-2007 average used.
Polity IV, http://www.systemicpeace.org/polity/polity4.htm
Years of Schooling Average Years of Schooling of Population over 15. 1990-2007 average used.
Barro and Lee (2010)
Corruption Corruption Perception Index: 10 point scale where higher values indicate less corruption. 1995-2009 average used.
Transparency International ww.transparency.org
Ethnic Fractionalization Probability that two randomly selected people from a given country will not belong to the same ethnic group
Alesina, Devleeschauwer, Easterly, Kurlat, and Wacziarg (2003)
Language Fractionalization Probability that two randomly selected people from a given country do not speak the same language
Alesina, Devleeschauwer, Easterly, Kurlat, and Wacziarg (2003)
Religious Fractionalization Probability that two randomly selected people from a given country do not belong to the same religion
Alesina, Devleeschauwer, Easterly, Kurlat, and Wacziarg (2003)
Total Employees
Response to Question: “At the end of fiscal year [insert last complete fiscal year], how many permanent, full-time employees did this establishment employ?”
Enterprise Surveys, World Bank
Security Costs as a % of sales Enterprise Surveys, World Bank
Proportion of Female Population Population, female (% of total) WDI, World Bank
Percentage of Population in Urban Agglomerates
Population in urban agglomerations of more than one million is the percentage of a country's population living in metropolitan areas that in 2000 had a population of more than one million people.
WDI, World Bank
Population Density People per sq. km of land area WDI, World Bank
Proportion of Population between 15 and 64 Population ages 15-64 (% of total) WDI, World Bank
Life Expectancy WDI, World Bank
Government spending on Public Order and Safety over total Government spending
Includes spending on police, fire protection services, law courts, and prisons
Government Financial Statistics (GFS), International Monetary Fund
Inflation WDI, World Bank
Adult Prison Capacity
Prisons refer to “Prisons, Penal Institutions or Correctional Institutions” which means all public and privately financed institutions where persons are deprived of their liberty.
United Nations Survey on Crime Trends and the Operations of Criminal Justice Systems
Judges Number of judges per 1000 of population United Nations Survey on Crime Trends and the Operations of Criminal Justice Systems
Trade Exports plus imports as a % of GDP WDI, World Bank
Malaria Risk Proportion of each country’s population that live with risk of malaria transmission in 1994
Sachs and Gallup (2004)
% of land in Tropics Sachs et. al. (1998)
32
TABLE A2: SUMMARY STATISTICS FOR FULL SAMPLE INCLUDING SMALL, MEDIUM, AND LARGE FIRMS
Variable Mean Std. Dev. Min Max Data Unit
Losses Due to Crime (% of sales) 0.716 3.942 0.000 100.000 Firm
Experienced Crime 0.232
0.000 1.000 Firm
GDP per Capita Growth 2.656 4.213 -5.529 10.192 Country
Police per 100,000 persons lagged 287.894 108.187 90.110 480.013 Country
Firm with Female Owner 0.419
0.000 1.000 Firm
Female Owner and Manager 0.152
0.000 1.000 Firm
Real GNI per capita (in 100s) 37.345 31.014 2.257 141.816 Country GINI 39.826 7.768 25.810 52.330 Country Population, Total in millions 28.615 27.065 1.353 141.816 Country Small firms 0.369
0.000 1.000 Firm
Medium firms 0.378
0.000 1.000 Firm Large City or Capital 0.627
0.000 1.000 Firm
Manufacturing 0.537
0.000 1.000 Firm Quality of Governance 0.525 0.101 0.351 0.791 Country Voter Turnout 0.718 0.089 0.460 0.893 Country Polity 2 6.153 3.926 -5.647 10.000 Country Years of Schooling 8.066 1.816 2.850 11.689 Country Corruption
3.369 0.960 1.982 6.091 Country Ethnic Fractionalization 0.383 0.173 0.118 0.663 Country Language Fractionalization 0.372 0.254 0.030 0.836 Country Total Employees 121.246 478.223 1.000 20843 Firm
Life Expectancy 69.407 7.440 44.966 78.314 Country Proportion of Female Population 50.957 1.339 48.750 54.020 Country Percentage of Population in Urban Agglomerates 21.339 10.624 4.406 39.027
Country
Population Density 88.485 71.842 1.610 290.871 Country Proportion of Population between 15 and 64 63.549 5.393 47.959 70.721
Country
Government Spending on Public Order & Safety over Total Spending 0.057 0.026 0.015 0.119
Country
Inflation 9.488 7.816 2.358 50.705 Country Security Costs as a % of sales 1.514 5.373 0.000 384.615 Firm
Judges per 1000 of Population 13.166 11.808 0.760 47.020 Country Adult Prison Capacity 41384 50603 1017 160327 Country Trade as a % of GDP 84.496 36.049 37.354 182.512 Country Malaria Risk Index 0.259 0.377 0.000 1.000 Country % of land in tropics 0.370 0.454 0.000 1.000 Country
33
TABLE A3: POLICE, GINI, AND GNI PER CAPITA DATA AND SURVEY YEAR Country Survey Year Police per 100,000 persons