43
Economics of Climate Change Rangan Banerjee Forbes Marshall Chair Professor Department of Energy Science & Engineering 2 nd Summer School - Climate Science and Policy, 26 th June 2015
Economics of Climate Change
Rangan Banerjee
Forbes Marshall Chair Professor
Department of Energy Science & Engineering
2nd Summer School - Climate Science and Policy, 26th June 2015
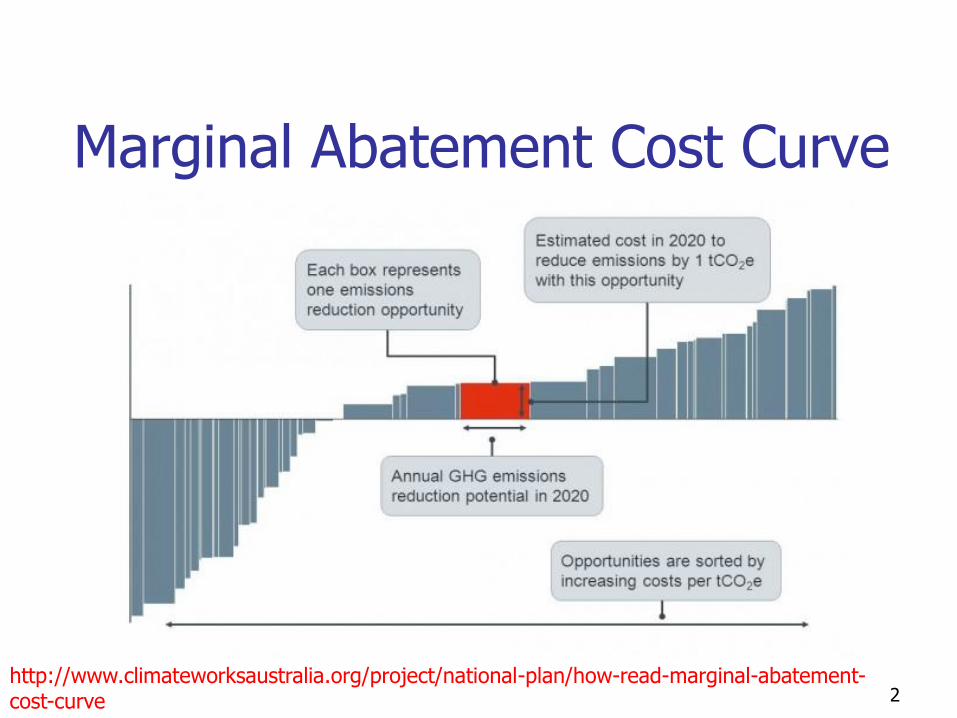
Marginal Abatement Cost Curve
http://www.climateworksaustralia.org/project/national-plan/how-read-marginal-abatement-cost-curve 2
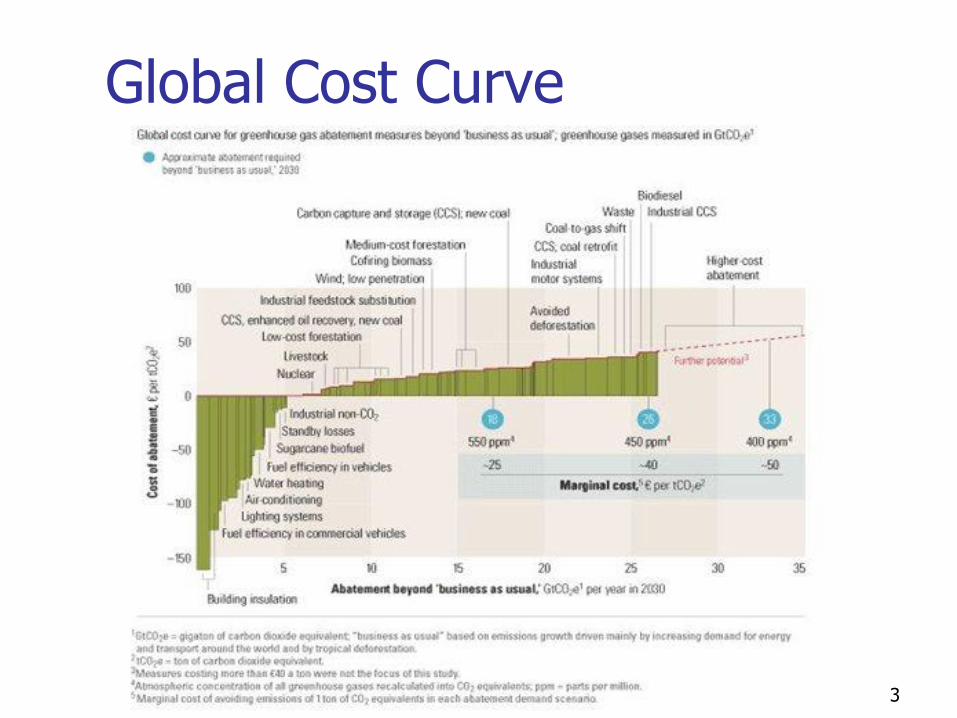
Global Cost Curve
3
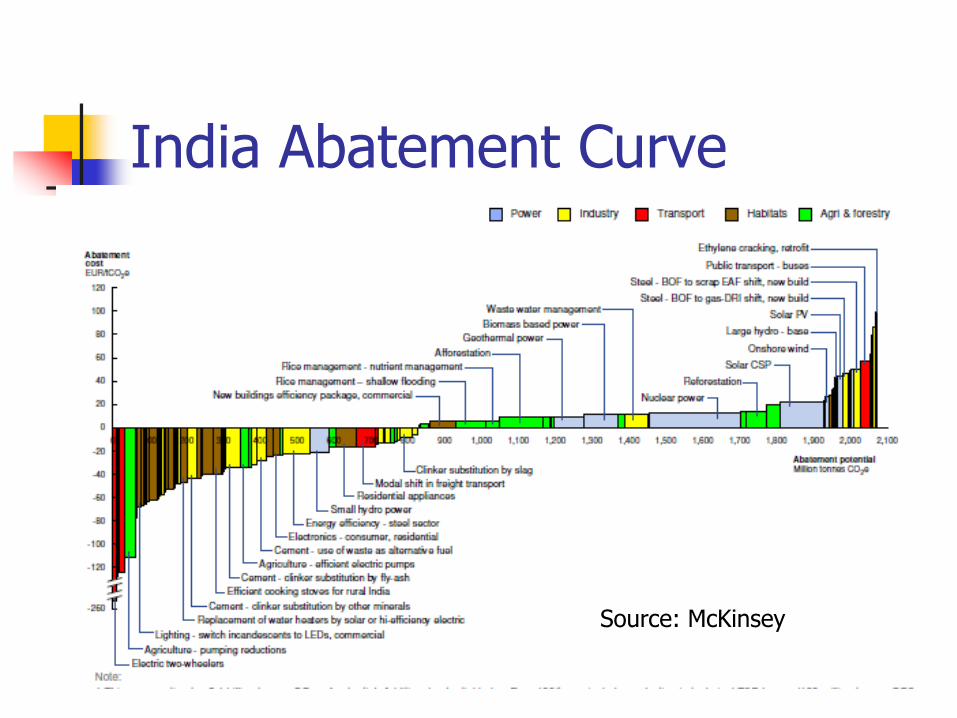
India Abatement Curve
Source: McKinsey
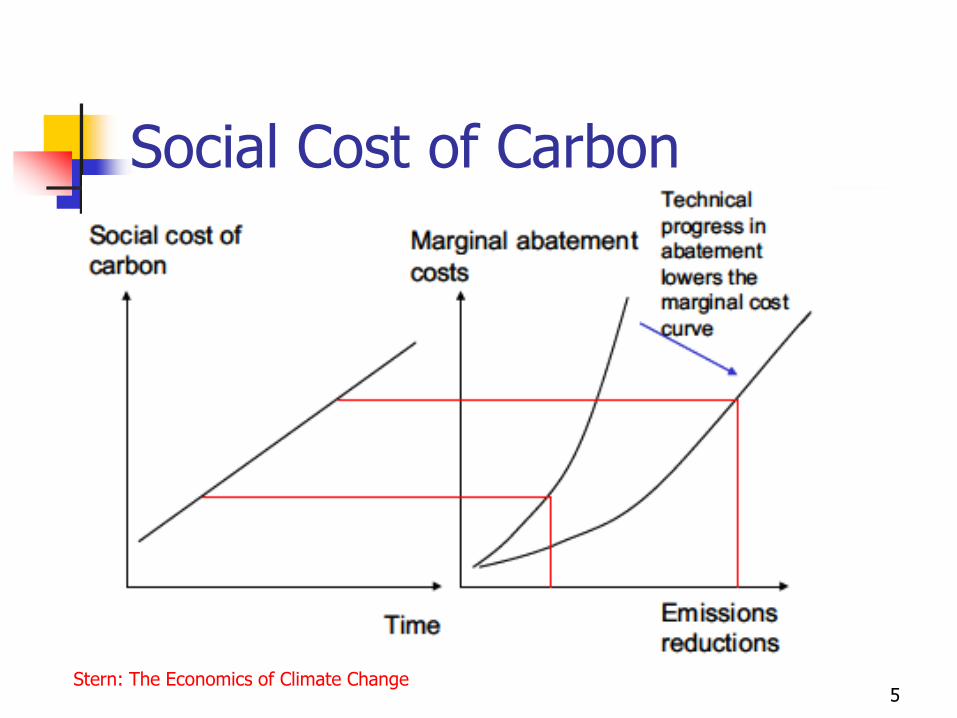
Social Cost of Carbon
5Stern: The Economics of Climate Change
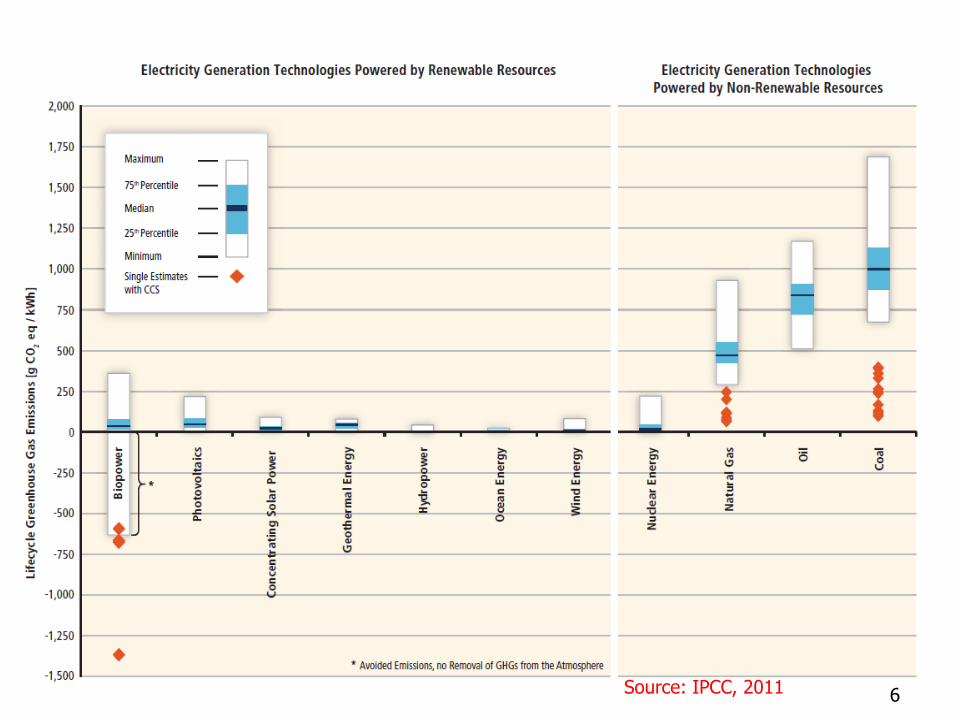
Source: IPCC, 2011 6
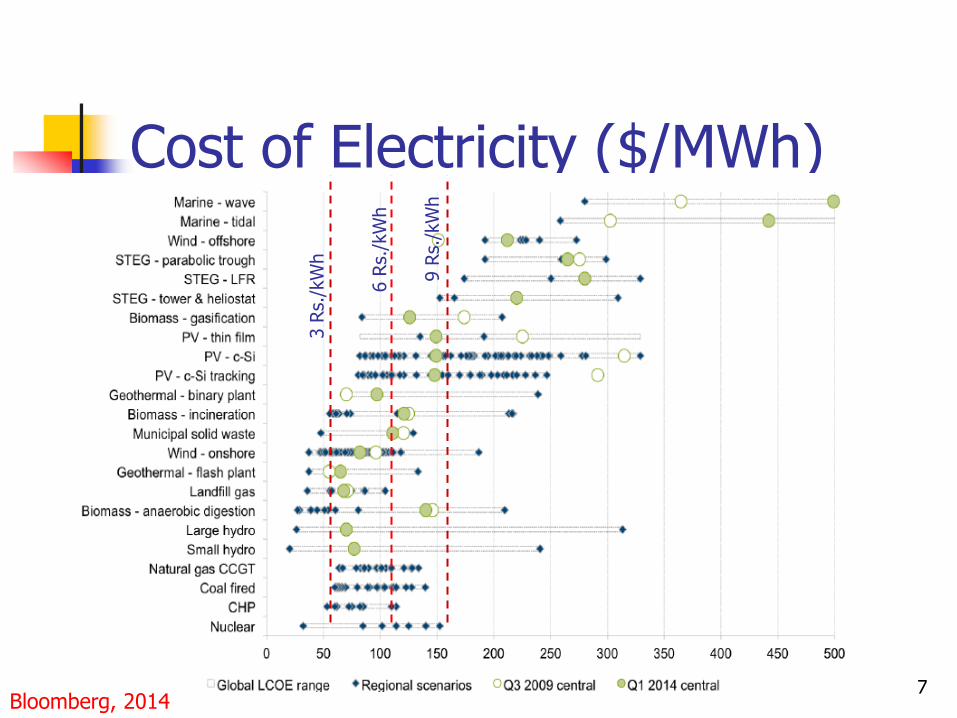
Cost of Electricity ($/MWh)
7
3 R
s./k
Wh
6 R
s./k
Wh
9 R
s./k
Wh
Bloomberg, 2014
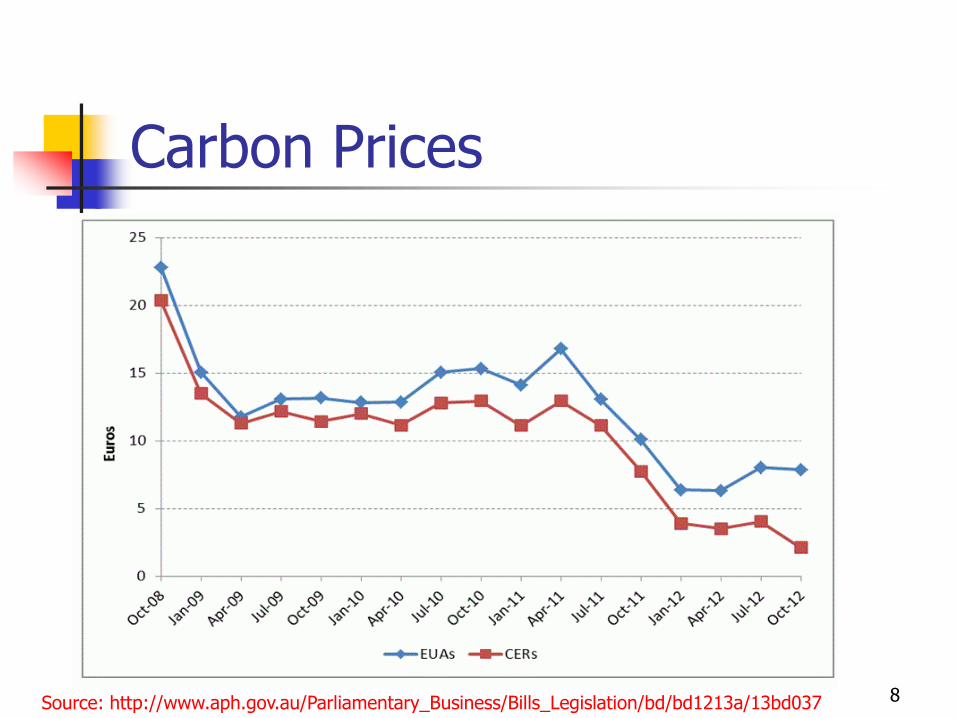
Carbon Prices
Source: http://www.aph.gov.au/Parliamentary_Business/Bills_Legislation/bd/bd1213a/13bd037 8
Viability of Mitigation Projects
What are the factors that determine the cost-effectiveness of the additional investment?
Cost of Carbon Saved
9
Decision – Mitigation Project
Amount of Investment
Amount of Energy Saving (fossil fuel),
Carbon Saving
Price of Energy
Life of Equipment/ project
Time Value of Money
Renewables – usually higher initial cost,
lower operating cost10

Economic Criteria
Simple Payback Period (SPP)
Net Present Value (NPV)
Benefit/ Cost Ratio (B/C)
Internal Rate of Return (IRR)
Life Cycle Costing
Life Cycle Cost
Annualised Life Cycle Cost (ALCC)
11
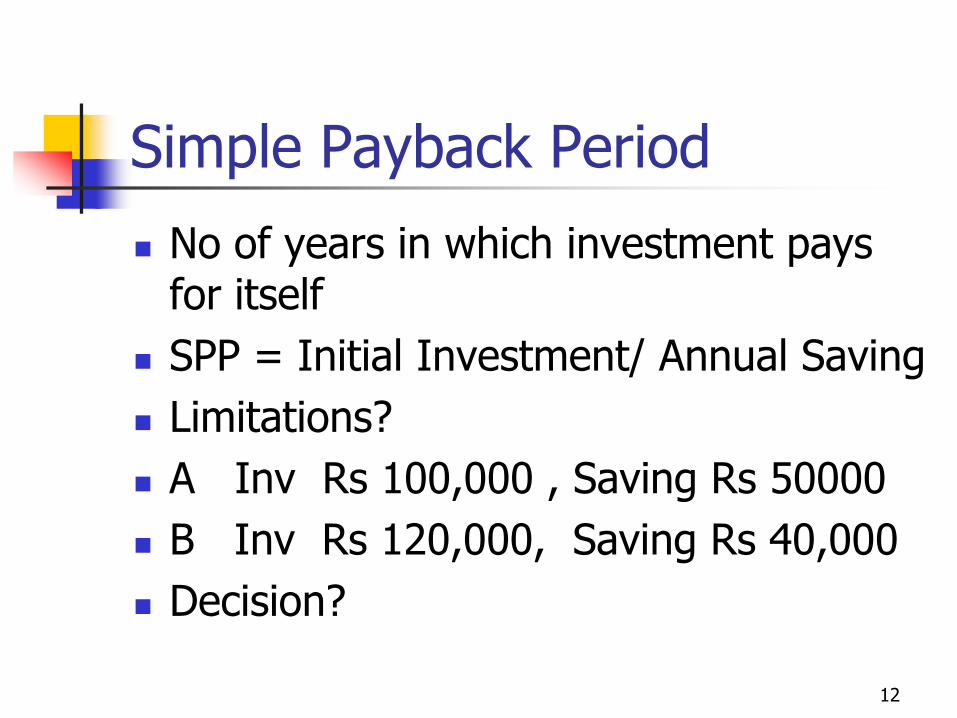
Simple Payback Period
No of years in which investment pays for itself
SPP = Initial Investment/ Annual Saving
Limitations?
A Inv Rs 100,000 , Saving Rs 50000
B Inv Rs 120,000, Saving Rs 40,000
Decision?
12
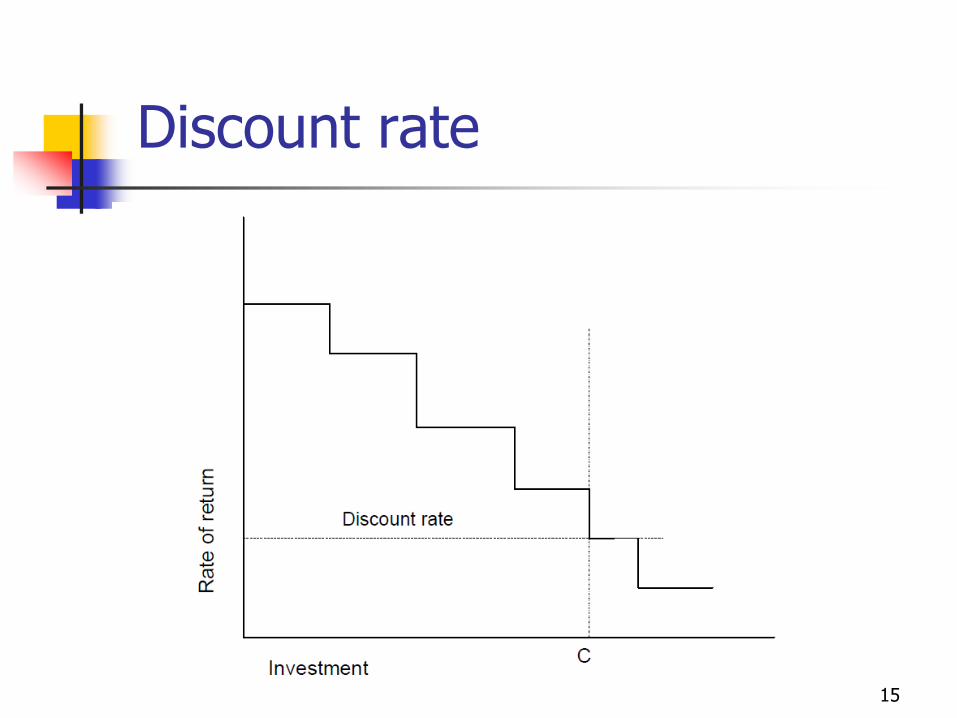
Discount Rate
Compare investment today with expected future benefits
Discount rate represents how money today is worth more than in the future
No theoretically correct value
Lower bound – bank interest rate
13
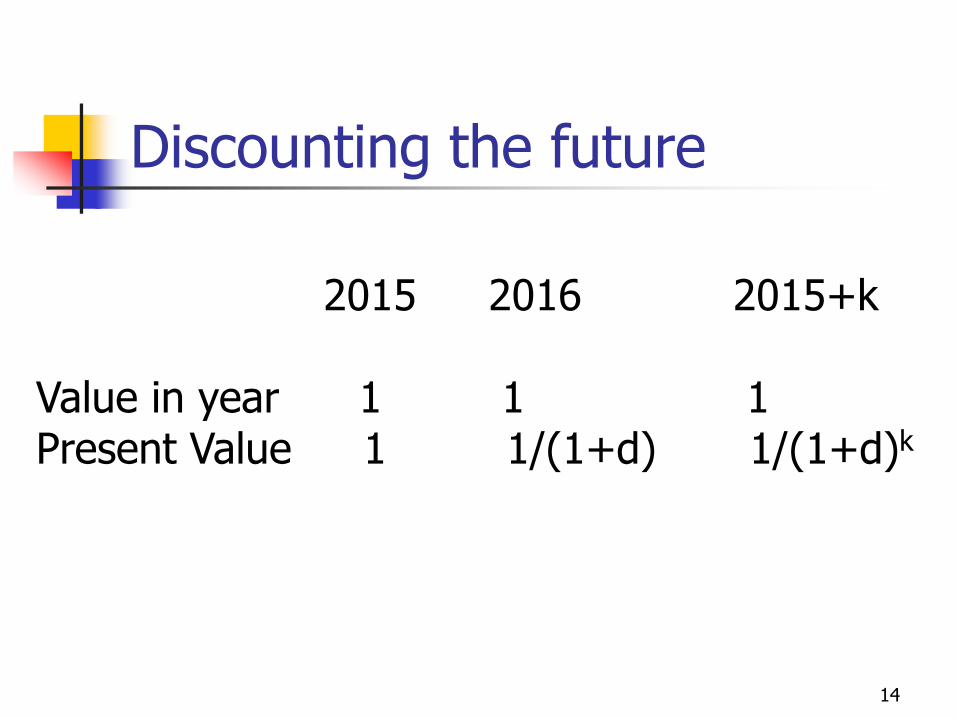
2015 2016 2015+k
Value in year 1 1 1Present Value 1 1/(1+d) 1/(1+d)k
Discounting the future
14
Discount rate
15
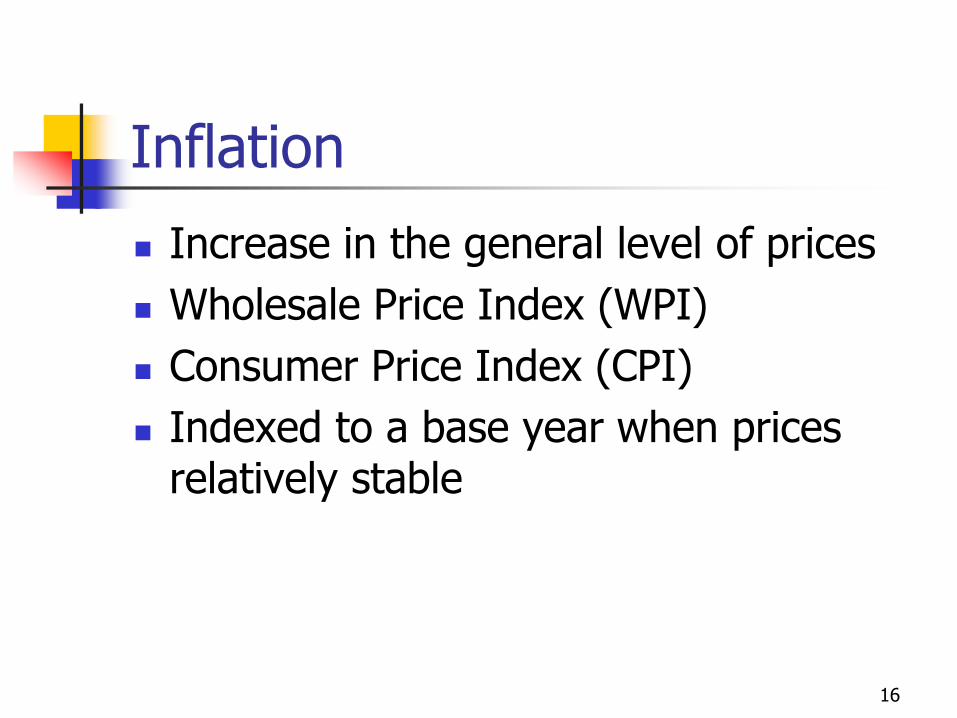
Inflation
Increase in the general level of prices
Wholesale Price Index (WPI)
Consumer Price Index (CPI)
Indexed to a base year when prices relatively stable
16
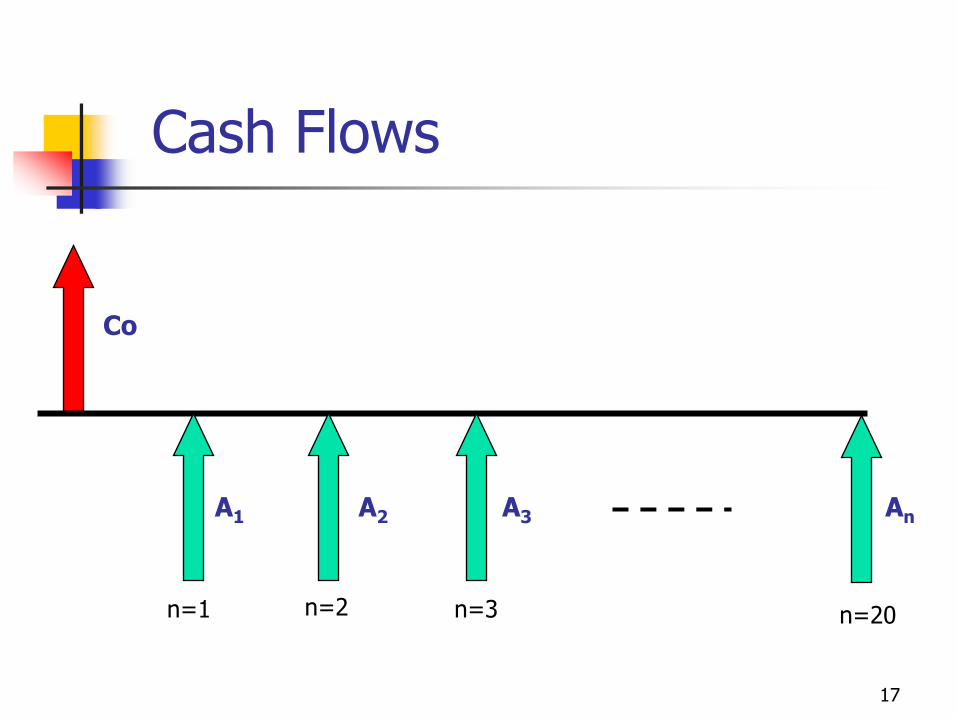
A1 A2
Cash Flows
A3 An
n=1 n=2 n=3 n=20
Co
17
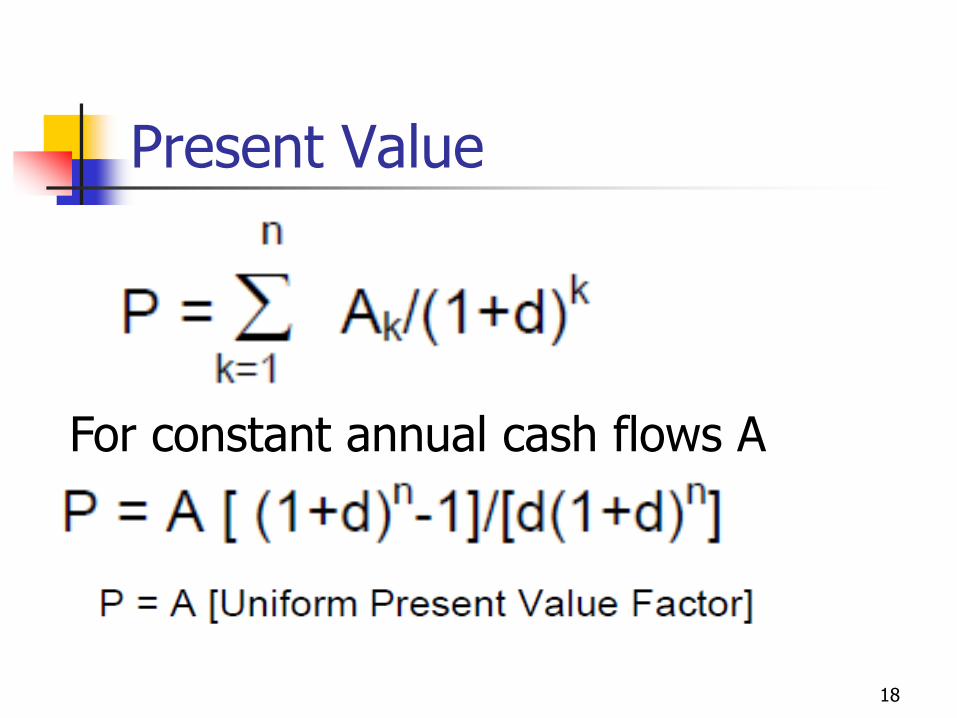
Present Value
For constant annual cash flows A
18
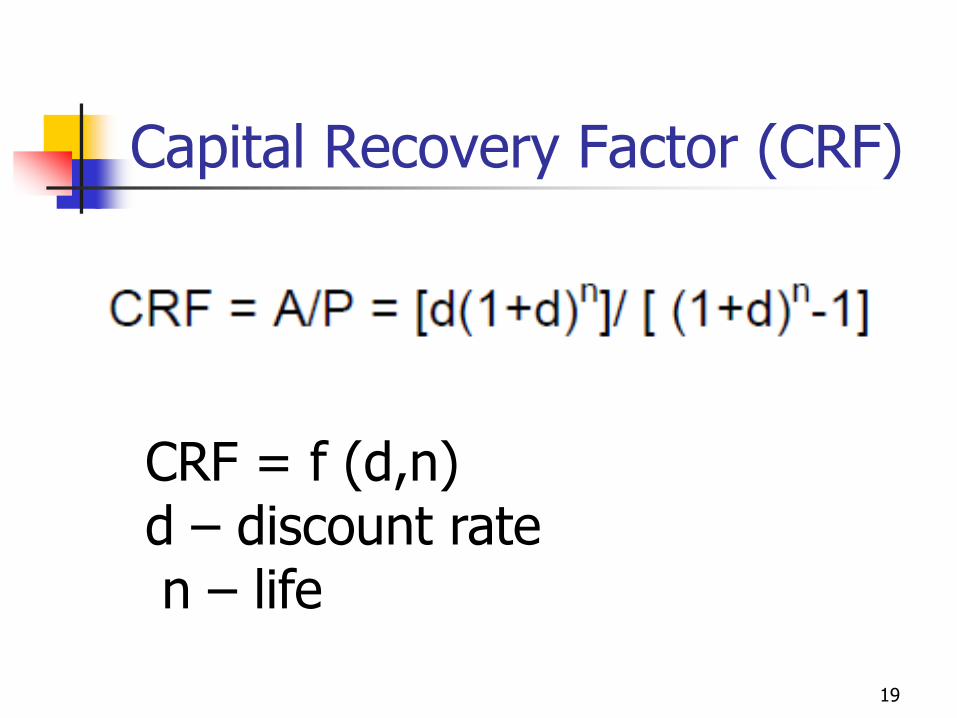
Capital Recovery Factor (CRF)
CRF = f (d,n)d – discount raten – life
19
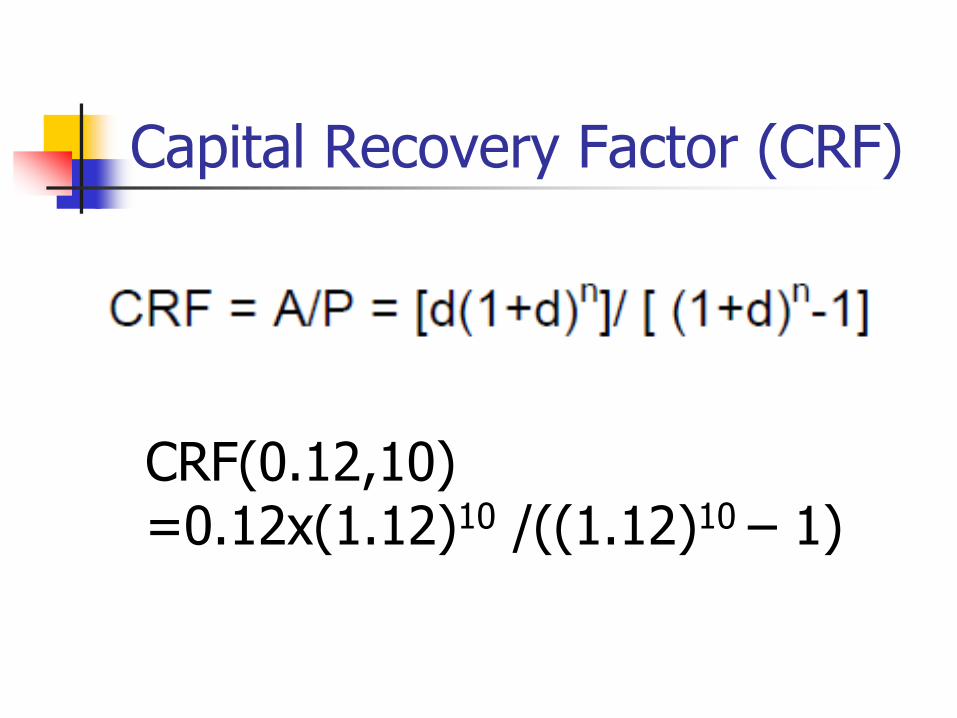
Capital Recovery Factor (CRF)
CRF(0.12,10) =0.12x(1.12)10 /((1.12)10 – 1)
o
n
kk
k Cd
ANPV
1 )1(
n
kk
ko
IRR
AC
1 )1(
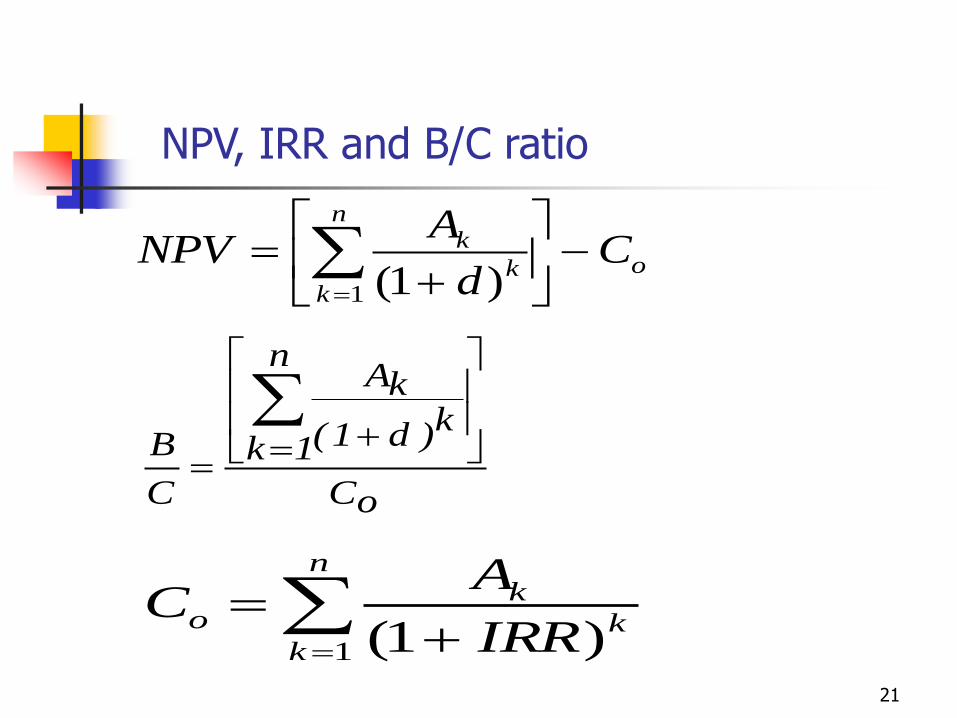
NPV, IRR and B/C ratio
oC
n
1kk)d1(
kA
C
B
21
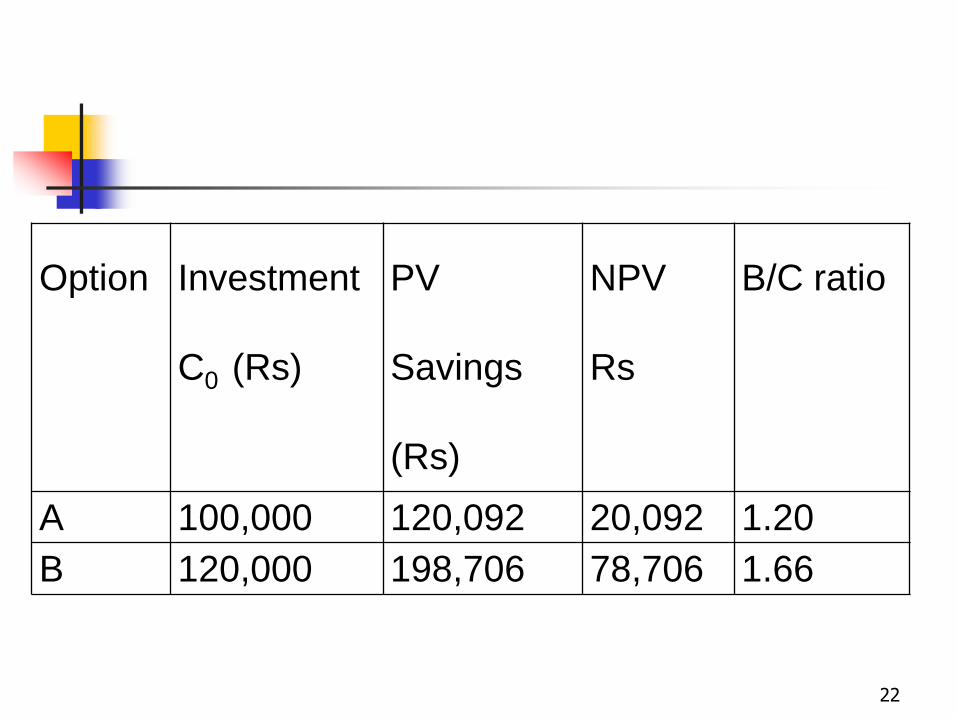
Option Investment
C0 (Rs)
PV
Savings
(Rs)
NPV
Rs
B/C ratio
A 100,000 120,092 20,092 1.20
B 120,000 198,706 78,706 1.66
22
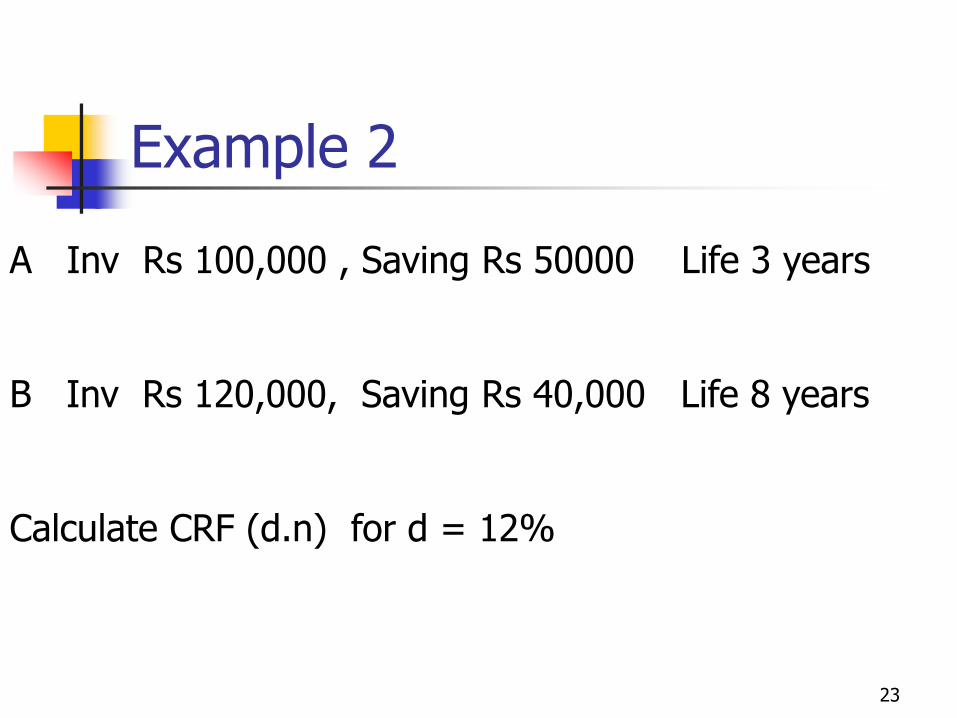
A Inv Rs 100,000 , Saving Rs 50000 Life 3 years
B Inv Rs 120,000, Saving Rs 40,000 Life 8 years
Calculate CRF (d.n) for d = 12%
Example 2
23
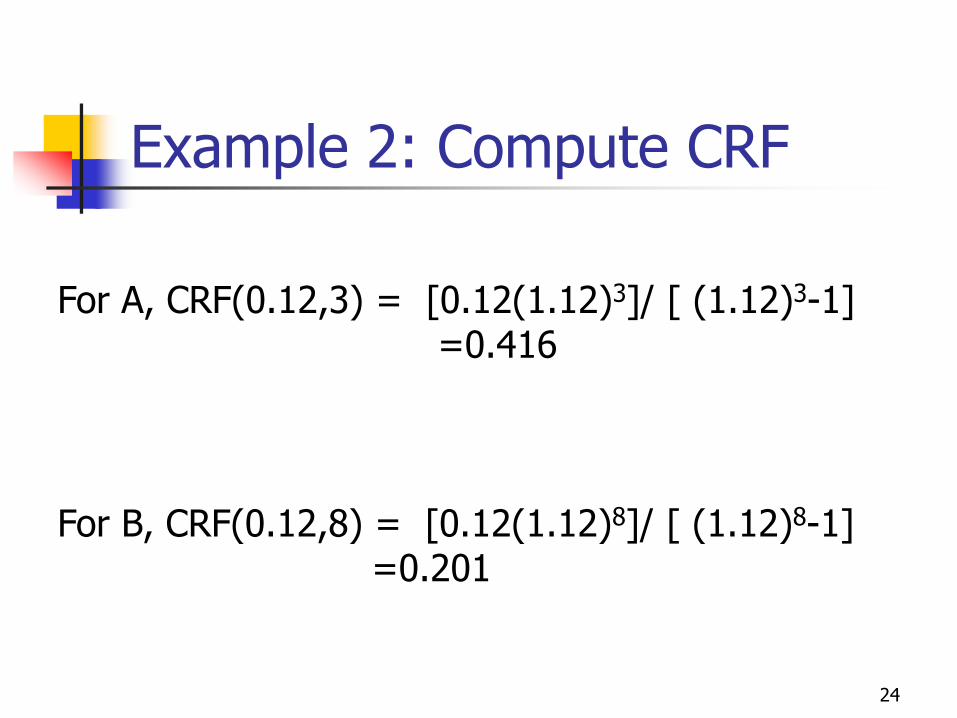
For A, CRF(0.12,3) = [0.12(1.12)3]/ [ (1.12)3-1] =0.416
For B, CRF(0.12,8) = [0.12(1.12)8]/ [ (1.12)8-1] =0.201
Example 2: Compute CRF
24
Inflation
Increase in the general level of prices
Wholesale Price Index (WPI)
Consumer Price Index (CPI)
Indexed to a base year when prices relatively stable
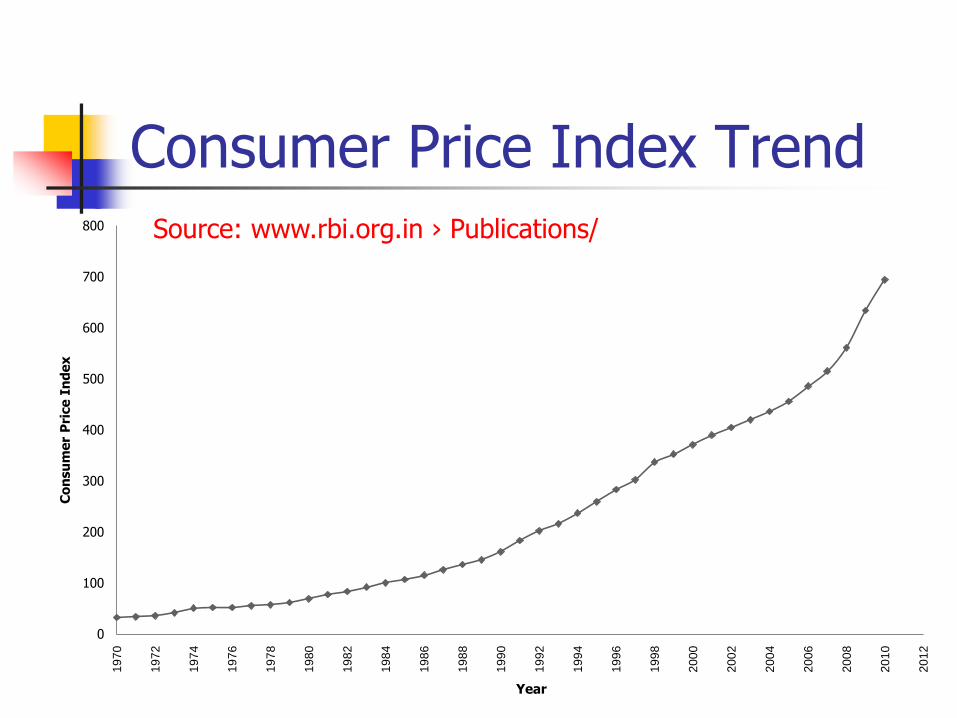
Consumer Price Index Trend
0
100
200
300
400
500
600
700
800
19
70
19
72
19
74
19
76
19
78
19
80
19
82
19
84
19
86
19
88
19
90
19
92
19
94
19
96
19
98
20
00
20
02
20
04
20
06
20
08
20
10
20
12
Co
nsu
me
r P
rice
In
de
x
Year
Source: www.rbi.org.in › Publications/
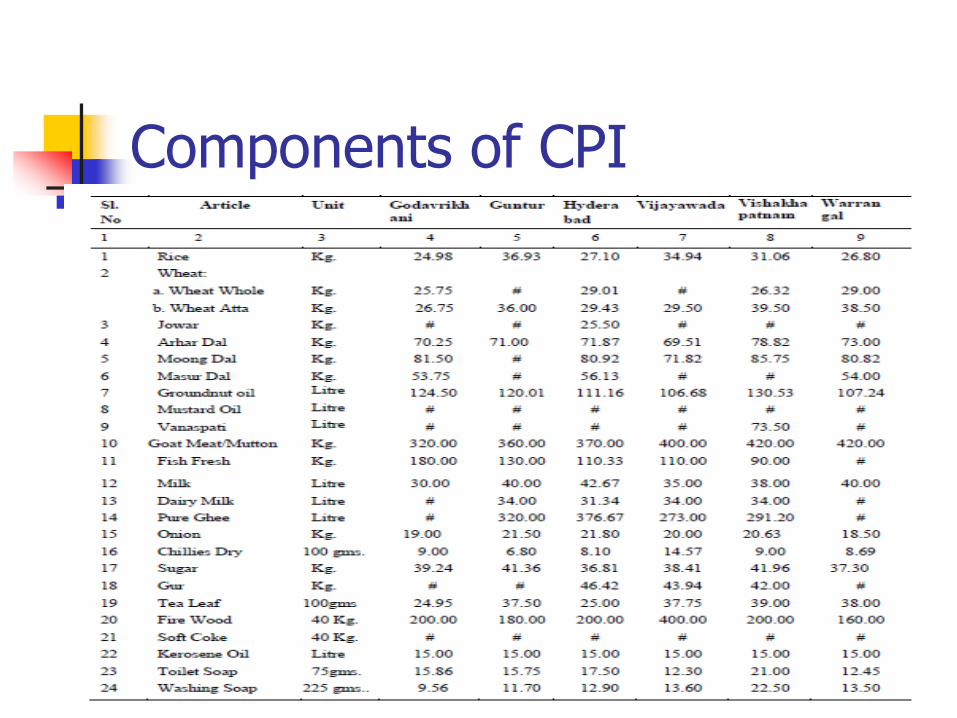
Components of CPI
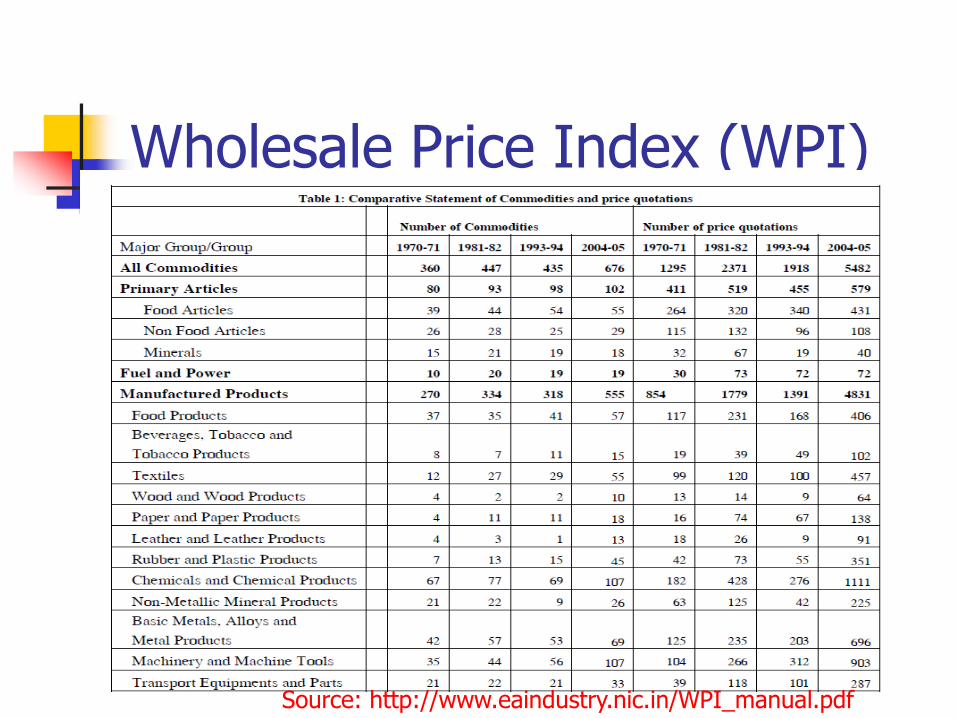
Wholesale Price Index (WPI)
Source: http://www.eaindustry.nic.in/WPI_manual.pdf
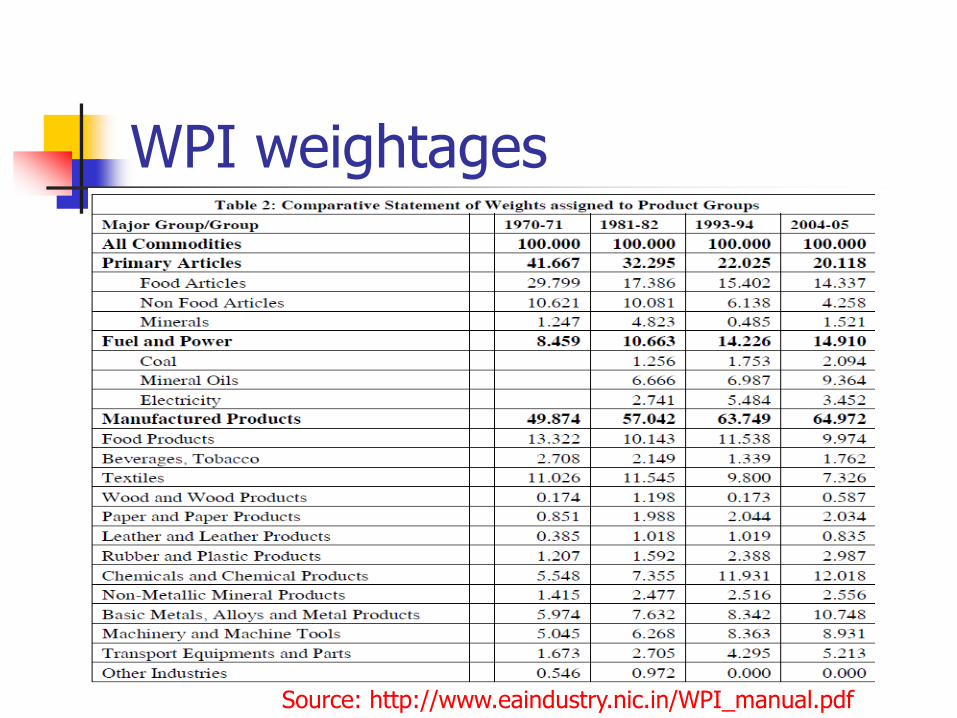
WPI weightages
Source: http://www.eaindustry.nic.in/WPI_manual.pdf
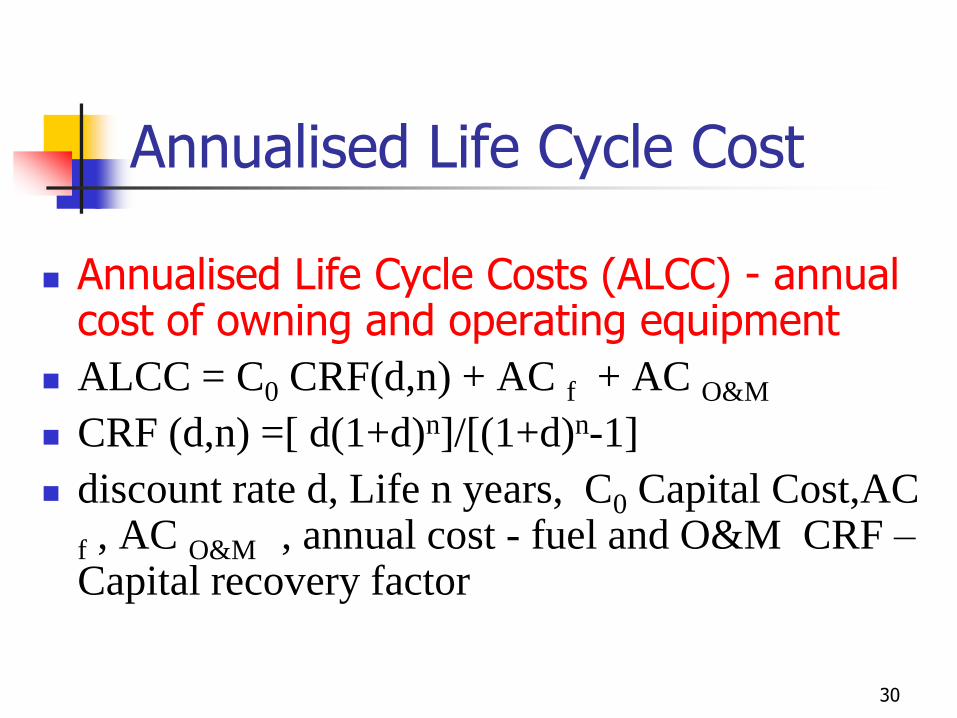
Annualised Life Cycle Cost
Annualised Life Cycle Costs (ALCC) - annual cost of owning and operating equipment
ALCC = C0 CRF(d,n) + AC f + AC O&M
CRF (d,n) =[ d(1+d)n]/[(1+d)n-1]
discount rate d, Life n years, C0 Capital Cost,AC
f , AC O&M , annual cost - fuel and O&M CRF –Capital recovery factor
30
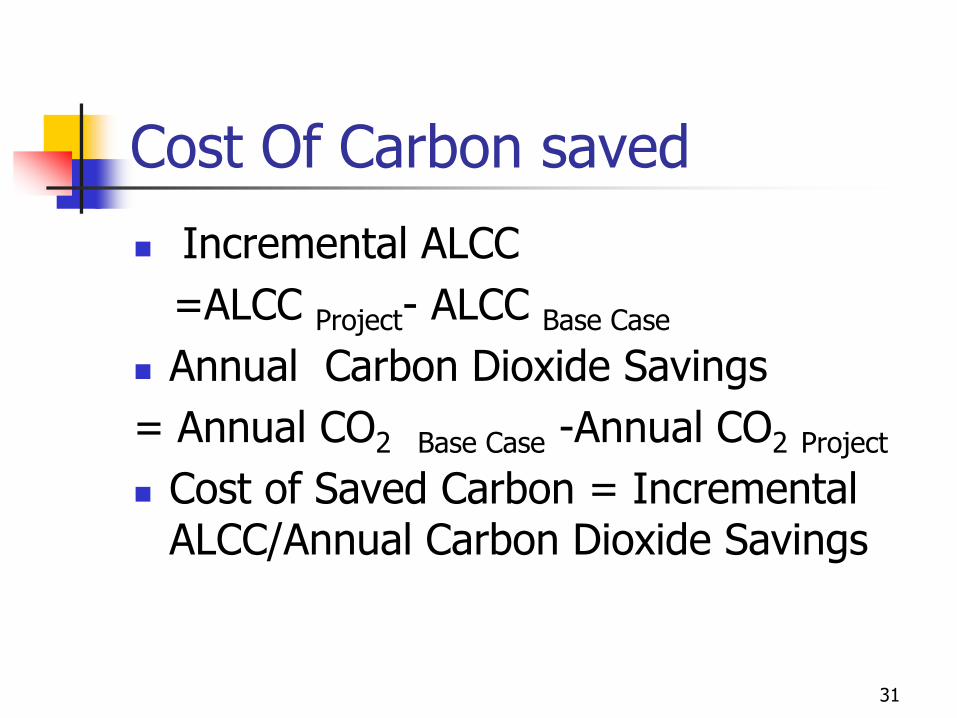
Cost Of Carbon saved
Incremental ALCC
=ALCC Project- ALCC Base Case
Annual Carbon Dioxide Savings
= Annual CO2 Base Case -Annual CO2 Project
Cost of Saved Carbon = Incremental ALCC/Annual Carbon Dioxide Savings
31
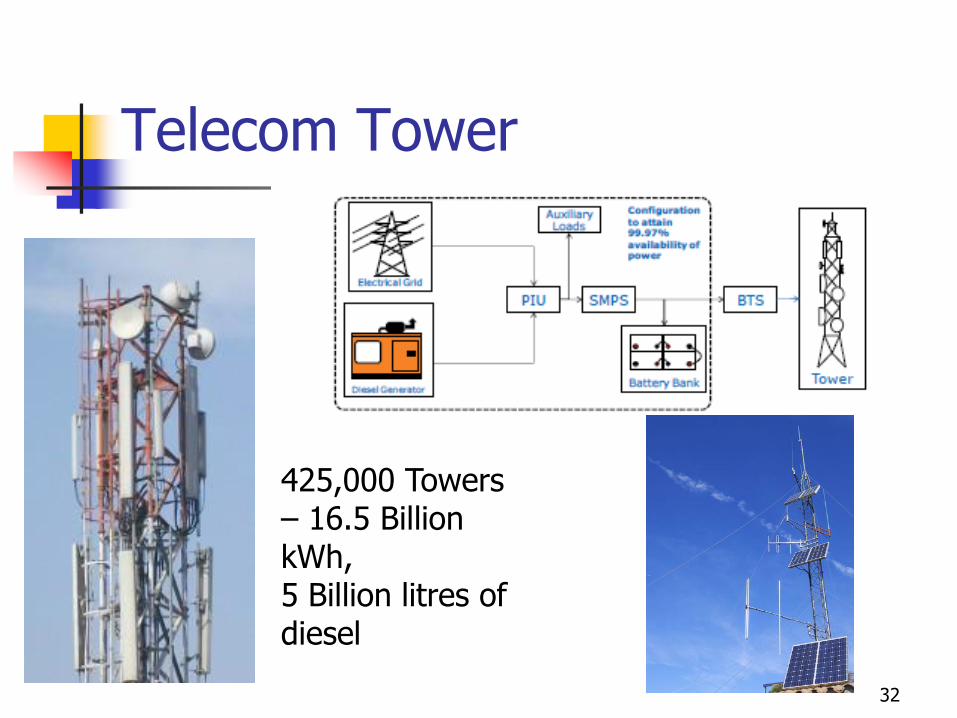
Telecom Tower
425,000 Towers – 16.5 Billion kWh, 5 Billion litres of diesel
32
Example Problem
Demand :Peak 5 kW, Average 2 kW
continuous operation
Options
A: Diesel engine-generator
B: PV- Battery system
33
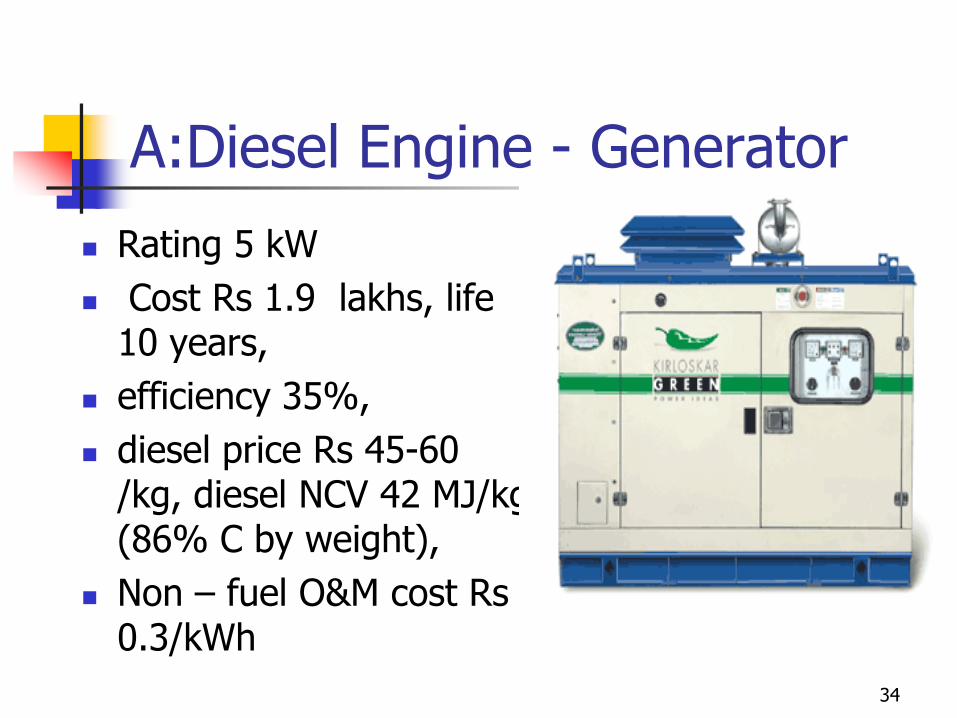
A:Diesel Engine - Generator
Rating 5 kW
Cost Rs 1.9 lakhs, life 10 years,
efficiency 35%,
diesel price Rs 45-60 /kg, diesel NCV 42 MJ/kg (86% C by weight),
Non – fuel O&M cost Rs0.3/kWh
34
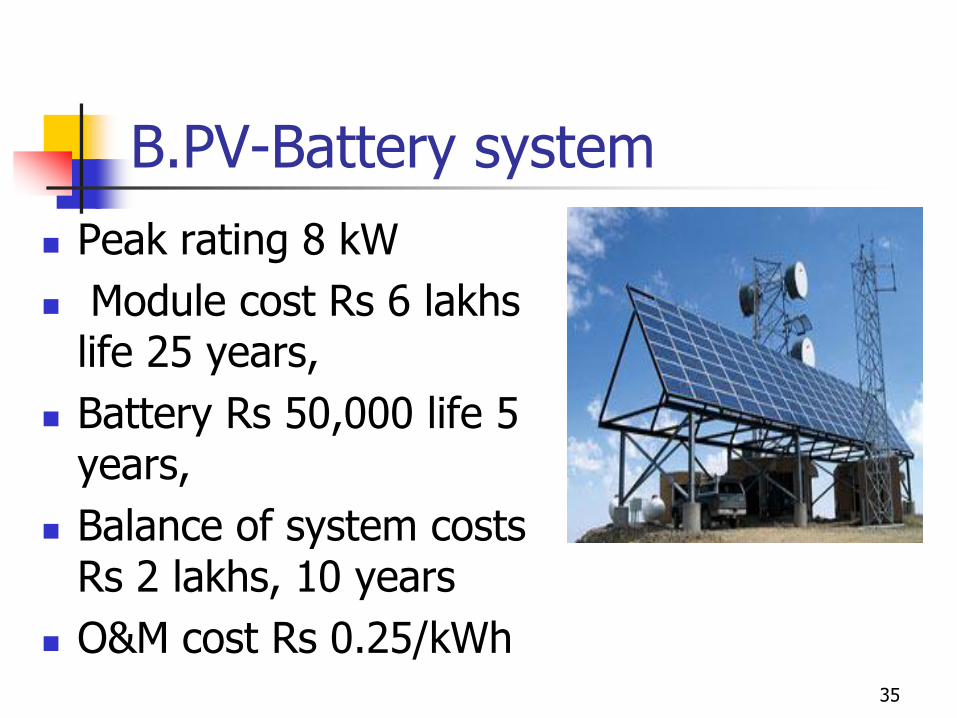
B.PV-Battery system
Peak rating 8 kW
Module cost Rs 6 lakhs life 25 years,
Battery Rs 50,000 life 5 years,
Balance of system costs Rs 2 lakhs, 10 years
O&M cost Rs 0.25/kWh35
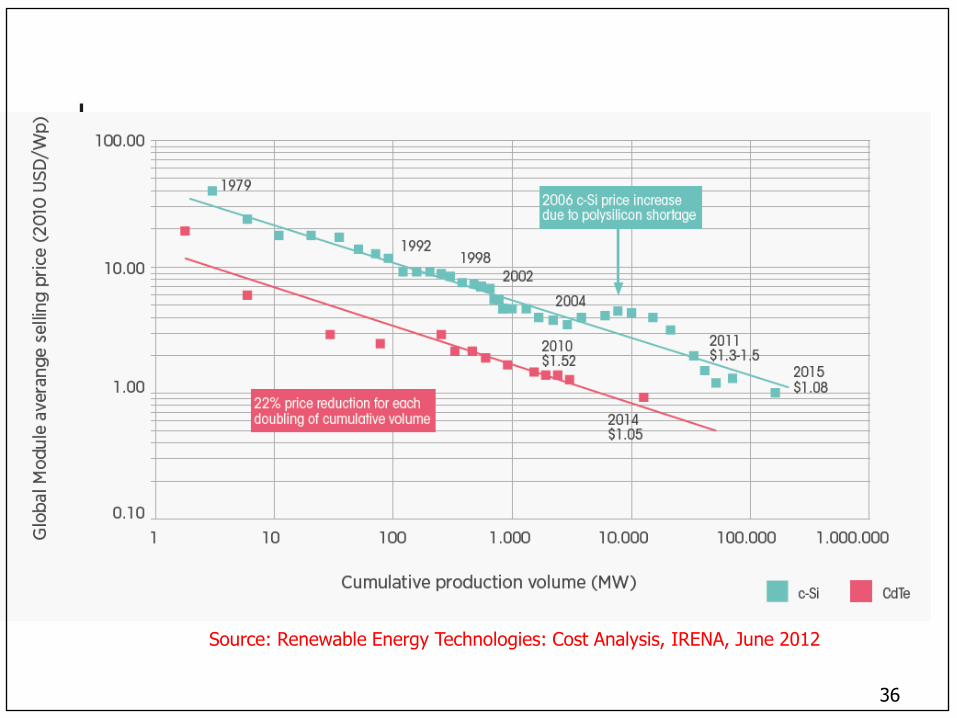
Source: Renewable Energy Technologies: Cost Analysis, IRENA, June 2012
36
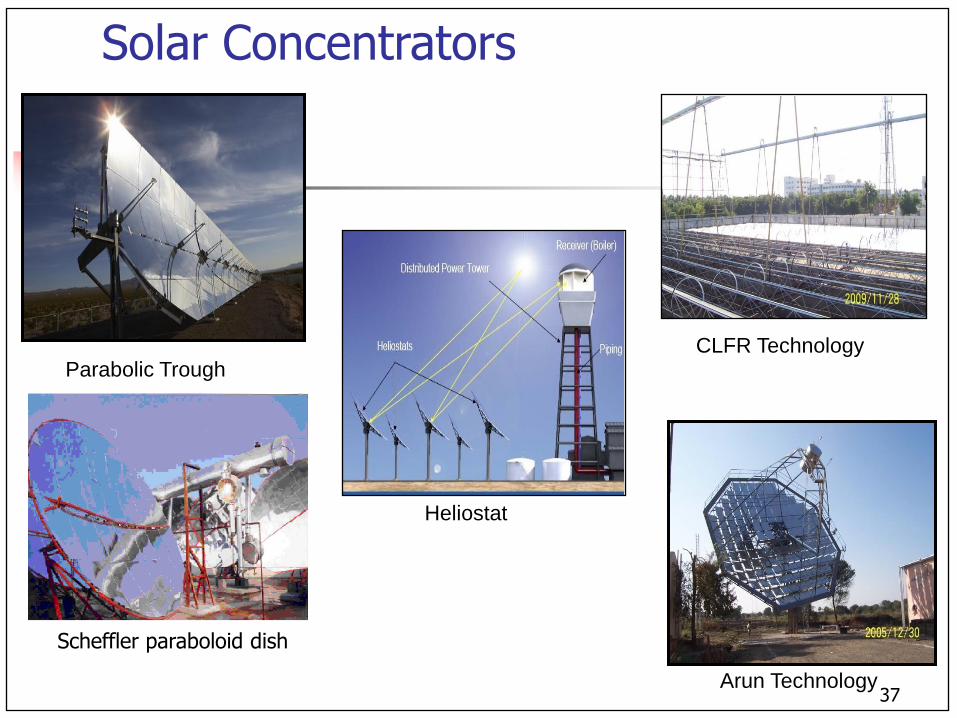
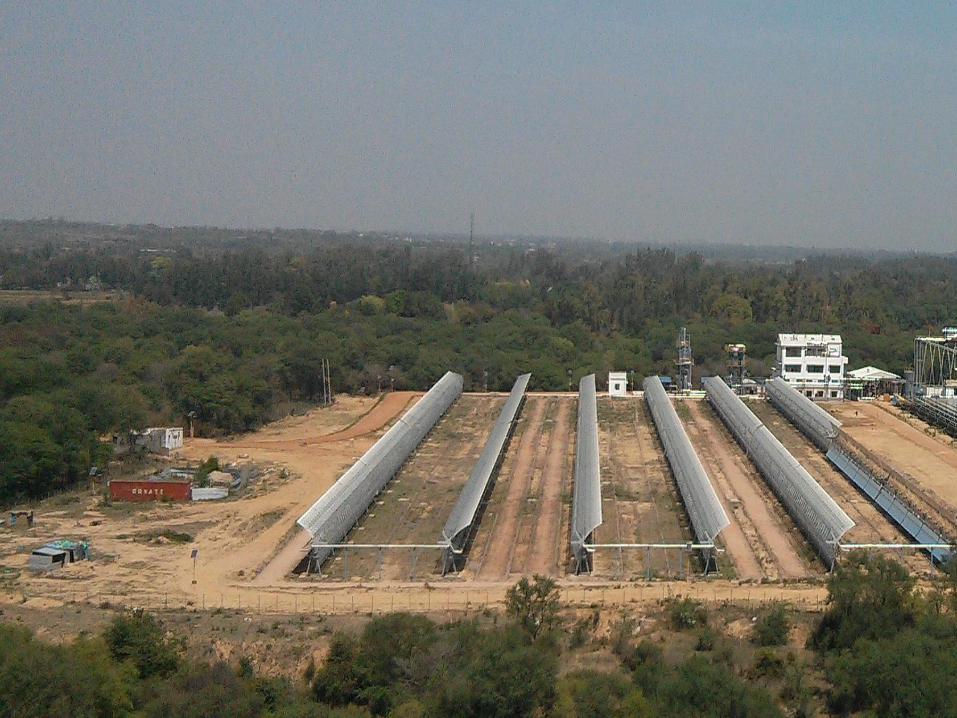
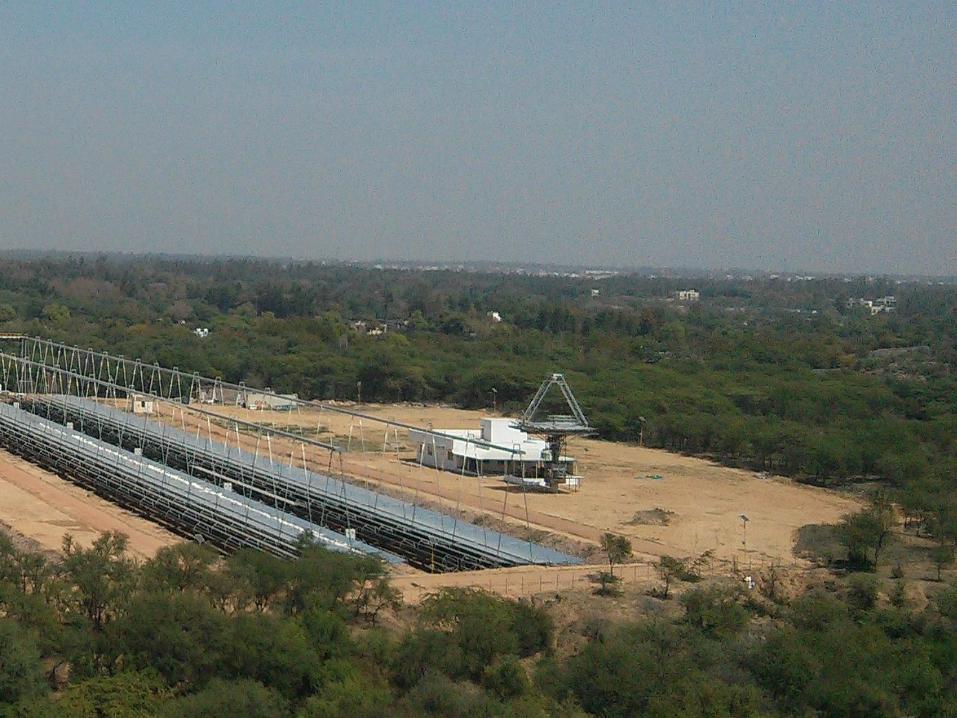
Solar Concentrators
Arun Technology
CLFR TechnologyParabolic Trough
Scheffler paraboloid dish
Heliostat
37
38
39
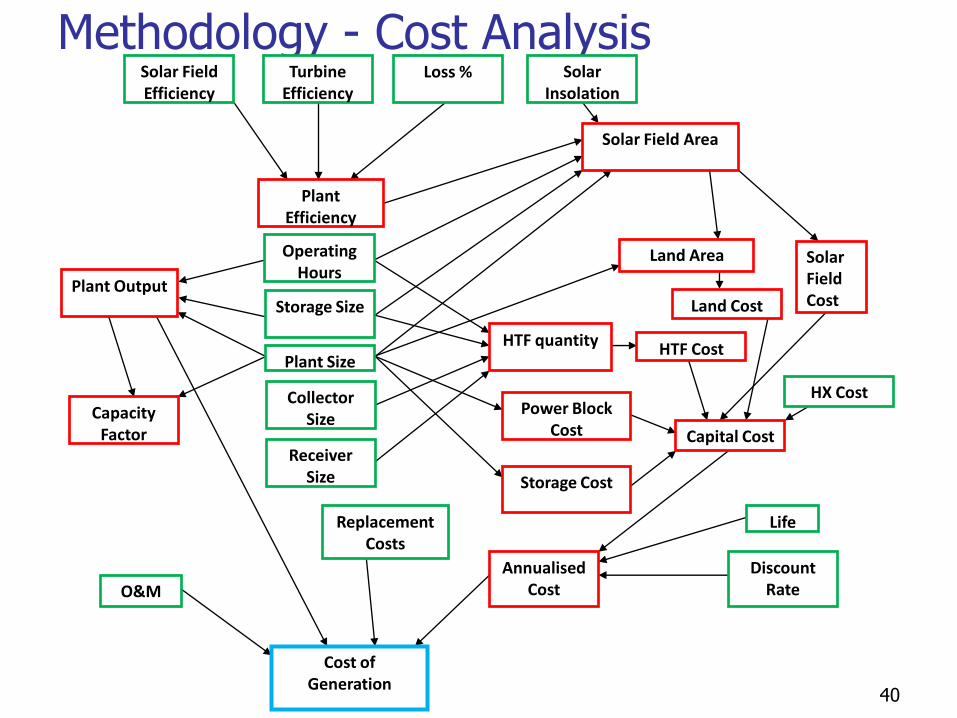
Methodology - Cost Analysis
Solar Field Cost
Solar Field Efficiency
Turbine Efficiency
Loss %
Plant Efficiency
Operating Hours
Storage Size
Plant Size
Collector Size
Receiver Size
Solar Field Area
Land Area
Land Cost
HX Cost
HTF quantity HTF Cost
Power Block Cost
Storage Cost
Capital Cost
Plant Output
Solar Insolation
Capacity Factor
Discount Rate
Life
AnnualisedCost O&M
Replacement Costs
Cost of Generation
40
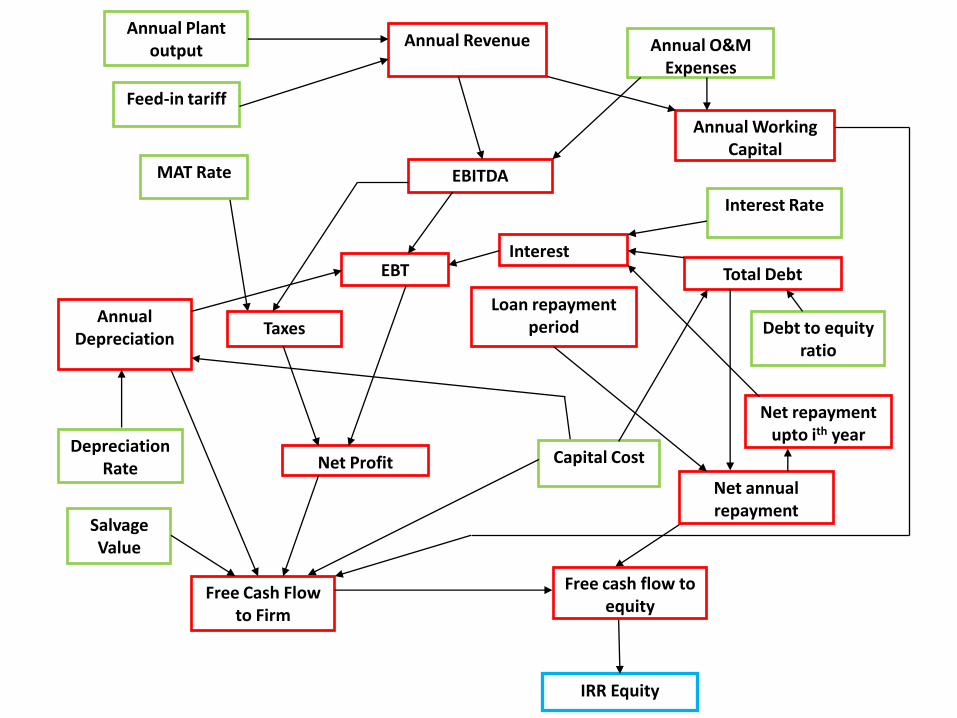
Annual Plant output
Feed-in tariff
Annual Revenue Annual O&M Expenses
Annual Working Capital
EBITDA
Capital Cost
Annual Depreciation
Debt to equity ratio
Total Debt
Interest Rate
Interest EBT
MAT Rate
Taxes
Net Profit Depreciation
Rate
Salvage Value
Free Cash Flow to Firm
Loan repayment period
Net annual repayment
Free cash flow to equity
IRR Equity
Net repayment upto ith year
Summing Up
Incremental Cost
Discount Rate – Cost of Capital matters!
Price of CER – Various methods to decide – supply- demand – rules of game
Simple, transparent methods to calculate Cost of saved carbon
42
References
R.Banerjee, Comparison of Distributed generation Options for India, Energy Policy 34, 2006,p101-111
IPCC 2011: IPCC, 2011: IPCC Special Report on Renewable Energy Sources and Climate Change Mitigation. Prepared by Working Group III of the Intergovernmental Panel on Climate Change [O. Edenhofer, R. Pichs-Madruga, Y. Sokona, K. Seyboth, P. Matschoss, S. Kadner, T. Zwickel, P. Eickemeier, G. Hansen, S. Schlömer, C. von Stechow (eds)]. Cambridge University Press, Cambridge, United Kingdom and New York, NY, USA, 1075 pphttp://srren.ipcc-wg3.de/report
http://www.climateworksaustralia.org/project/national-plan/how-read-marginal-abatement-cost-curve
http://www.mckinsey.com/insights/sustainability/a_cost_curve_for_greenhouse_gas_reduction
http://www.aph.gov.au/Parliamentary_Business/Bills_Legislation/bd/bd1213a/13bd037 http://www.wwf.se/source.php/1169157/Stern%20Report_Exec%20Summary.pdf Renewable Energy Technologies: Cost Analysis, IRENA, June 2012 http://www.eaindustry.nic.in/WPI_manual.pdf
Thank you 43
Email: [email protected] /[email protected]


![Economics & Finance - 28th November 2017 - Curtin …newitems.library.curtin.edu.au/pdf/18.pdfEconomics & Finance - 28th November 2017 ... / a case study of paper bag makers: ... [Bingley],](https://static.documents.pub/doc/80x56/5aed499c7f8b9a3b2e9053b3/economics-finance-28th-november-2017-curtin-finance-28th-november-2017.jpg)


