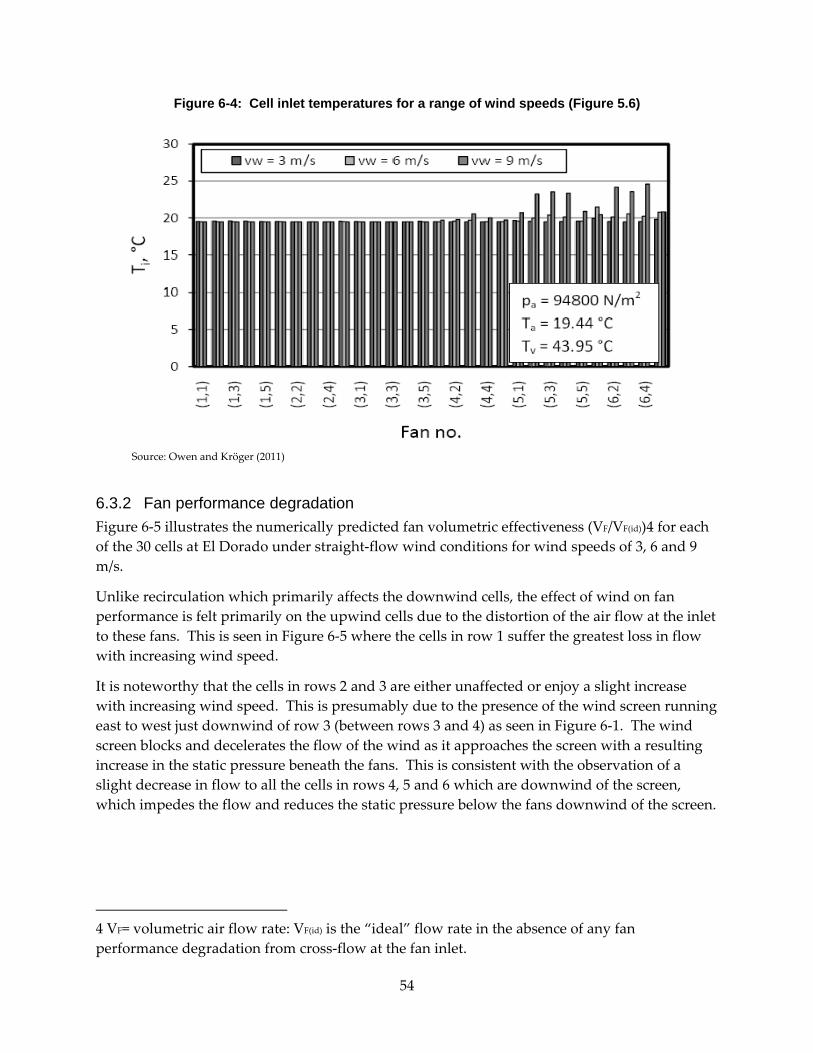
Energy Research and Development Division FINAL PROJECT REPORT EFFECT OF WIND ON THE PERFORMANCE OF AIR‐COOLED CONDENSERS JUNE 2010 CEC ‐ 500 ‐ 2013 ‐ 065 Prepared for: California Energy Commission Prepared by: John S. Maulbetsch, Consultant and Michael N. DiFilippo, Consultant
Transcript
Energy Research and Development Div is ion FINAL PROJECT REPORT
EFFECT OF WIND ON THE PERFORMANCE OF AIR‐COOLED CONDENSERS
JUNE 2010CEC ‐500 ‐2013 ‐065
Prepared for: California Energy Commission Prepared by: John S. Maulbetsch, Consultant and Michael N. DiFilippo, Consultant
PREPARED BY: Primary Author(s): John S. Maulbetsch, Consultant Michael N. DiFilippo, Consultant Contract Number: 500-07-003 Prepared for: California Energy Commission Joe O’Hagan Contract Manager Linda Spiegel Office Manager Energy Generation Research Office Laurie ten Hope Deputy Director ENERGY RESEARCH AND DEVELOPMENT DIVISION Robert P. Oglesby Executive Director
DISCLAIMER This report was prepared as the result of work sponsored by the California Energy Commission. It does not necessarily represent the views of the Energy Commission, its employees or the State of California. The Energy Commission, the State of California, its employees, contractors and subcontractors make no warranty, express or implied, and assume no legal liability for the information in this report; nor does any party represent that the uses of this information will not infringe upon privately owned rights. This report has not been approved or disapproved by the California Energy Commission nor has the California Energy Commission passed upon the accuracy or adequacy of the information in this report.
i
PREFACE
The California Energy Commission Energy Research and Development Division supports public interest energy research and development that will help improve the quality of life in California by bringing environmentally safe, affordable, and reliable energy services and products to the marketplace.
The Energy Research and Development Division conducts public interest research, development, and demonstration (RD&D) projects to benefit California.
The Energy Research and Development Division strives to conduct the most promising public interest energy research by partnering with RD&D entities, including individuals, businesses, utilities, and public or private research institutions.
Energy Research and Development Division funding efforts are focused on the following RD&D program areas:
• Buildings End‐Use Energy Efficiency
• Energy Innovations Small Grants
• Energy‐Related Environmental Research
• Energy Systems Integration
• Environmentally Preferred Advanced Generation
• Industrial/Agricultural/Water End‐Use Energy Efficiency
• Renewable Energy Technologies
• Transportation
Effect of Wind on the Performance of Air‐Cooled Condensers is the final report for the Field Testing and Computational Fluid Dynamic modeling of Wind Effects on Air‐Cooled Condensers project (Contract Number 500‐07‐003) conducted by John Maulbetsch. The information from this project contributes to Energy Research and Development Division’s Environmentally Preferred Advanced Generation Program.
For more information about the Energy Research and Development Division, please visit the Energy Commission’s website at www.energy.ca.gov/research/ or contact the Energy Commission at 916‐327‐1551.
ii
ABSTRACT
Given the increasing demands for California’s limited freshwater supplies, power plants that use air‐cooled condensers, commonly referred to as dry cooling, are increasingly being used. As opposed to conventional cooling towers, air‐cooled condensers use ambient air to cool and condense steam and therefore use no water. The performance of the air‐cooled condenser is therefore susceptible to ambient wind and temperature conditions.
This study investigated the effects wind speed and direction has on the performance of a full‐sized air‐cooled condenser at an operating power plant through field testing and monitoring and computational fluid dynamics modeling.
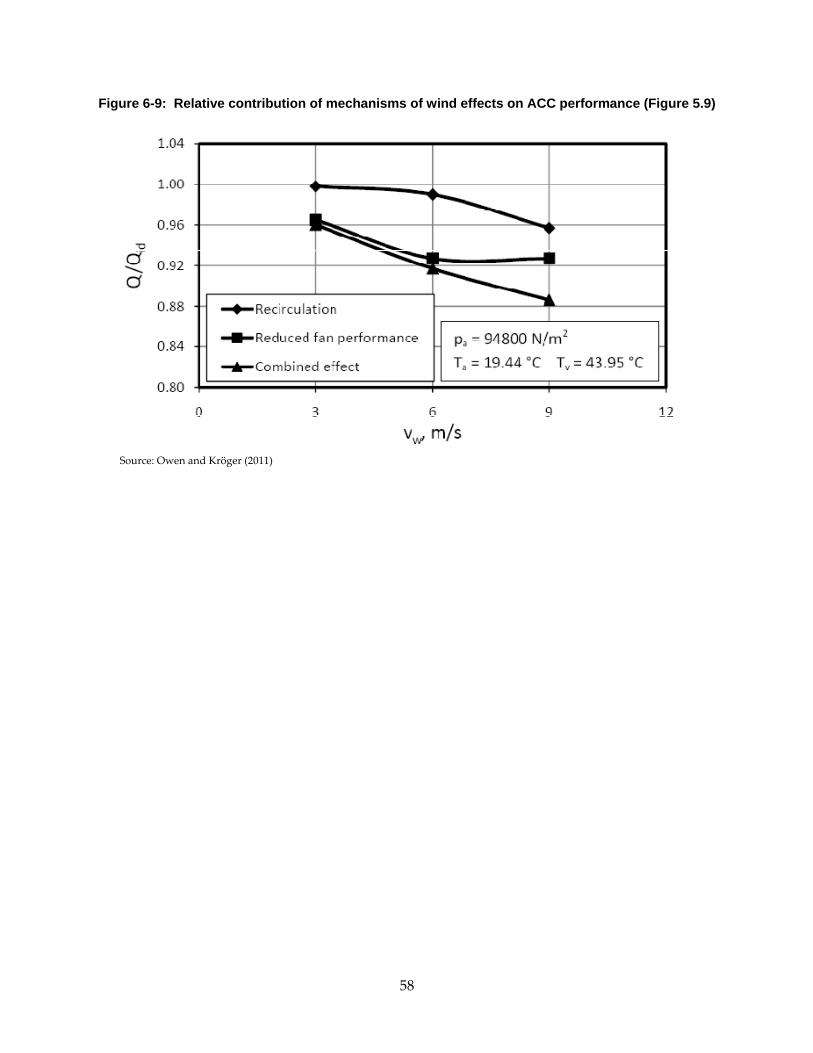
Air‐cooled condenser performance was affected both by hot air recirculation and by fan performance degradation. The combined effect of the two mechanisms increased with wind speed up to an increase in turbine exhaust pressure of as much as two inches of mercury (a unit of measure for pressure) at wind speeds over 20 miles per hour (mph) and ambient temperatures above 100 °F.
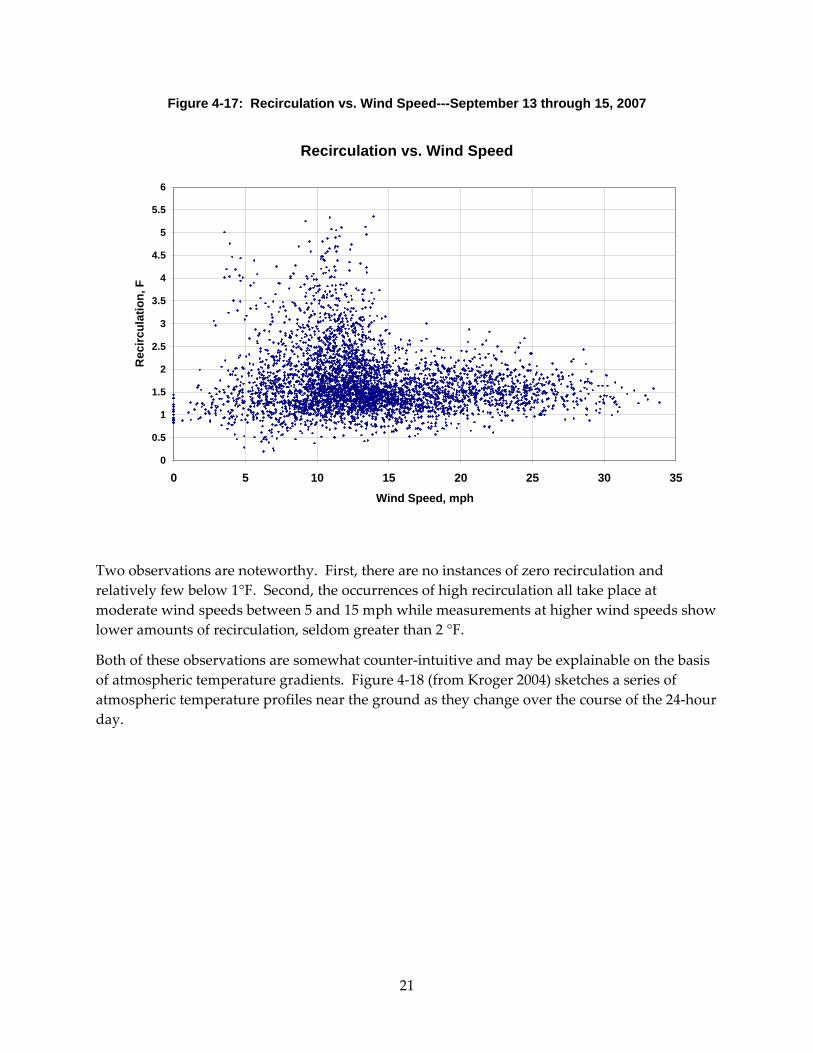
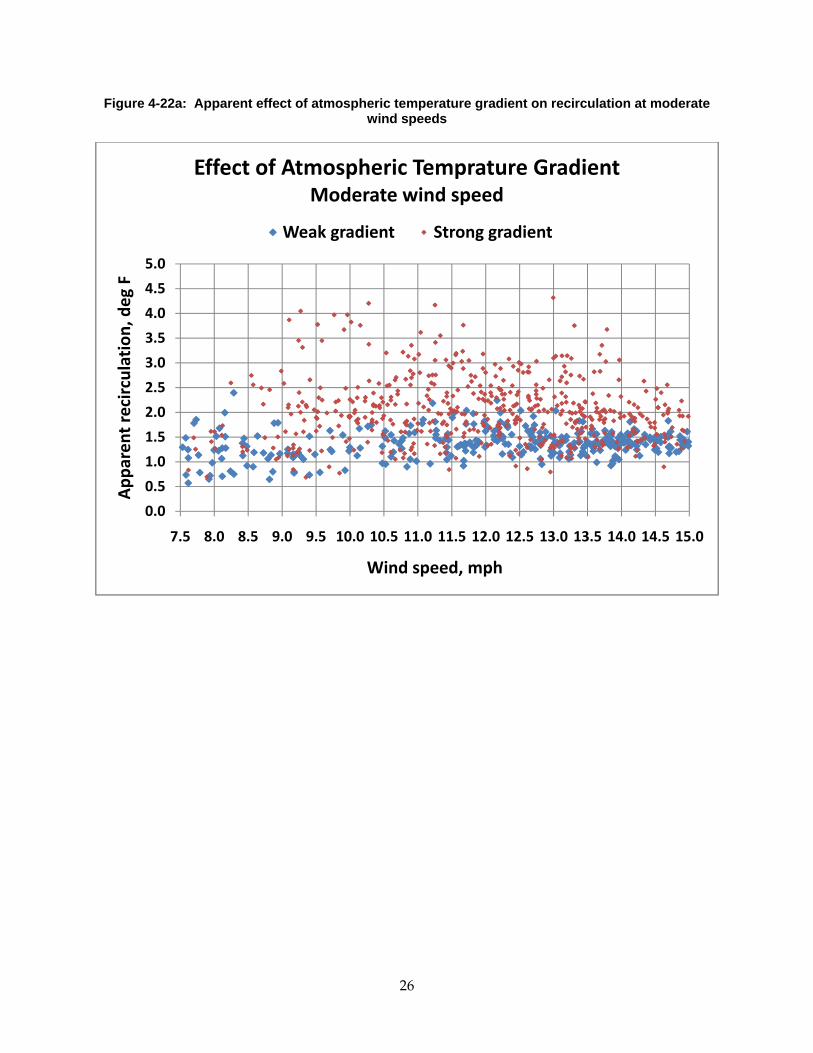
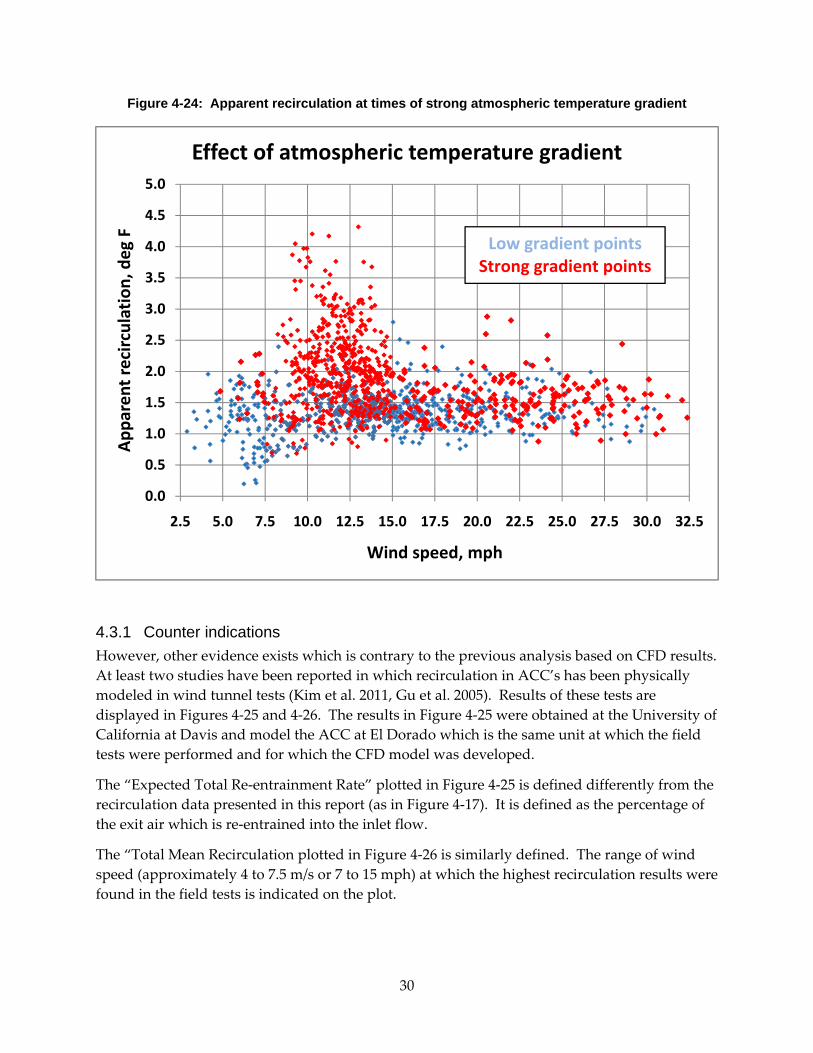
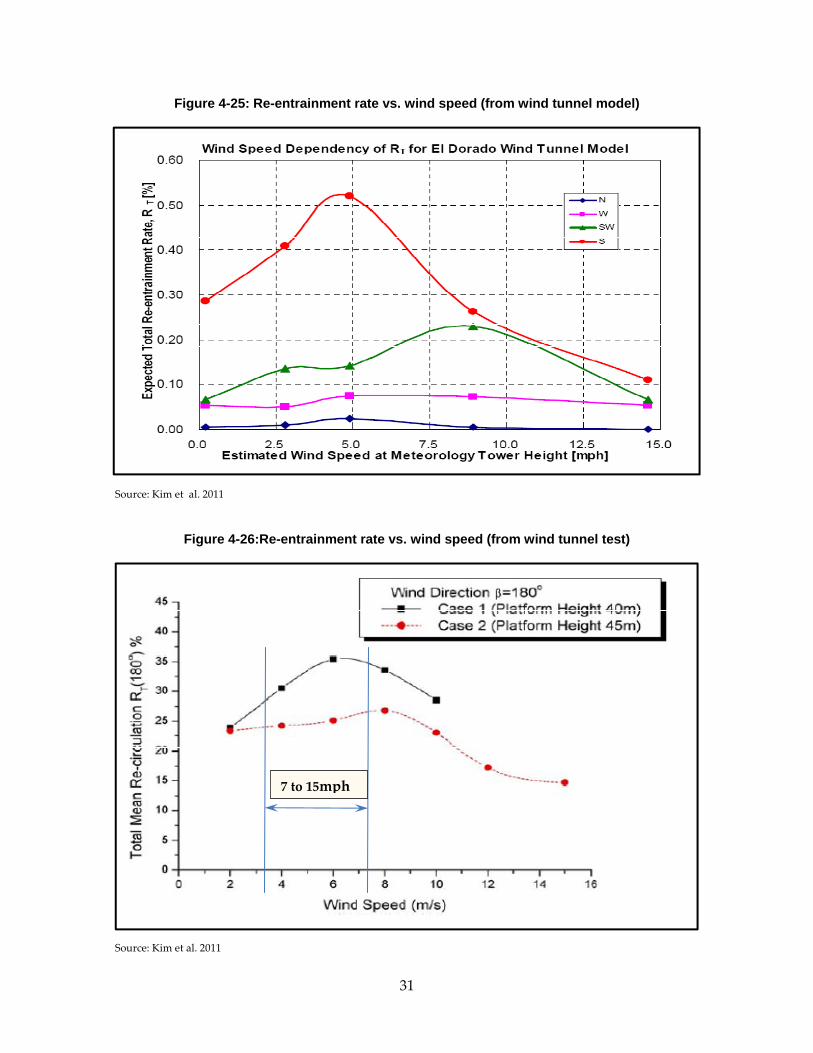
The highest recirculation occurred at intermediate wind speeds between about 7.5 and 15 mph. Above 15 mph, the recirculation diminished and then increased slowly up to the maximum wind speeds of 30 to 35 mph. At the higher temperatures and wind speeds, the effect of air flow reduction was two to three times that of recirculation.
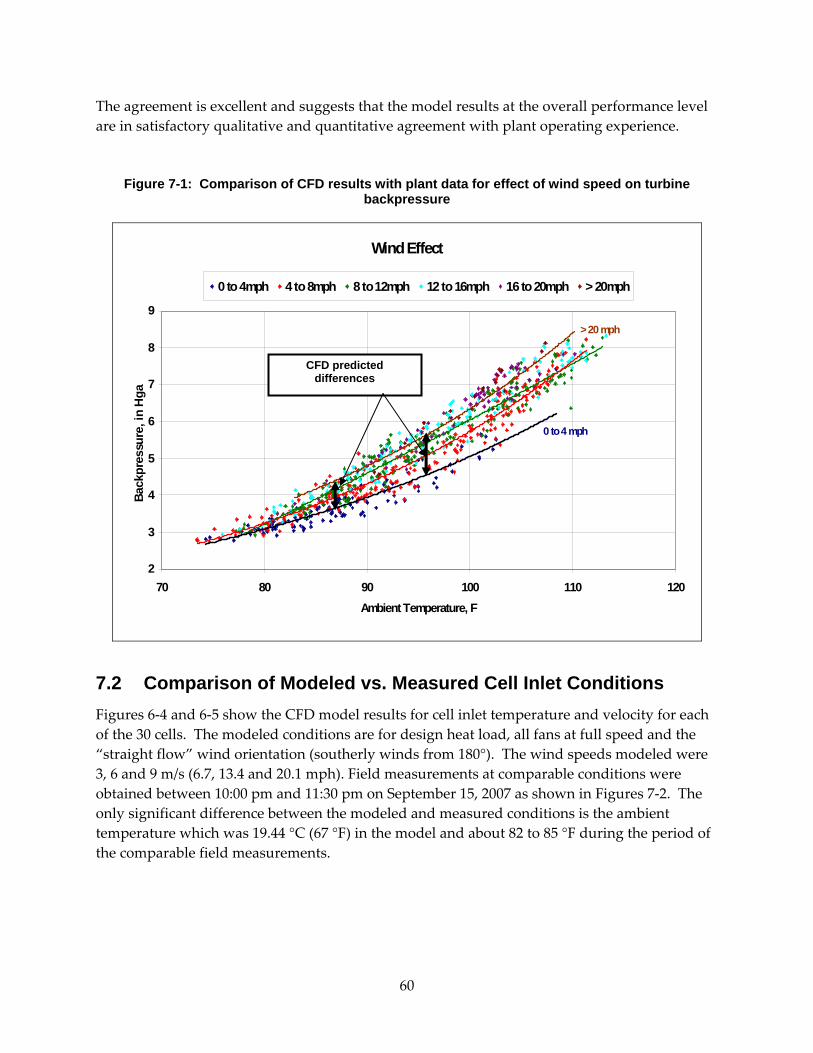
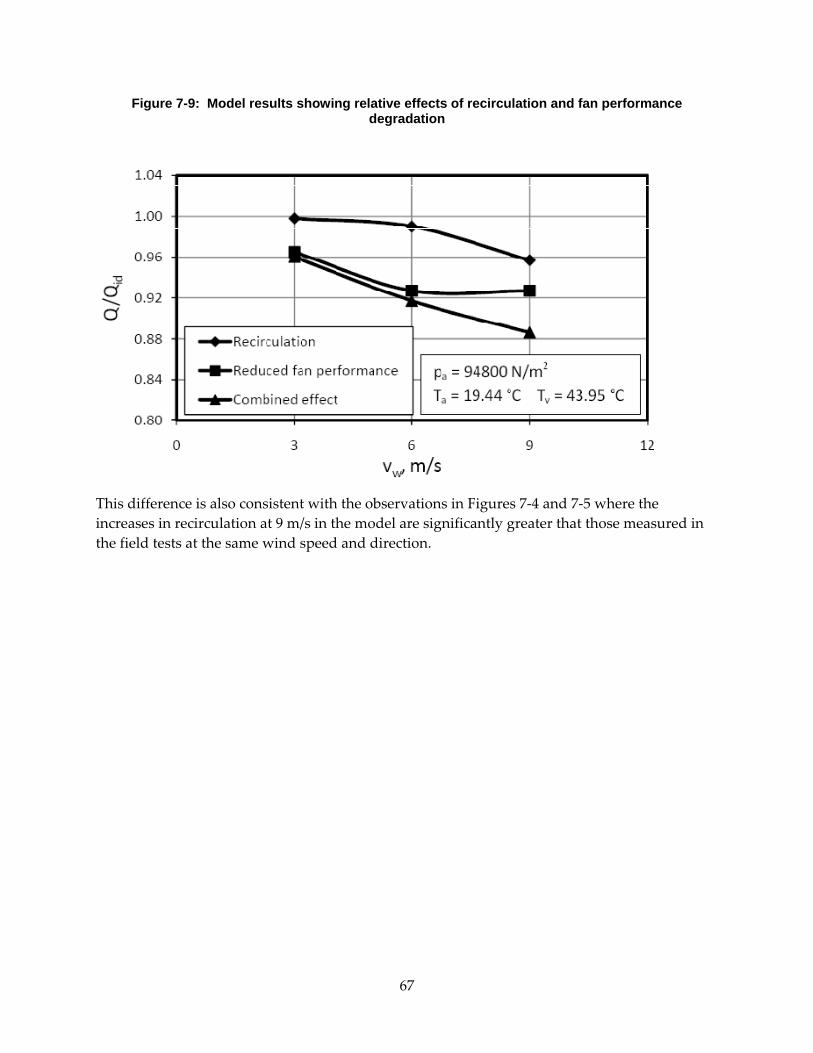
The agreement between the field data and the computational fluid dynamic modeling results was generally satisfactory, with the notable exception that the modeling results did not predict the increase in recirculation in the moderate speed range. This difference is currently unresolved. Steps to address wind effects and enhance air‐cooled condenser performance are modeled and evaluated.
Keywords: Air‐cooled condensers, computational fluid dynamics, power plants, wind, recirculation
Please use the following citation for this report:
Maulbetsch, John, Michael DiFilippo. 2010. Effect of Wind on the Performance of Air‐Cooled Condensers. California Energy Commission. Publication Number: CEC‐500‐2013‐065
iii
TABLE OF CONTENTS
PREFACE ..................................................................................................................................................... i
ABSTRACT ............................................................................................................................................... ii
TABLE OF CONTENTS ......................................................................................................................... iii
LIST OF FIGURES .................................................................................................................................. vi
LIST OF TABLES ...................................................................................................................................... x
LIST OF FIGURES Figure 1‐1: Effect of Wind on ACC Performance ................................................................................. 8
Figure 2‐1: Aerial View of El DoradoEnergyCenter and Surroundings ......................................... 13
Figure 2‐2: Aerial View of El Dorado Energy Plant Site .................................................................... 14
Figure 2‐3: Ground level view of El Dorado Energy Plant Site ........................................................ 16
Figure 2‐4: Scale model of ACC and other plant structures (from Ref. 7) ...................................... 17
Figure 2‐5: North end of ACC showing risers, HRSG and east end of turbine building ............. 18
Figure 2‐6: View underneath the ACC showing the windscreens ................................................... 19
Figure 2‐7: View underneath the ACC showing condensate return equipment and motor control center buildings .......................................................................................................................... 20
Figure 2‐8: El Dorado ACC Layout ...................................................................................................... 21
Figure 2‐9: Met tower located on berm to west of ACC .................................................................... 22
Figure 2‐10: Aspirating psychrometer and directional anemometer on west tower ..................... 23
Figure 2‐11: Aspirating psychrometers at ACC inlet under Cell 7 .................................................. 24
Figure 2‐12: Exit air temperature probes on Cell 18 ........................................................................... 25
Figure 2‐13: Air inlet velocity anemometers mounted under Cell 18 ............................................. 26
Figure 2‐14: Close‐up of inlet air velocity anemometers ................................................................... 26
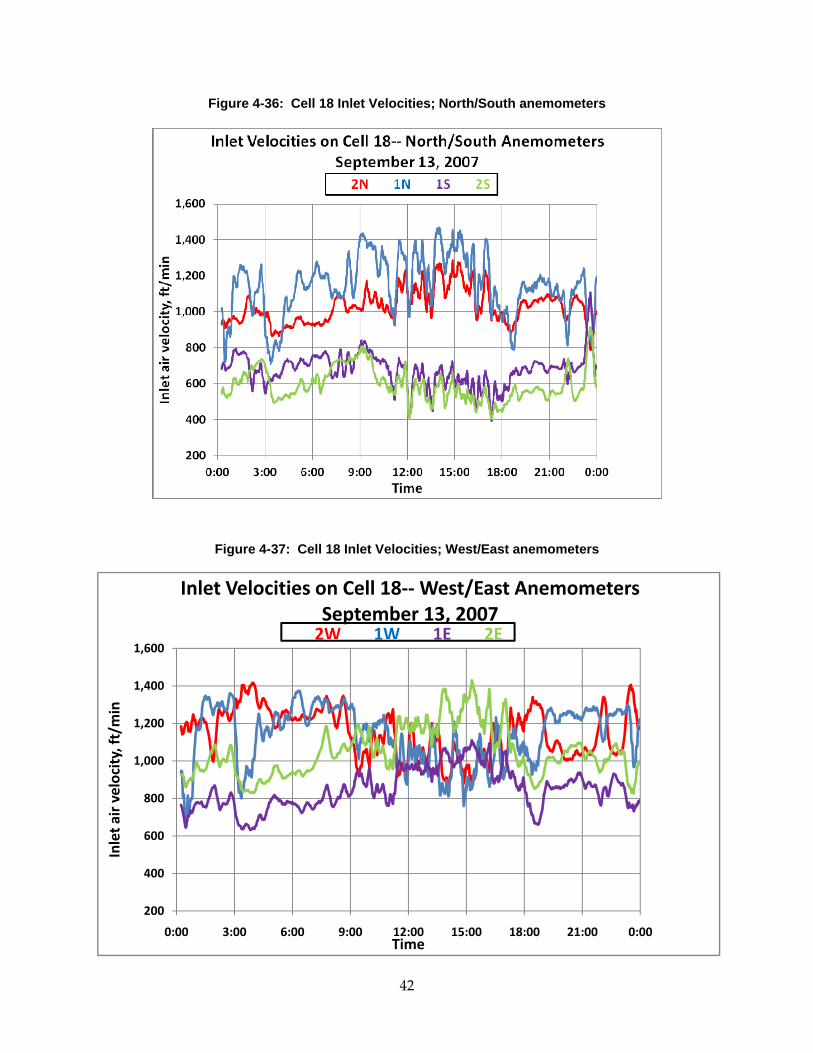
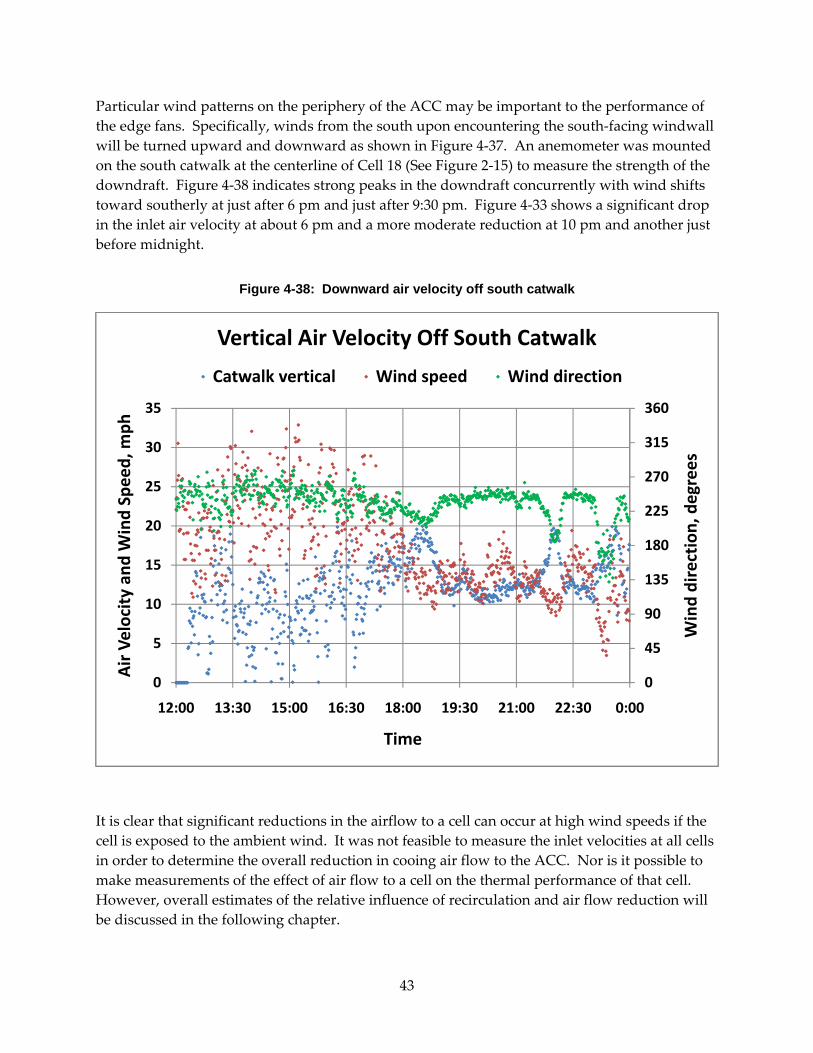
Figure 2‐15: Horizontal air velocity anemometers at south inlet plane of ACC ............................ 27
Figure 2‐16: Close‐up of vertical air velocity measurement point off south catwalk .................... 28
Figure 2‐17: Plant ambient air temperature monitor ......................................................................... 29
Figure 2‐18: Air temperature measurement underneath ACC ......................................................... 29
Figure 2‐19: Plant wind speed and direction tower ........................................................................... 30
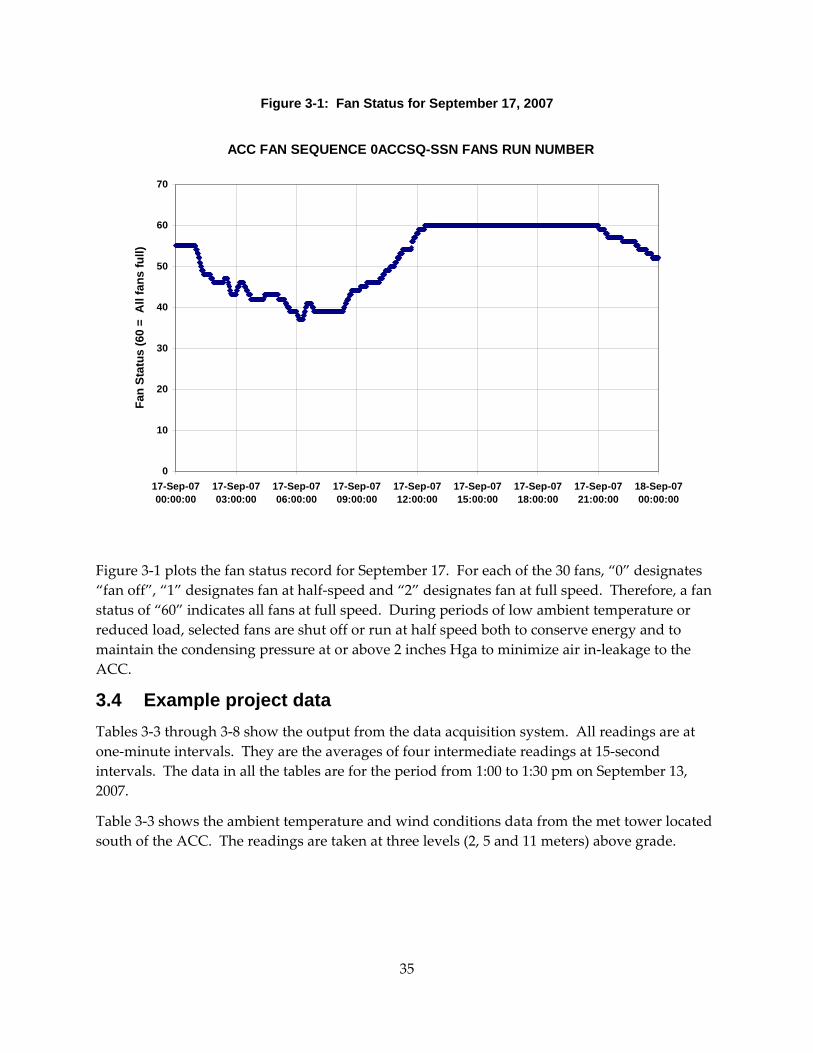
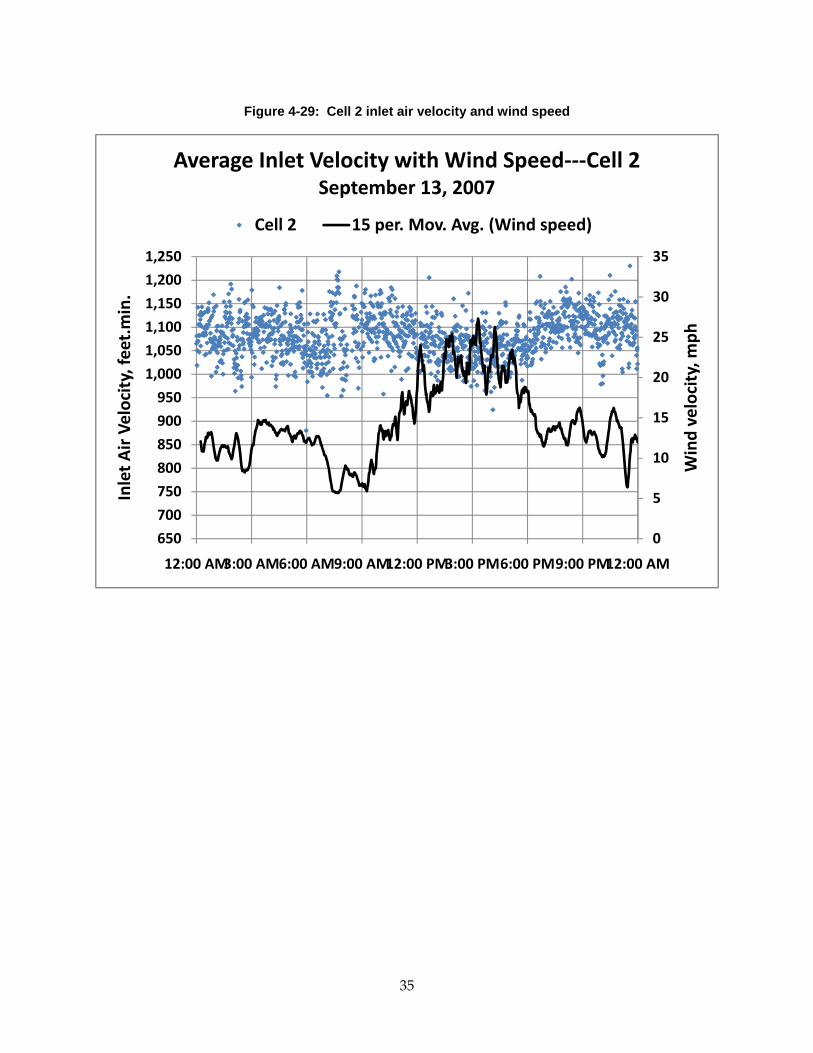
Figure 3‐1: Fan Status for September 17, 2007..................................................................................... 35
Figure 4‐1: Comparison of ambient temperature measurements ....................................................... 8
Figure 4‐3: Ambient temperature measurements at west tower ......................................................... 8
Figure 4‐2: Ambient temperature measurements at south tower ....................................................... 9
Figure 4‐4: Wind speed measurements on south tower .................................................................... 10
Figure 4‐5: Wind speed measurements on west tower ...................................................................... 10
Figure 4‐6: Wind speed comparisons—South and west towers @ 11 m .......................................... 11
vii
Figure 4‐7: Wind speed comparison—South and west towers @ 11 m and plant tower ........... 11
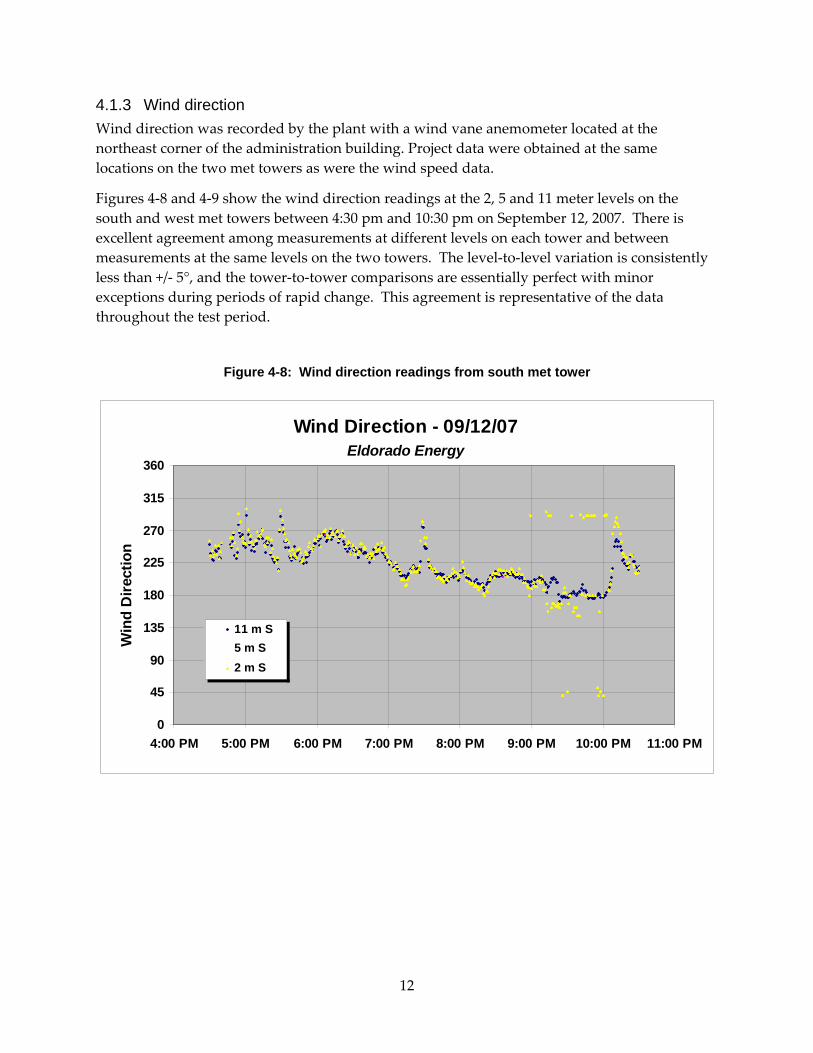
Figure 4‐8: Wind direction readings from south met tower ............................................................. 12
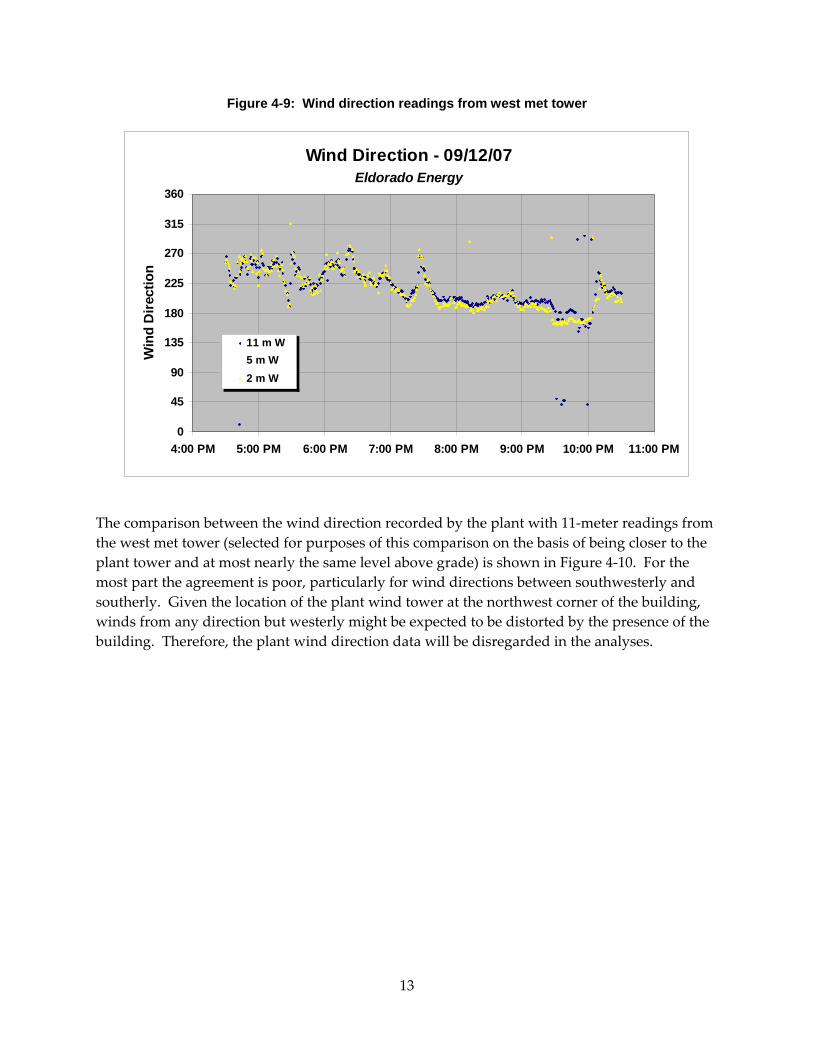
Figure 4‐9: Wind direction readings from west met tower ............................................................... 13
Figure 4‐10: Wind direction readings from west met tower and plant wind vane ....................... 14
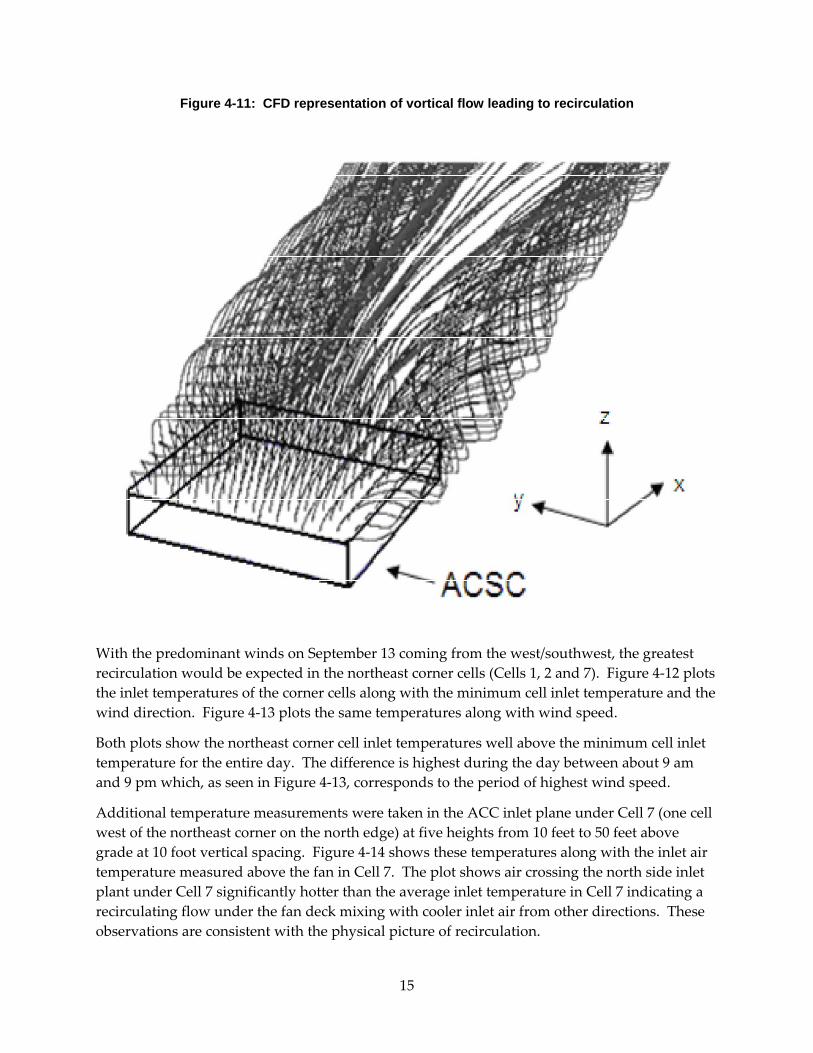
Figure 4‐11: CFD representation of vortical flow leading to recirculation ..................................... 15
Figure 4‐12: Northeast corner cell inlet temperatures with wind direction ................................... 16
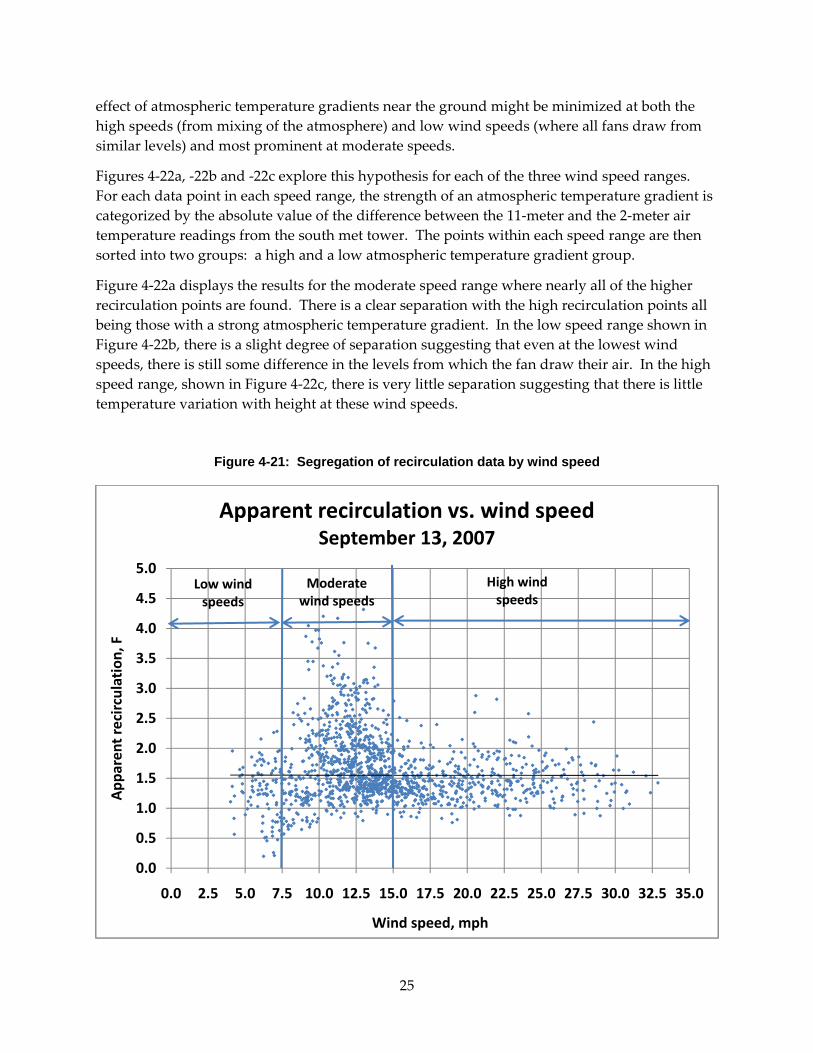
Figure 4‐21: Segregation of recirculation data by wind speed ......................................................... 25
Figure 4‐22a: Apparent effect of atmospheric temperature gradient on recirculation at moderate wind speeds .............................................................................................................................................. 26
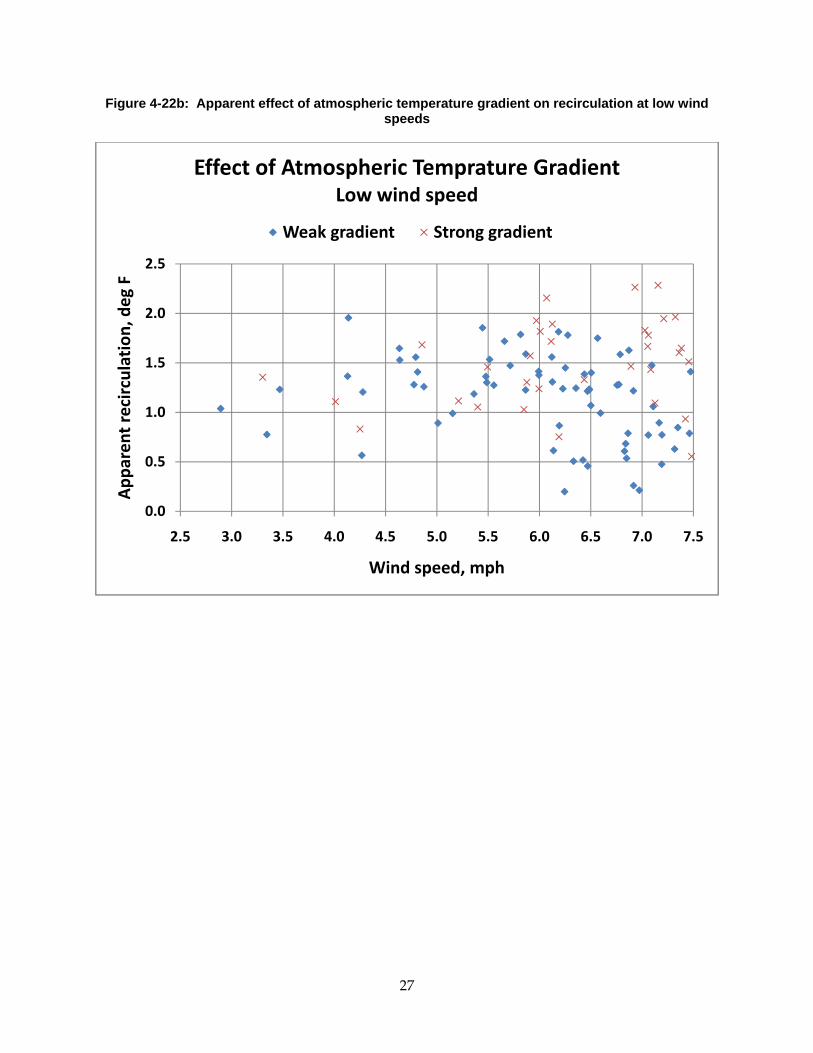
Figure 4‐22b: Apparent effect of atmospheric temperature gradient on recirculation at low wind speeds ........................................................................................................................................................ 27
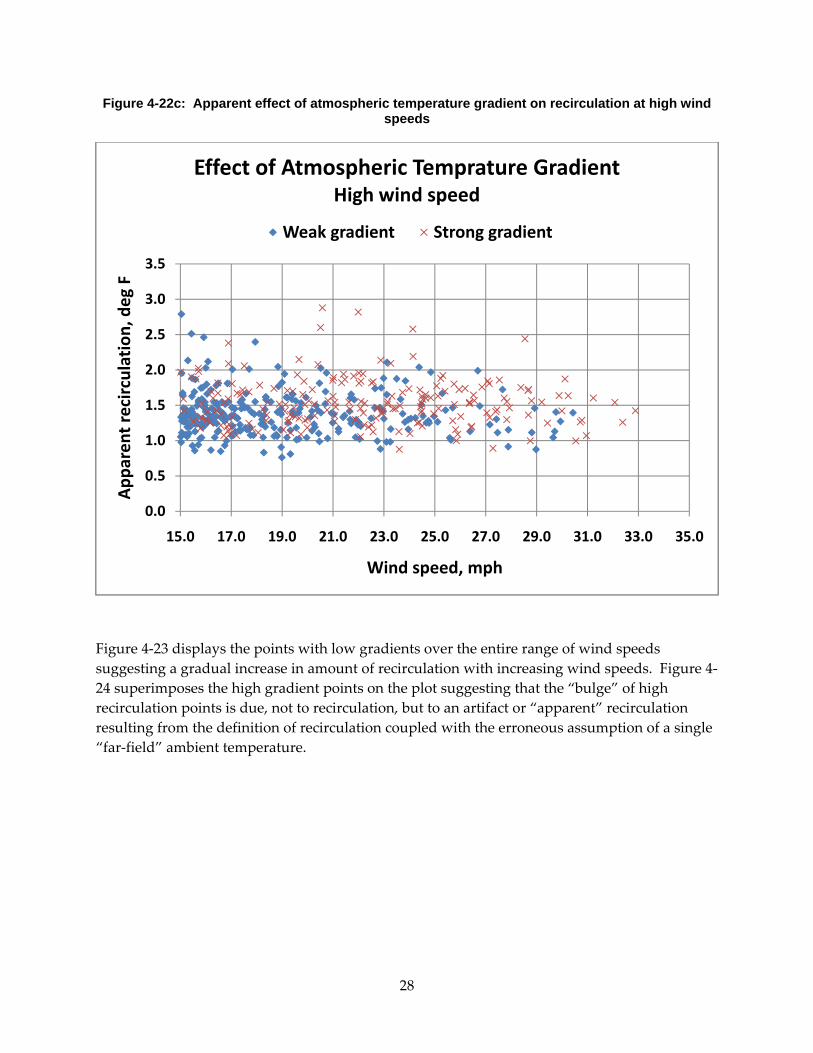
Figure 4‐22c: Apparent effect of atmospheric temperature gradient on recirculation at high wind speeds .............................................................................................................................................. 28
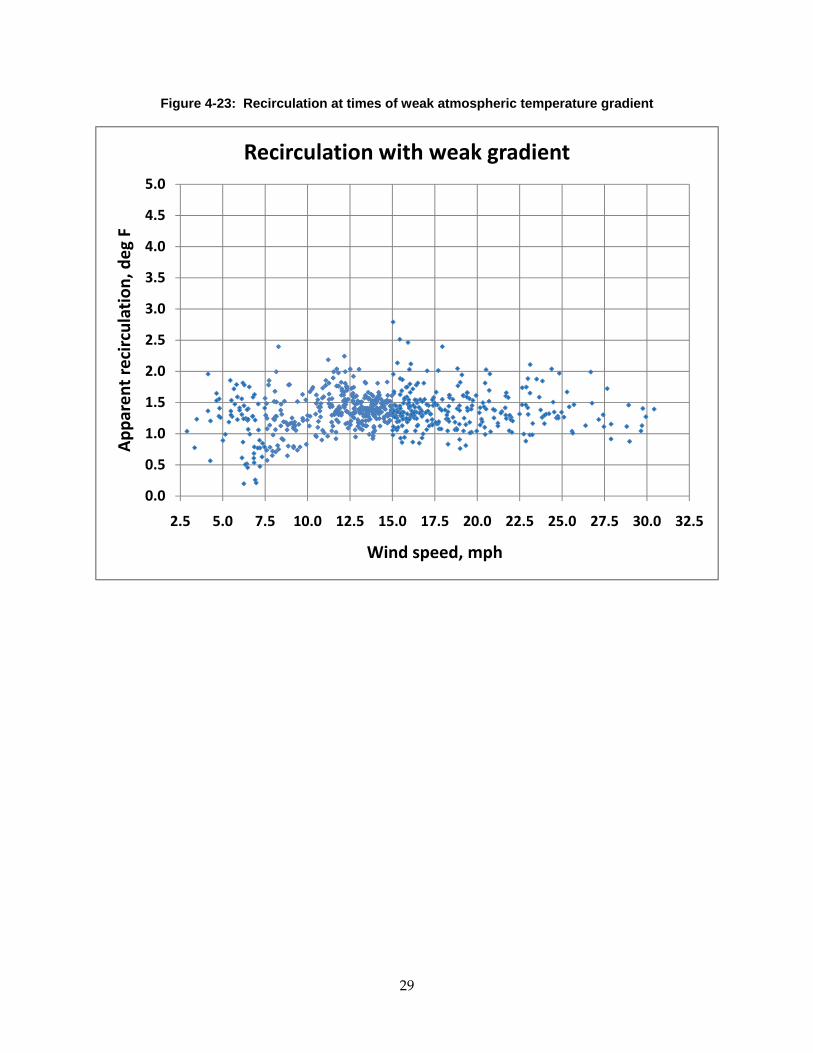
Figure 4‐23: Recirculation at times of weak atmospheric temperature gradient ........................... 29
Figure 4‐24: Apparent recirculation at times of strong atmospheric temperature gradient ........ 30
Figure 6‐2: Comparison of predicted and measured steam turbine exhaust pressure (from Figure 4.7) .................................................................................................................................................. 52
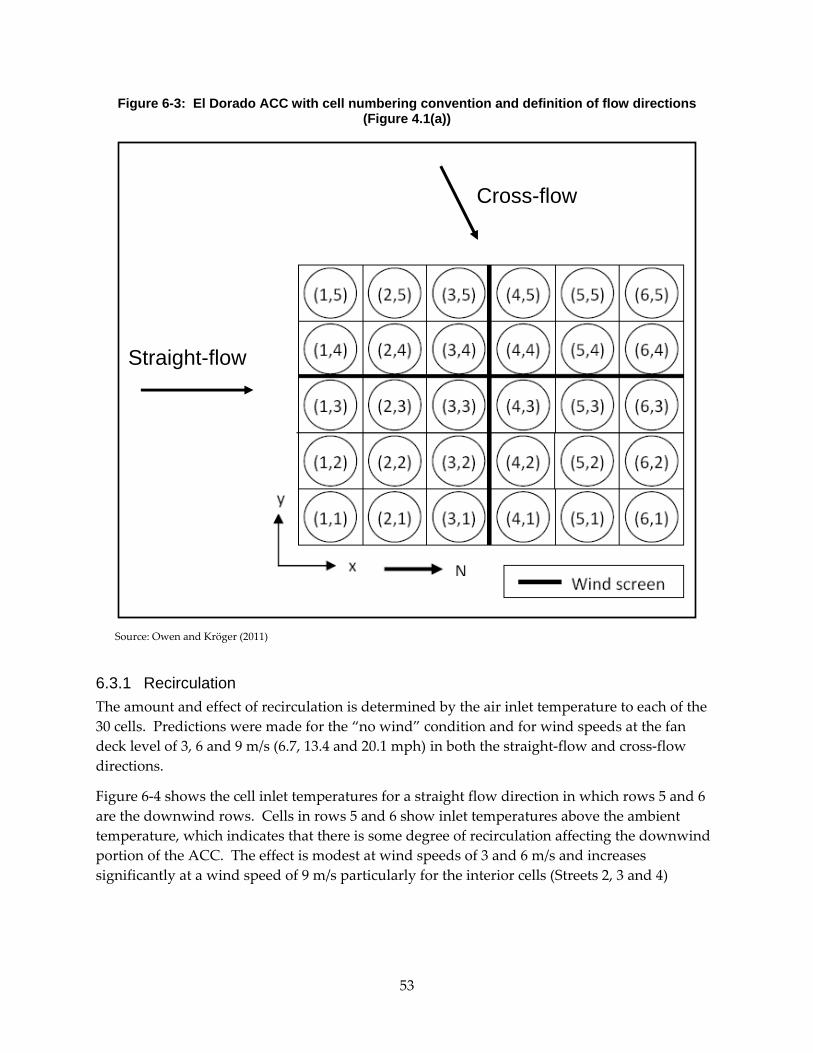
Figure 6‐3: El Dorado ACC with cell numbering convention and definition of flow directions (Figure 4.1(a)) ............................................................................................................................................ 53
Figure 6‐4: Cell inlet temperatures for a range of wind speeds (Figure 5.6) .................................. 54
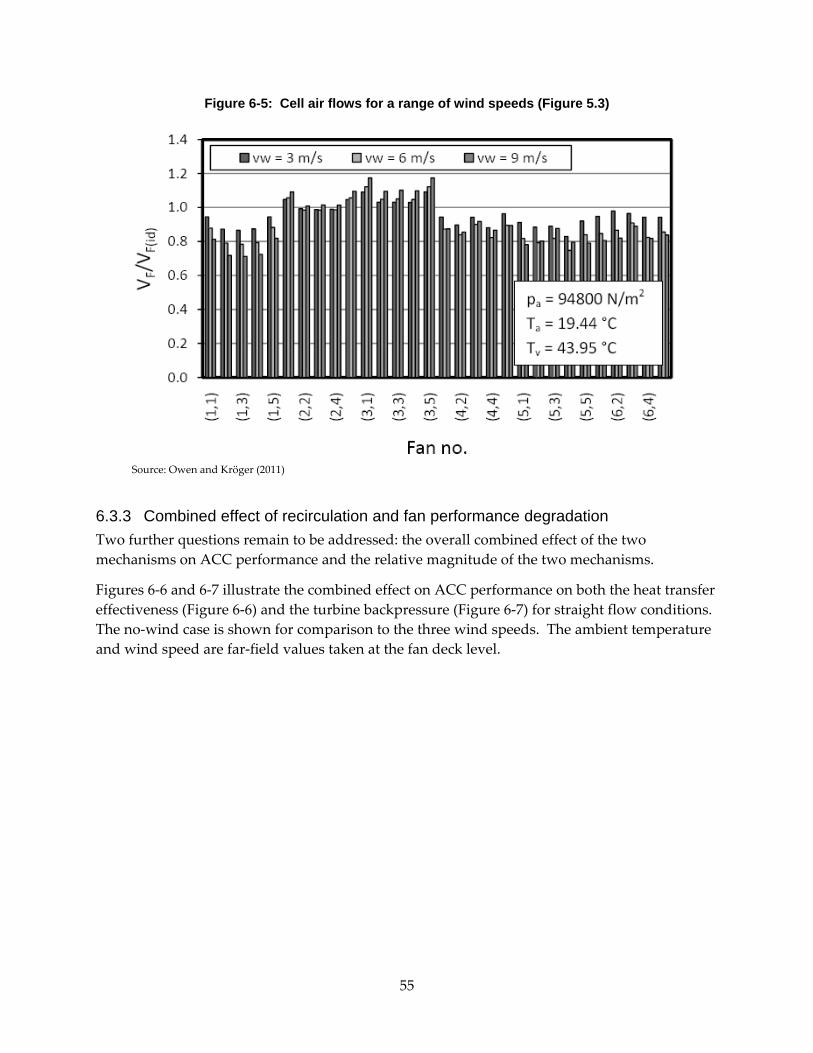
Figure 6‐5: Cell air flows for a range of wind speeds (Figure 5.3) ................................................... 55
Figure 6‐6: Heat transfer effectiveness for three wind speeds and straight‐flow conditions (Figure 5.1(a)) ............................................................................................................................................ 56
Figure 6‐7: Turbine exhaust pressure for three wind speeds and straight‐flow conditions (Figure 5.2(a)) ............................................................................................................................................ 56
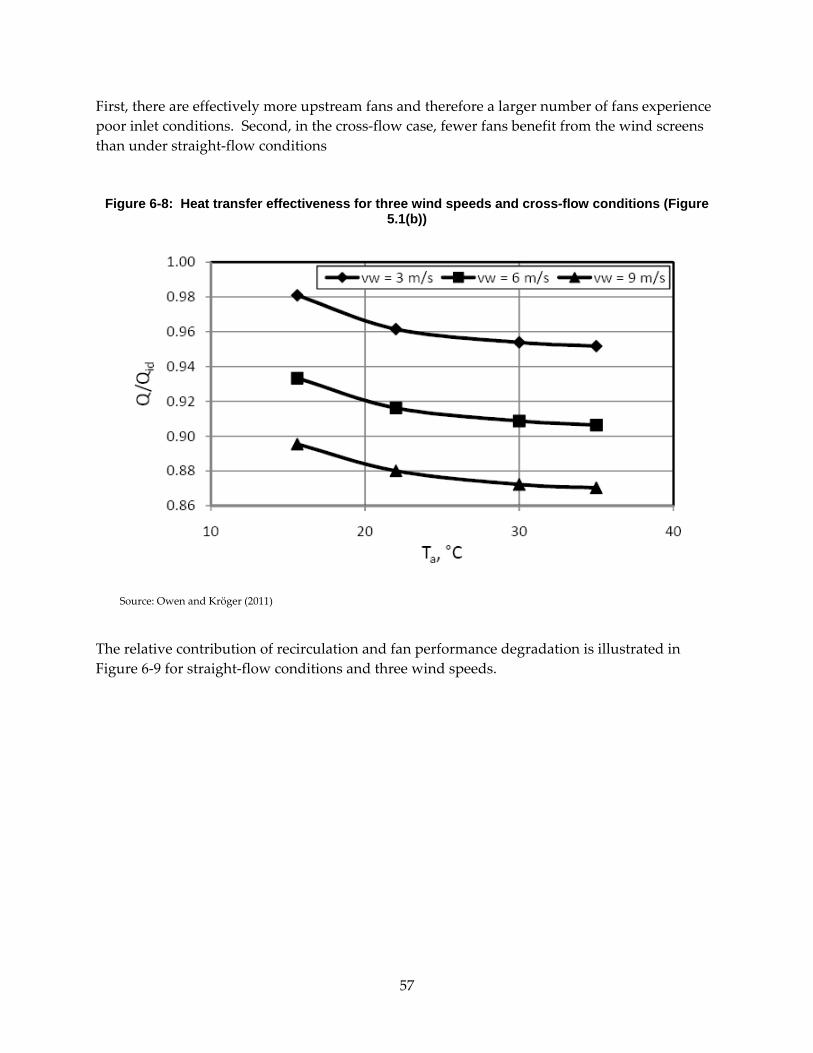
Figure 6‐8: Heat transfer effectiveness for three wind speeds and cross‐flow conditions (Figure 5.1(b)) ......................................................................................................................................................... 57
Figure 6‐9: Relative contribution of mechanisms of wind effects on ACC performance (Figure 5.9) .............................................................................................................................................................. 58
Figure 7‐1: Comparison of CFD results with plant data for effect of wind speed on turbine backpressure ............................................................................................................................................. 60
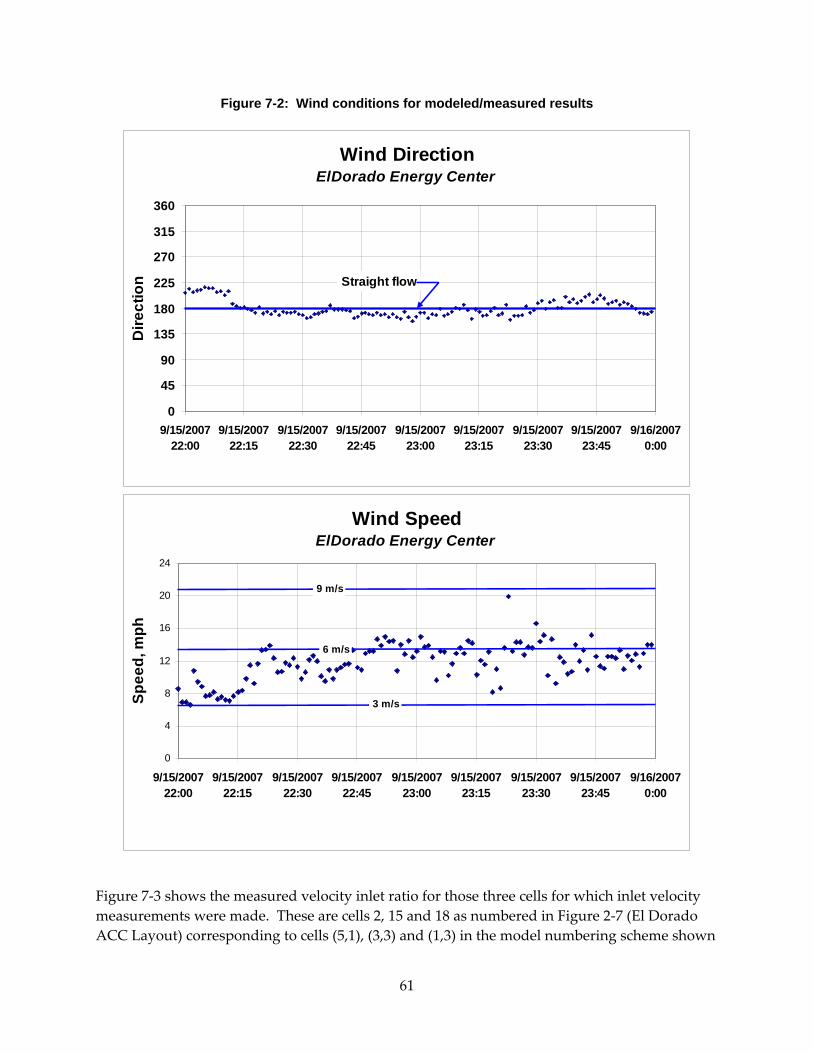
Figure 7‐2: Wind conditions for modeled/measured results ............................................................ 61
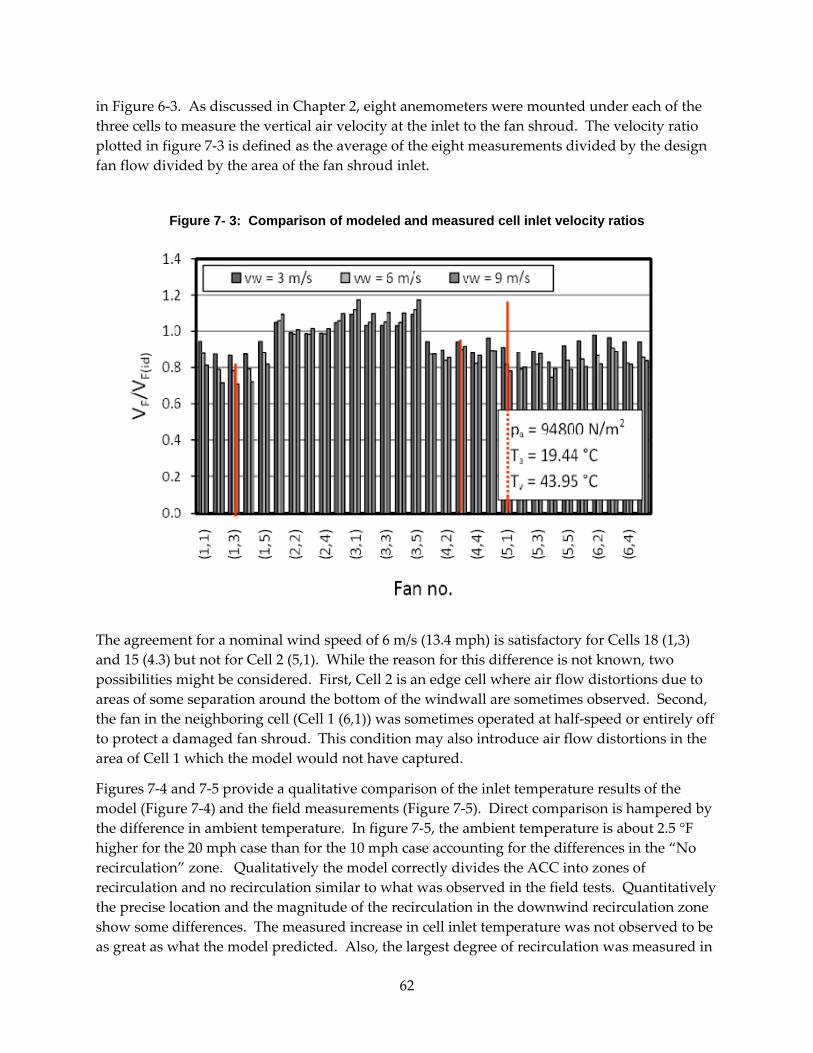
Figure 7‐ 3: Comparison of modeled and measured cell inlet velocity ratios ................................ 62
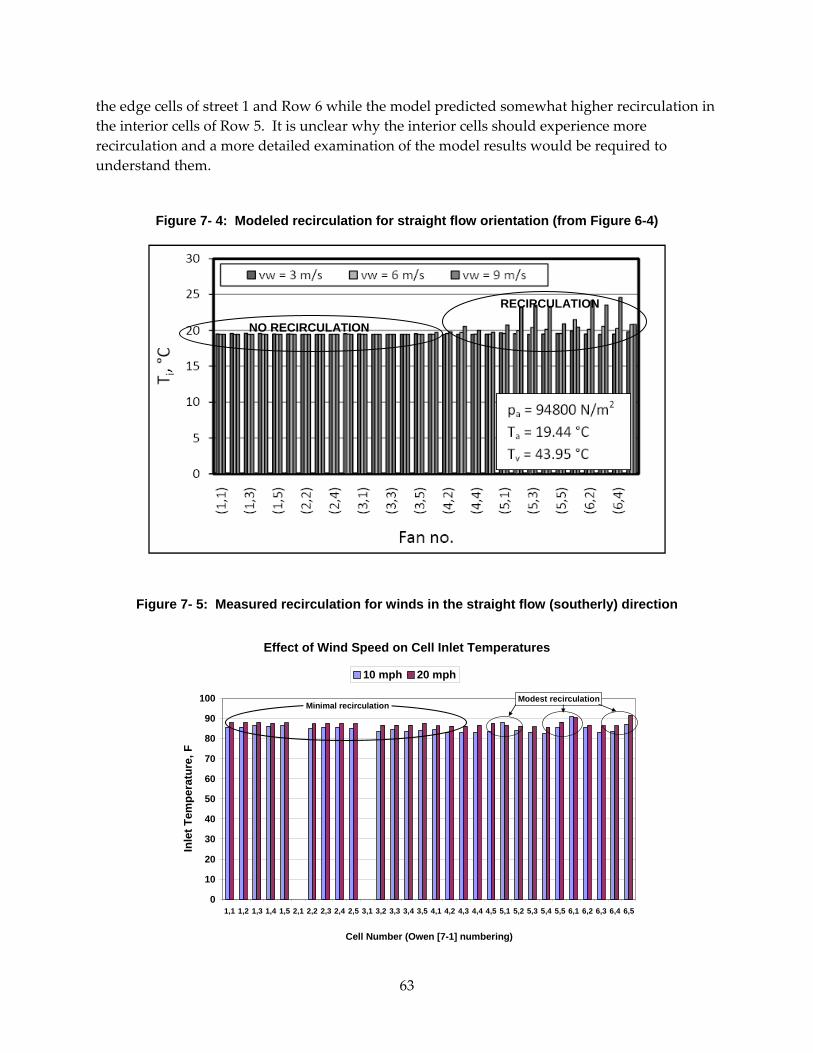
Figure 7‐ 5: Measured recirculation for winds in the straight flow (southerly) direction ............ 63
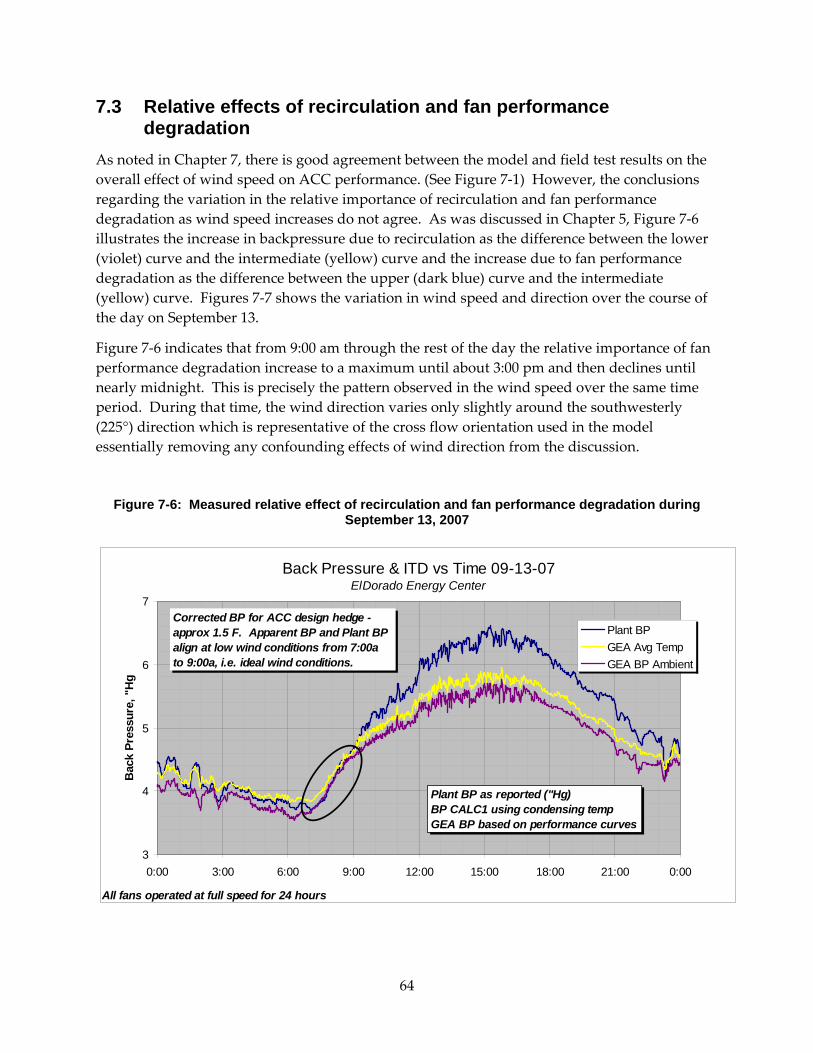
Figure 7‐6: Measured relative effect of recirculation and fan performance degradation during September 13, 2007 ................................................................................................................................... 64
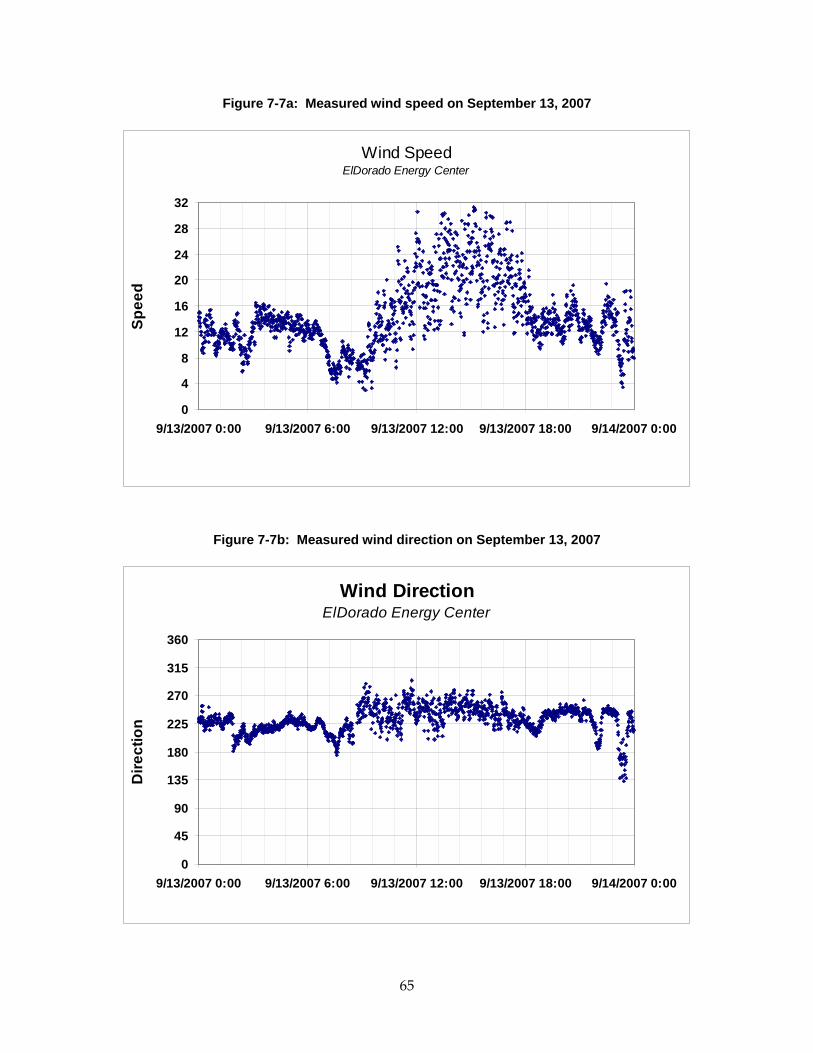
Figure 7‐7a: Measured wind speed on September 13, 2007 .............................................................. 65
Figure 7‐7b: Measured wind direction on September 13, 2007 ........................................................ 65
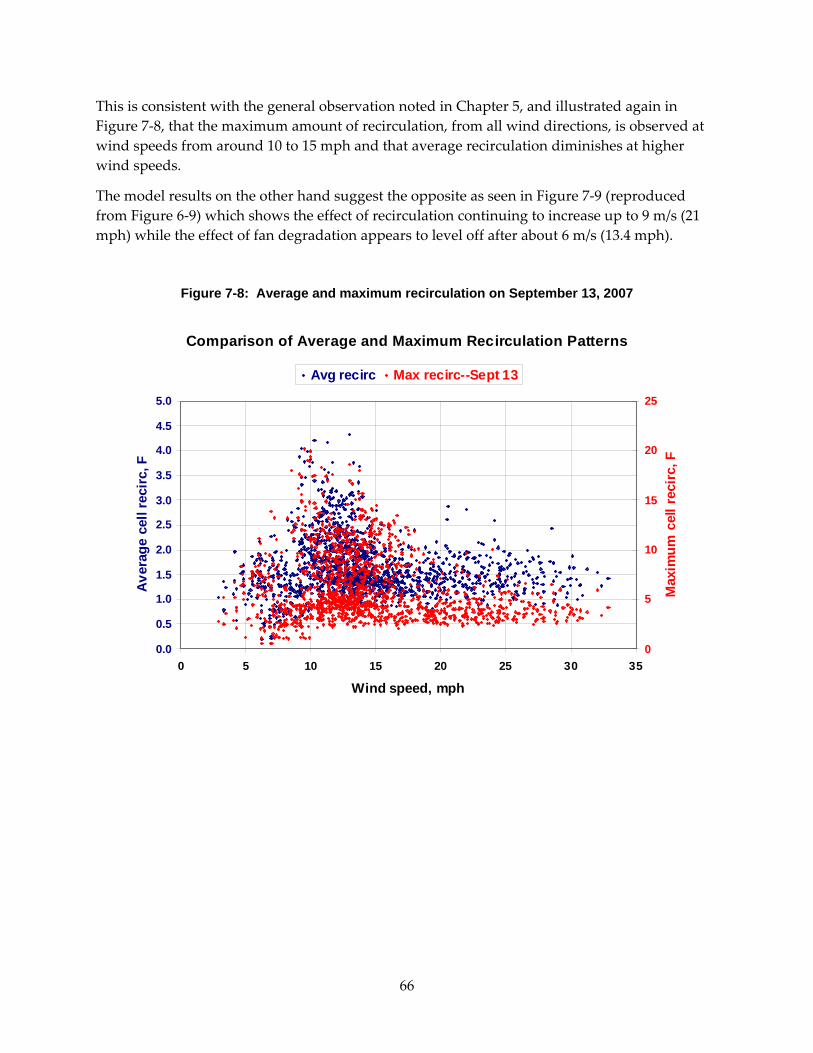
Figure 7‐8: Average and maximum recirculation on September 13, 2007 ...................................... 66
Figure 7‐9: Model results showing relative effects of recirculation and fan performance degradation ............................................................................................................................................... 67
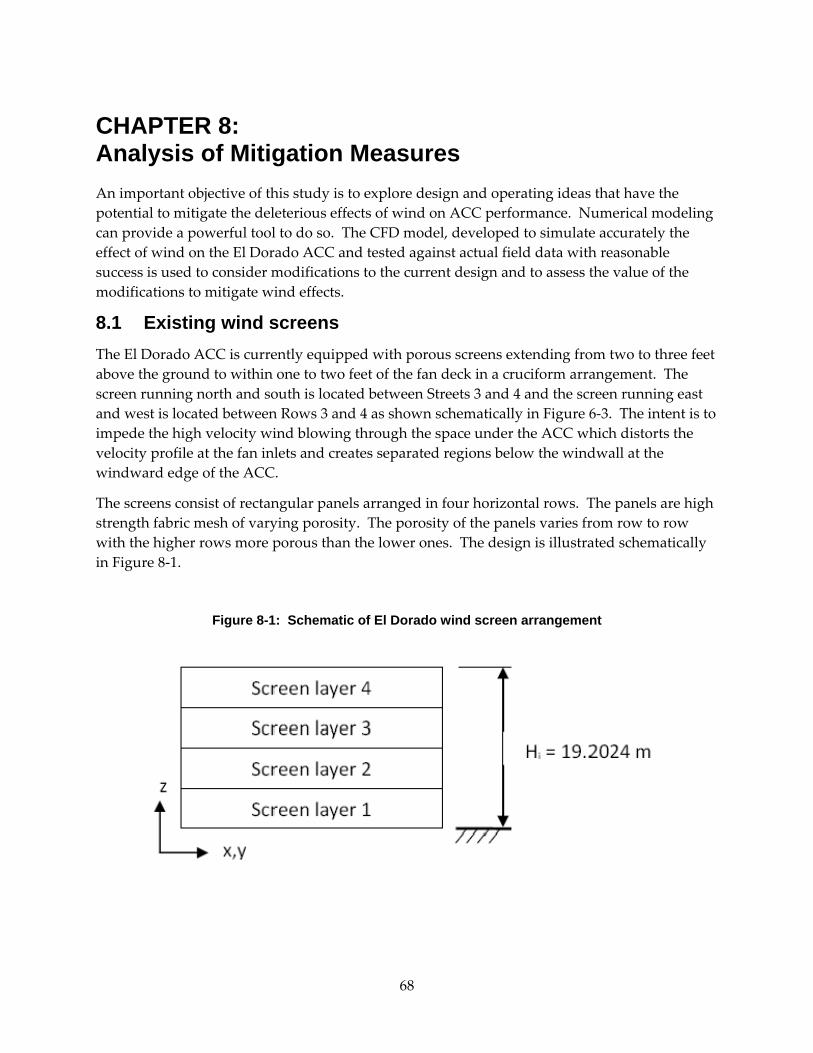
Figure 8‐1: Schematic of El Dorado wind screen arrangement ........................................................ 68
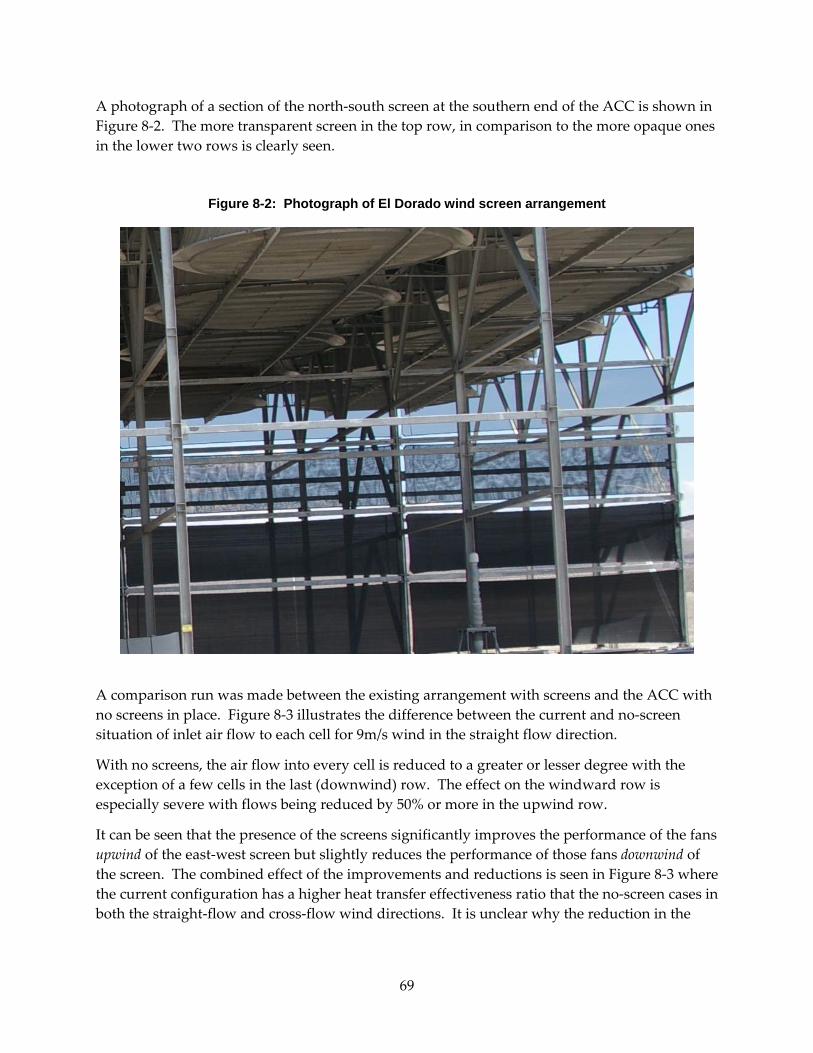
Figure 8‐2: Photograph of El Dorado wind screen arrangement ..................................................... 69
Figure 8‐3: Effect of wind screen on fan volumetric effectiveness (Figure 6.3) .............................. 70
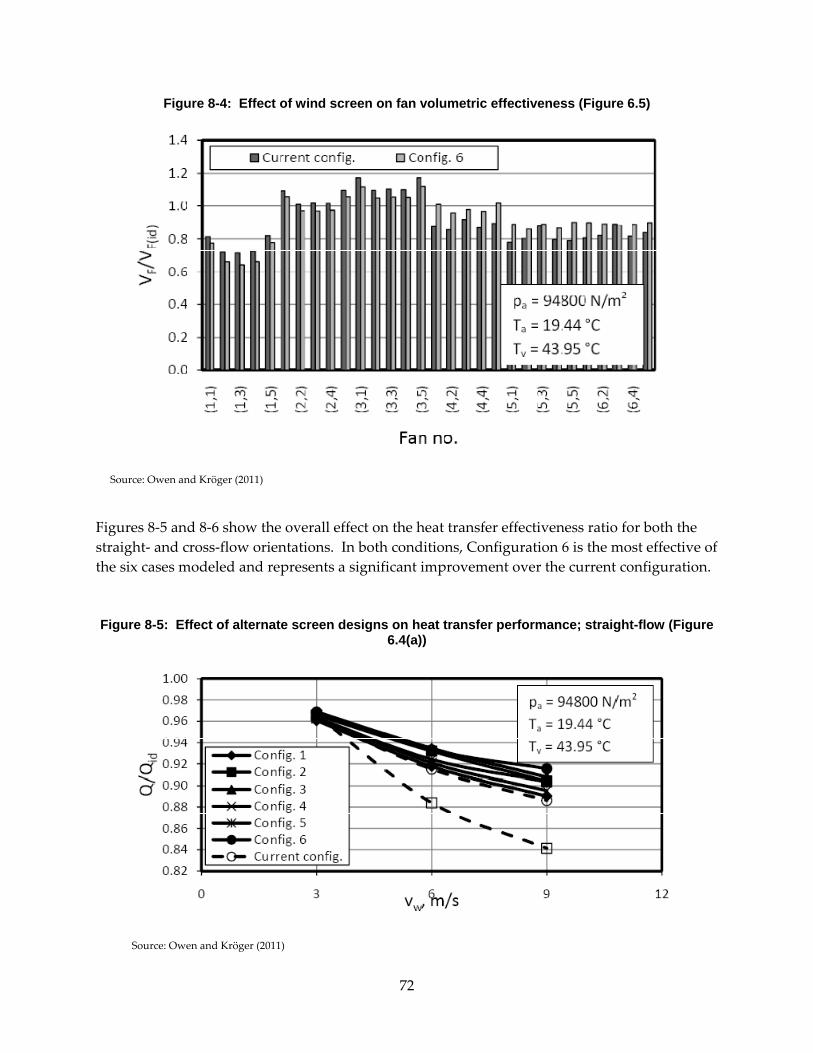
Figure 8‐4: Effect of wind screen on fan volumetric effectiveness (Figure 6.5) .............................. 72
Figure 8‐5: Effect of alternate screen designs on heat transfer performance; straight‐flow (Figure 6.4(a)) ......................................................................................................................................................... 72
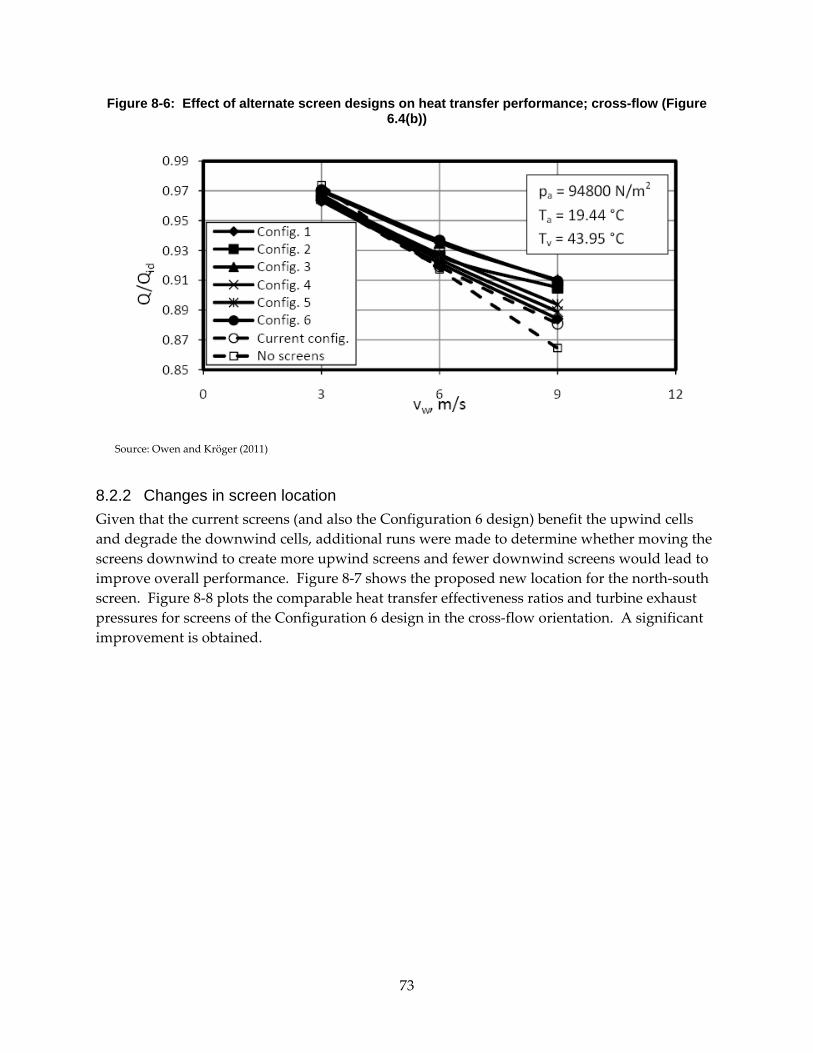
Figure 8‐6: Effect of alternate screen designs on heat transfer performance; cross‐flow (Figure 6.4(b)) ......................................................................................................................................................... 73
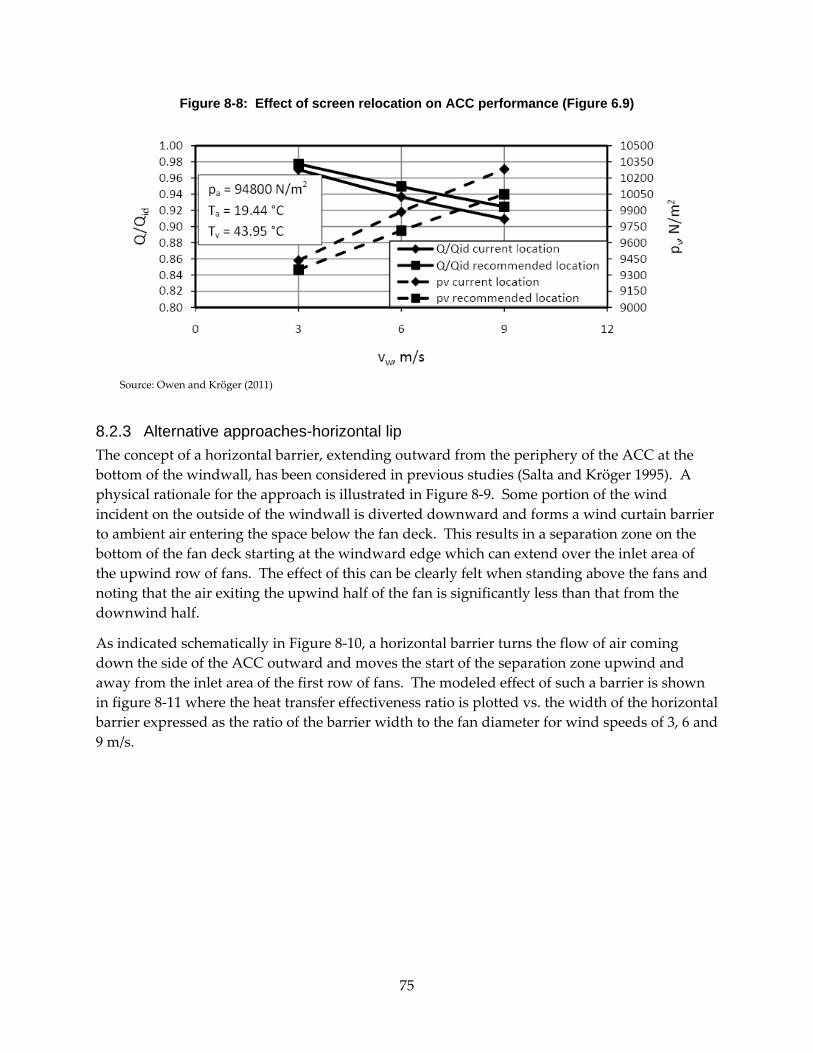
Figure 8‐8: Effect of screen relocation on ACC performance (Figure 6.9) ....................................... 75
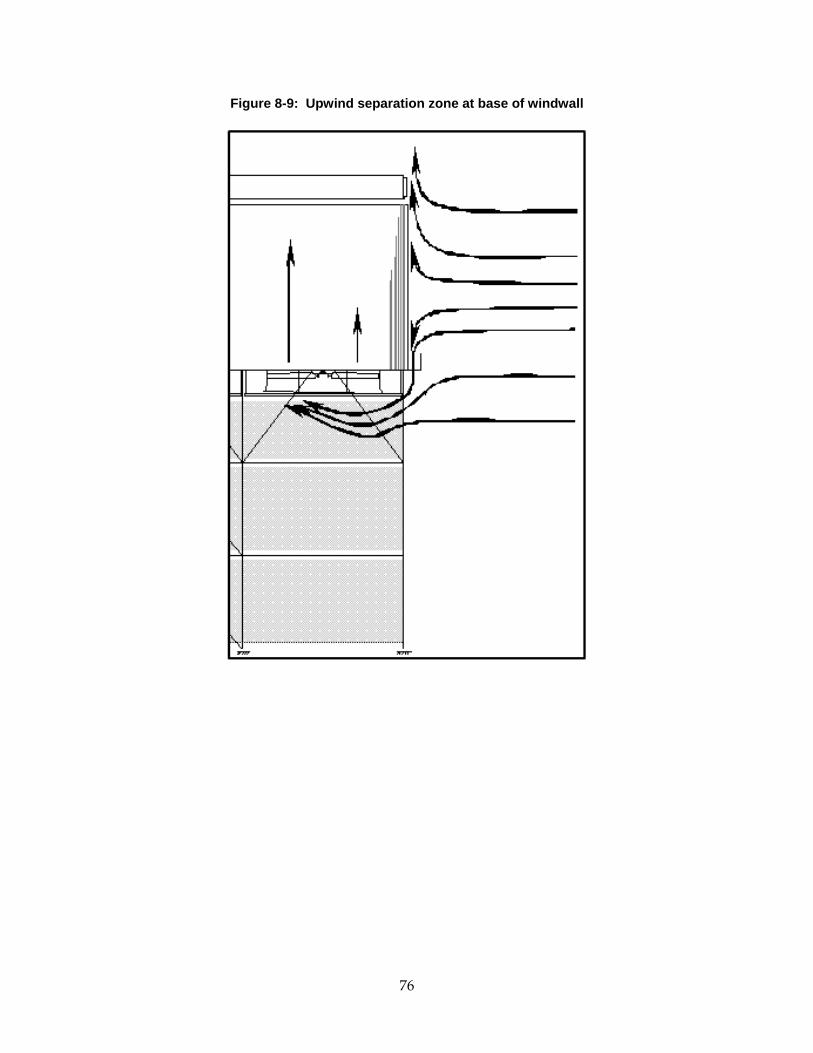
Figure 8‐9: Upwind separation zone at base of windwall ................................................................. 76
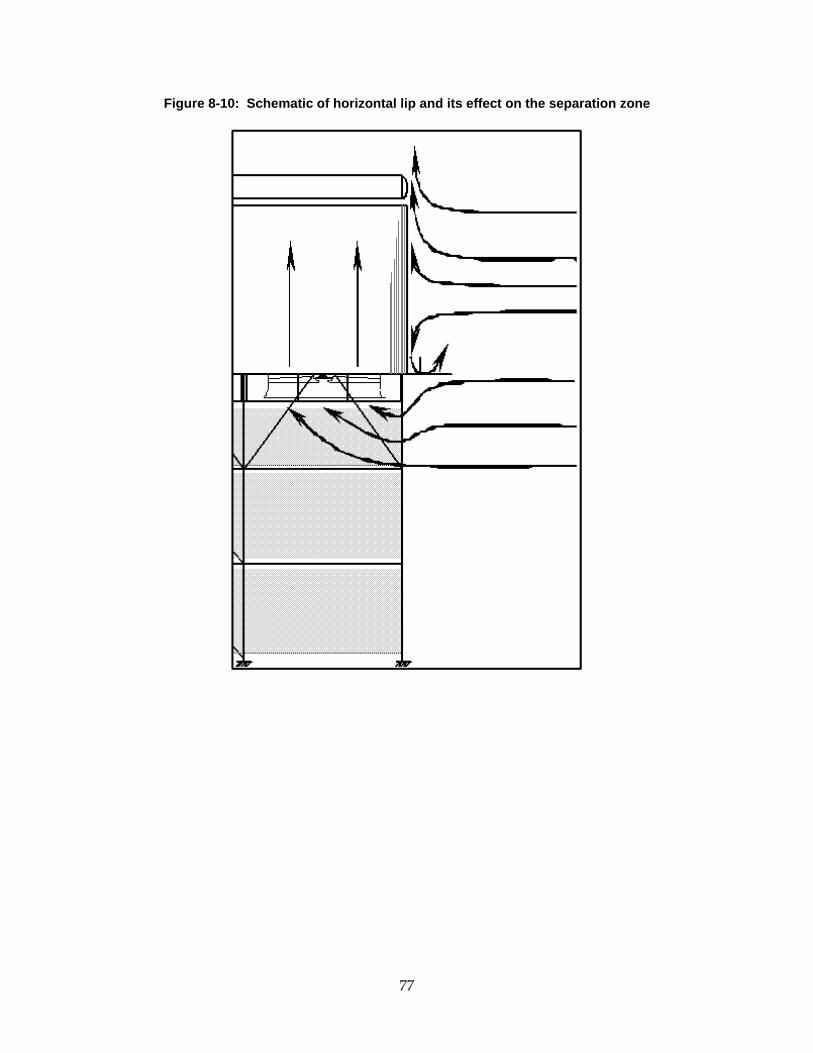
Figure 8‐10: Schematic of horizontal lip and its effect on the separation zone .............................. 77
Figure 8‐11: Effect of horizontal barrier on ACC performance ........................................................ 78
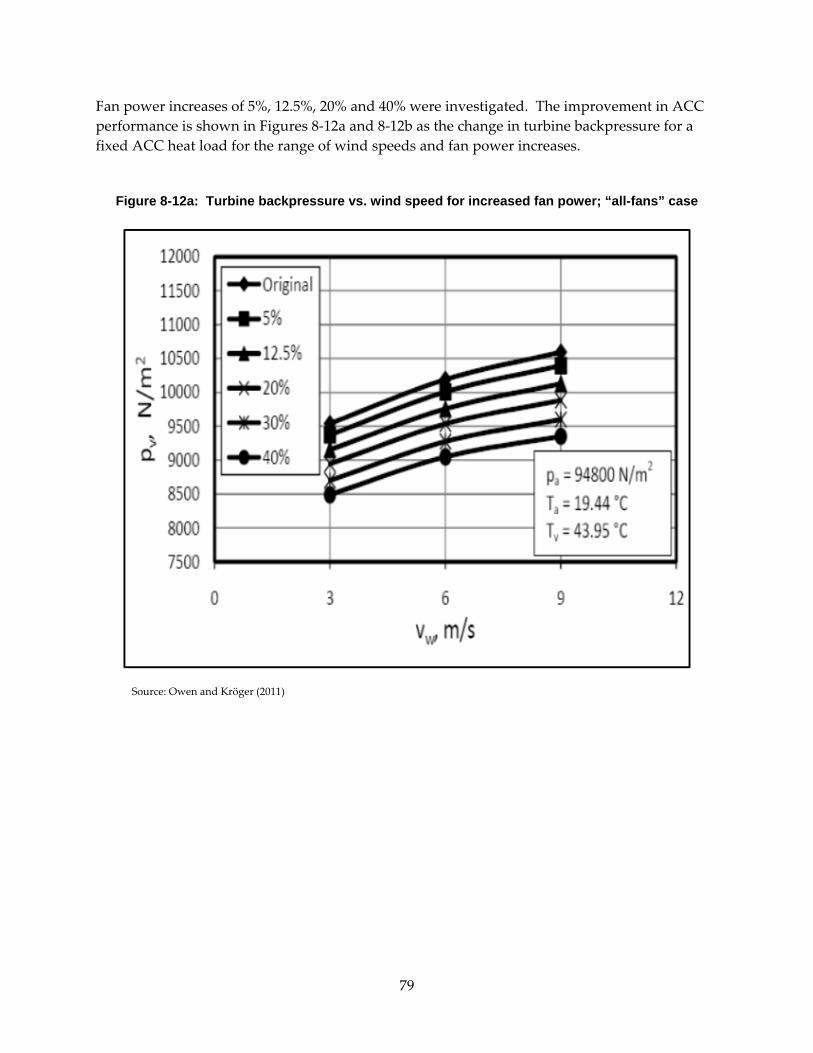
Figure 8‐12a: Turbine backpressure vs. wind speed for increased fan power; “all‐fans” case .... 79
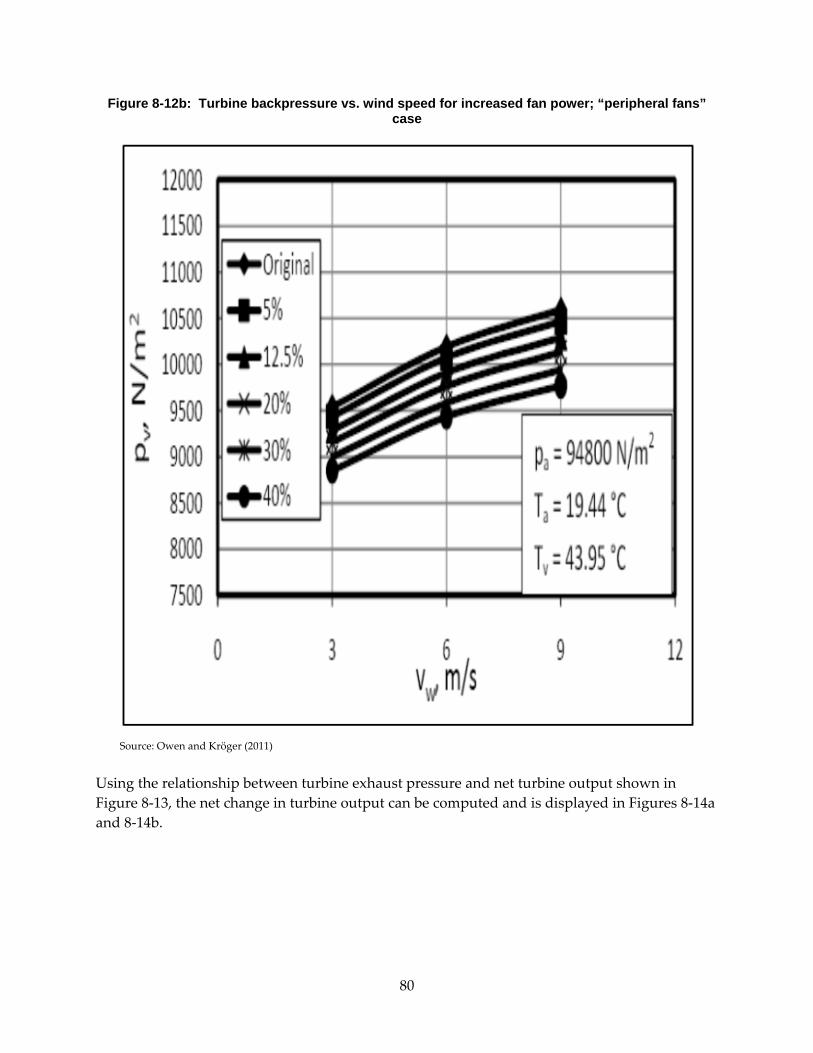
Figure 8‐12b: Turbine backpressure vs. wind speed for increased fan power; “peripheral fans” case ............................................................................................................................................................. 80
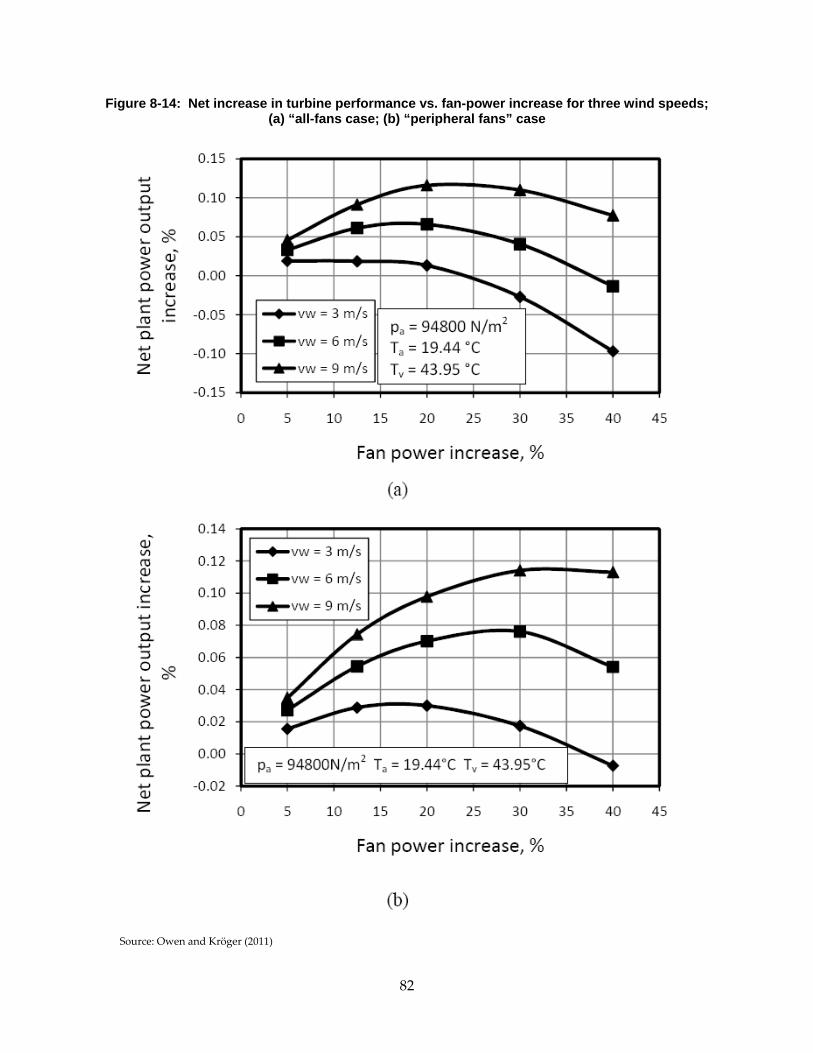
Figure 8‐14: Net increase in turbine performance vs. fan‐power increase for three wind speeds; (a) “all‐fans case; (b) “peripheral fans” case ......................................................................................... 82
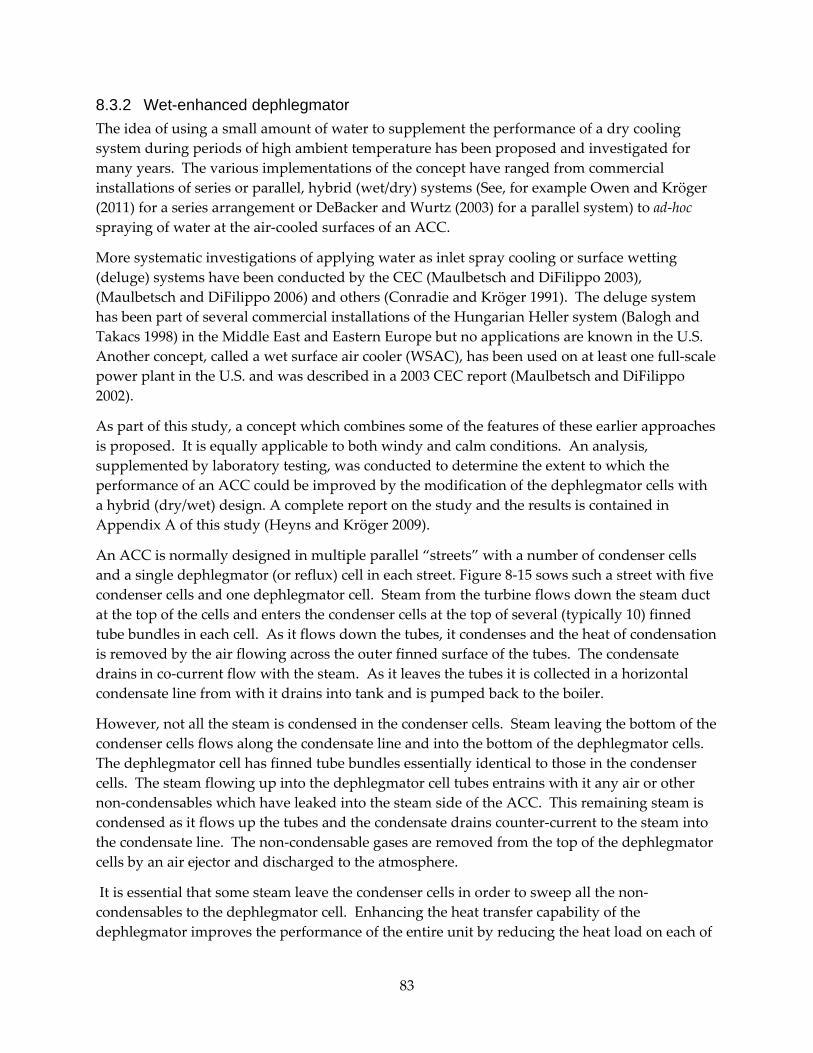
Figure 8‐15: Schematic of an ACC street .............................................................................................. 85
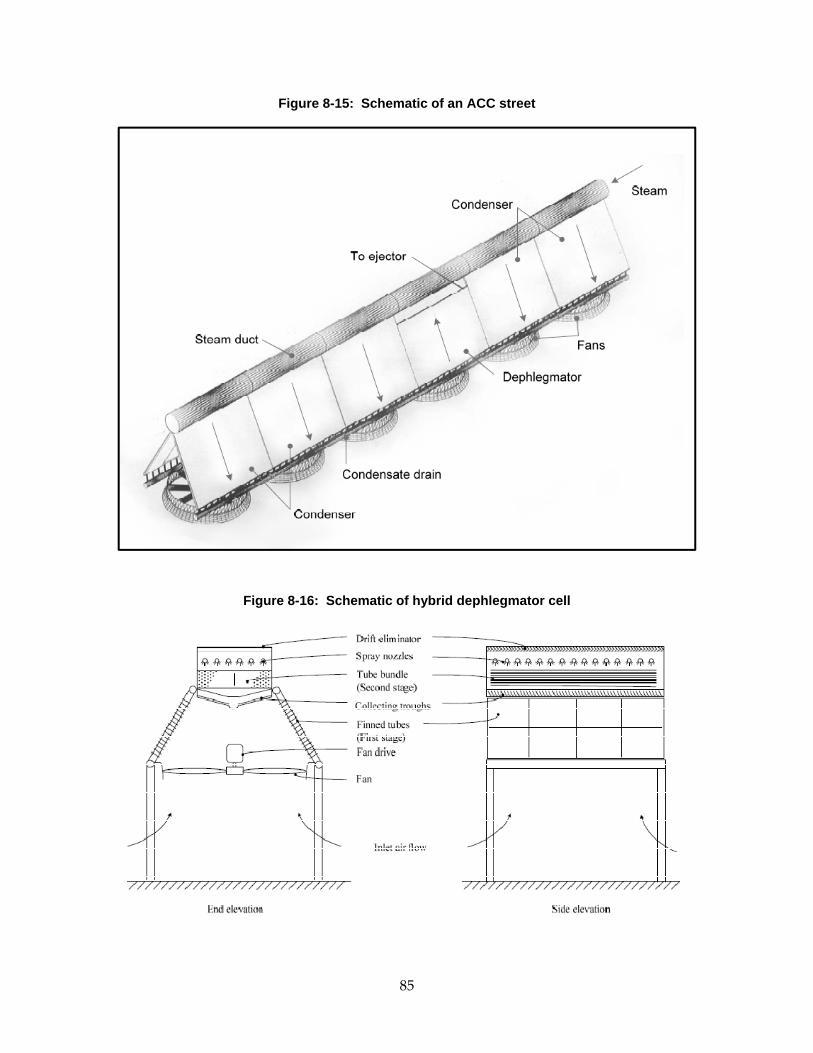
Figure 8‐16: Schematic of hybrid dephlegmator cell ......................................................................... 85
Figure 8‐17: Schematic of hybrid dephlegmator cell’s second stage ............................................... 86
x
Figure 8‐18: Turbine power output vs. condensing temperature .................................................... 87
Figure 8‐19: Performance comparisons among ACC’s of different size ......................................... 88
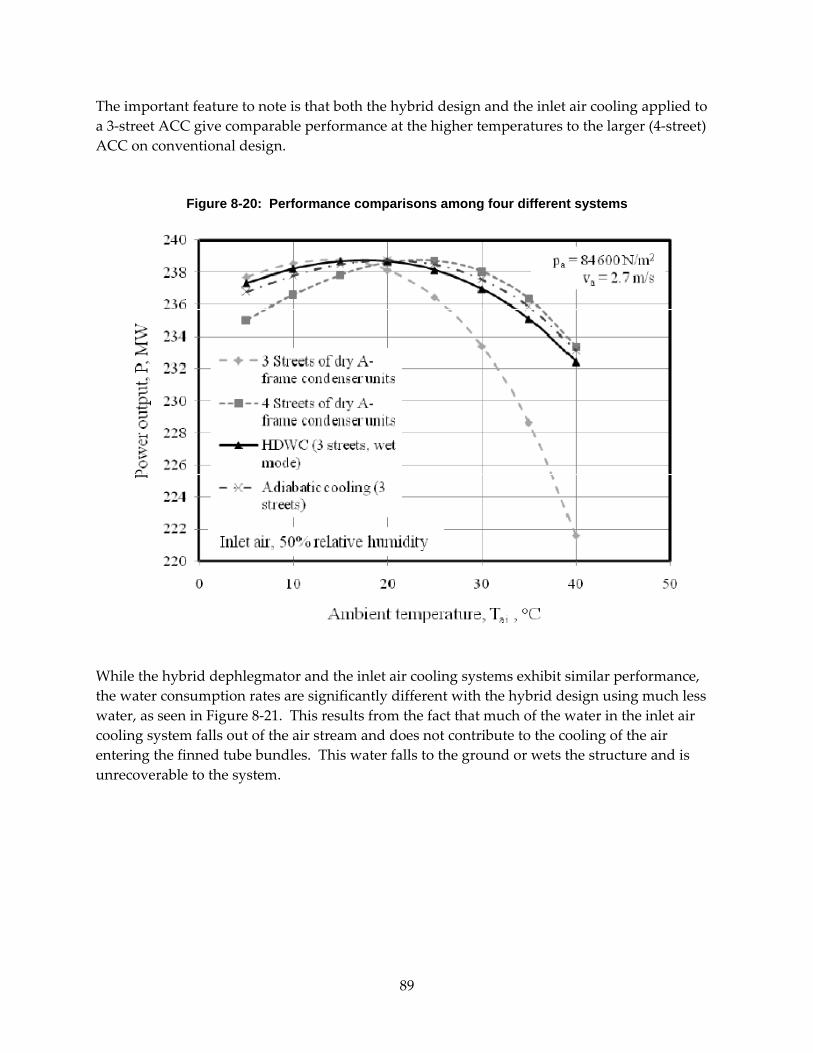
Figure 8‐20: Performance comparisons among four different systems ........................................... 89
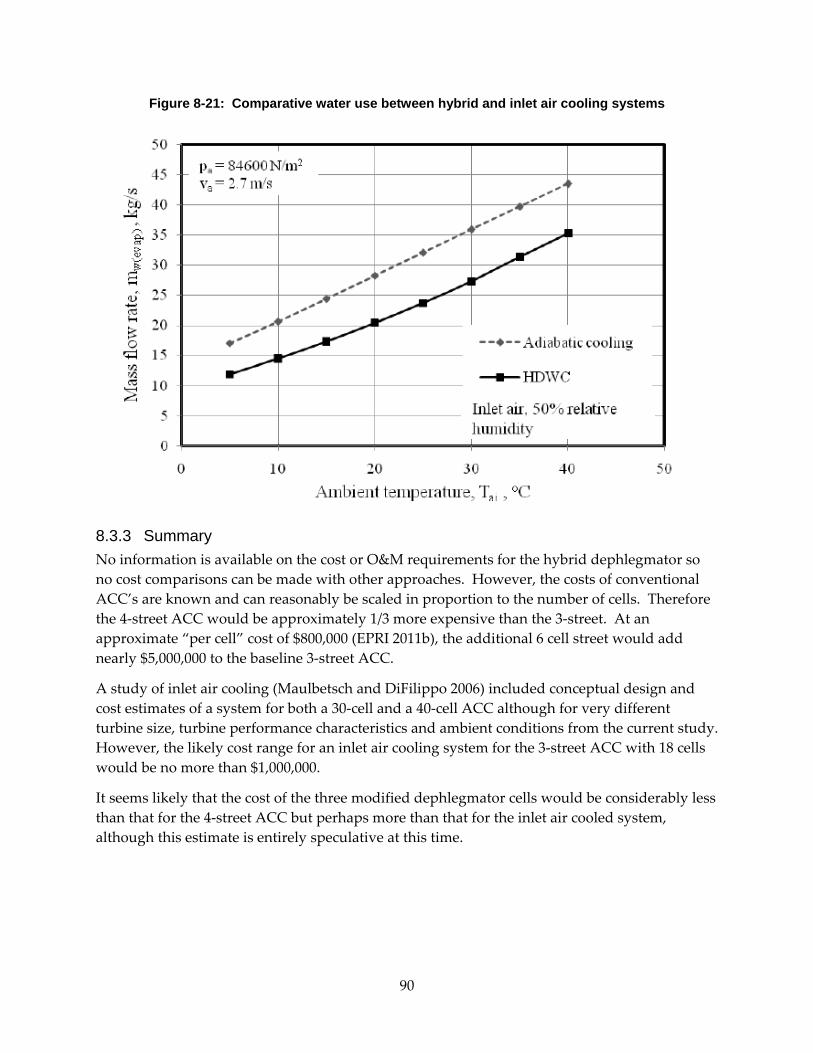
Figure 8‐21: Comparative water use between hybrid and inlet air cooling systems .................... 90
LIST OF TABLES
Table 2‐1: El DoradoEnergyCenter Site Information ......................................................................... 14
Table 2‐2: El Dorado ACC Information ............................................................................................... 15
Table 2‐3: El Dorado ACC Design Operating Point ........................................................................... 15
Table 3‐1: Plant data on site ambient conditions. Wind direction convention is 0° (or 360°) denotes wind from the north. ................................................................................................................. 33
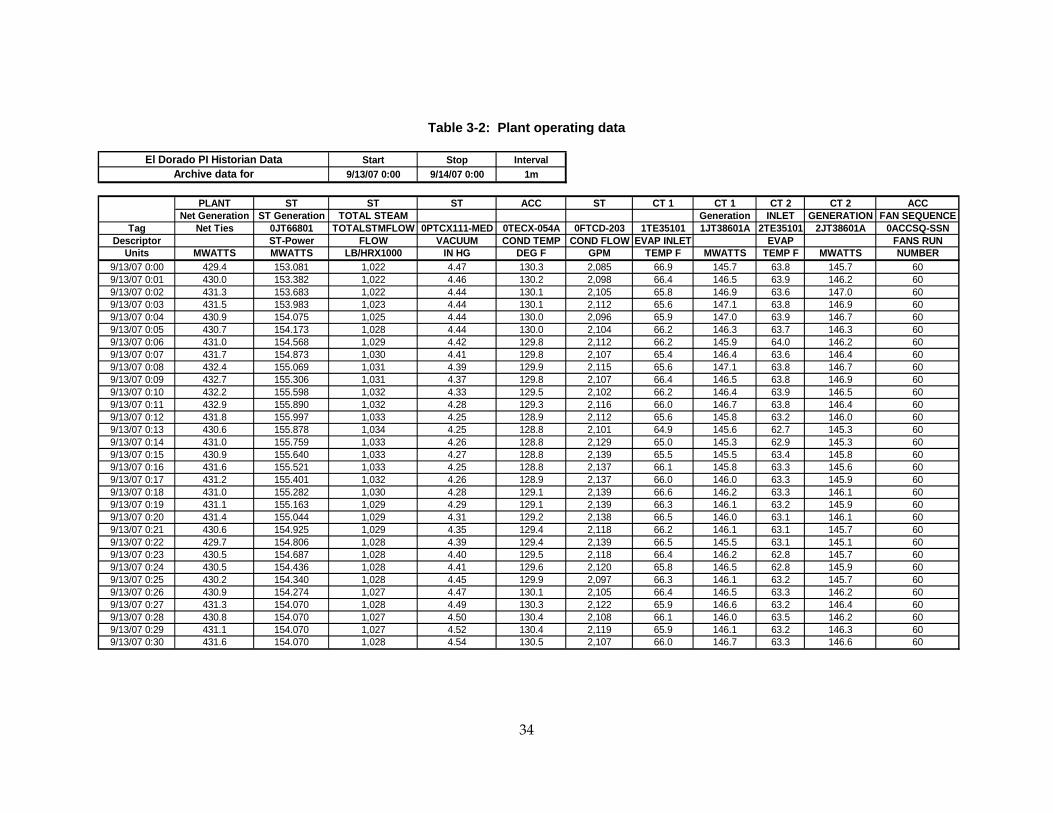
Table 3‐2: Plant operating data ............................................................................................................. 34
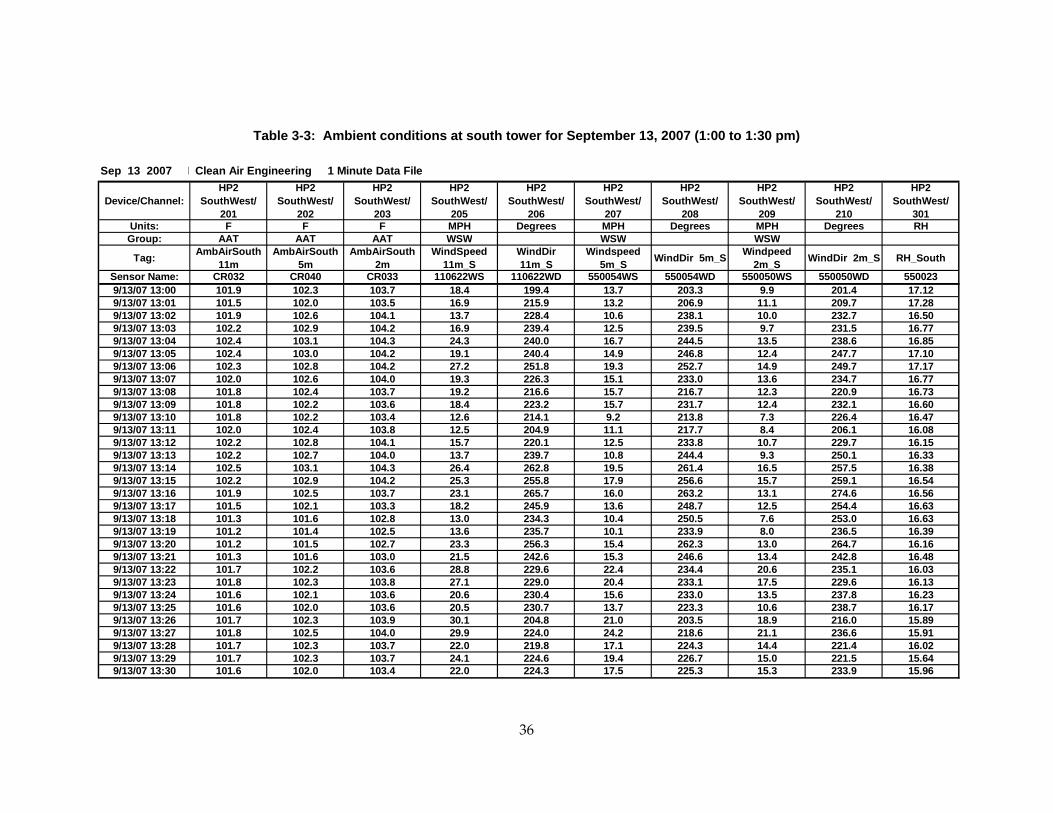
Table 3‐3: Ambient conditions at south tower for September 13, 2007 (1:00 to 1:30 pm) ............. 36
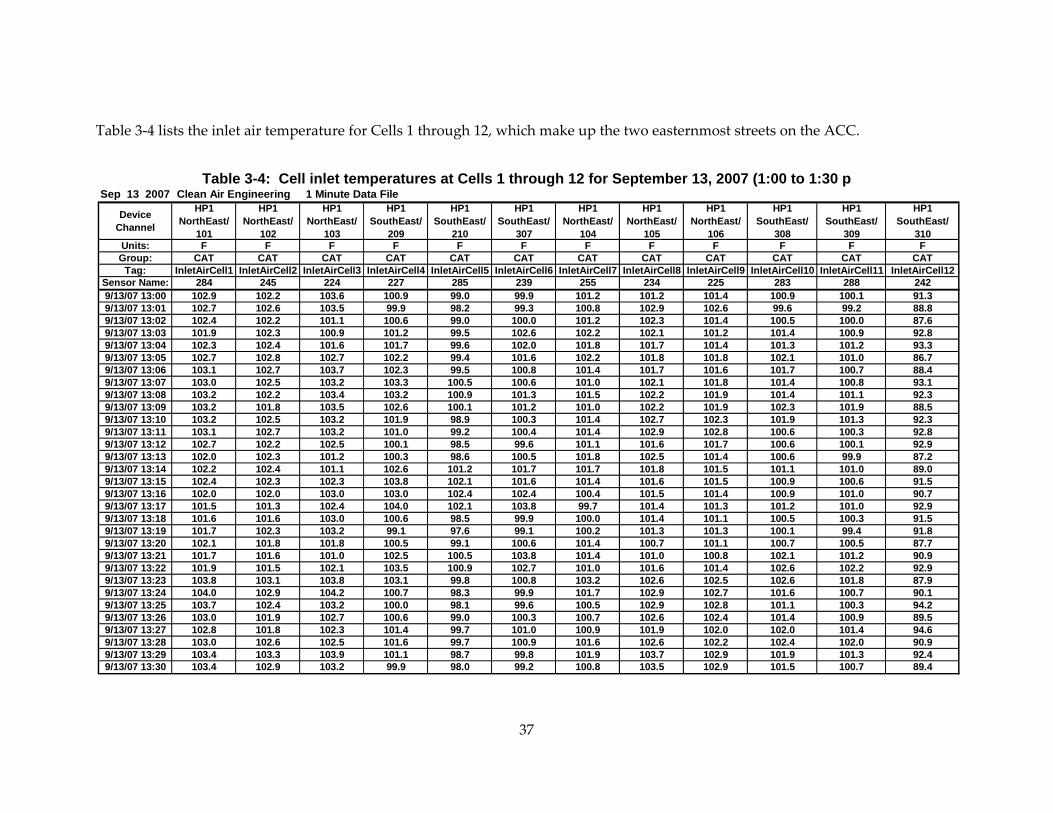
Table 3‐4: Cell inlet temperatures at Cells 1 through 12 for September 13, 2007 (1:00 to 1:30 p .. 37
Table 3‐5: Inlet air velocities on Cell 15 for September 13, 2007 (1:00 to 1:30 pm) ........................... 1
Table 3‐6: Cell 18 air exit temperatures for September 13, 2007 (1:00 to 1:30 pm) ............................ 2
Table 3‐7: Northeast corner inlet air temperatures for September 13, 2007 (1:00 to 1:30 pm) ........ 3
Table 3‐8: South face air velocity and direction for September 13, 2007 (1:00 to 1:30 pm) .............. 4
Table 3‐9: Cell 18 and south catwalk static pressure data for September 13, 2007 (1:00 to 1:30 pm) ...................................................................................................................................................................... 5
Table 7‐1: Model results for backpressure vs. ambient temperature for different wind speeds . 59
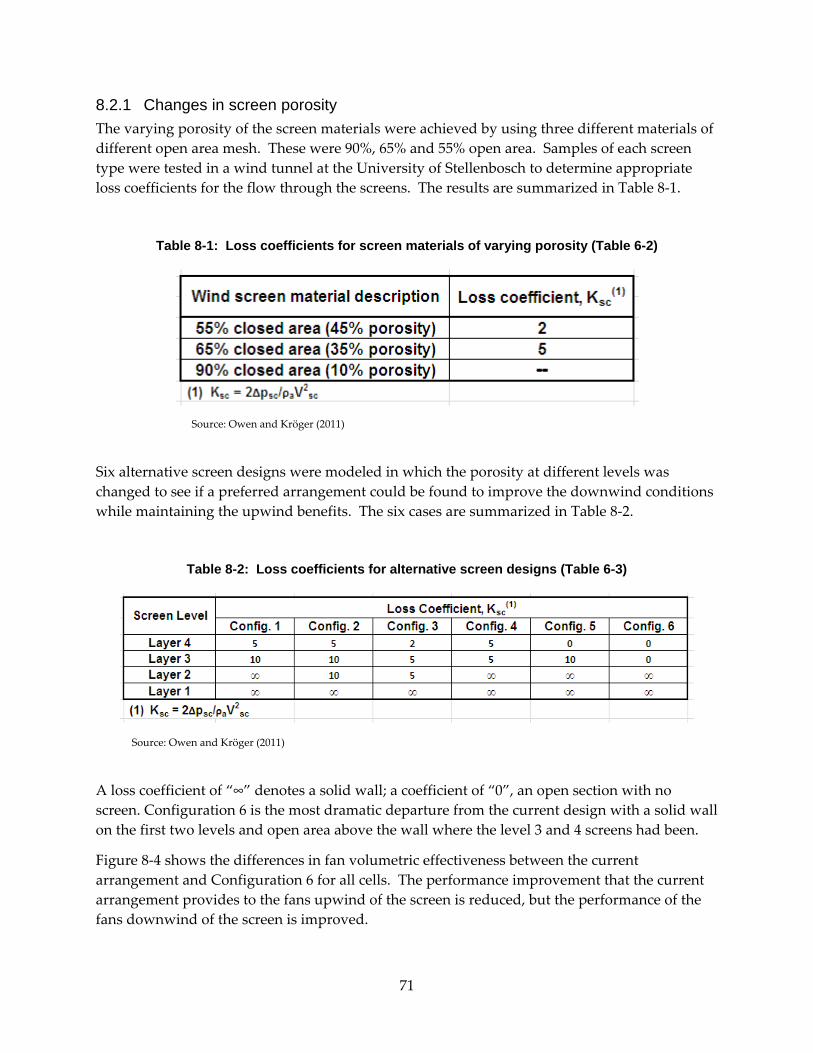
Table 8‐1: Loss coefficients for screen materials of varying porosity (Table 6‐2) .......................... 71
Table 8‐2: Loss coefficients for alternative screen designs (Table 6‐3) ............................................ 71
1
EXECUTIVE SUMMARY
This report documents the conduct of and the results, conclusions, and recommendations from a study of the effect of wind on the performance of a large air‐cooled condenser at a power plant in the Western United States. The study consisted of both field testing and computer modeling using advanced computational fluid dynamics methods. Computational fluid dynamics refers to the use of numerical models to analyze the flow of fluids.
Motivation and Background Thermal electric power plants make steam to turn the turbines. That steam must then be cooled before it is heated again. Although wet cooling is still by far the most common system in use for power plant cooling, dry‐cooling systems with mechanical‐draft air‐cooled condensers are being selected with increasing frequency both in the United States and around the world. In addition, hybrid systems, consisting of parallel dry‐ and wet‐cooling components, are expected to become more common. The air‐cooled condenser is a major component of these systems. As the use of air‐cooled condensers in both all‐dry and hybrid systems becomes more widespread, the importance of ensuring adequate, predictable cooling performance becomes more critical to the efficient operation of the power plant and eventually to the network.
It is well understood that air‐cooled systems impose limitations on plant efficiency and output, particularly during the hottest hours of the year, which is precisely the time at which power demand is at its peak. This effect is exacerbated if winds, occurring simultaneously with high temperatures, further degrade the performance of the air‐cooled condenser and do so unpredictably. In a recent publication Air‐Cooled Condenser (ACC) Design, Specification and Operation Guidelines by the Electric Power Research Institute, the issue of the effect of wind on the performance of air‐cooled condensers is introduced on the very first page as:
“The impact of ambient wind on air‐cooled condenser performance is not well understood by owner/operators or their representatives in the specification and bid/evaluation process.”
And:
“This area of wind effects in total represents the major challenge associated with ACC specification, design, and performance.”
This study is a follow‐up effort to one conducted for the Energy Commission in 2005 in which field tests measuring the effects of wind on air‐cooled condensers and plant performance were carried out at five different plants in the western United States. The results of that study were presented and discussed in detail in an Energy Commission publication titled Effect of Wind Speed and Direction on the Performance of Air‐Cooled Condensers which can be found as Appendix B to this report. Although this earlier study provided a general understanding of wind degradation of air‐cooled condenser performance and of the magnitude of this reduction, the results were difficult to generalize to other sites. To develop more confident quantitative relationships between ambient wind conditions and air‐cooled condenser performance, that
2
study made specific recommendations for additional field and laboratory testing and analysis. This study is designed to address these recommendations.
Objective The study sought to develop an improved understanding of how, and to what degree, wind degrades the performance of a large air‐cooled condenser at an operating power plant. Field testing and computational fluid dynamics analysis were combined in an integrated study to develop methods for the design and selection of air‐cooled condensers with adequate and predictable performance under windy conditions. In addition, options were explored to mitigate the effect of winds on air‐cooled condensers performance and to further enhance it.
Specifically, the field tests were designed to obtain:
• Independent measurements, in addition to existing plant measurements, of ambient conditions of temperature, wind speed and wind direction at two locations well upwind of the air‐cooled condensers and at varying heights above grade.
• More complete measurements of inlet air velocities in critically located cells.
• Additional measurements of both vertical and horizontal air velocities at the perimeter of the air‐cooled condensers near the bottom of the wind wall.
• Inlet temperature profiles with height at a location likely to be subject to frequent recirculation.
The objective of the field tests was to gather more detailed data than were obtained in the previous study to use in a comprehensive computational fluid dynamics modeling study to be conducted at the University of Stellenbosch. The development and use of an analytical computational fluid dynamics model of the air‐cooled condensers at an operating power plant were important elements of the study. The modeling work was designed to create a mutually beneficial interaction between the field testing and the modeling.
Scope and Approach The field testing was conducted on the 30‐cell air‐cooled condensers at the El Dorado Energy Center located approximately 35 miles south and slightly east of Las Vegas, Nevada.
Instrumentation was installed on and around the air‐cooled condensers to make measurements to:
• Characterize the ambient atmospheric temperature and wind conditions at the site.
• Measure the air temperature at the inlet to each of the air‐cooled condensers cells and at other selected locations under and on the perimeter of the air‐cooled condenser.
• Measure the inlet velocity at selected cells.
• Determine the wind patterns at selected locations under and on the perimeter of the air‐cooled condenser.
3
• Measure the static pressure distribution at selected cells.
In addition, plant data were obtained to permit an estimate of the effect of air‐cooled condenser performance, as influenced by the wind, on the steam turbine exhaust pressure and gross output.
The modeling work consisted of several steps:
• Collection of site, plant, and air‐cooled condenser data
• Model formulation
• Model sensitivity testing
• Comparison with previous models
• Generation of model results for El Dorado Energy Center
o Recirculation
o Air flow
o Effect on backpressure and plant output
• Comparison of plant and field measurements
• Exploration of mitigation/enhancement measures.
Results Field Tests Instrumentation and data acquisition equipment were installed. Ambient conditions, air‐cooled condenser operating conditions, and related air‐cooled condenser and plant performance were monitored continuously for 19 days. During that time, data were recorded at one‐minute intervals.
Plant instrumentation provided the following data:
• Site conditions
o Ambient temperature (at the administration building and under the air‐cooled condenser)
o Wind speed and direction (at the administration building)
• Operating variables
o Plant output
o Steam turbine output
o Steam flow to air‐cooled condenser
o Condensate flow from the air‐cooled condensers
4
o Turbine exhaust pressure and condensing temperature
o Inlet evaporator temperature and turbine output (for each gas turbine)
o Fan operating status
Ambient conditions varied from high wind to calm with winds from all different directions, from high to moderate temperature, and from stable atmospheric profiles to atmospheric inversions. Effects of ambient conditions on temperature and air flow patterns around and under the air‐cooled condenser were monitored. These data were interpreted to determine the amount of hot air recirculation and fan performance degradation and their dependence on ambient temperature and wind patterns.
Computational Modeling The computational fluid dynamic model, FLUENT, was used to assess temperature and air flows in the air‐cooled condenser under different ambient condition. The model replicated the dimensions and configuration of the El Dorado air‐cooled condenser. The modeling results were in excellent agreement with field measurements of four test points for turbine exhaust pressure; the agreement was within less than 0.1 in Hga (inches of mercury, a unit of measure for pressure). Overall degradation of air‐cooled condenser performance with wind speed was also in excellent agreement with field test results. However, the relative contribution of recirculation and fan performance degradation differed from the field results. Specifically, the variation in recirculation with wind speed showed a consistent increase with wind speed in the model results. In contrast, the field measurements indicated that recirculation increased up to moderate wind speeds (approximately 15 mph) but then decreased at higher wind speeds.
Conclusions Conclusions of this study are summarized as follows:
• The predominant effect of wind on air‐cooled condenser performance is to degrade fan performance coupled with a lesser effect of hot air recirculation.
o Recirculation typically caused the average inlet temperature to exceed the ambient temperature by no more than 3 to 6 °F at wind speeds from 7 to 15 mph falling off to approximately 2°F at the higher wind speeds.
o Cross‐flows over the fan inlet planes resulted in flow reductions of as much as 30 percent to 60 percent.
o Together these effects could cause the turbine exhaust pressure to be 2 to 2.5 in Hga above the level expected from air‐cooled condenser performance curves for the same steam flow and ambient temperature.
• Uncertainty remains over the variation in recirculation with wind speed. Field measurements show a maximum recirculation at intermediate wind speeds followed by a decrease at higher speeds. Computational fluid dynamic modeling results show a consistent increase with no intermediate maximum.
5
• The computational fluid dynamics model predicts a reduction in air‐cooled condenser effectiveness of up to 12 percent for wind speeds up to 9 m/s (21 mph). The predicted increase in turbine exhaust pressure of up to 2.5 in Hga for winds of 20 mph at ambient temperatures of 100°F is in good agreement with field test and plant records.
• The agreement between predicted and measured cell inlet temperature and airflow patterns is satisfactory.
• Wind screens of the type and arrangement of those at the El Dorado Energy Center improve the air‐cooled condenser performance consistent with historical plant observations.
• The performance of cells upwind of the screens is improved while that of cells downwind of the screens is slightly degraded.
• Increasing fan power is not found to be an effective approach to offset the effect of wind.
• Four approaches to mitigating wind effects were analyzed:
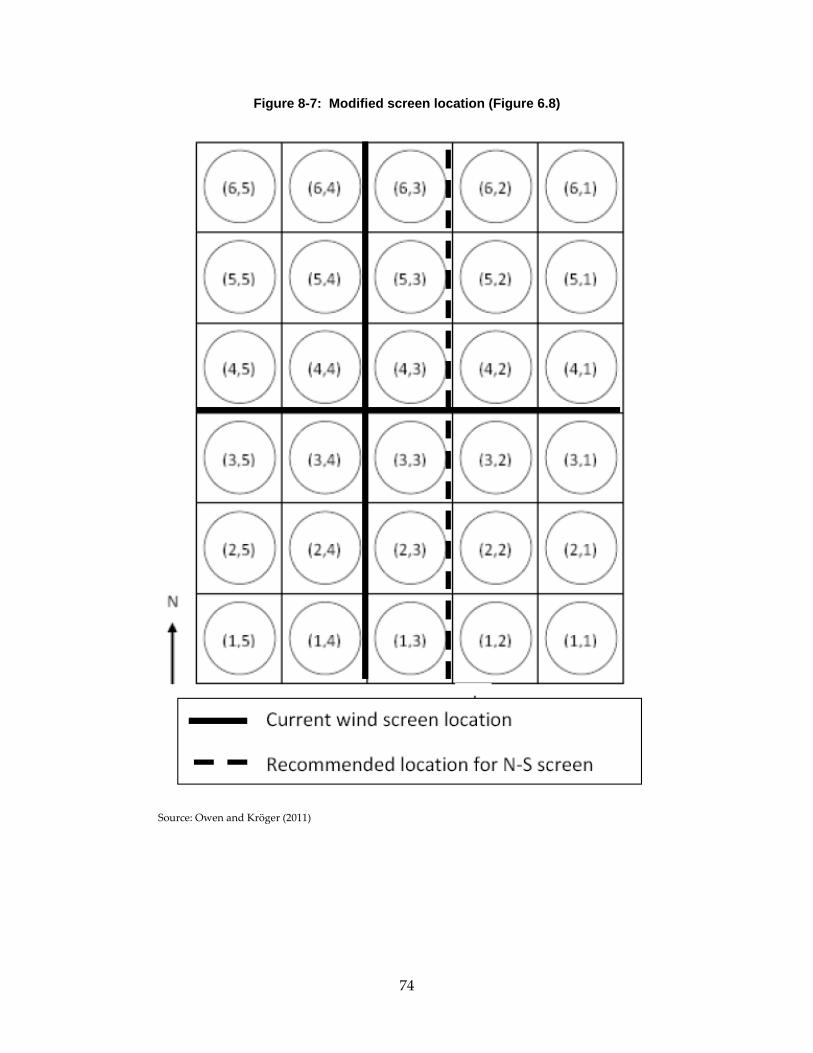
o Relocating the north/south screen one street downwind from its present position is predicted to further improve overall air‐cooled condenser performance.
o A proposed new screen design with a solid wall for the lower half of the screen and open area on the top half is predicted to improve performance over the existing design.
o A horizontal lip around the air‐cooled condenser at the fan deck level of a width equal to ⅓ of the fan diameter is predicted to improve performance significantly over the entire range of wind speeds.
o A hybrid (dry/wet) dephlegmator). A dephlegmator is the portion of the air‐cooled condenser designed to remove non‐condensable gases from the condenser. The modified hybrid dephlegmator consists of two stages: The first is an air‐cooled condenser with finned tubes and the second a bundle of galvanized steel tubes arranged horizontally. The second stage can either be operated as a dry air‐cooled condenser or the tubes can be deluged with water and operated as an evaporative condenser. Augmenting an air‐cooled condenser with such a deluged set of tubes provides significant overall improvement and allows a small condenser to have equal performance of a larger one of conventional design. A detailed discussion of this technology is found in Appendix Ba
Recommendations • Additional field or wind tunnel testing should be pursued to resolve the difference
with computational fluid dynamics modeling results on the variation in recirculation with wind speed.
6
• Further analytical and test work on the effect of alternate windscreen configurations should be conducted with guidance from computational fluid dynamics modeling analysis.
• In light of reports of fan blade damage and failure on air‐cooled condensers in windy environments, more thorough analysis of the air patterns, fan inlet velocities, and static pressure differences across the fans and the effect of possible protective measures such as shroud or windscreen design should be undertaken.
Benefits to California Because of concerns about energy generation effects on California’s limited freshwater supplies, power plant cooling systems are increasingly using air‐cooled condensers. These condensers, which reject heat directly to the atmosphere, can reduce water demand by up to 95 percent, but not without cost and performance penalties. This study advanced the knowledge of wind effects on air‐cooled condenser performance and the ability to mitigate those effects. California will benefit from this research because it promotes wider use of this water‐conserving cooling technology. In turn, this technology offers greater flexibility to build new power plants to meet growing demand and to site the new units closer to population centers.
7
CHAPTER 1: Introduction This report documents the conduct of and the results from a study of the effects of wind on the performance of air‐cooled condensers (ACCs) of the size used at electric power plants. The study consisted of both field measurements and computational fluid dynamics (CFD) modeling, a comparison of the field test and model results and a discussion of possible approaches to the mitigation of wind effects. The field tests were conducted on the ACC at the El Dorado Energy Center south of Las Vegas, Nevada. The CFD model was developed to simulate the design and wind conditions at El Dorado.
1.1 Background Dry cooling systems for power plant cooling are more commonly selected as the water conservation becomes a more important concern in the U.S. and around the world. As the use of dry cooling increases, the importance of ensuring adequate, predictable cooling performance becomes more critical to the efficient operation of the plant and eventually to the network.
Furthermore, it is well understood that air‐cooled systems impose limitations on plant efficiency and output, particularly during the hottest hours of the year, which is precisely the time at which power demand is at its peak. This effect is exacerbated if winds, occurring concurrently with high temperatures, further degrade the performance of the ACC and do so in an unexpected and unpredictable manner. Therefore, a clear understanding of the mechanisms by which wind affects the performance of ACCs is required, and approaches to mitigate these effects are needed. The work undertaken in this study is intended to advance that understanding and assist in developing those approaches.
1.2 Importance of wind effects ACC designs and their guaranteed performance are based on the assumption of minimal interference from ambient wind. The several test codes (VGB 1997; ASME 2007; CTI 2006) which specify the conditions and procedures for the performance of the “acceptance tests” which are conducted to ensure that a unit will deliver the guaranteed performance, all stipulate that the test must be done at average wind speeds below 3 to 5 meters per second (6.5 to 11 miles per hour).
The effect of wind on the performance of one ACC is illustrated in Figure 1‐1. The turbine exhaust pressure is plotted as a function of ambient air temperature at nearly constant heat load. The data points are grouped by ambient wind speed. While considerable overlap exists, turbine exhaust pressures measured during periods of high (>20 mph) winds generally are 1.5 to 2 “Hga (inches of mercury, absolute) higher that those measured during periods of no or light (< 4 mph) wind. At the higher (>100 °F) ambient air temperatures, this can elevate the turbine exhaust pressure to levels approaching the “alarm” or “trip” points (approximately 7 “Hga and 8 “Hga respectively) where plant load must be curtailed to maintain safe operation of the steam turbine.
8
Additionally, the wind speeds shown in Figure 1‐1 are one hour average values and not instantaneous. Wind gusts, if they occur when the ACC is operating near the trip point of the turbine, can cause a brief excursion to pressures high enough to trip the turbine so rapidly that the operators cannot respond in time to keep the plant from coming off‐line. A sudden trip, from which it may take several hours to recover, can have a significant effect on plant revenue if it should occur at a time when the plant is at full load, the network demand is at its peak and the price for power is high.
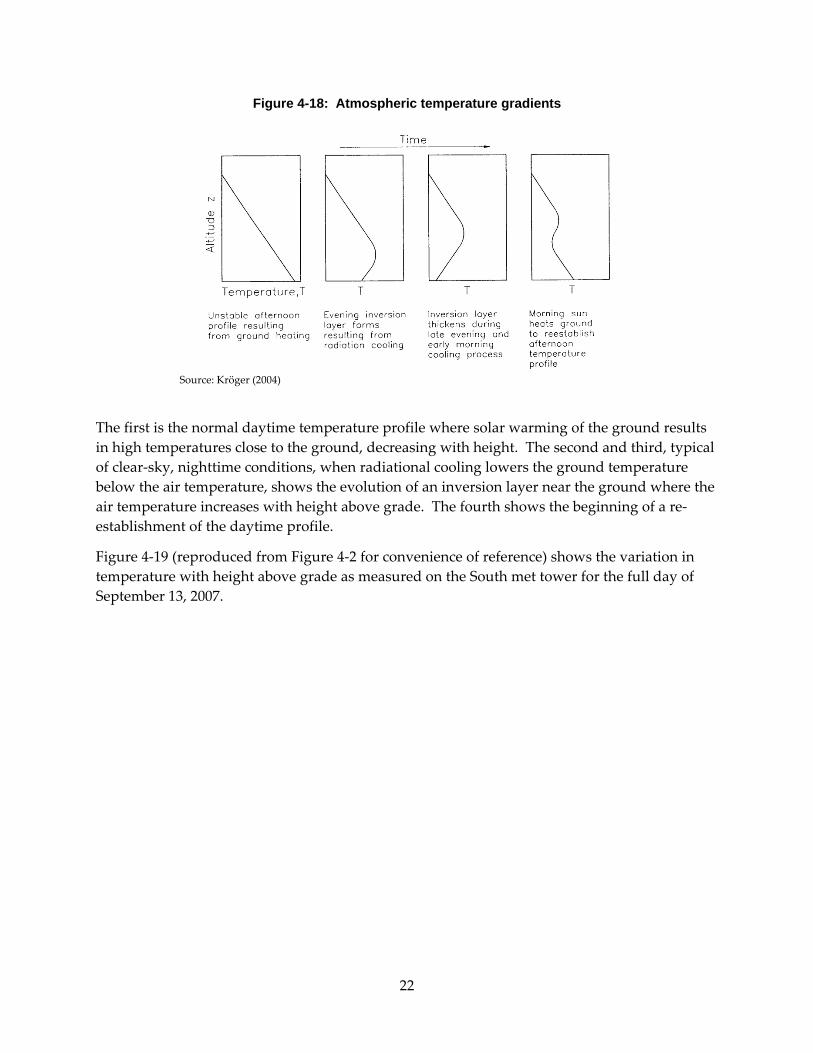
Figure 1-1: Effect of Wind on ACC Performance
In a recent publication of Air‐Cooled Condenser Design, Specification and Operation Guidelines by the Electric Power Research Institute (2005), the issue of the effect of wind on ACC performance is introduced on the first page as:
“The impact of ambient wind on ACC performance is not well understood by owner/operators or their representatives in the specification and bid/evaluation process.”
And:
9
“This area of wind effects in total represents the major challenge associated with ACC specification, design, and performance.”
1.3 Mechanisms of wind effect The mechanisms causing the effect of wind on ACC performance will be discussed in detail throughout the report. However, it is noted here by way of introduction that the two commonly accepted mechanisms are hot air recirculation and degraded fan performance.
Recirculation occurs when the plume of heated air exiting the ACC, which normally rises vertically above the unit under quiescent conditions, is bent over by the wind to the point where a portion of it is entrained by the inlet air stream entering around the sides of the ACC below the fan deck. This results in the cooling air entering the condensing tube bundles being at a higher temperature than the far‐field ambient air temperature. Recirculation usually has the greatest effect on the downwind cells.
Degraded fan performance occurs when wind passing underneath the fan deck distorts the inlet velocity field to the fans. ACC fans are typically large, low speed fans with relatively low static pressure rise and are particularly susceptible to inlet losses. The effect, usually occurring on the upwind fans, can range from a modest decrease in inlet air flow to causing a stall condition on all or a portion of the fan blades with a very large reduction in air flow.
It is generally believed that the effect on fan performance is the more important of the two effects. However, this can vary with the details of the site topography, the presence of nearby obstructions, ACC orientation relative to the prevailing winds and any other factors influencing wind speed, direction, turbulence and gustiness at the ACC inlet.
1.4 Earlier wind effect studies The adverse effects of wind on the performance of large ACC’s have been recognized for many years. (See, for example, Kröger 1998).
A series of field tests, similar to the current study, were conducted by the California Energy Commission in 2005 at five power plants including El Dorado. The results are documented in a CEC report by Maulbetsch and DiFilippo (2010, Appendix B). A few of the important conclusions from that study are reproduced here for convenience of reference.
The results of the field tests led to the following conclusions:
• Recirculation is always present to some degree.
• The typical average recirculation of less than 3ºF is not sufficient to account for the overall reduction in ACC performance as inferred from the increase in turbine exhaust pressure at high wind conditions.
• The major mechanism accounting for the observed effect of wind on ACC performance appears to be a reduction in air flow through the ACC resulting from fan performance being degraded by wind.
10
• Precise correlation of wind conditions and measured ACC conditions with turbine backpressure are difficult to establish, due in part to the confounding effects of plant control actions which occur concurrently with variations in ambient wind conditions.
The report concluded with a set of recommendations for additional work deemed necessary to develop more confident quantitative relationships between ambient wind conditions and ACC performance. Specifically:
• Closely coordinated field tests and CFD modeling at a single well‐described and completely instrumented operating ACC,
• More detailed measurements of both far‐ and near‐field velocity and temperature fields,
• More extensive measurements of inlet velocity and static pressure on a greater number of cells,
• More precise and extensive measurements of static pressure underneath the ACC,
• More careful attention to pressure and velocity fields close to wind barriers under the ACC,
• More detailed and precise inclusion of plant operation and control actions into the interpretation of the data in order to normalize the simple ACC performance data of turbine exhaust pressure, steam flow and ambient temperature against wind conditions, and
• A careful calibration of detailed CFD models with field data in order to apply the models with confidence to the assessment of design modification s for the mitigation of wind effects on fan performance.
The current study was initiated in response to those recommendations.
1.5 Objective and approach The overall objective of the study is to develop sufficient understanding of the effect of wind on air‐cooled condenser (ACC) performance to enable the design, selection and operation of ACCs to achieve adequate and predictable performance under windy conditions. The results of the study are intended to assist the power generation industry and, in turn, California ratepayers with economical options for reducing the water required for the generation of electricity.
The objective is approached through a comprehensive, integrated program consisting of field testing of an ACC under realistic operating conditions at a power plant, the development and use of a computational fluid dynamic (CFD) model and the calibration and validation of the model with the results of the field tests.
The field tests, conducted on the ACC at the El Dorado Energy Center were designed to obtain:
11
• Independent measurements, in addition to existing plant measurements, of ambient conditions of temperature, wind speed and wind direction at two locations well upwind of the ACC and at varying heights above grade,
• More complete measurements of inlet air velocities in critically located cells,
• Additional measurements of both vertical and horizontal air velocities at the perimeter of the ACC near the bottom of the wind wall, and
• Inlet temperature profiles with height at a location likely to be subject to frequent recirculation.
The CFD model was formulated, developed and run at the University of Stellenbosch. The modeling work included:
• Formulation of a global, far‐field model to establish a flow field in the vicinity of simplified representation of an ACC,
• Formulation of a detailed ACC in a smaller domain using boundary conditions derived from the global model,
• Adjusting the model parameters to accurately simulate conditions at the El Dorado Energy Center and the ACC at that site, and
• Running a range of cases bracketing conditions encountered during the field tests.
Finally the results of the field tests and the CFD model were combined to validate the model and to extrapolate to estimate the effect of various design options for mitigating the effects of wind on ACC performance.
1.6 Organization of report The remaining chapters of the report are organized as follows. Chapter 2 contains a description of the plant site, the power plant and the ACC, as well as of the instrumentation deployed for the tests.
Chapter 3 gives examples of the data obtained from the data acquisition system and some typical plots of selected data streams.
Chapter 4 presents a review and analysis of the data; specifically:
• A comparison among all sources of ambient data,
• A presentation of all temperature data around the ACC,
• A discussion of how recirculation is defined and measured, and
• A presentation of all air velocity data under, and at the perimeter of, the ACC.
Chapter 5 relates the temperature and velocity data to ACC performance as inferred from plant information on steam flow, turbine exhaust pressure, and fan status. Comparisons are made
12
with expected ACC performance as determined from original vendor information. A method is proposed and evaluated to separate the effects of recirculation and fan performance degradation.
Chapters 6 and 7 describe the development and structure of and the results from the CFD model (Chapter 6) and the comparison of the model results with the field test measurements (Chapter 7).
Chapter 8 illustrates the application of the model to explore and evaluate a variety of means intended to mitigate the effect of wind on ACC performance.
Chapter 9 presents the conclusions of the study. A list of references is given at the end of the report. An Executive Summary in provided at the beginning prior to Chapter 1.
13
CHAPTER 2: Site, Plant and ACC Information Field tests of the effect of wind on ACC performance were conducted at the El Dorado Energy Center. Summary information on the site, the plant and the ACC are tabulated below. The following section provides information in photographic and sketch form of the layout of the site and the location and orientation of the ACC in relationship to other plant structures. This information is important to an understanding of the potential obstructions to and distortions of airflow to the ACC when the wind comes from different directions.
2.1 Site Information The El Dorado Energy Center is located in El Dorado, Nevada just to the east of Highway 95 approximately 35 miles south and slightly east of Las Vegas. The location is in a valley that runs north and south. An aerial view in Figure 2‐1 shows the general nature of the surrounding area and the flat open terrain extending in the prevailing upwind direction to the south. The area is hot and relatively windy. The precise location and the average meteorological characteristics of the site are tabulated in Table 2‐1.
Figure 2-1: Aerial View of El DoradoEnergyCenter and Surroundings
14
Table 2-1: El DoradoEnergyCenter Site Information1
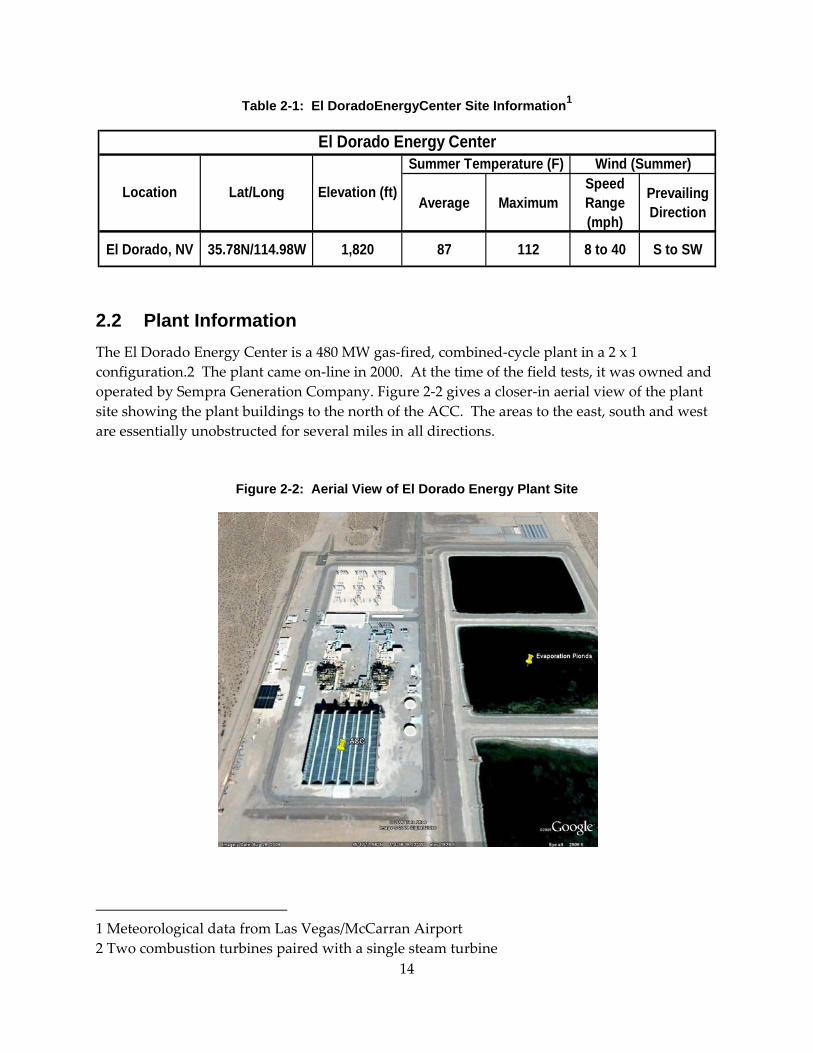
2.2 Plant Information The El Dorado Energy Center is a 480 MW gas‐fired, combined‐cycle plant in a 2 x 1 configuration.2 The plant came on‐line in 2000. At the time of the field tests, it was owned and operated by Sempra Generation Company. Figure 2‐2 gives a closer‐in aerial view of the plant site showing the plant buildings to the north of the ACC. The areas to the east, south and west are essentially unobstructed for several miles in all directions.
Figure 2-2: Aerial View of El Dorado Energy Plant Site
1 Meteorological data from Las Vegas/McCarran Airport 2 Two combustion turbines paired with a single steam turbine
Average MaximumSpeed Range (mph)
Prevailing Direction
El Dorado, NV 35.78N/114.98W 1,820 87 112 8 to 40 S to SW
El Dorado Energy CenterWind (Summer)Summer Temperature (F)
Location Lat/Long Elevation (ft)
15
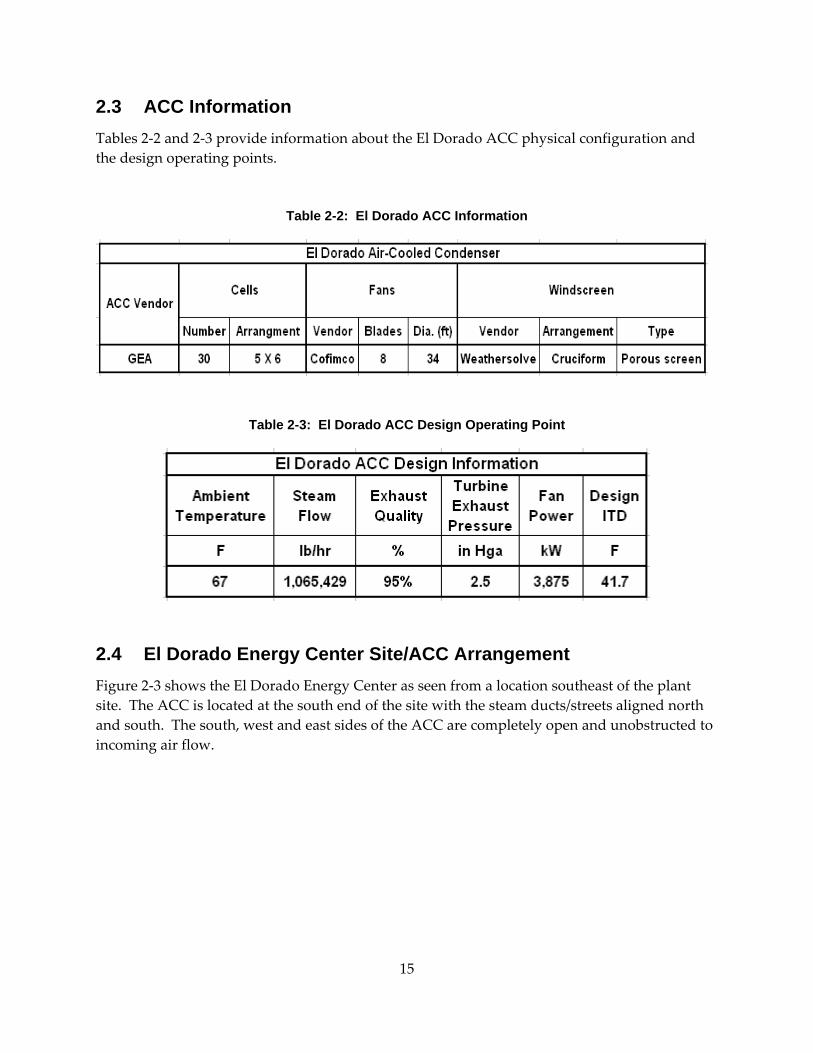
2.3 ACC Information Tables 2‐2 and 2‐3 provide information about the El Dorado ACC physical configuration and the design operating points.
Table 2-2: El Dorado ACC Information
Table 2-3: El Dorado ACC Design Operating Point
2.4 El Dorado Energy Center Site/ACC Arrangement Figure 2‐3 shows the El Dorado Energy Center as seen from a location southeast of the plant site. The ACC is located at the south end of the site with the steam ducts/streets aligned north and south. The south, west and east sides of the ACC are completely open and unobstructed to incoming air flow.
16
Figure 2-3: Ground level view of El Dorado Energy Plant Site
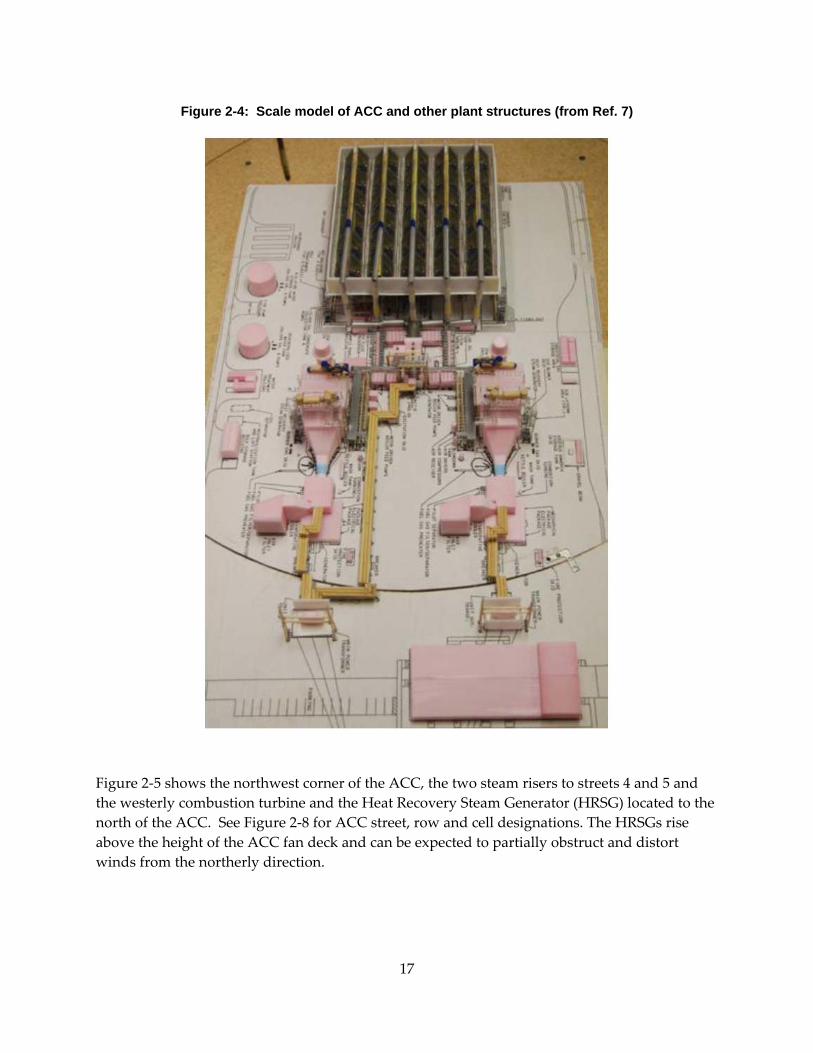
Figure 2‐4 is an overview of a model of the El Dorado site constructed for wind tunnel testing at the University of California at Davis. It is shown here to provide an understanding of the layout of the buildings on the site and their relationship to the ACC.
17
Figure 2-4: Scale model of ACC and other plant structures (from Ref. 7)
Figure 2‐5 shows the northwest corner of the ACC, the two steam risers to streets 4 and 5 and the westerly combustion turbine and the Heat Recovery Steam Generator (HRSG) located to the north of the ACC. See Figure 2‐8 for ACC street, row and cell designations. The HRSGs rise above the height of the ACC fan deck and can be expected to partially obstruct and distort winds from the northerly direction.
18
Figure 2-5: North end of ACC showing risers, HRSG and east end of turbine building
Figure 2‐6 illustrates the windscreen under the ACC. The screen is in a cruciform arrangement running north/south between Street 3 and 4 and east/west between rows 3 and 4. The screens extend from the ground to the fan deck and are divided into three vertical sections separated at the horizontal structural beams. The porosity of the screens varies from to bottom with the top section being the most porous.
19
Figure 2-6: View underneath the ACC showing the windscreens
Figure 2‐7 gives some indication of the blockage at the north end of the ACC from the steam risers on the north face, the Motor Control Center (MCC) buildings under Row 2 and the condensate system under Row 1. Note that the picture was taken prior to the installation of the windscreens in 2003.
20
Figure 2-7: View underneath the ACC showing condensate return equipment and motor control center buildings
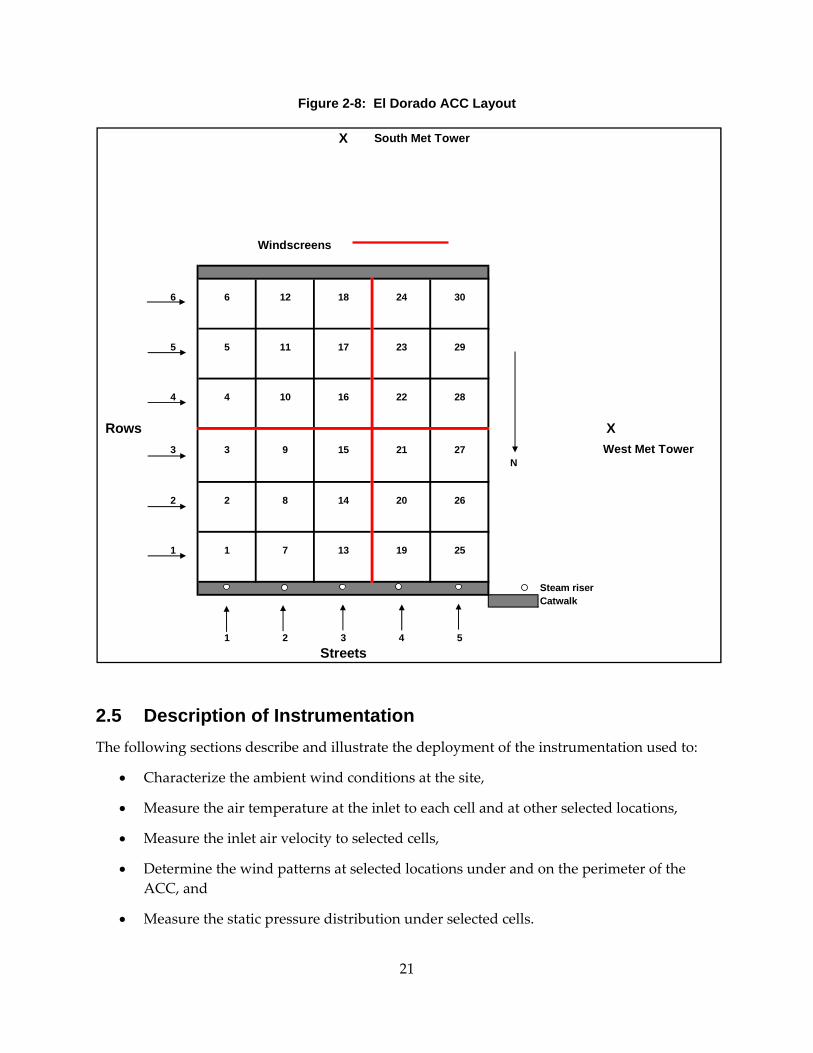
2.4.1 Details of ACC Layout and Nomenclature Figure 2‐8 shows the layout of the El Dorado ACC and gives the cell numbering system which will be used in later discussions of the instrumentation layout and the data.
21
Figure 2-8: El Dorado ACC Layout
2.5 Description of Instrumentation The following sections describe and illustrate the deployment of the instrumentation used to:
• Characterize the ambient wind conditions at the site,
• Measure the air temperature at the inlet to each cell and at other selected locations,
• Measure the inlet air velocity to selected cells,
• Determine the wind patterns at selected locations under and on the perimeter of the ACC, and
• Measure the static pressure distribution under selected cells.
X South Met Tower
Windscreens
6 6 12 18 24 30
5 5 11 17 23 29
4 4 10 16 22 28
3 3 9 15 21 27 West Met TowerN
2 2 8 14 20 26
1 1 7 13 19 25
Steam riserCatwalk
1 2 3 4 5Streets
Rows X
22
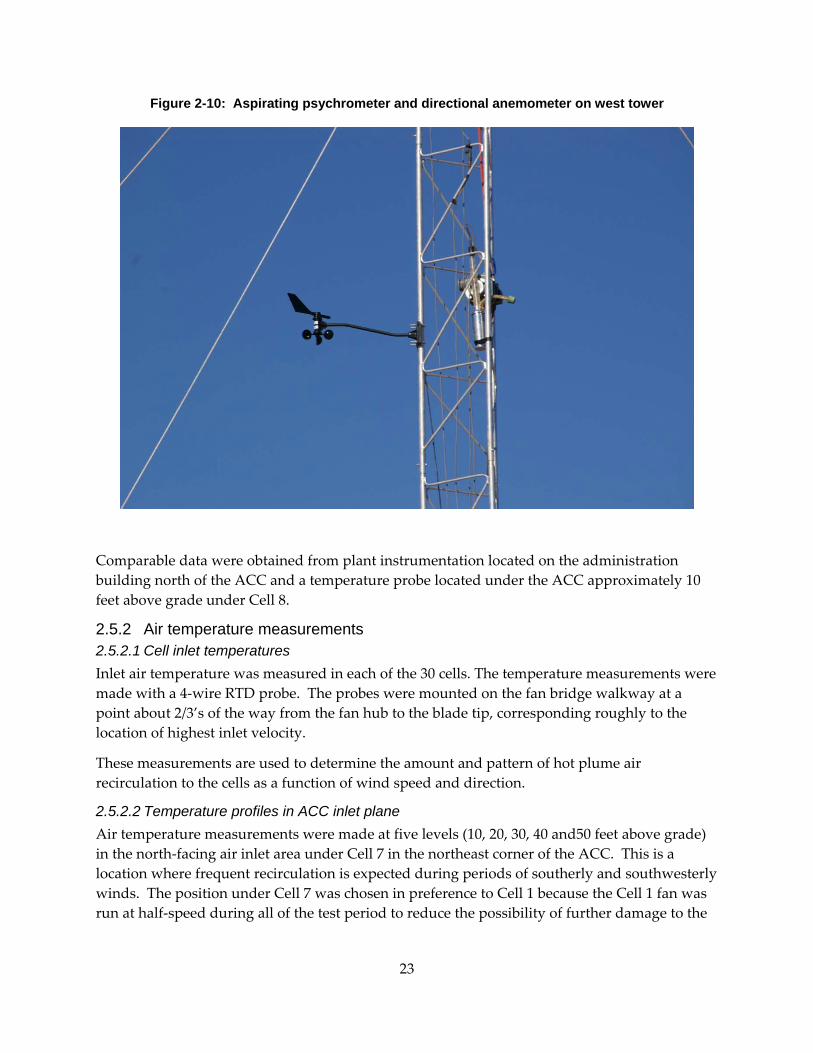
2.5.1 Determination of ambient wind conditions Ambient wind conditions were measured at two locations 600 feet to the south and 275 feet to the west of the respective centerlines of the ACC). The west tower is shown in Figure 2‐9. Instrumentation for temperature, wind speed and wind direction was mounted on towers at levels of 2, 5 and 11 meters above the base of the tower. Figure 2‐10shows the temperature probes and anemometers on the west tower.
Figure 2-9: Met tower located on berm to west of ACC
23
Figure 2-10: Aspirating psychrometer and directional anemometer on west tower
Comparable data were obtained from plant instrumentation located on the administration building north of the ACC and a temperature probe located under the ACC approximately 10 feet above grade under Cell 8.
2.5.2 Air temperature measurements 2.5.2.1 Cell inlet temperatures Inlet air temperature was measured in each of the 30 cells. The temperature measurements were made with a 4‐wire RTD probe. The probes were mounted on the fan bridge walkway at a point about 2/3’s of the way from the fan hub to the blade tip, corresponding roughly to the location of highest inlet velocity.
These measurements are used to determine the amount and pattern of hot plume air recirculation to the cells as a function of wind speed and direction.
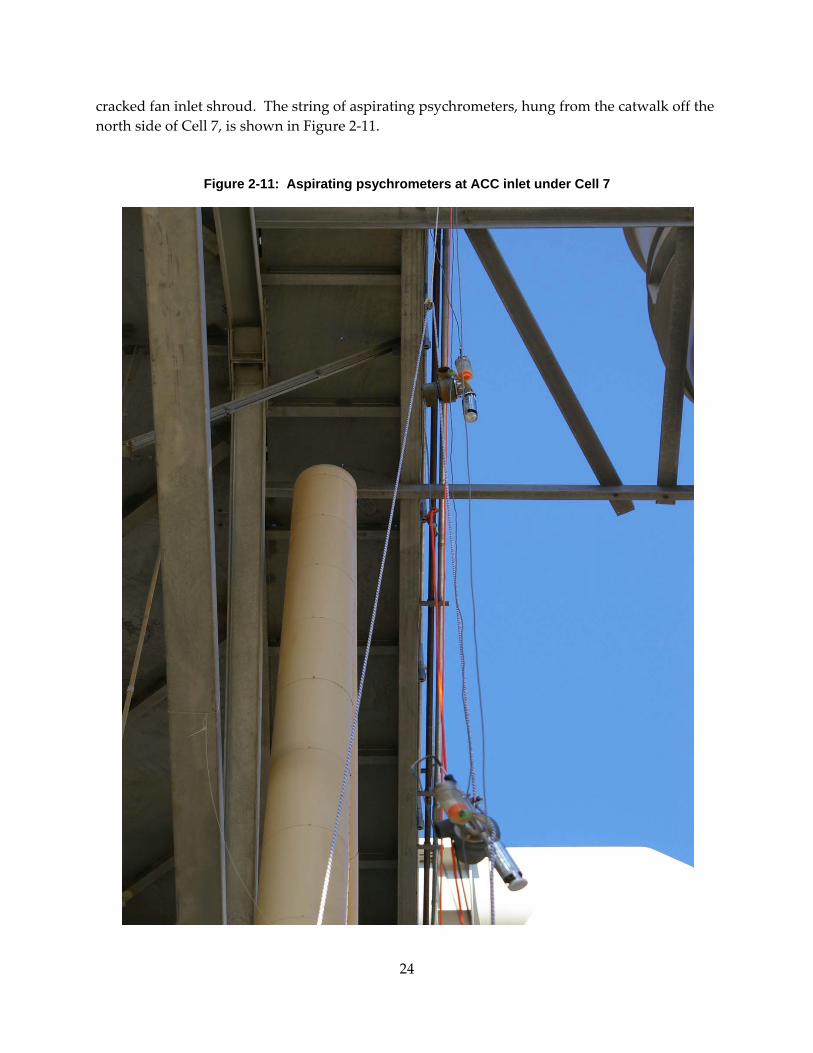
2.5.2.2 Temperature profiles in ACC inlet plane Air temperature measurements were made at five levels (10, 20, 30, 40 and50 feet above grade) in the north‐facing air inlet area under Cell 7 in the northeast corner of the ACC. This is a location where frequent recirculation is expected during periods of southerly and southwesterly winds. The position under Cell 7 was chosen in preference to Cell 1 because the Cell 1 fan was run at half‐speed during all of the test period to reduce the possibility of further damage to the
24
cracked fan inlet shroud. The string of aspirating psychrometers, hung from the catwalk off the north side of Cell 7, is shown in Figure 2‐11.
Figure 2-11: Aspirating psychrometers at ACC inlet under Cell 7
25
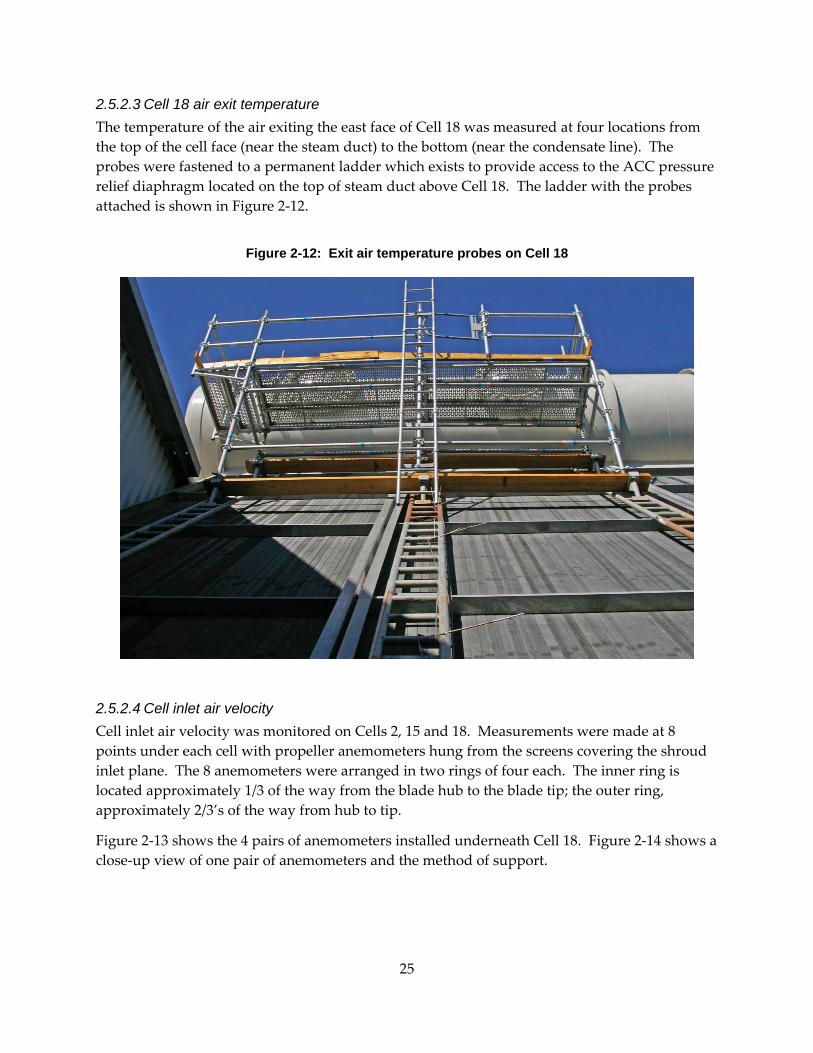
2.5.2.3 Cell 18 air exit temperature The temperature of the air exiting the east face of Cell 18 was measured at four locations from the top of the cell face (near the steam duct) to the bottom (near the condensate line). The probes were fastened to a permanent ladder which exists to provide access to the ACC pressure relief diaphragm located on the top of steam duct above Cell 18. The ladder with the probes attached is shown in Figure 2‐12.
Figure 2-12: Exit air temperature probes on Cell 18
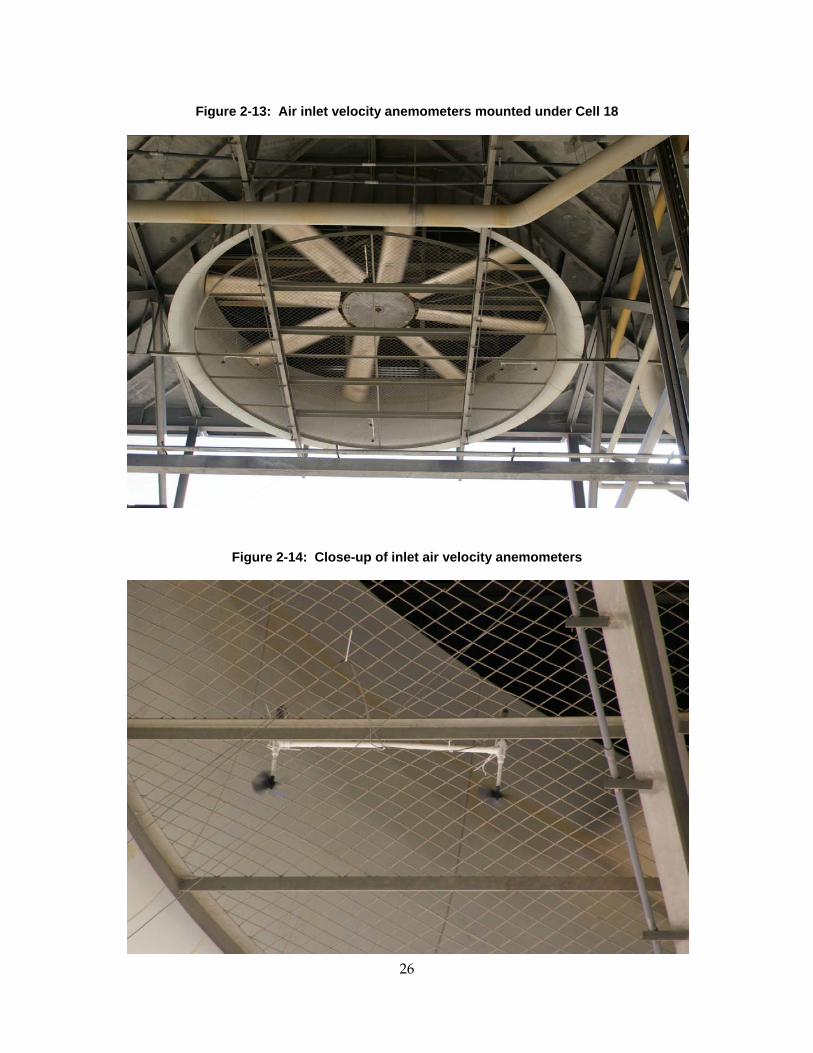
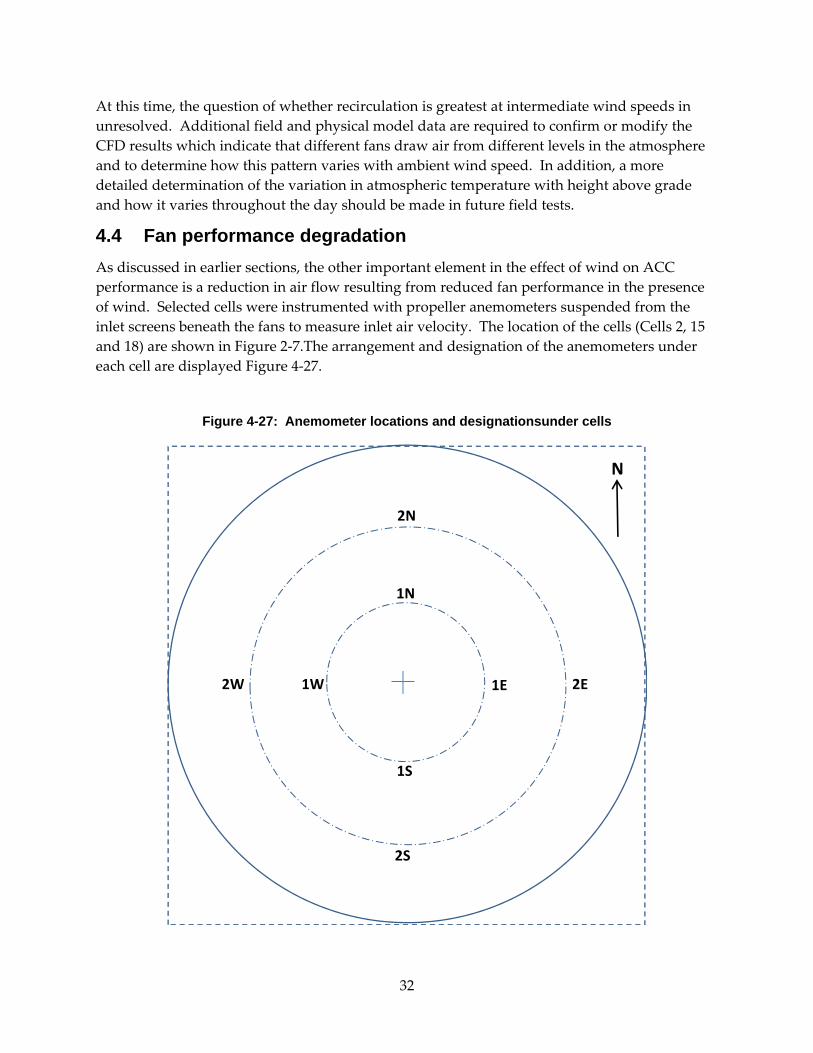
2.5.2.4 Cell inlet air velocity Cell inlet air velocity was monitored on Cells 2, 15 and 18. Measurements were made at 8 points under each cell with propeller anemometers hung from the screens covering the shroud inlet plane. The 8 anemometers were arranged in two rings of four each. The inner ring is located approximately 1/3 of the way from the blade hub to the blade tip; the outer ring, approximately 2/3’s of the way from hub to tip.
Figure 2‐13 shows the 4 pairs of anemometers installed underneath Cell 18. Figure 2‐14 shows a close‐up view of one pair of anemometers and the method of support.
26
Figure 2-13: Air inlet velocity anemometers mounted under Cell 18
Figure 2-14: Close-up of inlet air velocity anemometers
27
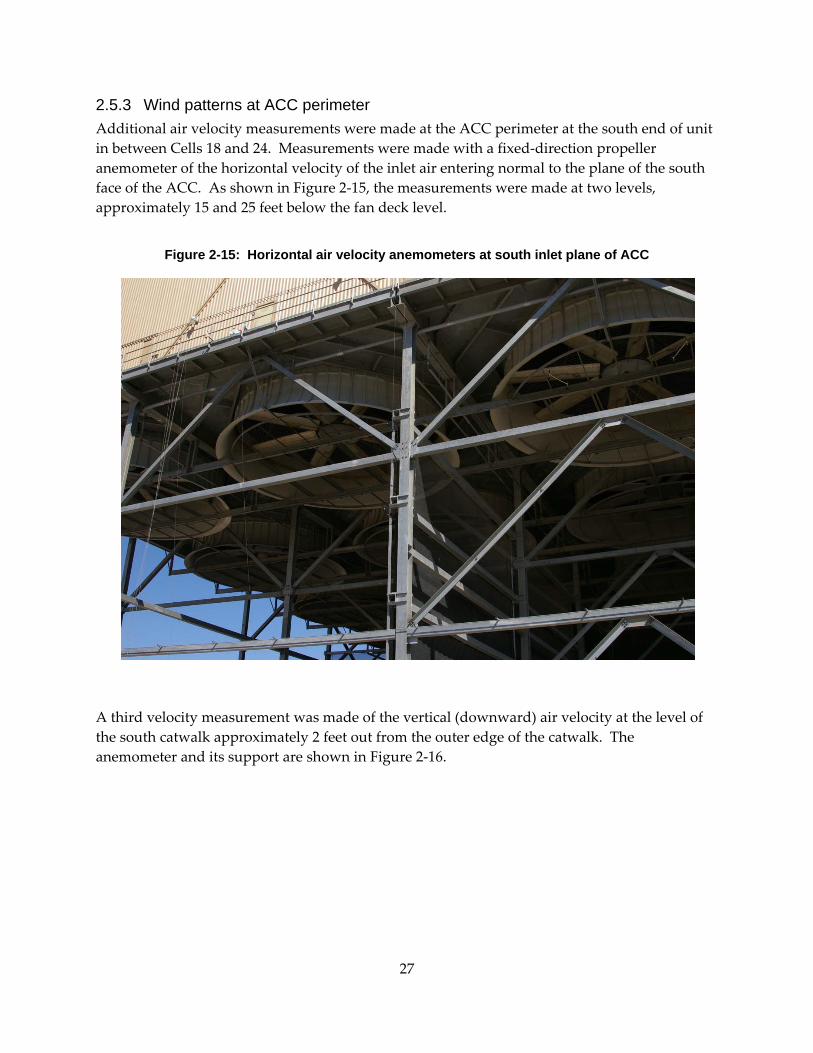
2.5.3 Wind patterns at ACC perimeter Additional air velocity measurements were made at the ACC perimeter at the south end of unit in between Cells 18 and 24. Measurements were made with a fixed‐direction propeller anemometer of the horizontal velocity of the inlet air entering normal to the plane of the south face of the ACC. As shown in Figure 2‐15, the measurements were made at two levels, approximately 15 and 25 feet below the fan deck level.
Figure 2-15: Horizontal air velocity anemometers at south inlet plane of ACC
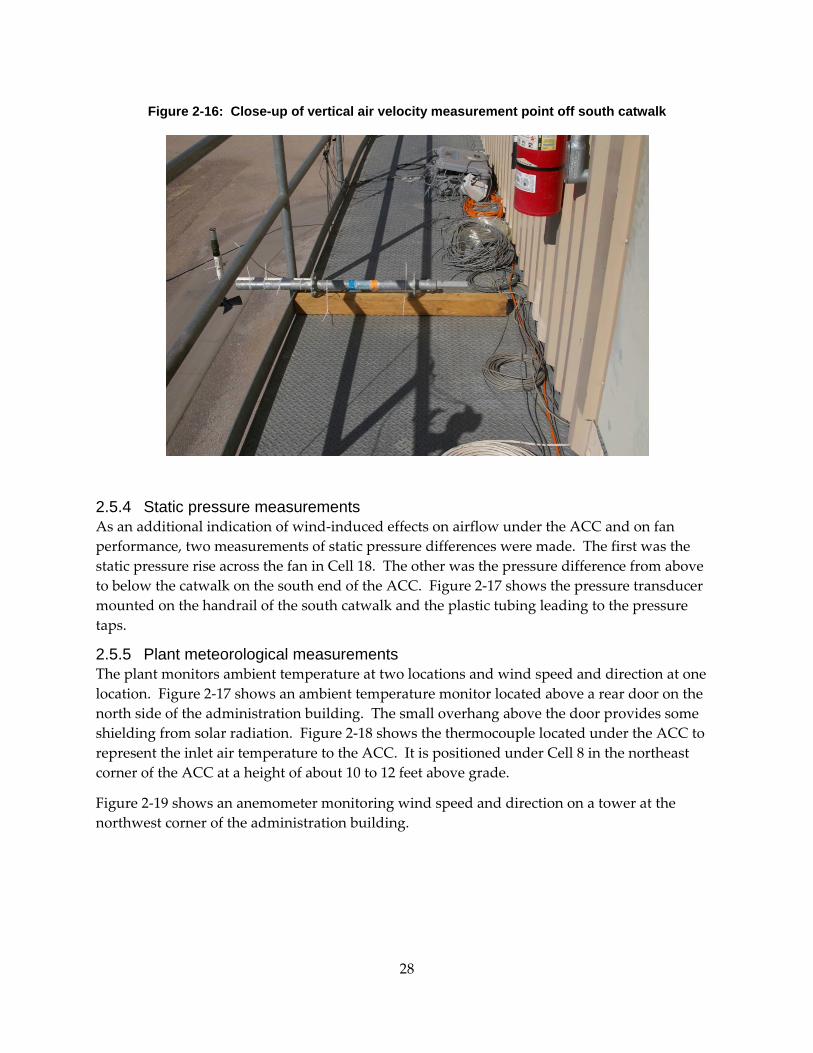
A third velocity measurement was made of the vertical (downward) air velocity at the level of the south catwalk approximately 2 feet out from the outer edge of the catwalk. The anemometer and its support are shown in Figure 2‐16.
28
Figure 2-16: Close-up of vertical air velocity measurement point off south catwalk
2.5.4 Static pressure measurements As an additional indication of wind‐induced effects on airflow under the ACC and on fan performance, two measurements of static pressure differences were made. The first was the static pressure rise across the fan in Cell 18. The other was the pressure difference from above to below the catwalk on the south end of the ACC. Figure 2‐17 shows the pressure transducer mounted on the handrail of the south catwalk and the plastic tubing leading to the pressure taps.
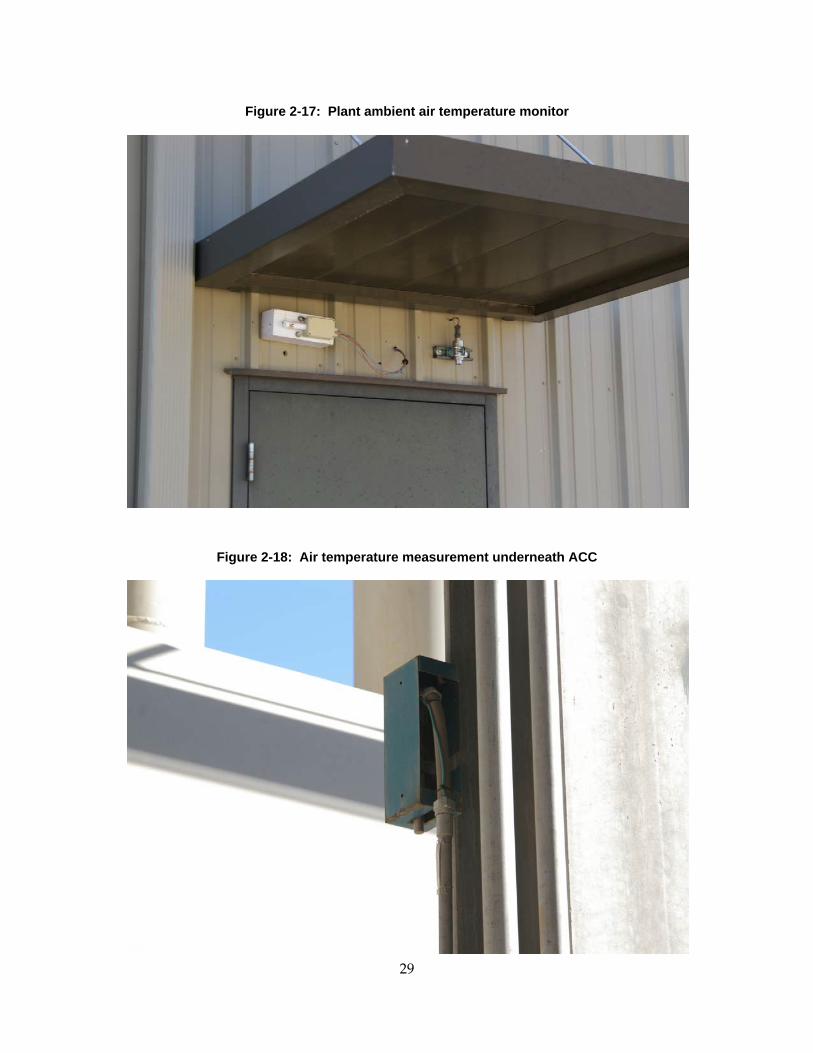
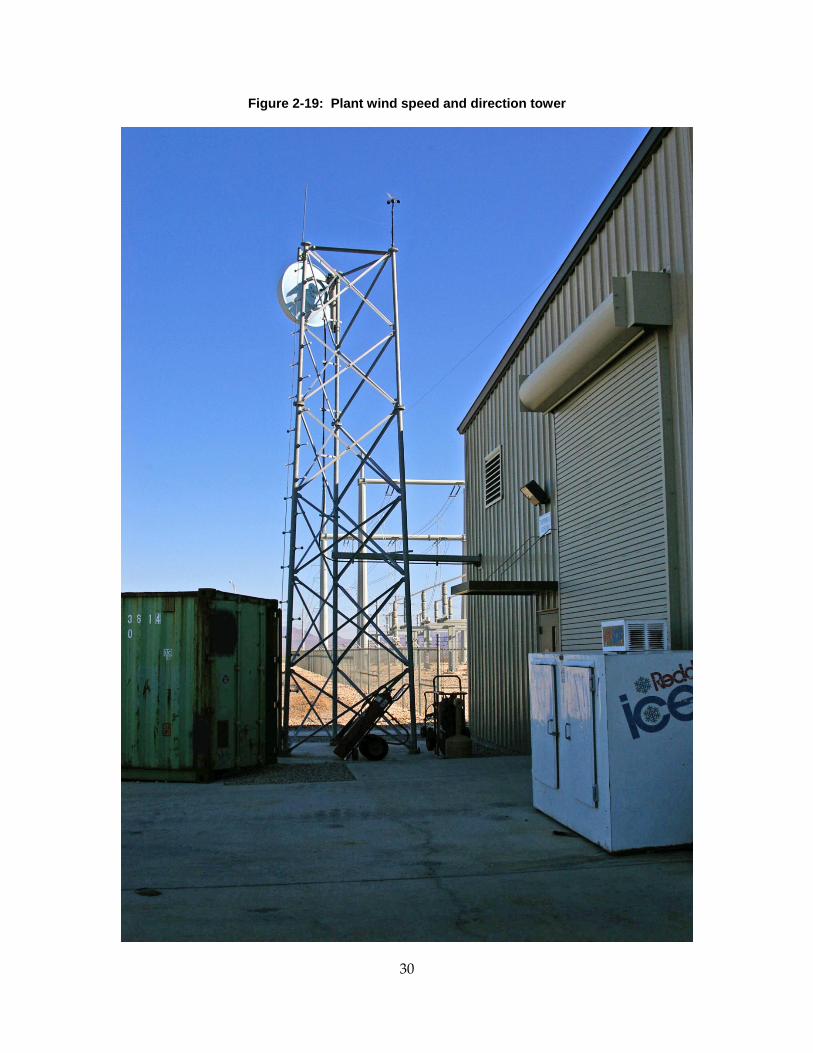
2.5.5 Plant meteorological measurements The plant monitors ambient temperature at two locations and wind speed and direction at one location. Figure 2‐17 shows an ambient temperature monitor located above a rear door on the north side of the administration building. The small overhang above the door provides some shielding from solar radiation. Figure 2‐18 shows the thermocouple located under the ACC to represent the inlet air temperature to the ACC. It is positioned under Cell 8 in the northeast corner of the ACC at a height of about 10 to 12 feet above grade.
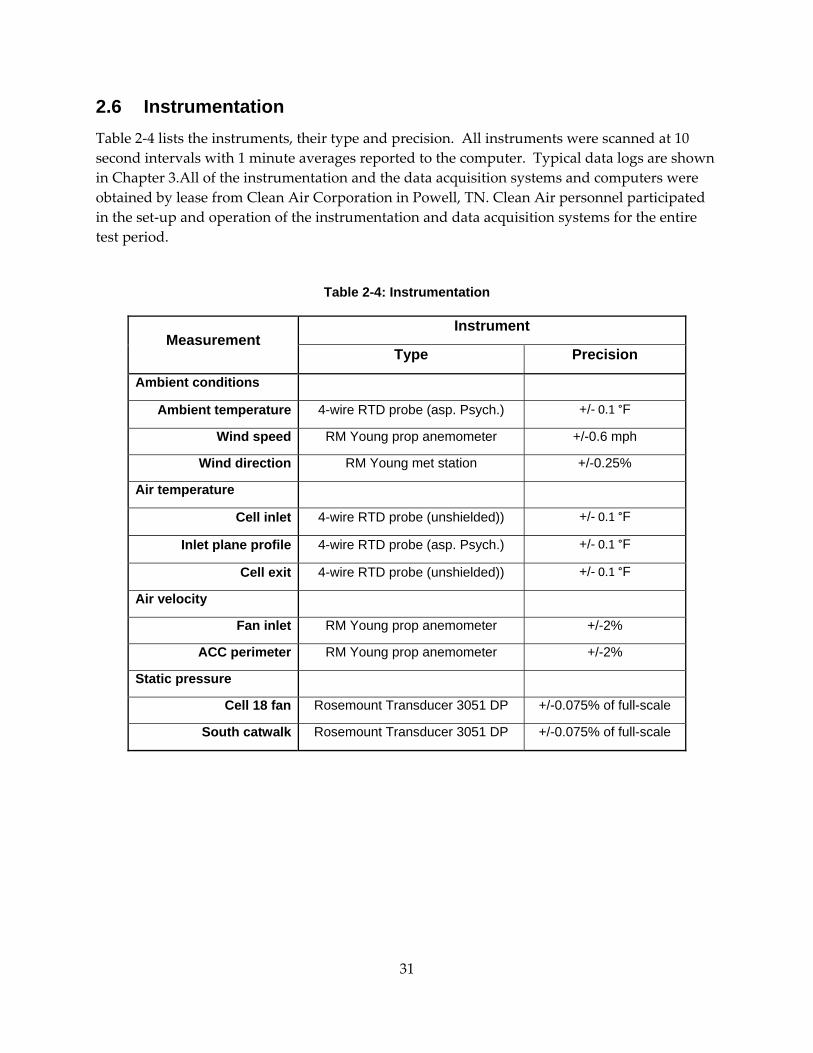
Figure 2‐19 shows an anemometer monitoring wind speed and direction on a tower at the northwest corner of the administration building.
29
Figure 2-17: Plant ambient air temperature monitor
Figure 2-18: Air temperature measurement underneath ACC
30
Figure 2-19: Plant wind speed and direction tower
31
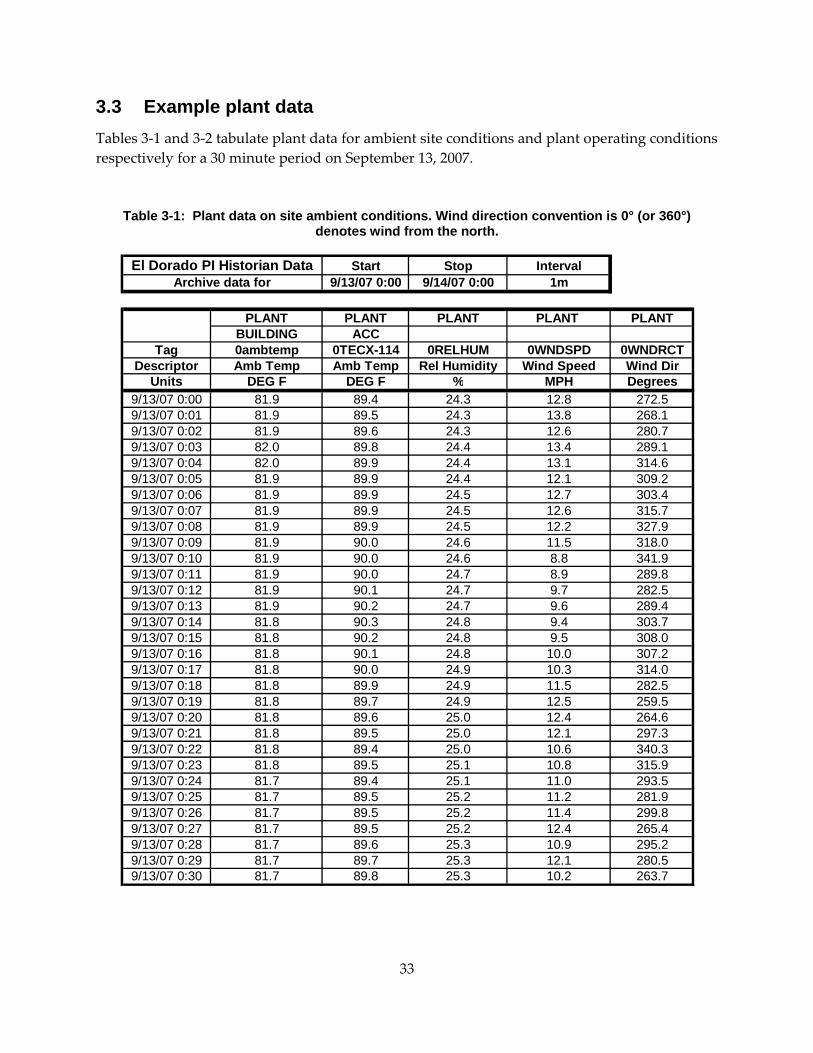
2.6 Instrumentation Table 2‐4 lists the instruments, their type and precision. All instruments were scanned at 10 second intervals with 1 minute averages reported to the computer. Typical data logs are shown in Chapter 3.All of the instrumentation and the data acquisition systems and computers were obtained by lease from Clean Air Corporation in Powell, TN. Clean Air personnel participated in the set‐up and operation of the instrumentation and data acquisition systems for the entire test period.
Table 2-4: Instrumentation
Measurement Instrument
Type Precision
Ambient conditions
Ambient temperature 4-wire RTD probe (asp. Psych.) +/- 0.1 °F
Cell 18 fan Rosemount Transducer 3051 DP +/-0.075% of full-scale
South catwalk Rosemount Transducer 3051 DP +/-0.075% of full-scale
32
CHAPTER 3: Data Collection Data were obtained both from project test instrumentation and plant data acquisition systems. Plant data both for plant and steam system operating variables and for site ambient temperature and wind conditions were made available at one‐minute intervals from 12:00 am on September 4, 2007 through 12:00am on September 29, 2007.
Project instrumentation was installed over several days prior to September 10. Complete sets of ambient temperature and wind data and of air temperature, air velocity and static pressure at selected locations on and around the ACC were available from 12:00pm (noon) on September 10 through 12:00 am on September 29.
3.1 Plant data Plant instrumentation provided the following data:
• Site conditions
o Ambient temperature (at the administration building and under the ACC)
o Wind speed and direction (at the administration building)
• Operating variables
o Plant output
o Steam turbine output
o Steam flow to ACC
o Condensate flow from the ACC
o Turbine exhaust pressure and condensing temperature
o Inlet evaporator temperature and turbine output (for each gas turbine)
o Fan operating status
3.2 Project data The number and locations of the project instrumentation were described in detail in Chapter 2. The monitoring of over fifty data channels at one minute intervals for 19 test days resulted in nearly 55 megabytes of data. The complete data set cannot reasonably be included in this report. A full set is included on a CD available to interested parties from the California Energy Commission or Maulbetsch Consulting. However, in the interest of providing the reader with an understanding of the level of detail as well as the inherent uncertainty of the data upon which the results of this study are based, example data tables and plots are presented in the following section.
33
3.3 Example plant data Tables 3‐1 and 3‐2 tabulate plant data for ambient site conditions and plant operating conditions respectively for a 30 minute period on September 13, 2007.
Table 3-1: Plant data on site ambient conditions. Wind direction convention is 0° (or 360°) denotes wind from the north.
Start Stop Interval9/13/07 0:00 9/14/07 0:00 1m
PLANT PLANT PLANT PLANT PLANTBUILDING ACC
Tag 0ambtemp 0TECX-114 0RELHUM 0WNDSPD 0WNDRCTDescriptor Amb Temp Amb Temp Rel Humidity Wind Speed Wind Dir
Net Generation ST Generation TOTAL STEAM Generation INLET GENERATION FAN SEQUENCETag Net Ties 0JT66801 TOTALSTMFLOW 0PTCX111-MED 0TECX-054A 0FTCD-203 1TE35101 1JT38601A 2TE35101 2JT38601A 0ACCSQ-SSN
Descriptor ST-Power FLOW VACUUM COND TEMP COND FLOW EVAP INLET EVAP FANS RUNUnits MWATTS MWATTS LB/HRX1000 IN HG DEG F GPM TEMP F MWATTS TEMP F MWATTS NUMBER
Figure 3‐1 plots the fan status record for September 17. For each of the 30 fans, “0” designates “fan off”, “1” designates fan at half‐speed and “2” designates fan at full speed. Therefore, a fan status of “60” indicates all fans at full speed. During periods of low ambient temperature or reduced load, selected fans are shut off or run at half speed both to conserve energy and to maintain the condensing pressure at or above 2 inches Hga to minimize air in‐leakage to the ACC.
3.4 Example project data Tables 3‐3 through 3‐8 show the output from the data acquisition system. All readings are at one‐minute intervals. They are the averages of four intermediate readings at 15‐second intervals. The data in all the tables are for the period from 1:00 to 1:30 pm on September 13, 2007.
Table 3‐3 shows the ambient temperature and wind conditions data from the met tower located south of the ACC. The readings are taken at three levels (2, 5 and 11 meters) above grade.
ACC FAN SEQUENCE 0ACCSQ-SSN FANS RUN NUMBER
0
10
20
30
40
50
60
70
17-Sep-0700:00:00
17-Sep-0703:00:00
17-Sep-0706:00:00
17-Sep-0709:00:00
17-Sep-0712:00:00
17-Sep-0715:00:00
17-Sep-0718:00:00
17-Sep-0721:00:00
18-Sep-0700:00:00
Fan
Stat
us (6
0 =
All
fans
full)
36
Table 3-3: Ambient conditions at south tower for September 13, 2007 (1:00 to 1:30 pm)
Sep 13 2007 D Clean Air Engineering 1 Minute Data File
Device/Channel:HP2
SouthWest/ 201
HP2 SouthWest/
202
HP2 SouthWest/
203
HP2 SouthWest/
205
HP2 SouthWest/
206
HP2 SouthWest/
207
HP2 SouthWest/
208
HP2 SouthWest/
209
HP2 SouthWest/
210
HP2 SouthWest/
301Units: F F F MPH Degrees MPH Degrees MPH Degrees RHGroup: AAT AAT AAT WSW WSW WSW
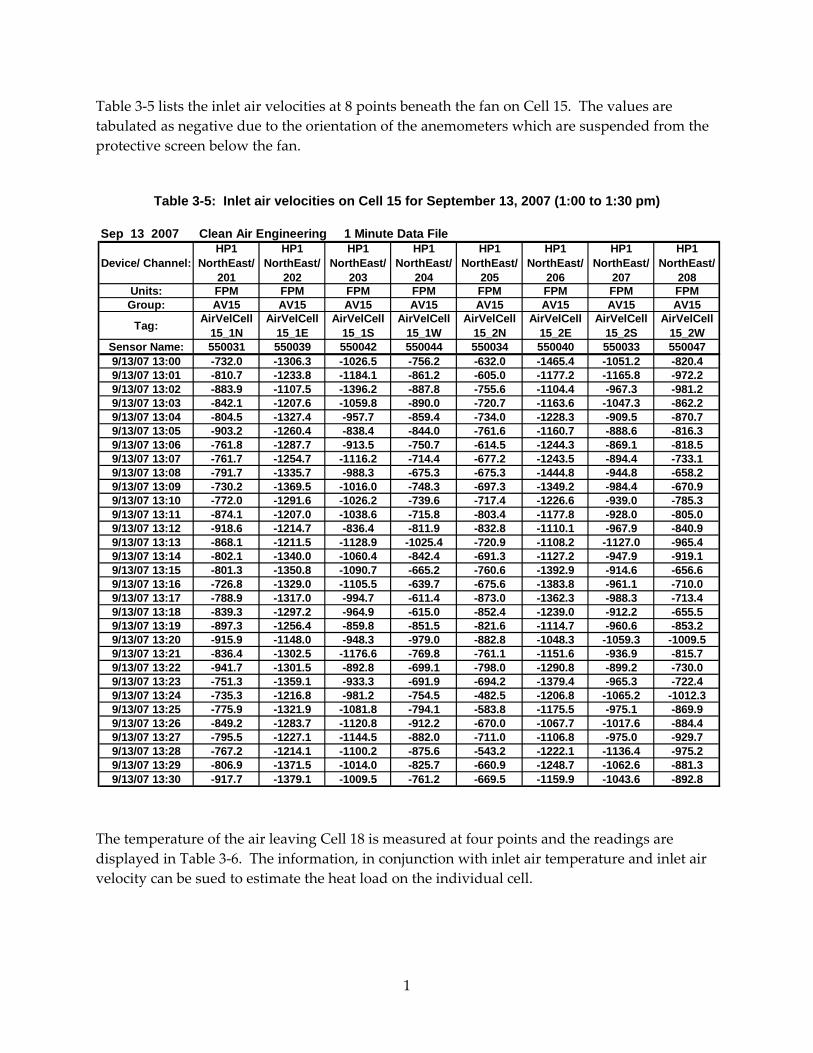
Table 3‐5 lists the inlet air velocities at 8 points beneath the fan on Cell 15. The values are tabulated as negative due to the orientation of the anemometers which are suspended from the protective screen below the fan.
Table 3-5: Inlet air velocities on Cell 15 for September 13, 2007 (1:00 to 1:30 pm)
The temperature of the air leaving Cell 18 is measured at four points and the readings are displayed in Table 3‐6. The information, in conjunction with inlet air temperature and inlet air velocity can be sued to estimate the heat load on the individual cell.
Sep 13 2007 Clean Air Engineering 1 Minute Data File
Table 3-6: Cell 18 air exit temperatures for September 13, 2007 (1:00 to 1:30 pm)
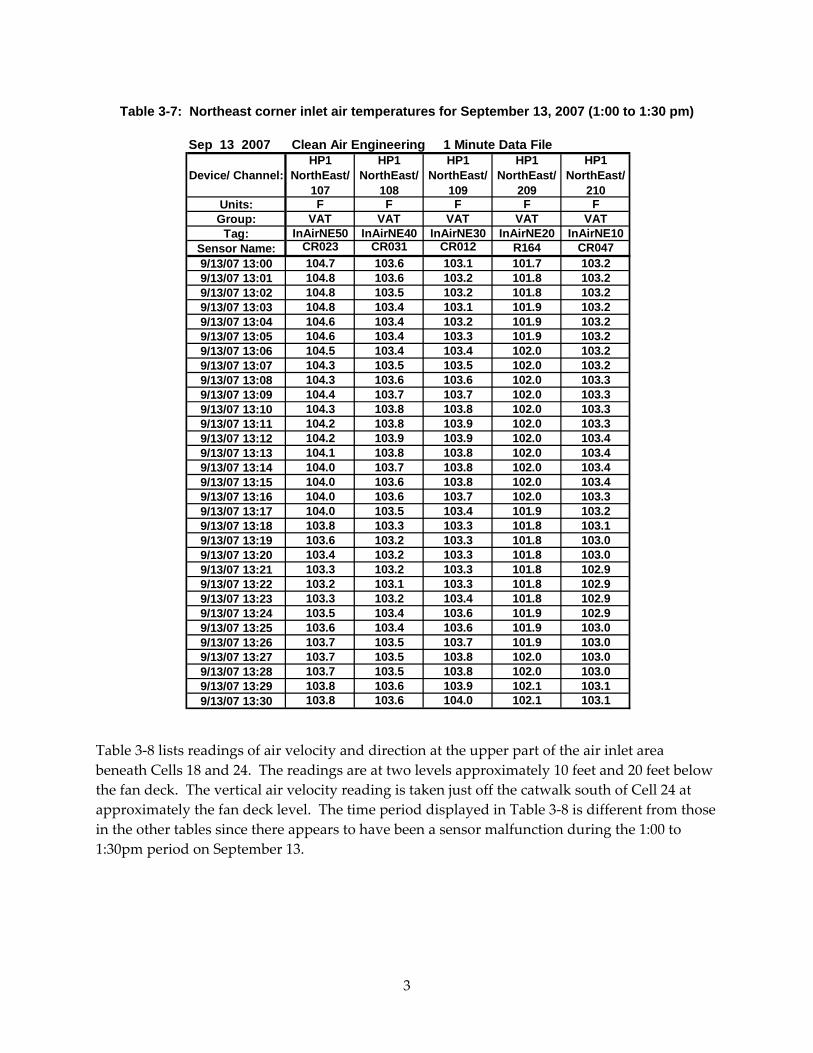
The remaining tables list readings of air temperature, velocity, and static pressure at selected points around the ACC to aid in interpreting the effect of wind on the over ll flow patterns around the units Table 3‐7 lists the temperature of air at the north face of the air inlet area beneath Cell 7. The readings are equally spaced between the fan deck and the ground at levels of 10, 20, 30, 40 and 50 feet above grade.
Sep 13 2007 Clean Air Engineering 1 Minute Data File
Table 3-7: Northeast corner inlet air temperatures for September 13, 2007 (1:00 to 1:30 pm)
Table 3‐8 lists readings of air velocity and direction at the upper part of the air inlet area beneath Cells 18 and 24. The readings are at two levels approximately 10 feet and 20 feet below the fan deck. The vertical air velocity reading is taken just off the catwalk south of Cell 24 at approximately the fan deck level. The time period displayed in Table 3‐8 is different from those in the other tables since there appears to have been a sensor malfunction during the 1:00 to 1:30pm period on September 13.
Sep 13 2007 Clean Air Engineering 1 Minute Data File
Table 3-8: South face air velocity and direction for September 13, 2007 (1:00 to 1:30 pm)
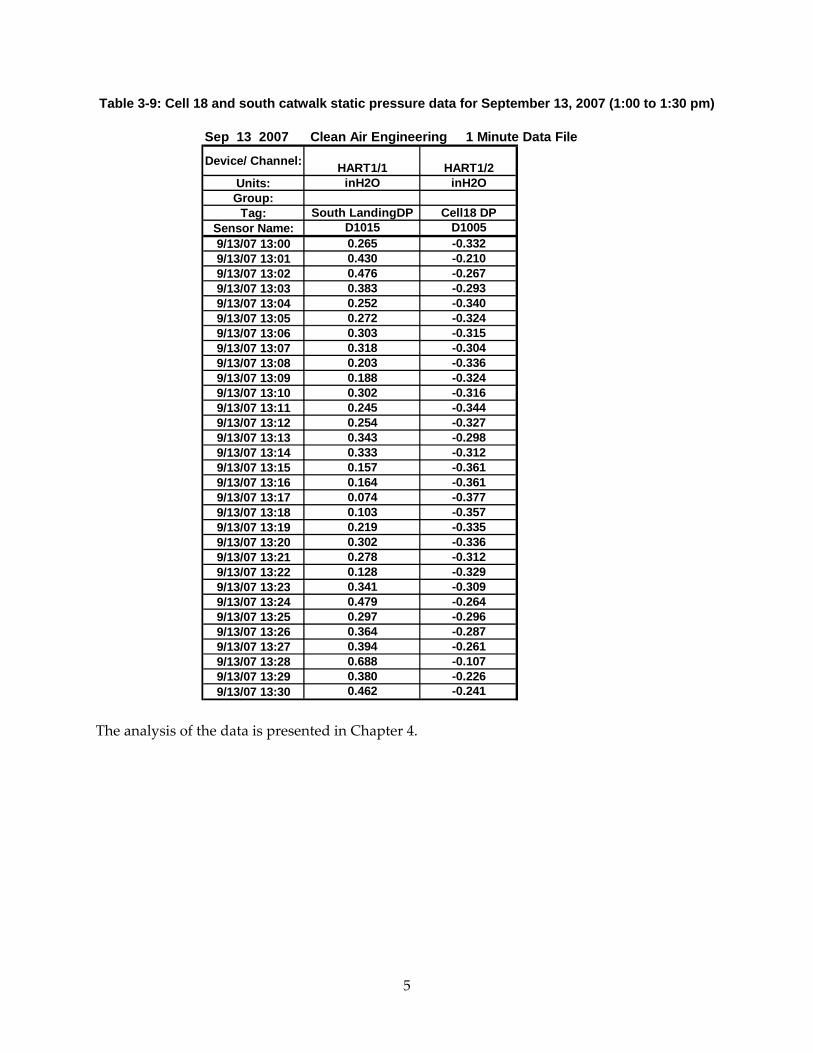
Table 3‐9 lists readings of the static pressure rise across the fan in Cell 18 and the static pressure difference from above to below the catwalk on the south end of the ACC.
Sep 13 2007 Clean Air Engineering 1 Minute Data File
Device/ Channel: HP2 SouthWest/ 304
HP2 SouthWest/ 305
HP2 SouthWest/ 306
HP2 SouthWest/ 307
Units: MPH Degrees MPH Degrees fpmGroup: HAV HAV
Tag: Top Air Vel Top Air Dir Bottom Air Vel Bottom Air Dir Vertical Air Vel
CHAPTER 4: Analysis of Data The objective in analyzing the data is
• To define the difference between the expected ACC performance at “zero” wind and the actual ACC performance at some “ambient” temperature and steam flow with “existing” wind conditions, and
• To relate this difference to wind speed and direction.
To do this, a number of issues must be addressed.
• The expected performance must be determined.
• Ambient conditions (temperature, wind speed, wind direction) must be defined and quantified.
Additionally, in order to generalize the results of specific field tests on a particular unit, the governing mechanisms must be postulated and defined with measured quantities. The assumed mechanisms of importance are recirculation and fan performance degradation.
• Recirculation results in an effective ACC inlet temperature, which is higher than the far‐field ambient temperature as a result of high temperature air from the ACC exhaust plume being re‐entrained into the ACC inlet stream. For purposes of this analysis, the “effective” inlet temperature will be assumed to be the average of the inlet temperatures in all 30 cells.
• Fan performance degradation is quantified as the percent reduction in inlet air flow to the ACC as a result of distortions to the fan inlet air velocity profiles and disturbances in the static air pressure beneath the fans from wind patterns around and under the ACC.
The remainder of this chapter will present an examination of measurements obtained during the field tests by which the important features are defined and the levels of recirculation and fan performance degradation are determined.
4.1 Determination of ambient conditions The ambient conditions of primary importance to this study are the ambient temperature, the wind speed and the wind direction. As described in Chapter 3, all three were recorded throughout the test period at several locations and by both the plant and the project team.
4.1.1 Ambient temperature Ambient temperature measurements were recorded at eight locations:
• South met tower; 2, 5 and 11 m above grade
• West met tower; 2, 5 and 11 m above grade
7
• Plant administration building; north side
• Beneath ACC; Corner of Cells 1, 2, 7 and 8: ~3m above grade
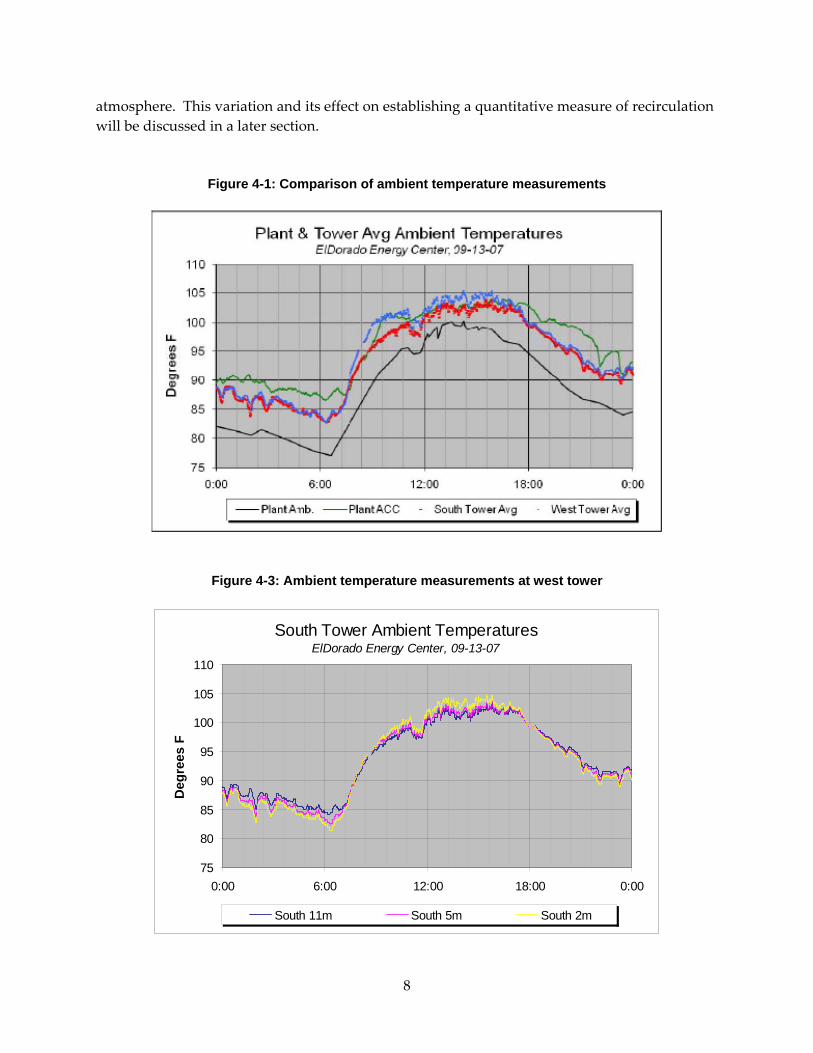
Figure 4‐1 shows the comparisons among the average temperatures for each of the two towers and the two plant measurements for September 13, 2007. There is good agreement between the average temperatures on the two towers for much, but not all, of the time. As will be seen in a later discussion of Figure 4‐3, the periods of disagreement are attributable to intermittent erratic behavior of the 11‐ meter probe on the west tower. During periods when it reads stably, the agreement between the average temperatures at the two towers is excellent. The two plant readings differ significantly from the met tower readings and from each other.
The temperature measured under the ACC is in reasonable agreement with the tower averages during daylight hours but runs 2 to 5°F higher at night. Differences in location and air conditions explain this difference. The probes on the towers are in aspirating psychrometers providing a moving air stream past the probe at all times. The probe beneath the ACC is unshielded and in a protected location in still air. (See Figure 2‐17) This makes the probe beneath the ACC more sensitive to radiation effects which cause the probe temperature to differ from the air temperature. At night when the air is cool, the probe beneath the ACC “sees” warm surroundings because of the hot heat exchanger bundles above and the fact that the ground below is not cooled by radiation to the sky. Therefore, a reading somewhat above actual local air temperatures would be expected. In addition, the air confined beneath the ACC will be slightly warmer than ambient air far from the structure for the same reasons.
Similarly, the sensor on the plant administration building is located on the side of the building under a protective entrance cover or “awning” (See Figure 2‐16) in a shaded protected location where the air temperature might be expected to be consistently lower than at the towers. For purposes of further analyses, the plant ambient temperature data will be disregarded.
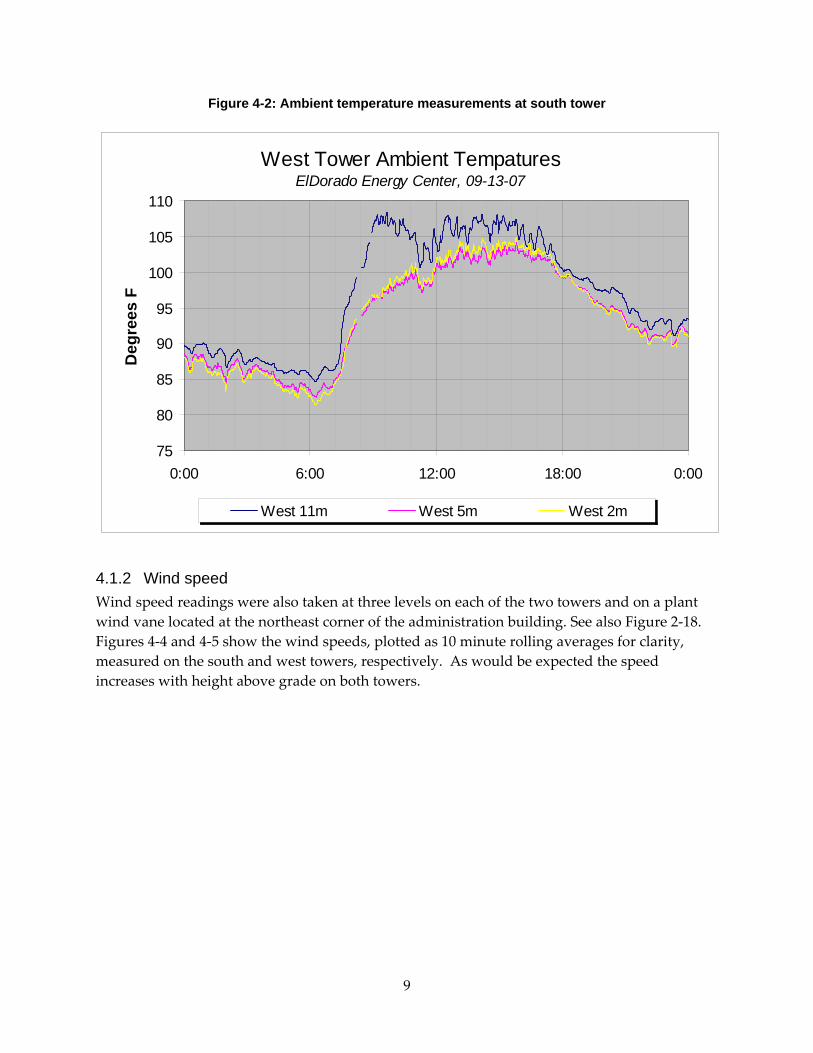
Figures 4‐2 and 4‐3 display the readings from the south and west met towers respectively at all three levels. The 11 m probe on the west tower exhibited erratic behavior on several occasions and is not considered the analyses. A comparison between the measurements from the two towers can be inferred from both the comparison of averages in Figure 4‐1 and in readings at similar levels (2 and 5 m) in Figures 4‐2 and 4‐3 shows excellent agreement. For reasons that will be discussed in later sections on wind speed and direction, the south tower will be used to define ambient temperature.
Figures 4‐2 and 4‐3 (disregarding the 11‐meter readings on the west tower in Figure 4‐3) show a modest temperature variation with height above grade. As expected, the air temperature falls slightly with elevation during the day when the ground is heated by the sun and increases slightly at night (a temperature inversion) when the ground is cooled by radiation to the night sky. During the transitions hours just after sunrise and sunset, the air temperature is essentially constant with height above grade.
The variation in ambient temperatures with height introduces a difficulty in defining a single “far‐field” ambient temperature since different fans draw from different levels in the
8
atmosphere. This variation and its effect on establishing a quantitative measure of recirculation will be discussed in a later section.
Figure 4-1: Comparison of ambient temperature measurements
Figure 4-3: Ambient temperature measurements at west tower
South Tower Ambient TemperaturesElDorado Energy Center, 09-13-07
75
80
85
90
95
100
105
110
0:00 6:00 12:00 18:00 0:00
Deg
rees
F
South 11m South 5m South 2m
9
Figure 4-2: Ambient temperature measurements at south tower
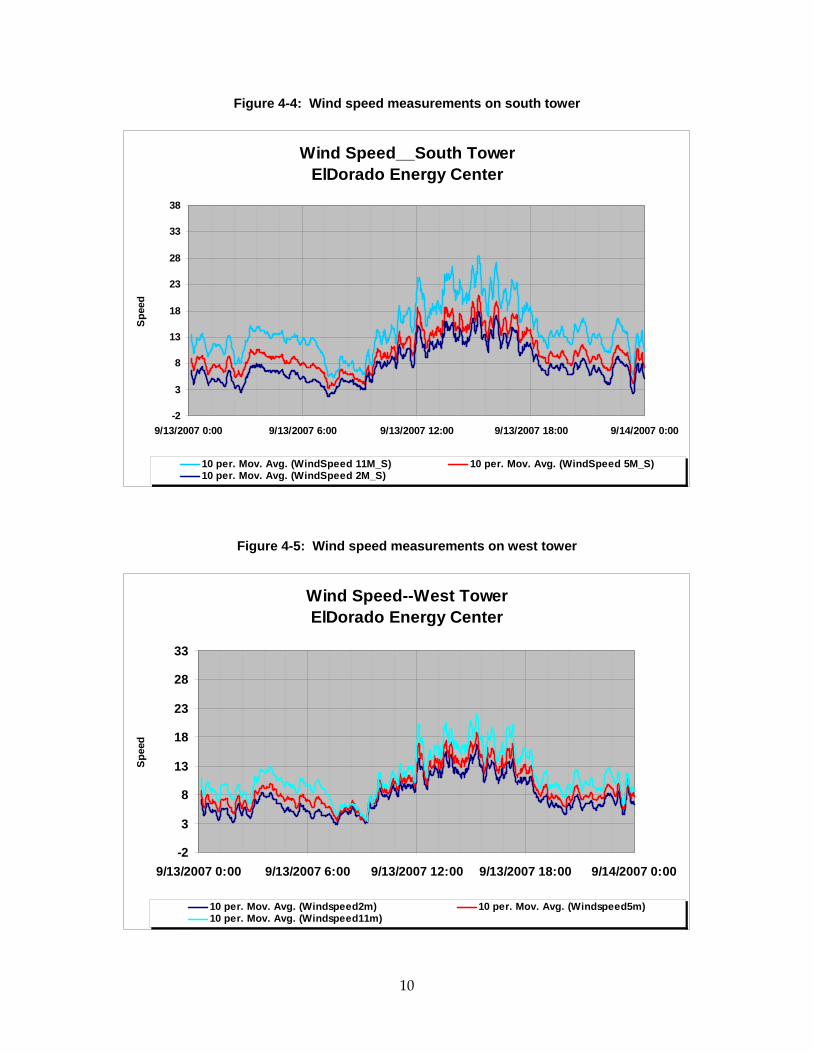
4.1.2 Wind speed Wind speed readings were also taken at three levels on each of the two towers and on a plant wind vane located at the northeast corner of the administration building. See also Figure 2‐18. Figures 4‐4 and 4‐5 show the wind speeds, plotted as 10 minute rolling averages for clarity, measured on the south and west towers, respectively. As would be expected the speed increases with height above grade on both towers.
West Tower Ambient TempaturesElDorado Energy Center, 09-13-07
75
80
85
90
95
100
105
110
0:00 6:00 12:00 18:00 0:00
Deg
rees
F
West 11m West 5m West 2m
10
Figure 4-4: Wind speed measurements on south tower
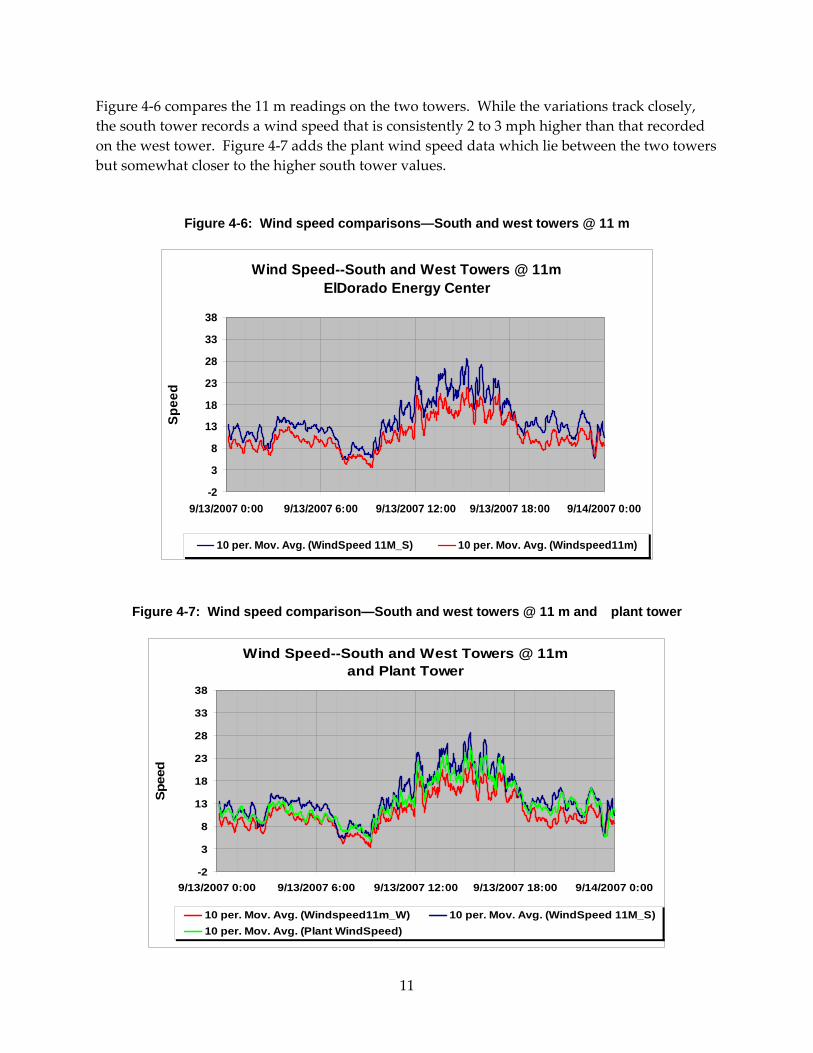
Figure 4‐6 compares the 11 m readings on the two towers. While the variations track closely, the south tower records a wind speed that is consistently 2 to 3 mph higher than that recorded on the west tower. Figure 4‐7 adds the plant wind speed data which lie between the two towers but somewhat closer to the higher south tower values.
Figure 4-6: Wind speed comparisons—South and west towers @ 11 m
Figure 4-7: Wind speed comparison—South and west towers @ 11 m and plant tower
Wind Speed--South and West Towers @ 11mElDorado Energy Center
4.1.3 Wind direction Wind direction was recorded by the plant with a wind vane anemometer located at the northeast corner of the administration building. Project data were obtained at the same locations on the two met towers as were the wind speed data.
Figures 4‐8 and 4‐9 show the wind direction readings at the 2, 5 and 11 meter levels on the south and west met towers between 4:30 pm and 10:30 pm on September 12, 2007. There is excellent agreement among measurements at different levels on each tower and between measurements at the same levels on the two towers. The level‐to‐level variation is consistently less than +/‐ 5°, and the tower‐to‐tower comparisons are essentially perfect with minor exceptions during periods of rapid change. This agreement is representative of the data throughout the test period.
Figure 4-8: Wind direction readings from south met tower
Figure 4-9: Wind direction readings from west met tower
The comparison between the wind direction recorded by the plant with 11‐meter readings from the west met tower (selected for purposes of this comparison on the basis of being closer to the plant tower and at most nearly the same level above grade) is shown in Figure 4‐10. For the most part the agreement is poor, particularly for wind directions between southwesterly and southerly. Given the location of the plant wind tower at the northwest corner of the building, winds from any direction but westerly might be expected to be distorted by the presence of the building. Therefore, the plant wind direction data will be disregarded in the analyses.
Figure 4-10: Wind direction readings from west met tower and plant wind vane
Given the erratic behavior of the 11m temperature probe on the west tower and the essential agreement between the two towers on all other measurements, the south tower is used to define the far‐field ambient conditions for the analyses.
4.2 Recirculation Recirculation is defined as the entrainment of a portion of the hot air leaving the ACC into the inlet air stream drawn by the fans from the surrounding atmosphere. This results in an average inlet air temperature to the ACC that is higher than the far‐field or ambient temperature. The physical cause of recirculation is known to be the establishment of vortices which form starting at the upstream edge of the ACC and expand in the downwind direction. The CFD modeling that was performed as part of this study provides a more detailed picture of the flow patterns leading to recirculation. This is illustrated in Figure 4‐11. As the size of the vortex grows, it becomes large enough to direct flow under the bottom of the wind walls and into the ACC air inlet region. Therefore, it is expected that the cells experiencing the greatest amount of recirculation are the downwind cells.
Figure 4-11: CFD representation of vortical flow leading to recirculation
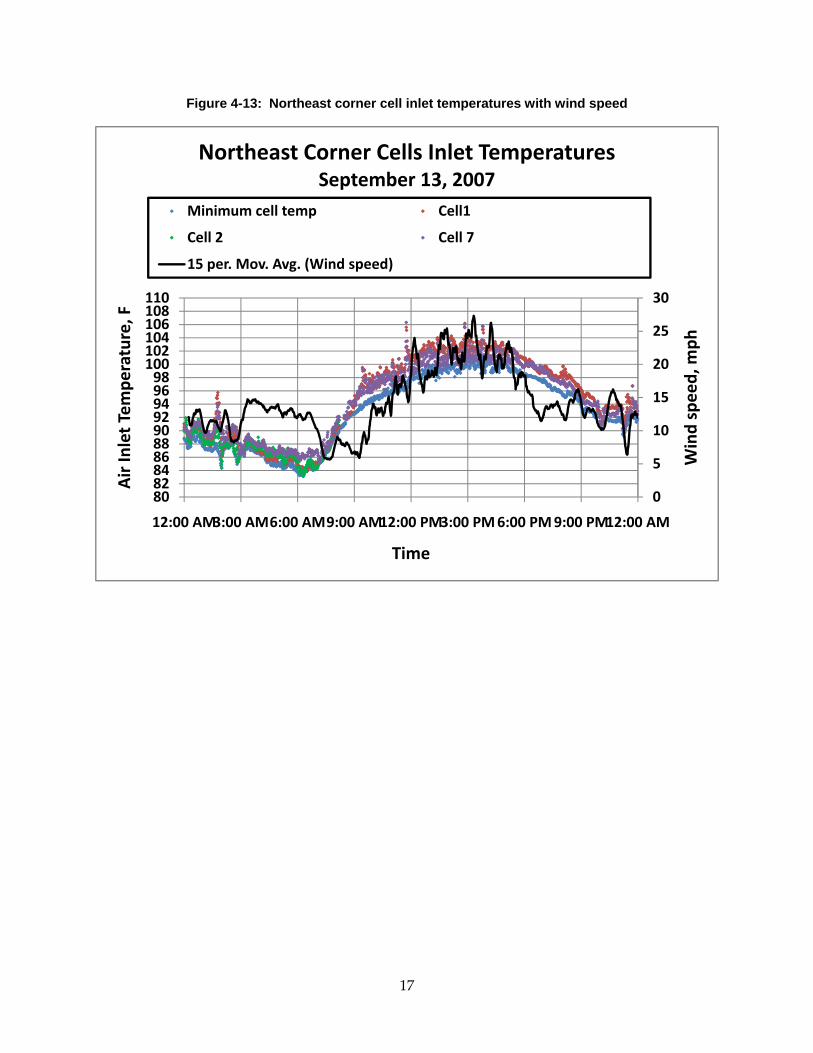
With the predominant winds on September 13 coming from the west/southwest, the greatest recirculation would be expected in the northeast corner cells (Cells 1, 2 and 7). Figure 4‐12 plots the inlet temperatures of the corner cells along with the minimum cell inlet temperature and the wind direction. Figure 4‐13 plots the same temperatures along with wind speed.
Both plots show the northeast corner cell inlet temperatures well above the minimum cell inlet temperature for the entire day. The difference is highest during the day between about 9 am and 9 pm which, as seen in Figure 4‐13, corresponds to the period of highest wind speed.
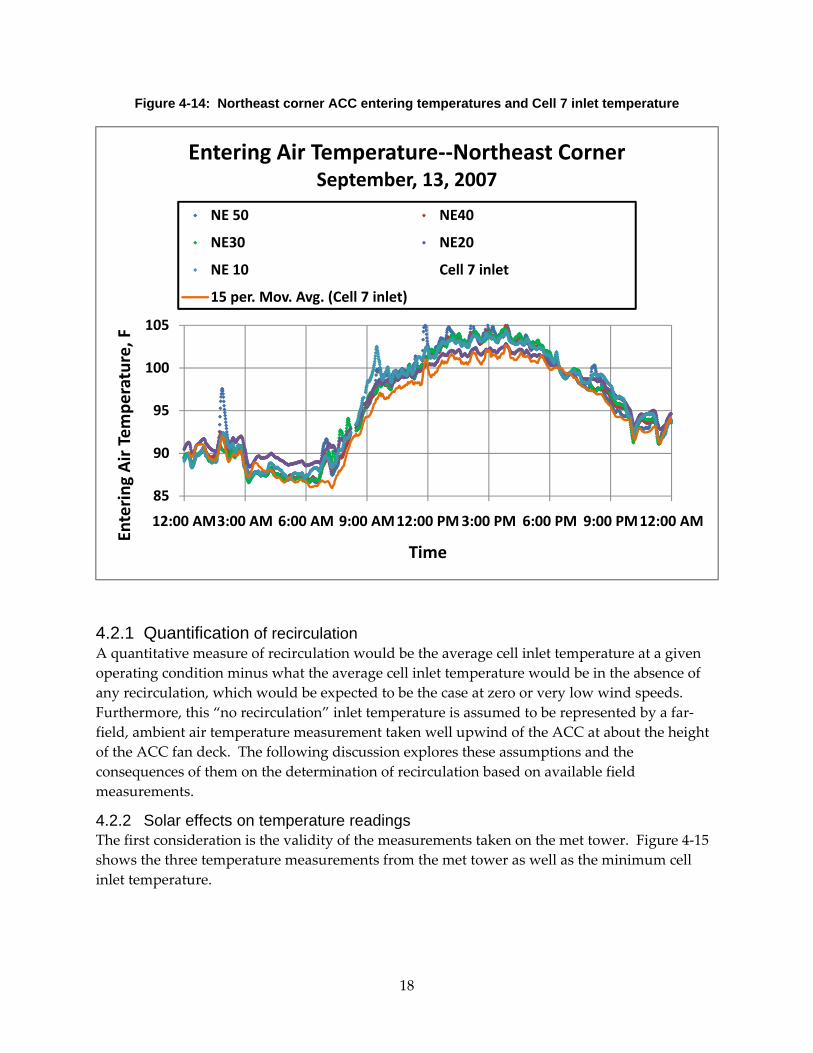
Additional temperature measurements were taken in the ACC inlet plane under Cell 7 (one cell west of the northeast corner on the north edge) at five heights from 10 feet to 50 feet above grade at 10 foot vertical spacing. Figure 4‐14 shows these temperatures along with the inlet air temperature measured above the fan in Cell 7. The plot shows air crossing the north side inlet plant under Cell 7 significantly hotter than the average inlet temperature in Cell 7 indicating a recirculating flow under the fan deck mixing with cooler inlet air from other directions. These observations are consistent with the physical picture of recirculation.
16
Figure 4-12: Northeast corner cell inlet temperatures with wind direction
Figure 4-14: Northeast corner ACC entering temperatures and Cell 7 inlet temperature
4.2.1 Quantification of recirculation A quantitative measure of recirculation would be the average cell inlet temperature at a given operating condition minus what the average cell inlet temperature would be in the absence of any recirculation, which would be expected to be the case at zero or very low wind speeds. Furthermore, this “no recirculation” inlet temperature is assumed to be represented by a far‐field, ambient air temperature measurement taken well upwind of the ACC at about the height of the ACC fan deck. The following discussion explores these assumptions and the consequences of them on the determination of recirculation based on available field measurements.
4.2.2 Solar effects on temperature readings The first consideration is the validity of the measurements taken on the met tower. Figure 4‐15 shows the three temperature measurements from the met tower as well as the minimum cell inlet temperature.
85
90
95
100
105
12:00 AM3:00 AM 6:00 AM 9:00 AM12:00 PM3:00 PM 6:00 PM 9:00 PM12:00 AM
Entering
Air Tem
perature, F
Time
Entering Air Temperature‐‐Northeast CornerSeptember, 13, 2007
NE 50 NE40
NE30 NE20
NE 10 Cell 7 inlet
15 per. Mov. Avg. (Cell 7 inlet)
19
Figure 4-15: South tower and minimum cell inlet temperature measurements (Sept. 13, 2007)
During the nighttime hours, the minimum cell inlet temperature is reasonably consistent with the met tower readings and close to the 11 m reading. As the sun comes up and for the rest of the day, the tower temperatures and the minimum cell inlet temperature diverge, suggesting a solar radiation effect on the tower probes, even though they are enclosed in aspirating psychrometers. The dip in the tower temperatures between approximately 10:30 am and 11:30 am is believed to coincide with a brief cloudy period.
At about 9 am, the measurements at the three levels on the tower have not yet diverged indicating that there is as yet no atmospheric temperature gradient. However, they are all higher than the cold cell temperature, indicating the presence of a solar radiation effect on the tower readings, which does not affect the cell inlet readings taken under the ACC and shielded from the sun. This difference is about 1.5 °F.
After 9 am until shortly before 6 pm, the temperatures at the three different levels on the met tower diverge, decreasing with increasing height above grade indicating solar heating of the ground and the creation of a low level atmospheric temperature gradient.
Figure 4‐16 is a rough extrapolation of the 2, 5 and 11 m readings on the south tower up to the level of the fan inlets. The temperatures used are the average temperatures at each level between 1 and 4 pm when the ambient temperature is reasonably constant. The lower curve is adjusted downward by about 1.5 °F to compensate for the apparent solar effect discussed
September 13 Temperatures
80
82
84
86
88
90
92
94
96
98
100
102
104
106
9/13/0712:00 AM
9/13/073:00 AM
9/13/076:00 AM
9/13/079:00 AM
9/13/0712:00 PM
9/13/073:00 PM
9/13/076:00 PM
9/13/079:00 PM
9/14/0712:00 AM
Time
Tem
pera
ture
, F
2 m South 5 m South 11 m South Cold cell
20
above. The adjusted curve extrapolates well to the measured minimum cell inlet temperature at 20 m.
Figure 4-16: Ambient temperature extrapolation to fan deck height.
The analysis demonstrates that temperature readings on the met tower cannot be used as an accurate representation of ambient temperature for the purpose of quantifying recirculation. Based on the foregoing reasoning, the decision was made to use the minimum cell inlet temperature as a surrogate for a far‐field ambient temperature at deck height.
This is consistent with previous analyses by the Electric Power Research Institute (2008) which have assumed that the far‐field ambient temperature could be equated to the lowest of all the cell inlet temperatures on the basis that no cooling mechanism existed for air approaching the tower and that all higher cell inlet temperatures must be the result of the mixing of entrained plume air into the inlet air stream. Therefore, recirculation was defined as the difference between the average inlet temperature of all cells minus the minimum cell inlet temperature.
Measurements of recirculation using this definition for all the test points for three days (September 13 – 15) of the test period are shown in Figure 4‐17.
Variation in Air Temperature with Height(Average temps from 1 to 4 pm on Sept. 13)
98
99
100
101
102
103
104
0 2 4 6 8 10 12 14 16 18 20 22 24
Height above grade, meters
Air
tem
p, F
Temp vs Height Cell Min Adjusted for Solar Power (Temp vs Height) Power (Adjusted for Solar )
extrapolated
21
Figure 4-17: Recirculation vs. Wind Speed---September 13 through 15, 2007
Two observations are noteworthy. First, there are no instances of zero recirculation and relatively few below 1°F. Second, the occurrences of high recirculation all take place at moderate wind speeds between 5 and 15 mph while measurements at higher wind speeds show lower amounts of recirculation, seldom greater than 2 °F.
Both of these observations are somewhat counter‐intuitive and may be explainable on the basis of atmospheric temperature gradients. Figure 4‐18 (from Kroger 2004) sketches a series of atmospheric temperature profiles near the ground as they change over the course of the 24‐hour day.
Recirculation vs. Wind Speed
0
0.5
1
1.5
2
2.5
3
3.5
4
4.5
5
5.5
6
0 5 10 15 20 25 30 35
Wind Speed, mph
Rec
ircul
atio
n, F
22
Figure 4-18: Atmospheric temperature gradients
Source: Kröger (2004)
The first is the normal daytime temperature profile where solar warming of the ground results in high temperatures close to the ground, decreasing with height. The second and third, typical of clear‐sky, nighttime conditions, when radiational cooling lowers the ground temperature below the air temperature, shows the evolution of an inversion layer near the ground where the air temperature increases with height above grade. The fourth shows the beginning of a re‐establishment of the daytime profile.
Figure 4‐19 (reproduced from Figure 4‐2 for convenience of reference) shows the variation in temperature with height above grade as measured on the South met tower for the full day of September 13, 2007.
23
Figure 4-19: Ambient temperature readings on South tower (from Figure 4-2)
During the nighttime hours (midnight to 7 am and 7 pm to midnight) the lower (2 m) readings are colder than the 5 m and 11 m readings, indicating an inversion layer attributable to radiational cooling of the ground. In the mid‐daytime hours (from approximately 9:30 am to 5:30 pm) the lower levels are hotter. During the transition periods (7:30 am to 9:30 am and 5:30 pm to 7:00 pm) when the ground is heating or cooling more rapidly than the air, there is little or no variation with height. This is consistent with evolutions in the temperature profiles shown in Figure 4‐18.
These profiles are most pronounced at zero and low wind conditions. Higher wind speeds tend to mix the air and create and more uniform temperature in the region near the ground.
If a temperature profile of either the daytime or nighttime type exists and the different fans on a large ACC draw air from different levels of the atmosphere, there will necessarily be a range of cell inlet temperatures. Therefore, the average will be higher than the minimum, implying by the definition of recirculation postulated previously, the existence of recirculation where none may exist.
Figure 4‐20 sketches an air flow pattern into an ACC at low speed wind conditions (3 m/s) as determined by the CFD modeling work conducted as part of this study. The CFD modeling work will be discussed in detail in Chapters 6 and 7 in this report and in companion reports van Rooyen and Kroger (2007), Owen and Kroger (2011).
South Tower Ambient TemperaturesElDorado Energy Center, 09-13-07
Figure 4-20b: ACC inlet airflow patterns at high speed wind conditions
Source: Kröger (2004)
The following resonating pertains. At low wind speeds, while there may be little or no actual physical recirculation, there may be strong, well established atmospheric temperature gradients. As the different fans draw air from different levels, they will ingest air at different temperatures giving rise to a small “apparent” recirculation.
At high wind speeds, two effects occur. First, the atmospheric temperature gradients are mixed out and the variation with height above grade is less than under low‐speed or zero wind conditions. Also, the inlet air flow patterns, as determined by CFD modeling, vary as shown in Figures 4‐20a and 4‐20b, and the range of heights from which the fans draw air is reduced. The result of both these effects is a more uniform temperature of the air being drawn into the ACC from the far‐field and variations in the cell inlet temperatures can be more confidently attributed to recirculation.
At intermediate wind speeds, both the presence of atmospheric temperature gradients and the drawing of air from different levels and the presence of some actual physical recirculation may lead to an adding‐up of “apparent” and actual recirculation to indicate a higher value accounting for the bulge in the data plot in Figure 4‐17.
4.3 Re-analysis of recirculation data The recirculation results displayed in Figure 4‐17 (where recirculation was defined as the difference between the average and minimum cell inlet temperatures) are re‐examined in light of the foregoing discussion.
Figure 4‐21 divides the results in Figure 4‐17 into three ranges of wind speed: low (0 to 7.5 mph); moderate (7.5 to 15 mph) and high (15 to 35 mph). It has been hypothesized that the
25
effect of atmospheric temperature gradients near the ground might be minimized at both the high speeds (from mixing of the atmosphere) and low wind speeds (where all fans draw from similar levels) and most prominent at moderate speeds.
Figures 4‐22a, ‐22b and ‐22c explore this hypothesis for each of the three wind speed ranges. For each data point in each speed range, the strength of an atmospheric temperature gradient is categorized by the absolute value of the difference between the 11‐meter and the 2‐meter air temperature readings from the south met tower. The points within each speed range are then sorted into two groups: a high and a low atmospheric temperature gradient group.
Figure 4‐22a displays the results for the moderate speed range where nearly all of the higher recirculation points are found. There is a clear separation with the high recirculation points all being those with a strong atmospheric temperature gradient. In the low speed range shown in Figure 4‐22b, there is a slight degree of separation suggesting that even at the lowest wind speeds, there is still some difference in the levels from which the fan draw their air. In the high speed range, shown in Figure 4‐22c, there is very little separation suggesting that there is little temperature variation with height at these wind speeds.
Figure 4-21: Segregation of recirculation data by wind speed
Effect of Atmospheric Temprature GradientModerate wind speed
Weak gradient Strong gradient
27
Figure 4-22b: Apparent effect of atmospheric temperature gradient on recirculation at low wind speeds
0.0
0.5
1.0
1.5
2.0
2.5
2.5 3.0 3.5 4.0 4.5 5.0 5.5 6.0 6.5 7.0 7.5
App
aren
t recirculation, deg F
Wind speed, mph
Effect of Atmospheric Temprature GradientLow wind speed
Weak gradient Strong gradient
28
Figure 4-22c: Apparent effect of atmospheric temperature gradient on recirculation at high wind speeds
Figure 4‐23 displays the points with low gradients over the entire range of wind speeds suggesting a gradual increase in amount of recirculation with increasing wind speeds. Figure 4‐24 superimposes the high gradient points on the plot suggesting that the “bulge” of high recirculation points is due, not to recirculation, but to an artifact or “apparent” recirculation resulting from the definition of recirculation coupled with the erroneous assumption of a single “far‐field” ambient temperature.
Figure 4-24: Apparent recirculation at times of strong atmospheric temperature gradient
4.3.1 Counter indications However, other evidence exists which is contrary to the previous analysis based on CFD results. At least two studies have been reported in which recirculation in ACC’s has been physically modeled in wind tunnel tests (Kim et al. 2011, Gu et al. 2005). Results of these tests are displayed in Figures 4‐25 and 4‐26. The results in Figure 4‐25 were obtained at the University of California at Davis and model the ACC at El Dorado which is the same unit at which the field tests were performed and for which the CFD model was developed.
The “Expected Total Re‐entrainment Rate” plotted in Figure 4‐25 is defined differently from the recirculation data presented in this report (as in Figure 4‐17). It is defined as the percentage of the exit air which is re‐entrained into the inlet flow.
The “Total Mean Recirculation plotted in Figure 4‐26 is similarly defined. The range of wind speed (approximately 4 to 7.5 m/s or 7 to 15 mph) at which the highest recirculation results were found in the field tests is indicated on the plot.
Figure 4-26:Re-entrainment rate vs. wind speed (from wind tunnel test)
Source: Kim et al. 2011
7 to 15mph
32
At this time, the question of whether recirculation is greatest at intermediate wind speeds in unresolved. Additional field and physical model data are required to confirm or modify the CFD results which indicate that different fans draw air from different levels in the atmosphere and to determine how this pattern varies with ambient wind speed. In addition, a more detailed determination of the variation in atmospheric temperature with height above grade and how it varies throughout the day should be made in future field tests.
4.4 Fan performance degradation As discussed in earlier sections, the other important element in the effect of wind on ACC performance is a reduction in air flow resulting from reduced fan performance in the presence of wind. Selected cells were instrumented with propeller anemometers suspended from the inlet screens beneath the fans to measure inlet air velocity. The location of the cells (Cells 2, 15 and 18) are shown in Figure 2‐7.The arrangement and designation of the anemometers under each cell are displayed Figure 4‐27.
Figure 4-27: Anemometer locations and designationsunder cells
2W 1W 1E 2E
2N
1N
1S
2S
N
33
Figure 4‐28 shows the average inlet velocity for each of the three cells for September 13. The data are shown as “15 minute average” trend lines for clarity. The inlet velocities in Cells 2 and 15 are relatively constant throughout the day although with significant short‐term fluctuations. Cell 18 shows much more significant variability. The fans are designed for an air flow of 1,332,000 acfm which corresponds to an inlet velocity at the shroud inlet plane of about 1,060 ft./min. Fan performance benefits from both unobstructed access to surrounding ambient air and protection from winds. The three cells differ significantly in both of these features.
Figure 4-28: Average inlet velocities for Cells 2, 15 and 18; September 13, 2007
Cell 2: Cell 2 has the highest air flow of the three cells and operates close to the design air inlet velocity. The cell is unobstructed on all four sides and is on the eastern edge of the ACC with open access to ambient air. Additionally it is in the northeast corner, and the winds are almost exclusively from the south/southwest. Therefore, the cell is protected from the wind by the cruciform screen and the entire bulk of the ACC.
650700750800850900950
1,0001,0501,1001,1501,2001,250
12:00 AM3:00 AM 6:00 AM 9:00 AM12:00 PM3:00 PM 6:00 PM 9:00 PM12:00 AM
Inlet Air Velocity, fe
et/m
inute
Time
Average Inlet Air Velocities: Cells 2, 15 and 18September 13, 2007
Cell 15: Cell 15 is in the northeast corner of the intersection of the two screens. It is, therefore, partially blocked by the screens on the south and west sides and is in the exact center of the ACC with the least open access to the surrounding ambient air. The screens provide good protection to the cell from winds from any direction with the exception of the northeast quadrant, which is almost never the direction of the winds during summer months at El Dorado.
Cell 18: Cell 18 is located on the south end of the ACC, open to the surrounding ambient air on the south side and open on the east and north sides. The windscreen partially blocks incoming air from the west side. The fan is directly exposed to winds from the southeast quadrant and partially protected from winds from the southwest quadrant. The fan performance is much more variable than that of the other two cells because of the greater exposure to varying winds. The overall performance is closer to, but slightly higher than, that of Cell 15.
Figures 4‐28 through 4‐33 enable a closer look at the detailed response of the three cells to variations in wind speed and direction.
4.4.1 Cell 2 performance Figures 4‐28 and 4‐29 display the minute by minute average air inlet velocity on Cell 2 along with the 15 minute average of the wind speed (Figure 4‐28) and direction (Figure 4‐29). The effect of wind speed on Cell 2 inlet velocity is slight but discernible. Between 9 am and 6 pm the wind speed increases, peaks around 2 to 4 pm and then declines until about 7:30 pm. From about 11 am until 7 pm the wind speed is above 15 mph. For the time when the wind speed is above 15 mph the air flow into Cell 2 declines and increases inversely with wind speed.
Figure 4‐28 shows no discernible effect of wind direction. During the period when the wind speed exceeds 15 mph and the air flow is varying slightly the wind direction is essentially constant from the west/southwest. Conversely the slight shift in wind direction from southwest to west/southwest just before 9 am causes no apparent change in the air flow.
35
Figure 4-29: Cell 2 inlet air velocity and wind speed
0
5
10
15
20
25
30
35
650
700
750
800
850
900
950
1,000
1,050
1,100
1,150
1,200
1,250
12:00 AM3:00 AM6:00 AM9:00 AM12:00 PM3:00 PM6:00 PM9:00 PM12:00 AM
Wind velocity, m
ph
Inlet Air Velocity, fe
et.m
in.
Average Inlet Velocity with Wind Speed‐‐‐Cell 2September 13, 2007
Cell 2 15 per. Mov. Avg. (Wind speed)
36
Figure 4-30: Cell 2 inlet air velocity and wind direction
4.4.2 Cell 15 performance Figures 4‐30 and 4‐31 display the minute by minute average air inlet velocity on Cell 15 along with the 15 minute average of the wind speed (Figure 4‐30) and direction (Figure 4‐31).
The air flow in Cell 15 shows essentially no variation throughout the day with wind speed or direction as the “best‐fit” linear trend‐line shows. There is a brief period in the evening from about 7:30 to 9 pm during which the variability in the air inlet velocity is significantly reduced. This seems to correspond to a period of fairly steady wind speed and very steady wind direction.
The fact that the air flow is on average significantly lower than it is in Cell 2 seems to have more to do with the blockage of air access to the fan by the proximity of the windscreens on the south and west sides of the cell than to the effect of wind on fan performance.
0
45
90
135
180
225
270
315
360
650700750800850900950
1,0001,0501,1001,1501,2001,250
12:00 AM3:00 AM6:00 AM9:00 AM12:00 PM3:00 PM6:00 PM9:00 PM12:00 AM
Wind direction, degrees
Inlet Air Velocity, fe
et.m
in.
Time
Average Inlet Velocity with Direction‐‐‐Cell 2September 13, 2007
Cell 2 15 per. Mov. Avg. (Wind direction)
37
Figure 4-31: Cell 15 inlet air velocity and wind speed
0
5
10
15
20
25
30
35
650
700
750
800
850
900
950
1,000
1,050
1,100
1,150
1,200
1,250
12:00 AM3:00 AM 6:00 AM 9:00 AM12:00 PM3:00 PM 6:00 PM 9:00 PM12:00 AM
Wind velocity, m
ph
Inlet Air Velocity, fe
et.m
in.
Average Inlet Velocity with Wind Speed‐‐‐Cell 15September 13, 2007
Cell 15 15 per. Mov. Avg. (Wind speed)
38
Figure 4-32: Cell 15 inlet air velocity and wind direction
4.4.3 Cell 18 performance Figures 4‐32 and 4‐33 display the minute by minute average air inlet velocity on Cell 18 along with the 15 minute average of the wind speed (Figure 4‐32) and direction (Figure 4‐33).
The average air flow in Cell 18 displays much more variability than the flows in Cell 2 or Cell 15.The relatively abrupt drops in average velocity as, for example, at 12:30 am, 3 am9 am, 5 pm and, more moderately, at about 10 pm and just before midnight, all seem to be associated with wind shifts from a southwesterly to a more southerly direction.
On average, the air flow is slightly higher when the wind direction is more westerly as between 9 am and about 4 pm. This would seem to be consistent with the relationship of the windscreen to Cell 18 providing more complete protection from winds from more westerly directions. This same period, however, contains a scattering of points at much lower flows, which may be related to the higher wind speeds during those hours. Wind speeds below 15 mph as from about 4 am to about 10:30 am and from about 7 pm until midnight have very few occurrences of significantly reduced air flow.
0
45
90
135
180
225
270
315
360
650700750800850900950
1,0001,0501,1001,1501,2001,250
12:00 AM3:00 AM6:00 AM9:00 AM12:00 PM3:00 PM6:00 PM9:00 PM12:00 AM
Wind direction, degrees
Inlet Air Velocity, fe
et.m
in.
Time
Average Inlet Velocity with Direction‐‐‐Cell 15September 13, 2007
Cell 15 15 per. Mov. Avg. (Wind direction)
39
Figure 4-33: Cell 18 inlet air velocity and wind speed
0
5
10
15
20
25
30
35
650
700
750
800
850
900
950
1,000
1,050
1,100
1,150
1,200
1,250
12:00 AM3:00 AM6:00 AM9:00 AM12:00 PM3:00 PM6:00 PM9:00 PM12:00 AM
Wind velocity, m
ph
Inlet Air Velocity, fe
et.m
in.
Average Inlet Velocity with Wind Speed‐‐‐Cell 18September 13, 2007
Cell 18 15 per. Mov. Avg. (Wind speed)
40
Figure 4-34: Cell 18 inlet air velocity and wind direction
Figure 4‐34 displays the minute by minute velocities of each of the eight anemometers under Cell 18. The velocities at each of the eight points are highly variable and have a lot of overlap with one another, making individual patterns difficult to discern in that plot. However, it is clear that there is a large variation in velocity from point to point under the fan. The maximum and minimum velocities differ by a factor of three nearly all of the time with excursions to almost 40% higher than, and a factor of four to five lower than, the nominal design value during some of the day.
Figures 4‐35 and 4‐36 display “15 minute averages” of the individual velocity measurements for the four points aligned in the north/south direction (Figure 4‐35) and the four in the west/east direction (Figure 4‐36).
The north/south measurements group by location with the two points north of the fan hub being consistently higher by a factor of 1.5 to 2 that the two located south of the hub. This may be due to the greater degree of protection from the predominant southwesterly winds, which the windscreen provides to the northerly half of the fan inlet area. The difference is greatest from noon to 6 pm, which corresponds to periods of highest wind speed.
0
45
90
135
180
225
270
315
360
650700750800850900950
1,0001,0501,1001,1501,2001,250
12:00 AM3:00 AM6:00 AM9:00 AM12:00 PM3:00 PM6:00 PM9:00 PM12:00 AM
Wind direction, degrees
Inlet Air Velocity, fe
et.m
in.
Time
Average Inlet Velocity with Direction‐‐‐Cell 18September 13, 2007
Cell 18 15 per. Mov. Avg. (Wind direction)
41
Figure 4‐36 shows a similar grouping with the two points west of the hub consistently higher than those to the east. This again is likely attributable to better protection of the western half of the fan provided by the windscreen.
The abrupt drops in the average Cell 18 inlet velocity described earlier in relationship to the data in Figure 4‐32 and 4‐33 are more specifically associated with abrupt drops in the velocities at points 2N and 2E.
Figure 4-35: Inlet air velocity measurement under Cell 18
Inlet Velocities on Cell 18‐‐West/East AnemometersSeptember 13, 20072W 1W 1E 2E
43
Particular wind patterns on the periphery of the ACC may be important to the performance of the edge fans. Specifically, winds from the south upon encountering the south‐facing windwall will be turned upward and downward as shown in Figure 4‐37. An anemometer was mounted on the south catwalk at the centerline of Cell 18 (See Figure 2‐15) to measure the strength of the downdraft. Figure 4‐38 indicates strong peaks in the downdraft concurrently with wind shifts toward southerly at just after 6 pm and just after 9:30 pm. Figure 4‐33 shows a significant drop in the inlet air velocity at about 6 pm and a more moderate reduction at 10 pm and another just before midnight.
Figure 4-38: Downward air velocity off south catwalk
It is clear that significant reductions in the airflow to a cell can occur at high wind speeds if the cell is exposed to the ambient wind. It was not feasible to measure the inlet velocities at all cells in order to determine the overall reduction in cooing air flow to the ACC. Nor is it possible to make measurements of the effect of air flow to a cell on the thermal performance of that cell. However, overall estimates of the relative influence of recirculation and air flow reduction will be discussed in the following chapter.
CHAPTER 5: Effect of Wind on ACC and Plant Performance 5.1 ACC Performance Both recirculation and reduced airflow adversely affect the performance of an ACC. Figure 5‐1 displays a generic set of ACC performance curves for an ACC taken from an illustrative example included in the ASME Test Code for Air‐cooled Steam Condensers (2008). The actual performance curves for the ACC at El Dorado are not included because of their proprietary nature.
Figure 5-1: Illustrative ACC performance curves
The curves are based on the assumption that the air flow through the ACC cells is equal to the design flow for the installed fans. The inlet temperature is assumed to be a uniform inlet temperature to all cells. While this may be well represented by an average temperature of all cells, this information is not normally available except during acceptance testing. Therefore, the curves are normally interpreted by using the far‐field ambient temperature as the inlet
Turbine Exhaust Pressure 3.12 in HgaInlet Temperature 49.1 F
Turbine Exhaust Steam Quality 0.932ACC Fan Power 3,945 HP
Site Elevation Sea Level (14.7 psia)
% of Design Steam Flow
120% 110% 100% 90%
45
temperature or by applying a specified recirculation allowance to estimate the effect of potential recirculation during windy periods. Recirculation results in an increased inlet air temperature, which effectively moves the operating point to the right along a curve of constant steam flow to a higher turbine exhaust pressure.
The primary effect of a reduction in airflow is an increase in the air temperature across the ACC. This reduces the driving temperature difference (the log mean temperature difference (LMTD)). Additionally, a lower air velocity across the finned surface slightly educes the air‐side heat transfer coefficient. Both effects will lead to an increased condensing temperature and, hence, turbine exhaust pressure, for a given heat load (given steam flow) in order to maintain the requisite heat transfer rate at the tube surfaces.
5.2 Relative effects of recirculation and reduced airflow The relative effects of the two mechanisms can be determined as follows. For each operating point, the ambient temperature and the average inlet temperature are known from the project instrumentation; the steam flow and the turbine exhaust pressure are known from plant data.
The ACC performance curves are used to determine the design turbine exhaust pressure for the measured ambient temperature (defined by the minimum cell inlet temperature as discussed previously) and the steam flow. The curves are also used to determine the “expected” turbine exhaust pressure using the measured average inlet temperature and steam flow to estimate the effect of the measured recirculation. The difference between the design and the expected curves is the estimated effect of recirculation on turbine exhaust pressure at each operating point. This difference is displayed in Figure 5‐2. The maximum difference, corresponding to the maximum effect of recirculation on turbine exhaust pressure is about 0.25 in Hga.
46
Figure 5-2: Effect of recirculation on turbine exhaust pressure
Finally, the recorded actual turbine exhaust pressure taken from plant records is plotted over the same operating period. As seen in Figure 5‐3, it is significantly greater than both the design and the expected turbine exhaust pressures. The difference between the actual and the expected backpressures is attributed to the effect of fan performance degradation. During the hours from noon to 6 pm it is seen to be significantly greater, by a factor of about 2 to 3, than the difference between the design and the expected curves which is attributed to recirculation.
47
Figure 5-3: Relative effects of recirculation and airflow reduction on backpressure
0
5
10
15
20
25
30
35
0
1
2
3
4
5
6
7
12:00 AM3:00 AM6:00 AM9:00 AM12:00 PM3:00 PM6:00 PM9:00 PM12:00 AM
Wind speed, m
ph
Turbine Exha
ust Pressure, in Hga
Relative Effects on ACC PerformanceSeptember 13, 2007
Design Backpressure Expected BP Plant data Wind speed
48
CHAPTER 6: Analytical Modeling of ACC Performance 6.1 Introduction The development and use of an analytical CFD (computational fluid dynamics) model of the ACC at El Dorado was an important element of the study. The project was designed to create a mutually beneficial interaction between the field testing and modeling activities; specifically:
• Background modeling work (van Rooyen and Kröger 2007) gives guidance to the set‐up and conduct of the field testing.
• The field measurements guide, refine and validate the model at one site.
• The new model provides a means for generalizing and extending the understanding gained at the test site to other sites under differing operating and ambient conditions.
This chapter and the two that follow, describe the development and structure of the model and its results (Chapter 6), present a comparison of the model results with the field measurements (Chapter 7) and illustrate the application of model to explore and evaluate a variety of means intended to mitigate the effect of wind on ACC performance (Chapter 8).
6.2 Approach to modeling The development and use of the model was conducted by Prof. D. G. Kröger and by Michael Owen, a graduate research assistant, at the University of Stellenbosch in South Africa. The work was closely coordinated with the field test program at the El Dorado Energy Center. The model development was done in several steps.
6.2.1 Collection of site, plant and ACC data One of the model developers (Owen) visited the test site and participated in the setting –up of the instrumentation and data acquisition system. In addition, Owen obtained detailed information on:
• On‐site topography,
• Site layout,
• Location and size of all near‐field structures that could affect wind patterns,
• ACC design and performance specifications,
• All relevant ACC dimensional information from drawings and direct measurement, and
• Plant operating data.
He also participated in the first few days of the testing. The Stellenbosch modeling group was then provided with all test data for the remainder of the test period.
49
6.2.2 Model formulation The formulation of the model and discussion of the results are described in greater detail in prior reports (Owen and Kröger 2011), (Gu et al. 2007) and are summarized here for convenience of reference. The initial basis for the El Dorado model was a previously developed “quasi‐two dimensional” model which had been formulated for a “generic” air‐cooled heat exchanger (van Rooyen and Kröger 2007).
The CFD code, FLUENT (2006), was used incorporating the SIMPLE (Patankar 2008) solution algorithm for pressure‐velocity coupling, the realizable k‐ε model for turbulence and the Boussinesq model for buoyancy. The modeling was carried out in a two‐step process. A global model established the flow field in the vicinity of a simplified model of the ACC. A more detailed model of the ACC in a smaller domain then used boundary conditions derived from the global model results. The improved characterization of the ACC was then inserted into the global model which was re‐run to establish improved boundary conditions. The process was repeated until satisfactory convergence was achieved.
The model of the ACC unit itself replicated the dimensional and configurational aspects of the El Dorado ACC including the number of cells, the arrangement into streets and rows, the cell dimensions and the height above the ground. The ACC model is centered in a rectangular flow domain extending 20 m (~66 feet) from all sides of the ACC and 20 m above the top of the ACC. Boundary conditions (velocity, temperature, turbulence level, etc.) were determined by the global model. The ground boundary condition is a no‐slip boundary.
The several elements of the ACC are modeled separately. Each ACC cell model includes a fan/fan shroud model, a heat exchanger model and a plenum chamber. The fan and shroud dimensions are those of the actual unit. The heat exchanger is modeled as a rectangular, porous element mounted horizontally above the fan on top of a rectangular plenum chamber with vertical sides instead of the sloping, A‐frame sides of the actual unit. The effect of modeling the actual A‐frame heat exchanger with this simplified representation was found to have a negligible effect on the numerically predicted ACC fan performance nor did it significantly affect the nature of the flow in the vicinity of the ACC.
The numerical model of the fan used the “pressure jump” model (FLUENT 2006) calibrated to match the actual fan performance specifications. The heat exchanger model uses FLUENT’s “porous zone continuum” condition (FLUENT 2006) adjusted to match the pressure loss characteristics of the finned tube bundle in the El Dorado ACC. An energy source term was added to the energy conservation equation to account for the heat transfer to the air passing through the condenser.
The model was tested under “ideal”, no‐wind conditions with uniform, parallel flow at the fan inlet and no cross‐wind to induce recirculation. The agreement between the numerical model results and the theoretically determined values based on El Dorado design information was excellent.
50
6.2.3 Model sensitivity tests The model was first exercised to determine the influence of three user‐controlled parameters on the results of a numerical simulation. The parameters tested were grid resolution, boundary proximity and global‐to‐detailed model iteration frequency.
The effect of grid resolution focused particularly on the region near the fan inlets and at the upstream edge of the fan platform where the flow separation is expected to be the most severe. A grid containing just over 2.5 million cells was found to predict the volumetric effectiveness of the ACC fans as well as grids with more cells and was adopted for all simulations.
The separation distance between the ACC and the surrounding flow domain was varied from 20 m (~66 feet) to 50 meters (~165 feet) in all directions (upstream/downstream, side‐to‐side, above) with virtually no effect on the predicted fan performance. Therefore, the original arrangement of 20 m separations was retained for all simulations.
Finally, the number of iterations back and forth between the global model simulation and the detailed ACC model was investigated to determine the degree to which the detailed model behavior would change the imposed boundary conditions from the global model. It was found that there was very little difference between the initial result and the result following one or two iterations. Therefore, the procedure of a single iteration was adopted.
6.2.4 Comparison of model results with previous model The model results were compared with the results from previous numerical work (van Rooyen and Kröger 2007). There was significant deviation between the two models in the prediction of the fan volumetric effectives of fans in the upwind row at high wind speeds. This is attributable to differences in the choice of the fan model and known deficiencies of each under conditions of high flow distortion at the fan inlet. However, the agreement between the two predictions of overall ACC thermal effectiveness (Q/Qid)3 was satisfactory across the range of wind speeds tested in both the straight flow and cross‐flow directions as shown in Figure 6‐1.
3 Q = heat transfer rate; Qid is the “ideal” rate in the absence of any recirculation or reduction in airflow
51
Figure 6-1: Comparison of thermal effectiveness results (from Figure 4.9)
Source: Owen and Kröger (2011)
6.3 Model results for El Dorado As a first step in examining the results of the model, a comparison of the predicted overall ACC performance was made with the measured performance. The chosen performance measure was steam turbine exhaust pressures at the four operating points specified in Table 6‐1. Figure 6‐2 shows the comparison between the data reported from the plant and the field test project and the predicted values of the turbine exhaust pressure for those points.
Figure 6-2: Comparison of predicted and measured steam turbine exhaust pressure (from Figure 4.7)
Source: Owen and Kröger (2011)
The general agreement with plant performance data is excellent. However, it remains to explore the agreement with the details of ACC operation in order to understand the mechanisms of recirculation vs. fan performance degradation and to determine how the results might be extended to other sites and operating conditions.
The specific information of interest from the model is the amount of recirculation and the reduction in fan performance as a function of wind speed and direction. These quantities are determined by calculations of the inlet air temperature and the inlet air flow for each of the 30 cells. These calculations were made for two primary wind directions and three wind speeds.
Figure 6‐3 displays a schematic of the El Dorado ACC, identifying the numbering convention for the individual cells and defining the “straight” and “cross” flow directions. The prevailing winds at El Dorado in the summer are from the south and southwest. The other plant structures (HRSG’s, turbine buildings, control room an administration buildings) are located directly to the north of the ACC as illustrated in Chapter 3.
53
Figure 6-3: El Dorado ACC with cell numbering convention and definition of flow directions (Figure 4.1(a))
Source: Owen and Kröger (2011)
6.3.1 Recirculation The amount and effect of recirculation is determined by the air inlet temperature to each of the 30 cells. Predictions were made for the “no wind” condition and for wind speeds at the fan deck level of 3, 6 and 9 m/s (6.7, 13.4 and 20.1 mph) in both the straight‐flow and cross‐flow directions.
Figure 6‐4 shows the cell inlet temperatures for a straight flow direction in which rows 5 and 6 are the downwind rows. Cells in rows 5 and 6 show inlet temperatures above the ambient temperature, which indicates that there is some degree of recirculation affecting the downwind portion of the ACC. The effect is modest at wind speeds of 3 and 6 m/s and increases significantly at a wind speed of 9 m/s particularly for the interior cells (Streets 2, 3 and 4)
Straight-flow
Cross-flow
54
Figure 6-4: Cell inlet temperatures for a range of wind speeds (Figure 5.6)
Source: Owen and Kröger (2011)
6.3.2 Fan performance degradation Figure 6‐5 illustrates the numerically predicted fan volumetric effectiveness (VF/VF(id))4 for each of the 30 cells at El Dorado under straight‐flow wind conditions for wind speeds of 3, 6 and 9 m/s.
Unlike recirculation which primarily affects the downwind cells, the effect of wind on fan performance is felt primarily on the upwind cells due to the distortion of the air flow at the inlet to these fans. This is seen in Figure 6‐5 where the cells in row 1 suffer the greatest loss in flow with increasing wind speed.
It is noteworthy that the cells in rows 2 and 3 are either unaffected or enjoy a slight increase with increasing wind speed. This is presumably due to the presence of the wind screen running east to west just downwind of row 3 (between rows 3 and 4) as seen in Figure 6‐1. The wind screen blocks and decelerates the flow of the wind as it approaches the screen with a resulting increase in the static pressure beneath the fans. This is consistent with the observation of a slight decrease in flow to all the cells in rows 4, 5 and 6 which are downwind of the screen, which impedes the flow and reduces the static pressure below the fans downwind of the screen.
4 VF= volumetric air flow rate: VF(id) is the “ideal” flow rate in the absence of any fan performance degradation from cross‐flow at the fan inlet.
55
Figure 6-5: Cell air flows for a range of wind speeds (Figure 5.3)
Source: Owen and Kröger (2011)
6.3.3 Combined effect of recirculation and fan performance degradation Two further questions remain to be addressed: the overall combined effect of the two mechanisms on ACC performance and the relative magnitude of the two mechanisms.
Figures 6‐6 and 6‐7 illustrate the combined effect on ACC performance on both the heat transfer effectiveness (Figure 6‐6) and the turbine backpressure (Figure 6‐7) for straight flow conditions. The no‐wind case is shown for comparison to the three wind speeds. The ambient temperature and wind speed are far‐field values taken at the fan deck level.
56
Figure 6-6: Heat transfer effectiveness for three wind speeds and straight-flow conditions (Figure 5.1(a))
Source: Owen and Kröger (2011)
Figure 6-7: Turbine exhaust pressure for three wind speeds and straight-flow conditions (Figure 5.2(a))
Source: Owen and Kröger (2011)
Figure 6‐8 displays the heat transfer effectiveness for the same conditions for a cross‐flow wind direction. It is noted that the decrease in ACC performance is slightly greater. This slight decrease in thermal effectiveness relative to the straight‐flow case is attributable to two causes.
57
First, there are effectively more upstream fans and therefore a larger number of fans experience poor inlet conditions. Second, in the cross‐flow case, fewer fans benefit from the wind screens than under straight‐flow conditions
Figure 6-8: Heat transfer effectiveness for three wind speeds and cross-flow conditions (Figure 5.1(b))
Source: Owen and Kröger (2011)
The relative contribution of recirculation and fan performance degradation is illustrated in Figure 6‐9 for straight‐flow conditions and three wind speeds.
58
Figure 6-9: Relative contribution of mechanisms of wind effects on ACC performance (Figure 5.9)
Source: Owen and Kröger (2011)
59
CHAPTER 7: Comparison of Model Results with Field Measurements Comparisons between the model results and the field test measurements can be made at several levels ranging from the overall effect of wind on ACC performance to the variations in individual cell inlet conditions. The following sections examine the comparative results for:
• The effect of wind speed on turbine exhaust pressure,
• The relative importance of recirculation and fan performance degradation on ACC performance, and
• The variation in inlet temperature and velocity over all 30 cells.
7.1 Effect of wind speed on turbine exhaust pressure As discussed in Chapter 6 (See Figure 6‐7) turbine exhaust pressures were modeled for wind speeds from 0 to 9 m/s over a range of ambient temperatures. Some pertinent results are tabulated below.
Table 7-1: Model results for backpressure vs. ambient temperature for different wind speeds
ACC performance data for a period of several months during the summer of 2004 was presented in the introduction to this report (See Figure 1‐1). Figure 7‐1 reproduces that plot with the model results showing the predicted backpressure differences between the “no wind” and the “20 mph (9 m/s)” conditions at the corresponding ambient temperature levels. Since the wind direction was variable during the summer period, the average difference between the straight‐flow and the cross‐flow predictions was used for comparison purposes. The fine structure variation in the plant data is comparable to the difference in the model results for the two wind orientations.
The agreement is excellent and suggests that the model results at the overall performance level are in satisfactory qualitative and quantitative agreement with plant operating experience.
Figure 7-1: Comparison of CFD results with plant data for effect of wind speed on turbine backpressure
7.2 Comparison of Modeled vs. Measured Cell Inlet Conditions Figures 6‐4 and 6‐5 show the CFD model results for cell inlet temperature and velocity for each of the 30 cells. The modeled conditions are for design heat load, all fans at full speed and the “straight flow” wind orientation (southerly winds from 180°). The wind speeds modeled were 3, 6 and 9 m/s (6.7, 13.4 and 20.1 mph). Field measurements at comparable conditions were obtained between 10:00 pm and 11:30 pm on September 15, 2007 as shown in Figures 7‐2. The only significant difference between the modeled and measured conditions is the ambient temperature which was 19.44 °C (67 °F) in the model and about 82 to 85 °F during the period of the comparable field measurements.
Wind Effect
2
3
4
5
6
7
8
9
70 80 90 100 110 120Ambient Temperature, F
Back
pres
sure
, in
Hga
0 to 4mph 4 to 8mph 8 to 12mph 12 to 16mph 16 to 20mph > 20mph
> 20 mph
0 to 4 mph
CFD predicted differences
61
Figure 7-2: Wind conditions for modeled/measured results
Figure 7‐3 shows the measured velocity inlet ratio for those three cells for which inlet velocity measurements were made. These are cells 2, 15 and 18 as numbered in Figure 2‐7 (El Dorado ACC Layout) corresponding to cells (5,1), (3,3) and (1,3) in the model numbering scheme shown
Wind DirectionElDorado Energy Center
0
45
90
135
180
225
270
315
360
9/15/200722:00
9/15/200722:15
9/15/200722:30
9/15/200722:45
9/15/200723:00
9/15/200723:15
9/15/200723:30
9/15/200723:45
9/16/20070:00
Dire
ctio
n Straight flow
Wind SpeedElDorado Energy Center
0
4
8
12
16
20
24
9/15/200722:00
9/15/200722:15
9/15/200722:30
9/15/200722:45
9/15/200723:00
9/15/200723:15
9/15/200723:30
9/15/200723:45
9/16/20070:00
Spee
d, m
ph
9 m/s
6 m/s
3 m/s
62
in Figure 6‐3. As discussed in Chapter 2, eight anemometers were mounted under each of the three cells to measure the vertical air velocity at the inlet to the fan shroud. The velocity ratio plotted in figure 7‐3 is defined as the average of the eight measurements divided by the design fan flow divided by the area of the fan shroud inlet.
Figure 7- 3: Comparison of modeled and measured cell inlet velocity ratios
The agreement for a nominal wind speed of 6 m/s (13.4 mph) is satisfactory for Cells 18 (1,3) and 15 (4.3) but not for Cell 2 (5,1). While the reason for this difference is not known, two possibilities might be considered. First, Cell 2 is an edge cell where air flow distortions due to areas of some separation around the bottom of the windwall are sometimes observed. Second, the fan in the neighboring cell (Cell 1 (6,1)) was sometimes operated at half‐speed or entirely off to protect a damaged fan shroud. This condition may also introduce air flow distortions in the area of Cell 1 which the model would not have captured.
Figures 7‐4 and 7‐5 provide a qualitative comparison of the inlet temperature results of the model (Figure 7‐4) and the field measurements (Figure 7‐5). Direct comparison is hampered by the difference in ambient temperature. In figure 7‐5, the ambient temperature is about 2.5 °F higher for the 20 mph case than for the 10 mph case accounting for the differences in the “No recirculation” zone. Qualitatively the model correctly divides the ACC into zones of recirculation and no recirculation similar to what was observed in the field tests. Quantitatively the precise location and the magnitude of the recirculation in the downwind recirculation zone show some differences. The measured increase in cell inlet temperature was not observed to be as great as what the model predicted. Also, the largest degree of recirculation was measured in
63
the edge cells of street 1 and Row 6 while the model predicted somewhat higher recirculation in the interior cells of Row 5. It is unclear why the interior cells should experience more recirculation and a more detailed examination of the model results would be required to understand them.
7.3 Relative effects of recirculation and fan performance degradation
As noted in Chapter 7, there is good agreement between the model and field test results on the overall effect of wind speed on ACC performance. (See Figure 7‐1) However, the conclusions regarding the variation in the relative importance of recirculation and fan performance degradation as wind speed increases do not agree. As was discussed in Chapter 5, Figure 7‐6 illustrates the increase in backpressure due to recirculation as the difference between the lower (violet) curve and the intermediate (yellow) curve and the increase due to fan performance degradation as the difference between the upper (dark blue) curve and the intermediate (yellow) curve. Figures 7‐7 shows the variation in wind speed and direction over the course of the day on September 13.
Figure 7‐6 indicates that from 9:00 am through the rest of the day the relative importance of fan performance degradation increase to a maximum until about 3:00 pm and then declines until nearly midnight. This is precisely the pattern observed in the wind speed over the same time period. During that time, the wind direction varies only slightly around the southwesterly (225°) direction which is representative of the cross flow orientation used in the model essentially removing any confounding effects of wind direction from the discussion.
Figure 7-6: Measured relative effect of recirculation and fan performance degradation during September 13, 2007
Back Pressure & ITD vs Time 09-13-07ElDorado Energy Center
3
4
5
6
7
0:00 3:00 6:00 9:00 12:00 15:00 18:00 21:00 0:00
Bac
k Pr
essu
re, "
Hg
Plant BPGEA Avg TempGEA BP Ambient
Plant BP as reported ("Hg)BP CALC1 using condensing tempGEA BP based on performance curves
All fans operated at full speed for 24 hours
Corrected BP for ACC design hedge - approx 1.5 F. Apparent BP and Plant BP align at low wind conditions from 7:00a to 9:00a, i.e. ideal wind conditions.
65
Figure 7-7a: Measured wind speed on September 13, 2007
Figure 7-7b: Measured wind direction on September 13, 2007
This is consistent with the general observation noted in Chapter 5, and illustrated again in Figure 7‐8, that the maximum amount of recirculation, from all wind directions, is observed at wind speeds from around 10 to 15 mph and that average recirculation diminishes at higher wind speeds.
The model results on the other hand suggest the opposite as seen in Figure 7‐9 (reproduced from Figure 6‐9) which shows the effect of recirculation continuing to increase up to 9 m/s (21 mph) while the effect of fan degradation appears to level off after about 6 m/s (13.4 mph).
Figure 7-8: Average and maximum recirculation on September 13, 2007
Comparison of Average and Maximum Recirculation Patterns
0.0
0.5
1.0
1.5
2.0
2.5
3.0
3.5
4.0
4.5
5.0
0 5 10 15 20 25 30 35
Wind speed, mph
Aver
age
cell
reci
rc, F
0
5
10
15
20
25
Max
imum
cel
l rec
irc, F
Avg recirc Max recirc--Sept 13
67
Figure 7-9: Model results showing relative effects of recirculation and fan performance degradation
This difference is also consistent with the observations in Figures 7‐4 and 7‐5 where the increases in recirculation at 9 m/s in the model are significantly greater that those measured in the field tests at the same wind speed and direction.
68
CHAPTER 8: Analysis of Mitigation Measures An important objective of this study is to explore design and operating ideas that have the potential to mitigate the deleterious effects of wind on ACC performance. Numerical modeling can provide a powerful tool to do so. The CFD model, developed to simulate accurately the effect of wind on the El Dorado ACC and tested against actual field data with reasonable success is used to consider modifications to the current design and to assess the value of the modifications to mitigate wind effects.
8.1 Existing wind screens The El Dorado ACC is currently equipped with porous screens extending from two to three feet above the ground to within one to two feet of the fan deck in a cruciform arrangement. The screen running north and south is located between Streets 3 and 4 and the screen running east and west is located between Rows 3 and 4 as shown schematically in Figure 6‐3. The intent is to impede the high velocity wind blowing through the space under the ACC which distorts the velocity profile at the fan inlets and creates separated regions below the windwall at the windward edge of the ACC.
The screens consist of rectangular panels arranged in four horizontal rows. The panels are high strength fabric mesh of varying porosity. The porosity of the panels varies from row to row with the higher rows more porous than the lower ones. The design is illustrated schematically in Figure 8‐1.
Figure 8-1: Schematic of El Dorado wind screen arrangement
69
A photograph of a section of the north‐south screen at the southern end of the ACC is shown in Figure 8‐2. The more transparent screen in the top row, in comparison to the more opaque ones in the lower two rows is clearly seen.
Figure 8-2: Photograph of El Dorado wind screen arrangement
A comparison run was made between the existing arrangement with screens and the ACC with no screens in place. Figure 8‐3 illustrates the difference between the current and no‐screen situation of inlet air flow to each cell for 9m/s wind in the straight flow direction.
With no screens, the air flow into every cell is reduced to a greater or lesser degree with the exception of a few cells in the last (downwind) row. The effect on the windward row is especially severe with flows being reduced by 50% or more in the upwind row.
It can be seen that the presence of the screens significantly improves the performance of the fans upwind of the east‐west screen but slightly reduces the performance of those fans downwind of the screen. The combined effect of the improvements and reductions is seen in Figure 8‐3 where the current configuration has a higher heat transfer effectiveness ratio that the no‐screen cases in both the straight‐flow and cross‐flow wind directions. It is unclear why the reduction in the
70
heat transfer effectiveness is substantially greater in the straight‐flow direction than in the cross‐flow direction.
It is noted that it was obviously impossible to obtain field data for the no‐screen condition. However, historical data from the plant records from 2002 (before the installation of the screens) was compared with similar data from 2004 (after the installation) and the reduction in turbine exhaust pressure at comparable conditions of steam flow, ambient temperature and wind speed are consistent with the differences in heat transfer effectiveness predicted by the CFD model.
Figure 8-3: Effect of wind screen on fan volumetric effectiveness (Figure 6.3)
Source: Owen and Kröger (2011)
Anecdotal information from the plant operating staff further suggested that an ancillary benefit of the screens was to mediate the effect of wind gusts which, prior to the installation of the screens, could result in rapid excursions of turbine exhaust pressure which occasionally led to turbine trips for high backpressure. The presence of the screens apparently reduced the sensitivity of the ACC and the fans to sudden increases in wind speed giving the operators time to adjust the plant load to stay below the backpressure “trip” point.
8.2 Alternative screen configurations Given the fact that the screens have a negative effect on the downwind fans some additional runs were made with alternative screen designs and locations to see if the negative effect could be reduced while maintaining the positive effect on the upwind fans. Two approaches were considered: (1) changing the porosity of the various screen levels and (2) changing the location of the screens.
71
8.2.1 Changes in screen porosity The varying porosity of the screen materials were achieved by using three different materials of different open area mesh. These were 90%, 65% and 55% open area. Samples of each screen type were tested in a wind tunnel at the University of Stellenbosch to determine appropriate loss coefficients for the flow through the screens. The results are summarized in Table 8‐1.
Table 8-1: Loss coefficients for screen materials of varying porosity (Table 6-2)
Source: Owen and Kröger (2011)
Six alternative screen designs were modeled in which the porosity at different levels was changed to see if a preferred arrangement could be found to improve the downwind conditions while maintaining the upwind benefits. The six cases are summarized in Table 8‐2.
Table 8-2: Loss coefficients for alternative screen designs (Table 6-3)
Source: Owen and Kröger (2011)
A loss coefficient of “∞” denotes a solid wall; a coefficient of “0”, an open section with no screen. Configuration 6 is the most dramatic departure from the current design with a solid wall on the first two levels and open area above the wall where the level 3 and 4 screens had been.
Figure 8‐4 shows the differences in fan volumetric effectiveness between the current arrangement and Configuration 6 for all cells. The performance improvement that the current arrangement provides to the fans upwind of the screen is reduced, but the performance of the fans downwind of the screen is improved.
72
Figure 8-4: Effect of wind screen on fan volumetric effectiveness (Figure 6.5)
Source: Owen and Kröger (2011)
Figures 8‐5 and 8‐6 show the overall effect on the heat transfer effectiveness ratio for both the straight‐ and cross‐flow orientations. In both conditions, Configuration 6 is the most effective of the six cases modeled and represents a significant improvement over the current configuration.
Figure 8-5: Effect of alternate screen designs on heat transfer performance; straight-flow (Figure 6.4(a))
Source: Owen and Kröger (2011)
73
Figure 8-6: Effect of alternate screen designs on heat transfer performance; cross-flow (Figure 6.4(b))
Source: Owen and Kröger (2011)
8.2.2 Changes in screen location Given that the current screens (and also the Configuration 6 design) benefit the upwind cells and degrade the downwind cells, additional runs were made to determine whether moving the screens downwind to create more upwind screens and fewer downwind screens would lead to improve overall performance. Figure 8‐7 shows the proposed new location for the north‐south screen. Figure 8‐8 plots the comparable heat transfer effectiveness ratios and turbine exhaust pressures for screens of the Configuration 6 design in the cross‐flow orientation. A significant improvement is obtained.
74
Figure 8-7: Modified screen location (Figure 6.8)
Source: Owen and Kröger (2011)
75
Figure 8-8: Effect of screen relocation on ACC performance (Figure 6.9)
Source: Owen and Kröger (2011)
8.2.3 Alternative approaches-horizontal lip The concept of a horizontal barrier, extending outward from the periphery of the ACC at the bottom of the windwall, has been considered in previous studies (Salta and Kröger 1995). A physical rationale for the approach is illustrated in Figure 8‐9. Some portion of the wind incident on the outside of the windwall is diverted downward and forms a wind curtain barrier to ambient air entering the space below the fan deck. This results in a separation zone on the bottom of the fan deck starting at the windward edge which can extend over the inlet area of the upwind row of fans. The effect of this can be clearly felt when standing above the fans and noting that the air exiting the upwind half of the fan is significantly less than that from the downwind half.
As indicated schematically in Figure 8‐10, a horizontal barrier turns the flow of air coming down the side of the ACC outward and moves the start of the separation zone upwind and away from the inlet area of the first row of fans. The modeled effect of such a barrier is shown in figure 8‐11 where the heat transfer effectiveness ratio is plotted vs. the width of the horizontal barrier expressed as the ratio of the barrier width to the fan diameter for wind speeds of 3, 6 and 9 m/s.
76
Figure 8-9: Upwind separation zone at base of windwall
77
Figure 8-10: Schematic of horizontal lip and its effect on the separation zone
78
Figure 8-11: Effect of horizontal barrier on ACC performance
8.3 Additional approaches While traditional approaches to mitigating the effects of wind have focused on screens or barriers to modify the air flow patterns around the ACC, alternative concepts involve leaving the wind patterns as they are and compensating for their effect by enhancing the performance of the unit itself. Two methods considered in the model study are increasing fan power and augmenting the performance of the reflux cells with the addition of a “wet‐enhanced” heat exchanger in series with the conventional, air‐cooled section of the cell.
8.3.1 Increased fan power Obviously, the performance of an ACC can be improved, under both windy and no‐wind conditions, by increasing the air flow through the finned tube bundles. This is achieved at the expense of increased fan power. Therefore, it is necessary to determine the net performance change to ensure that the increase in turbine output is greater than the required increase in fan power.
The CFD model is used to analyze this approach for both no‐wind and windy conditions. In addition, two cases were considered:
• The “all‐fans” case in which the air flow in all cells is increased, and
• The “peripheral fans” case in which the air flow is increased in only the edge cells on the basis that the edge cells are the most affected by wind.
79
Fan power increases of 5%, 12.5%, 20% and 40% were investigated. The improvement in ACC performance is shown in Figures 8‐12a and 8‐12b as the change in turbine backpressure for a fixed ACC heat load for the range of wind speeds and fan power increases.
Figure 8-12a: Turbine backpressure vs. wind speed for increased fan power; “all-fans” case
Source: Owen and Kröger (2011)
80
Figure 8-12b: Turbine backpressure vs. wind speed for increased fan power; “peripheral fans” case
Source: Owen and Kröger (2011)
Using the relationship between turbine exhaust pressure and net turbine output shown in Figure 8‐13, the net change in turbine output can be computed and is displayed in Figures 8‐14a and 8‐14b.
81
Figure 8-13: % turbine output correction vs. turbine exhaust pressure
Source: Owen and Kröger (2011)
The results indicate that for both the “all‐fans” and “peripheral fans” cases the net turbine performance can be increased with increased fan power over a range of wind speeds. The improvement is greatest at fan power increases in the range of 20% to 30% with diminishing improvement at higher fan power levels.
However, the percent increase in net turbine output is very small, of the order of 0.1%. This suggests that this is a very marginal approach which is not suitable for retrofit application to existing units. Careful design optimization to determine the optimum trade‐off between performance and operating fan power for new units should be explored in each case. In situations where variable speed fan motors are considered for other reasons, such as the ability to tailor fan power to ambient temperature conditions and plant load, there might be some slight additional benefit for mitigation of wind effects.
82
Figure 8-14: Net increase in turbine performance vs. fan-power increase for three wind speeds; (a) “all-fans case; (b) “peripheral fans” case
Source: Owen and Kröger (2011)
83
8.3.2 Wet-enhanced dephlegmator The idea of using a small amount of water to supplement the performance of a dry cooling system during periods of high ambient temperature has been proposed and investigated for many years. The various implementations of the concept have ranged from commercial installations of series or parallel, hybrid (wet/dry) systems (See, for example Owen and Kröger (2011) for a series arrangement or DeBacker and Wurtz (2003) for a parallel system) to ad‐hoc spraying of water at the air‐cooled surfaces of an ACC.
More systematic investigations of applying water as inlet spray cooling or surface wetting (deluge) systems have been conducted by the CEC (Maulbetsch and DiFilippo 2003), (Maulbetsch and DiFilippo 2006) and others (Conradie and Kröger 1991). The deluge system has been part of several commercial installations of the Hungarian Heller system (Balogh and Takacs 1998) in the Middle East and Eastern Europe but no applications are known in the U.S. Another concept, called a wet surface air cooler (WSAC), has been used on at least one full‐scale power plant in the U.S. and was described in a 2003 CEC report (Maulbetsch and DiFilippo 2002).
As part of this study, a concept which combines some of the features of these earlier approaches is proposed. It is equally applicable to both windy and calm conditions. An analysis, supplemented by laboratory testing, was conducted to determine the extent to which the performance of an ACC could be improved by the modification of the dephlegmator cells with a hybrid (dry/wet) design. A complete report on the study and the results is contained in Appendix A of this study (Heyns and Kröger 2009).
An ACC is normally designed in multiple parallel “streets” with a number of condenser cells and a single dephlegmator (or reflux) cell in each street. Figure 8‐15 sows such a street with five condenser cells and one dephlegmator cell. Steam from the turbine flows down the steam duct at the top of the cells and enters the condenser cells at the top of several (typically 10) finned tube bundles in each cell. As it flows down the tubes, it condenses and the heat of condensation is removed by the air flowing across the outer finned surface of the tubes. The condensate drains in co‐current flow with the steam. As it leaves the tubes it is collected in a horizontal condensate line from with it drains into tank and is pumped back to the boiler.
However, not all the steam is condensed in the condenser cells. Steam leaving the bottom of the condenser cells flows along the condensate line and into the bottom of the dephlegmator cells. The dephlegmator cell has finned tube bundles essentially identical to those in the condenser cells. The steam flowing up into the dephlegmator cell tubes entrains with it any air or other non‐condensables which have leaked into the steam side of the ACC. This remaining steam is condensed as it flows up the tubes and the condensate drains counter‐current to the steam into the condensate line. The non‐condensable gases are removed from the top of the dephlegmator cells by an air ejector and discharged to the atmosphere.
It is essential that some steam leave the condenser cells in order to sweep all the non‐condensables to the dephlegmator cell. Enhancing the heat transfer capability of the dephlegmator improves the performance of the entire unit by reducing the heat load on each of
84
the condenser cells and hence reducing the condensing pressure in the entire ACC and at the turbine exhaust.
This study proposes an approach to enhancing dephlegmator performance with a modified hybrid dephlegmator arrangement, as shown in Figure 8‐16. The dephlegmator is arranged in two stages. The first stage is made up of finned tube bundles, identical to those in the condenser cells but shortened to accommodate the insertion of the second stage.
The second stage consists of a bank of horizontal smooth round tubes installed above the top of the finned tube bundles as shown in Figure 8‐16. The horizontal tubes are arranged in two parallel bundles each fifteen rows deep. The flow through the tubes is in a three pass arrangement. The first pass is through the top 11 rows; the second, through rows 12 through 14; the third through the fifteenth row. The steam and non‐condensables leaving the tube bundles of the first dephlegmator stage are ducted to an inlet header to the first pass of the second stage tubes as shown in Figure 8‐17. The reduction in the number of tubes per pass is to maintain a sufficiently high velocity to entrain the condensate in the flow of non‐condensables into the exit header at the end of row 15. From there, the condensate is returned to the condensate line and the non‐condensables are discharge to the atmosphere through the air ejector.
The second stage of horizontal smooth tubes can be operated dry during periods of colder ambient temperature or wet during hotter periods. A set of spray nozzles is mounted above the tube bundles and water collection troughs are installed below. When augmented performance is required in hot weather, water is sprayed onto the top of the tube bundle, runs counter‐current to the incoming air flow and is collected in the troughs below the bundle for recycling back to the sprays. This arrangement is shown schematically in Figure 8‐17.
85
Figure 8-15: Schematic of an ACC street
Figure 8-16: Schematic of hybrid dephlegmator cell
86
Figure 8-17: Schematic of hybrid dephlegmator cell’s second stage
The full report on the study (Heyns and Kröger 2009) gives a very detailed description of the experimental work that was done to determine the heat transfer performance and the air side pressure drop of the second stage bundle in both dry and wet operation over a range of air and water flow rates. Also, extensive Appendices in that report (Heyns and Kröger 2009) present the data correlation and the design/performance relationships that were used to calculate the performance of the ACC condenser cells, the original dephlegmator cell and the hybrid cell to develop overall performance comparisons. The results are summarized and discussed below.
The comparisons are between a “3‐street” (18 fans) ACC and the same configuration with the conventional dephlegmator replaced with the hybrid design. In addition comparisons were made with “4‐street” (24 fans) and “5‐street” (30 fans) ACC’s to give context to the equivalent increase in size that would be required to provide equal performance to that of the “enhanced 3‐street” ACC with the hybrid dephlegmator cell. A final comparison was made to estimate the water consumption of the hybrid dephlegmator design with what would be required for a conventional ACC with inlet air‐cooling sufficient to match the hybrid design’s performance.
The inlet air‐cooling approach refers to the spraying of water into the inlet air stream of an ACC, either just below or just above the fans. The evaporating droplets cool the air in a process called adiabatic cooling along a line of constant wet‐bulb temperature on the psychometric chart. Cooling systems of this type have been posed and studied for many years by Conradie and Kroger (Conradie and Kröger 1991) among others. More recently at least two field studies
87
of this approach on operating ACCs have been reported (Maulbetsch and DiFilippo 2003), (Maulbetsch and DiFilippo 2006).
These performance comparisons are shown in Figures 8‐18 through 8‐21. Figure 8‐18 illustrates the turbine performance curve used to relate the cooling system performance to the turbine output through the achievable condensing temperature at design conditions. It should be noted that this turbine exhibits a significant drop‐off in output between a condensing temperature of 55°C and 40°C. This corresponds to a drop‐off between turbine exhaust pressures of about 4.5 in Hga to 2.1 in Hga which is unusual for modern utility turbines. However, the relative turbine performance among the several cooling system alternatives should be internally consistent and illustrative of the cooling system merits.
Figure 8-18: Turbine power output vs. condensing temperature
The initial comparison among the three sizes (3‐, 4‐ and 5‐street) ACCs with conventional dephlegmators in all‐dry operation is shown in Figure 8‐19.
88
Figure 8-19: Performance comparisons among ACC’s of different size
The inversion in the expected performance levels at ambient temperatures below approximately 20°C is related to the unusual turbine curve shown in Figure 8‐18 and discussed above. The larger ACC’s achieve lower condensing temperatures and turbine exhaust pressures at all ambient temperatures. At the higher temperatures this improves turbine performance as expected. At the lower temperatures, however, the turbine performance is degraded. In actual operation, were this to be the case, fans would be turned off both to increase the turbine exhaust pressure and to conserve operating power. However, in the following analyses, the comparisons are for “all fans ON” at all times.
Figure 8‐20 shows the performance curves for four different cooling systems. They are:
• A 3‐street ACC of conventional design,
• A 4‐street ACC of conventional design,
• A 3‐street ACC of conventional design with inlet air cooling, and
• An “enhanced 3‐street” ACC with a hybrid dephlegmator.
89
The important feature to note is that both the hybrid design and the inlet air cooling applied to a 3‐street ACC give comparable performance at the higher temperatures to the larger (4‐street) ACC on conventional design.
Figure 8-20: Performance comparisons among four different systems
While the hybrid dephlegmator and the inlet air cooling systems exhibit similar performance, the water consumption rates are significantly different with the hybrid design using much less water, as seen in Figure 8‐21. This results from the fact that much of the water in the inlet air cooling system falls out of the air stream and does not contribute to the cooling of the air entering the finned tube bundles. This water falls to the ground or wets the structure and is unrecoverable to the system.
90
Figure 8-21: Comparative water use between hybrid and inlet air cooling systems
8.3.3 Summary No information is available on the cost or O&M requirements for the hybrid dephlegmator so no cost comparisons can be made with other approaches. However, the costs of conventional ACC’s are known and can reasonably be scaled in proportion to the number of cells. Therefore the 4‐street ACC would be approximately 1/3 more expensive than the 3‐street. At an approximate “per cell” cost of $800,000 (EPRI 2011b), the additional 6 cell street would add nearly $5,000,000 to the baseline 3‐street ACC.
A study of inlet air cooling (Maulbetsch and DiFilippo 2006) included conceptual design and cost estimates of a system for both a 30‐cell and a 40‐cell ACC although for very different turbine size, turbine performance characteristics and ambient conditions from the current study. However, the likely cost range for an inlet air cooling system for the 3‐street ACC with 18 cells would be no more than $1,000,000.
It seems likely that the cost of the three modified dephlegmator cells would be considerably less than that for the 4‐street ACC but perhaps more than that for the inlet air cooled system, although this estimate is entirely speculative at this time.
91
CHAPTER 9: Summary and Conclusions 9.1 Summary A study of the effect of wind on the performance of air‐cooled condensers for power plant cooling was conducted on the ACC at the El Dorado Energy Center. The work included both field testing and computational modeling. The field tests measured ambient temperature, wind speed and wind direction as well as velocity and temperature patterns underneath and at the perimeter of the ACC. In addition, ACC and plant operating data on plant output, steam flow, and turbine exhaust pressure were obtained from plant records.
The model results and test measurements of cell inlet air temperatures and velocities are compared. The model results are also compared to plant performance data. Evaluations were made of mitigation strategies to offset the effect of wind including wind screens in differing locations, perimeter screens and lips, a wet enhanced dephlegmator and additional fan power.
9.2 Conclusions Conclusions of the study are summarized as follows:
• The predominant effect of wind on ACC performance is fan performance degradation coupled with a lesser effect of hot air recirculation.
o Fan performance degradation
Cross‐flows over the fan inlet planes resulted in flow reductions of as much as 30% to 60%.
o Recirculation
Recirculation typically caused the average inlet temperature to exceed the ambient temperature by no more than 3 to 6 °F at wind speeds from 7 to 15 mph falling off to approximately 2°F at the higher wind speeds.
Uncertainty remains over the variation in recirculation with wind speed. Field measurements show a maximum recirculation at intermediate wind speeds followed by a decrease as higher speeds. CFD model results show a monotonic increase with no intermediate maximum
o Combined effect
Together these effects could cause the turbine exhaust pressure to be 2 to 2.5 in Hga above the level expected from ACC performance curves for the same steam flow and ambient temperature.
• CFD model results
92
o The CFD model predicts a reduction in ACC effectiveness of up to 12% for wind speeds up to 9 m/s (21 mph). The predicted increase in turbine exhaust pressure of up to 2.5 in Hga for winds of 20 mph at ambient temperatures of 100°F is in good agreement with field test and plant records.
o The agreement between predicted and measured cell inlet temperature and airflow patterns is satisfactory.
• Four approaches to mitigating wind effects were analyzed:
o Wind screens of the type and arrangement of those at El Dorado improve the ACC performance consistent with historical plant observations.
o The performance of cells upwind of the screens is improved while that of cells downwind of the screens is slightly degraded.
o Relocating the north/south screen one street downwind from its present position is predicted to further improve overall ACC performance.
o A proposed new screen design with a solid wall for the lower half of the screen and open area on the top half is predicted to improve performance over the existing design.
o A horizontal lip around the ACC at the fan deck level of a width equal to 1/3 of the fan diameter is predicted to improve performance significantly over the entire range of wind speeds.
o Increasing fan power is not found to be an effective approach to offsetting the effect of wind.
• Wet augmentation of ACC performance
o A wet‐augmented dephlegmator cell provides significant overall improvement. A 3‐street (18 cell) ACC with a wet dephlegmator is predicted to have equal performance of a 4‐street (24 cell) ACC of conventional design.
9.3 Recommendations • Additional field or wind tunnel testing should be pursued to resolve the difference with
CFD results on the variation in recirculation with wind speed.
• Further analytical and test work on the effect of alternate wind speed configurations should be conducted with guidance from CFD analysis.
• In light of reports of fan blade damage and failure on ACC’s in windy environments, more thorough analysis of the air patterns, fan inlet velocities and static pressure differences across the fans and the effect of possible protective measures such as shroud or windscreen design should be undertaken.
93
REFERENCES
American Society of Mechanical Engineers (ASME). 2008. Air‐Cooled Steam Condensers. New York, NY. ASME PTC 30.1‐2007.
Balogh, A. and Z. Takacs. 1998. Developing Indirect Dry Cooling Systems for Modern Power Plants. Indian Journal of Power and River Valley Development, 47th Annual Issue on Power.
Conradie, T. A. and D. G. Kröger. 1991. Enhanced Performance of a Dry Cooled Power Plant Through Air Precooling. Proceedings of ASME International Joint Power Conference, ASME Paper No. 91‐JPGC‐Pwr‐6, ASME, New York, NY.
Cooling Technology Institute (CTI). 2006. Test Code for Air‐cooled Condensers. (Draft) ATC‐107 (06). January
DeBacker, L. and W. Wurtz. 2003. Why Every Air‐Cooled Steam Condenser Needs a Cooling Tower. Cooling Technology Institute Paper No. CTI‐TP‐03‐01.
Electric Power Research Institute (EPRI). 2005. Air‐Cooled Condenser Design, Specification and Operation Guidelines. Palo Alto, California, Report #1007688.
Electric Power Research Institute (EPRI). 2011a. A Wind Tunnel Study of Wind Effects on Air‐Cooled Condensers. Palo Alto, CA: 1028762 (Technical Update). December.
Electric Power Research Institute (EPRI)b. 2011b. Economic Evaluation of Alternative Cooling Technologies Palo Alto, CA: 1024805. December.
Heyns, J. A. and D. G. Kröger. December 2009. Performance characteristics of an air‐cooled steam condenser incorporating a hybrid (dry/wet) dephlegmator. Institute for Thermodynamics and Mechanics (ITM), University of Stellenbosch, South Africa. Report No. DGK 1/12/2009.
Kim, Daeseong , Bruce White and John C. Bachman. 2011. A Wind‐Tunnel Study of Wind Effects on Air‐Cooled Condensers. Prepared for EPRI. November.
Kröger, D. G. 1998. Air‐Cooled Heat Exchangers and Cooling Towers.
Kröger, D. G. 2004. Air‐Cooled Heat Exchangers and Cooling Towers. Penwell Corp., Tulsa, OK.
Maulbetsch, J. S. and M. N. DiFilippo. 2002. Comparison of Alternate Cooling Technologies for California Power Plants: Economic, Environmental and Other Trade‐offs. EPRI, Palo Alto, CA, and California Energy Commission, PIER Energy‐Related Environmental Research Program. CEC‐ P500‐02‐079F.
94
Maulbetsch, J. S. and M. N. DiFilippo. 2003. Spray Cooling Enhancement of Air‐Cooled Condensers. EPRI, Palo Alto, CA, California Energy Commission, PIER Energy‐Related Environmental Research Program, and Crockett Cogeneration, Crockett, CA. CEC‐ P500‐03‐109F.
Maulbetsch, J. S. and M. N. DiFilippo. 2006. Inlet Air Spray Cooling Enhancement for Air‐cooled Condensers. California Energy Commission, PIER Energy‐Related Environmental Research. CEC‐500‐2006‐XXX, In press.
Maulbetsch, J. S. and M. N. DiFilippo. 2008. Effect of Wind on the Performance of Air‐Cooled Condensers. PIER Energy‐Related Environmental Research Program. CEC‐500‐2008‐XXX, In press.
Owen, M. T. F. and D. G. Kröger. December 2009. A numerical investigation of air‐cooled steam condenser performance under windy conditions. Presentation No. OP2, Presented at 14th IAHR Cooling Tower and Air‐cooled Heat Exchanger Conference, University of Stellenbosch, Stellenbosch, South Africa.
Owen, M.T.F. and D.G. Kröger. 2011. Numerical Investigation of Air‐Cooled Steam Condenser Performance Under Windy Conditions. California Energy Commission, PIER Energy‐Related Environmental Research Program. CEC‐500‐2011‐021.
Patankar, S. V. 2008. Numerical Heat Transfer and Fluid Flow. Taylor & Francis (ISBN 978‐0891165224).
Salta, C. A. and D. G. Kröger. 1995. Effect of inlet flow distortions on fan performance in forced draft air‐cooled heat exchangers. Heat Recovery Systems and CHP, Vol. 15, No. 6, pp. 555 – 561.
van Rooyen, J. A., and D. G. Kröger. 2007. Performance Trends of an Air‐Cooled Steam Condenser Under Windy Conditions. California Energy Commission, PIER Energy‐Related Environmental Research Program. CEC‐500‐2007‐124.
VGB Technische Vereinigung der Grosskraftwerksbetrieber E. V. 1997. VGB Guideline Acceptance Test Measurements and Operation Monitoring of Air‐Cooled Condensers under Vacuum. VGB‐R 131.
Zhifu Gu, Hui Li, Wenhong Zhang, Yan Li and Jiye Peng. 2005. Wind tunnel simulation on re‐circulation of air‐cooled condensers of a power plant. J. Wind Engineering and Industrial Aerodynamics, Vol. 93, pp. 509‐520.
Zhifu Gu, Xuerei Chen, William Lubitz, Yan Li and Wenlin Luo. 2007. Wind tunnel simulation of re‐circulation in an air‐cooling system at a large power plant. Int. J. Thermal Sciences, Vol. 46, No. 3, pp. 308‐317.