U. S. Department of Commerce National Bureau of Standards Research Paper RP1938 Volume 41, December 1948 Part of the Journal of Research of the National Bureau of Standards Effect of Boron on the Hardenability of High-Purity Alloys and Commercial Steels By Thomas G. Digges, Carolyn R. Irish, and Nesbit L. Carwile A study was made of the action of boron in relation to the hardenability of high-purity alloys varying in carbon content. The effectiveness of boron in enhancing the hardenability of these alloys and certain steels is believed to be due to its action in retarding; the rate of nucleation of ferrite and carbide while in solid solution in austenite. The hardenability of the boron-treated alloys, as determined in terms of the critical cooling rate of small specimens austenitized at a wide range of temperatures, varied with the prior history and with the carbon content. The hardenability of a commercial boron-treated steel, as determined by the end-quench test, was also sensitive to prior thermal treatments. Boron was lost in the decarburized zone of commercial steels, and its rate of diffusion apparently is of the same order of magnitude as that of carbon. The heat treatment of specimens of the alloys and steels to produce a boron constituent and the microstructures of the alloys as cast and as homogenized are described. I. Introduction In a previous investigation [I], 1 evidence was obtained that the effectiveness of boron in en- hancing the hardenability of certain steels de- pended upon the form of the boron at the time of quenching and not necessarily on the total amount of boron present. This observation was based on a determination of hardenability by the end-quench test. As the study was carried out during a period of national emergency, but little attention could be given to the mechanism of the effect of boron on hardenability. The present investigation was made as a further study of the hardenability of boron-treated alloys and steels with particular attention directed to the action of boron on the hardenability of these materials. High-purity alloys consisting of: (1) iron and boron, (2) iron and carbon, without and with boron, and (3) iron, carbon, and manganese, without and with boron were prepared in the laboratory, and commercial open-hearth steels were procured for use in this investigation. De- termination was made of the hardenability in terms of the critical cooling rate of the iron-carbon i Figures in brackets indicate the literature references at the end of this paper. and iron-carbon-manganese alloys when quenched from various temperatures. The end-quench test also was used for evaluating the hardenability of the iron-carbon-manganese alloys and the com- mercial steels. A metallographic study was made of specimens prepared from the alloys in the con- ditions as cast, as forged and homogenized, and as heat treated in various ways to precipitate a boron constituent. Experiments also were made to determine whether boron was lost during the de- carburization of commercial steels and for deter- mining the rate of diffusion of boron in austenite of these steels. II. Previous Investigations Considerable work has been carried out by different investigators in studying the iron-boron equilibrium system. The published diagrams [2, 3], however, were of little value in the present study because of inconsistencies, especially in the solubility of boron in the alpha and gamma fields, and deficiency in information on alloys containing the relatively low amount of boron now used com- mercially in boron-treated steels (0.0005 to 0.005 percent of boron). The action of boron in increasing the harden- Boron-Treated Alloys 545
Transcript
U. S. Department of CommerceNational Bureau of Standards
Research Paper RP1938Volume 41, December 1948
Part of the Journal of Research of the National Bureau of Standards
Effect of Boron on the Hardenability of High-Purity Alloysand Commercial Steels
By Thomas G. Digges, Carolyn R. Irish, and Nesbit L. Carwile
A study was made of the action of boron in relation to the hardenability of high-purityalloys varying in carbon content. The effectiveness of boron in enhancing the hardenabilityof these alloys and certain steels is believed to be due to its action in retarding; the rate ofnucleation of ferrite and carbide while in solid solution in austenite. The hardenability ofthe boron-treated alloys, as determined in terms of the critical cooling rate of small specimensaustenitized at a wide range of temperatures, varied with the prior history and with thecarbon content. The hardenability of a commercial boron-treated steel, as determined bythe end-quench test, was also sensitive to prior thermal treatments. Boron was lost in thedecarburized zone of commercial steels, and its rate of diffusion apparently is of the sameorder of magnitude as that of carbon. The heat treatment of specimens of the alloys andsteels to produce a boron constituent and the microstructures of the alloys as cast and ashomogenized are described.
I. Introduction
In a previous investigation [I],1 evidence wasobtained that the effectiveness of boron in en-hancing the hardenability of certain steels de-pended upon the form of the boron at the time ofquenching and not necessarily on the totalamount of boron present. This observation wasbased on a determination of hardenability by theend-quench test. As the study was carried outduring a period of national emergency, but littleattention could be given to the mechanism of theeffect of boron on hardenability. The presentinvestigation was made as a further study of thehardenability of boron-treated alloys and steelswith particular attention directed to the action ofboron on the hardenability of these materials.
High-purity alloys consisting of: (1) iron andboron, (2) iron and carbon, without and withboron, and (3) iron, carbon, and manganese,without and with boron were prepared in thelaboratory, and commercial open-hearth steelswere procured for use in this investigation. De-termination was made of the hardenability interms of the critical cooling rate of the iron-carbon
i Figures in brackets indicate the literature references at the end of thispaper.
and iron-carbon-manganese alloys when quenchedfrom various temperatures. The end-quench testalso was used for evaluating the hardenability ofthe iron-carbon-manganese alloys and the com-mercial steels. A metallographic study was madeof specimens prepared from the alloys in the con-ditions as cast, as forged and homogenized, and asheat treated in various ways to precipitate a boronconstituent. Experiments also were made todetermine whether boron was lost during the de-carburization of commercial steels and for deter-mining the rate of diffusion of boron in austenite ofthese steels.
II. Previous Investigations
Considerable work has been carried out bydifferent investigators in studying the iron-boronequilibrium system. The published diagrams[2, 3], however, were of little value in the presentstudy because of inconsistencies, especially in thesolubility of boron in the alpha and gamma fields,and deficiency in information on alloys containingthe relatively low amount of boron now used com-mercially in boron-treated steels (0.0005 to0.005 percent of boron).
The action of boron in increasing the harden-
Boron-Treated Alloys 545
ability of steel is not definitely known, but tenta-tive explanations have been reported in the litera-ture. These theories may be classified on thebasis that the improvement is due to boron insolid solution in austenite, and a reaction of boronwith some other element to change the conditionof the latter.
Grange and Garvey [4] assumed the presence ofboron in steel in both an effective and an ineffec-tive form. The effective form is capable of dis-solving in austenite, whereas the ineffective borondoes not enter into austenite solid solution. Thesmall boron atom is pictured as forming aninterstitial solid solution with gamma iron. Theboron atoms are preferentially located in thegrain boundaries of the austenite just prior to itstransformation, and their presence lowers the rateof grain boundary nucleation and thus increaseshardenability. As boron has a relatively lowsolubility in austenite, some of the boron atomsmay be precipitated as some compound and thusform a "film" at the austenite grain boundariesthat is supersaturated with respect to these atoms.This precipitate seemingly occurs rapidly and inadvance of the usual transformation of austeniteto ferrite; only those boron atoms that remain insolid solution are effective in decreasing the rateof nucleation of ferrite and hence in increasing thetime required for austenite to transform. Heatingsteel at a high temperature for a long time mayconvert effective into ineffective boron; the lattermay be some stable chemical compound of boronthat gradually forms at high temperature. Lip-pert [5] stated that boron, similar to any otheralloying element, must be in solid solution to beeffective in increasing hardenability.
Chandler and Bredig [6] were of the opinion thatnitrides act as nucleating agents in the decom-position of austenite, particularly for the rejectionof ferrite. The hardenability effect of boron,either alone or in combination with other ele-ments, appears to be the influence of a fluxingagent upon the particle size of nitrides of otherelements, such as those of silicon, aluminum,titanium, and zirconium. Thus boron convertsparticles of harmful critical size into particles oflarger size unable to effect nucleation. Corson [7]assumed that boron increases hardenability by itsaction in removing something in the steel (possiblyfree nitrogen) that exists in very small amounts byweight and which has a deleterious effect on
hardenability. Bain [8] apparently was of theopinion that boron has little effect as an alloyingelement but more likely acts as a sort of cleansingagent, perhaps in some connection with thenitrogen content of the steel. Dean and Silkes [9]were inclined to believe that the effect of boron onhardenability was due to a dispersion rather thana solution in austenite. Presumably the boron inexcess of the small amount required for maximumhardenability reacts with some other constituentin the steel.
Digges and Reinhart [1] found no definitecorrelation between the amount of boron addedor retained in experimental (induction melted)and commercial open-hearth steels and the harden-ability as determined by the end-quench test.In many of the aluminum-killed experimentalsteels, the optimum hardenability was obtainedwith small additions of boron (0.001 % or lessretained), whereas in other steels the harden-ability increased continuously with increase inboron (about 0.0015 to 0.006 %) . In still othersteels, the addition of boron as a simple or com-plex intensifier was either without effect or im-paired the hardenability. The hardenability ofboron-treated steels varied also with the state ofdeoxidation and with the nitrogen content. Highacid-soluble nitrogen (sulfuric acid) was usuallydetrimental to the effect of boron on hardenability,but it was possible to retain the effect in high-nitrogen steels (low-soluble nitrogen) by fixingthe nitrogen with strong nitride-forming elements,such as titanium. With the commercial boron-treated steels, the magnitude of the harden-ability effect was independent of the amount ofboron added or retained and the chemical composi-tion of the intensifies used.
Boss [10] speculated that boron increases harden-ability of steel by the removal of the last trace ofoxygen, but boron itself is harmful to harden-ability; a small amount of oxygen is also detri-mental to hardenability. Grossmann [11] sug-gested the possibility of the boron being present,at least in part, as stable carbides.
III. Alloys and Steels Used
The chemical compositions of the high-purityalloys and the steels used are given in table 1.
In preparing the alloys, one lot of electrolyticiron was used as the base material. Melting was
546 Journal of Research
Identification
TABLE 1. Chemical composition of the alloys and steels used
Percentage by weight as determined—
Chemically
C M n p S Si B
Spectrographically *
Mn Si Ni Co Cu Al Cr B
By vacuum fusion
O N
IRON-BORON ALLOYS
B3B4
<0.01
B8B6B7B12B2___ . .BIOB5
0.32.3250
.54
.4770
.74
— <0.001 0.002 —
0. 0028.011
0.002.002
<0.01 0.013.012
IRON-CARBON ALLOYS
2 None0.0021NoneNone.0020None.0028
0.002.002.001.002.001.002.002
<0.01
.002
.002
.025
0.013.011.010.010.013.009.011
0.008.008
0.008.008.007.007.008.007.007
0.003.004
0.002.001.001.002.001.003.001
0.003<.001
<0.001<.001
0.011.008
0.001 0.0001.0003
0.001.001
3ND<.001
ND.008
< 0 0 1
<0. 001<.001
ND<.001
ND<001<.OO1
3ND
NDND
0. 0004
IRON-CARBON-MANGANESE ALLOYS
B13B14
C15C9Cll . . .C12C14C19
0.42.41
.043.43.42.43.4343
0.67.64
1.581.581.591.561.591 58
<0.001.<. 001
0.020.019.019.020.018019
0.002.002
0.019.019.018.019.019018
0.087.096
0.31.32.32.31.3231
None0.0024 0.68
0.11.09
0.012.010
COMMERCIAL STEELS
5 None0.0003.0011.0022.00360001
— —
0.008.008
4
—
0.001.001
0.041.003
- - -
<0. 001ND
. . .
ND0.0025
0.0004.0014.0020
-.0040.0003
0.003.003.002.001.004.001.005
0.001.001.001.001.001.0005.001
0.0003.0003.0002.0001.0003.0004.0004
0.002.001
0.001.001
0.0001.0001
1 V, Mo, Sn, and W were searched for in all of the alloys and Ti and Zr in most of the alloys. These elements were not detected, but a small amount of Bewas found in B13.
2 None denotes not added.3 l^D denotes not detected.4 Split open hearth heat. The boron additions were made with Grainal No. 79 (C9 and Cll), Ferroboron (C12 and C14), and Grainal No. 1 (C19) in the
mold.8 Trace (less than 0.0001 %)boron was detected by chemical analysis.
by induction heating of the charge in crucibles ofhigh-purity magnesia, except for the two alloyscontaining manganese (B13 and B14), which weremelted in commercial crucibles of beryllia. Ad-ditions as required were made of carbon and elec-trolytic manganese in the initial charge, whereasthe boron was added to the molten metal as com-mercial ferroboron containing about 12 percentof boron. The heats were not deoxidized withaluminum or silicon. Melting and subsequentsolidification of the ingot were carried out in vacuoobtained by means of a mechanical vacuum pumprated to attain a vacuum of 0.02 \x of mercury.In most cases, the system was vacuum tight aswas indicated by the manometer after standing
for 12 to 15 hr. without operating the pump. Theboron additions were made by means of a specialholder without disturbing the vacuum.
The manganese, nickel, and cobalt contentswere approximately the same for each alloy, exceptfor two (B13 and B14) in which the manganesewas intentionally added. These impurities find thesulfur and phosphorus contents, as determined forseveral of the alloys, were about the same as thosecontained in the electrolytic iron used as the basematerial. In some cases, there was some pick-upin silicon and aluminum (incident to the meltingoperation) especially in the alloys prepared in thecommercial crucibles. The results of the vacuumfusion analyses showed that the oxygen and nitro-
Boron-Treated Alloys 547
gen contents of the alloys were low except for therelatively high values for oxygen of the two iron-boron alloys (B3 and B4) not treated with carbon;0.004 to 0.005 percent of oxygen was obtained inthe boron-treated alloys B2 and B5.
,Some of the ingots of the high-purity alloyswere hot forged to a range of about three-quartersto one-third of their original diameters. Theouter surfaces of these forged bars were removedby machining prior to carrying out a homogeniz-ing treatment by heating in vacuum at tempera-tures ranging from 1,700° to 1,900° F for varyingperiods. The evacuated tube containing the barswas cooled from the high temperature in air.Microscopic examination of the cross section ofthe bars after the homogenizing treatment indi-cated a fair degree of uniformity in distribution ofthe carbon. Specimens subsequently used for testpurposes were prepared from the original ingots(as cast) or from the bars as homogenized.
The commercial steels were from the same"split" open-hearth heat as that used and de-scribed in a previous investigation [1]. The boronadditions were made in the mold with GrainalNo. 79, (Steel C9 and Cll) , Ferroboron (Steels
C12 and C14), and Grainal No. 1 (Steel C19).These steels were received in the form of hotrolled 1%-in. rounds.
IV. Austenite Grain SizeSince the hardenability of most steels is influ-
enced by the size of the grains at the time ofquenching, a determination was made of thegrain size established at the quenching tempera-tures of each alloy and steel used in carrying outthe critical cooling rate and end-quench tests.Grain size measurements were made by themethod described by Jeffries [12] or by estimatingthe grain number by comparing the microscopicimage at 100 diameters with an American Societyfor Testing Materials standard grain size chart.
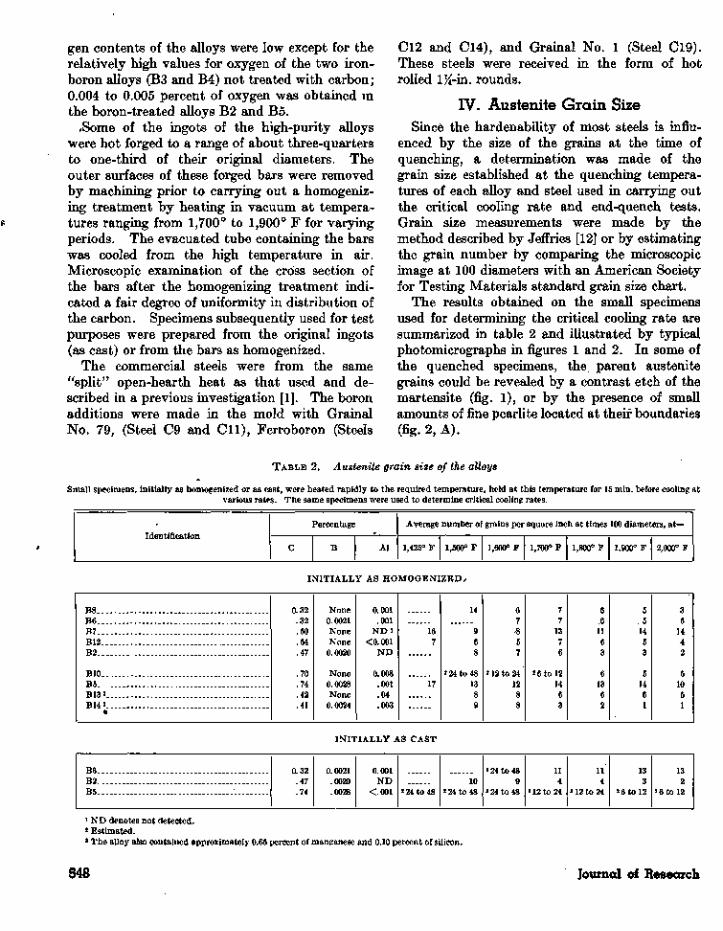
The results obtained on the small specimensused for determining the critical cooling rate aresummarized in table 2 and illustrated by typicalphotomicrographs in figures 1 and 2. In some ofthe quenched specimens, the parent austenitegrains could be revealed by a contrast etch of themartensite (fig. 1), or by the presence of smallamounts of fine pearlite located at their boundaries(fig. 2, A).
TABLE 2. Austenite grain size of the alloys
Small specimens, initially as homogenized or as cast, were heated rapidly to the required temperature, held at this temperature for 15 min. before cooling atvarious rates. The same specimens were used to determine critical cooling rates.
IdentificationPercentage
C B Al
Average number of grains per square inch at times 100 diameters, at—
1,425° F 1,500° F 1,600° F 1,700° F 1,800° F 1,900° F 2,000° F
INITIALLY AS HOMOGENIZED/
B8B6B7B12B2 . . _
B10.B5B133 . .B14 3
•
0.32.32.50.54.47
.70
.74
.42
.41
None0.0021NoneNone
0.0020
None0.0028None
0.0024
0.001.001
N D i<0.001
N D
0.008.001.04.003
167
17
14
968
2 24 to 481389
67$57
212 to 241288
77
1376
2 6 to 121463
66
1163
61362
5
514
53
51461
35
1442
51051
INITIALLY AS CAST
B6.B2B5
0.32.47.74
0.0021.0020.0028
0.001ND
<001 2 24 to 4810
2 24 to 48
2 24 to 489
2 24 to 48
114
212 to 24
114
212 to 24
133
2 6 to 12
132
26 to 12
' ND denotes not detected.2 Estimated.3 The alloy also contained approximately 0.65 percent of manganese and 0.10 percent of silicon.
548 Journal of Research
Although an attempt was made to heat thespecimens relatively rapidly through the trans-formation temperature range, the heating ratesvaried to some degree with the different specimensand with the maximum temperature attained.As previously shown [13], the grain size at tem-peratures somewhat above Ac3 of high-purity iron-carbon alloys varied with the rate of heatingthrough the transformation temperature range;the austenite grain size increased markedly with adecrease in rate of heating. Variations weresometimes obtained in the grain size of the dif-ferent specimens of a selected alloy, especially B2and BIO, when heated to the same temperature,as is illustrated for alloy B12 in figure 1, C and F ,and occasionally a wide variation in the size of thegrains was obtained in the same specimen (fig.1, D and E). Grain-size measurements made onthe latter specimen are practically meaningless.In .some cases, the variation in grain size at aselected temperature of different specimens of thesame alloy was as great or greater than that dueto the range in temperature used. (Comparefig. 1, C and F with fig. 2, D and F.) Because ofthese conditions, the same specimens were usedfor determining the austenite grain size and thehardenability. That the austenite grain size ofone of the alloys (B13) is affected by the rate ofheating or by prior thermal treatment is shown bythe photomicrographs of figure 2. The grain sizeat 1,500°, 1,700°, and 1,900° F of an end-quenchspecimen is shown in figure 2, A, B, and C andthat of considerably smaller specimens (used indetermining the critical cooling rate) in figure 2,D, E, and F. The grain size of the end-quenchspecimen increased with a change in temperaturefrom 1,500° to 1,700° F, but there was practicallyno further increase in size when heated to 1,900°F. The average grain size of the small specimenswas unaffected by this range in austenitizingtemperatures. The same specimen was used forend-quenching from each temperature, and thesmall specimens were prepared from this barafter the quench from 1,900° F. The bar wasnormalized at 1,650° F prior to each quenchingtreatment. The specimen for end-quenching washeated in a furnace at the desired temperature for45 min (total time in furnace), and it requiredan estimated time of 10 to 15 min to attain thetemperature of the furnace. The small specimenswere heated from room temperature to the austeni-
tizing temperature in approximately 2 min andwere held at temperature for 15 min (in furnacefor 17 min) before quenching; it required about6 to 8 sec to heat each specimen through the trans-formation temperature range. All specimens hadan initial structure of fine pearlite and ferrite, butvariations thus existed in the rate of heating andtime at the austenitizing temperature of the twoseries. It is noteworthy that the grain size estab-lished at 1,500° F was somewhat finer in the largethan in the small specimen (fig. 2, A and D),although the rate of heating was slower and thetime at temperature was greater for the large thanfor the small specimens; the grain size should in-
. crease, not decrease, with time at austenitizingtemperature. The trend for the grain size at1,500° F of this iron-carbon-manganese alloycontaining 0.04-percent aluminum (B14) to in-crease with •he faster rate of heating is the reverseof that observed previously in high-purity iron-carbon alloys. It was shown [13], however, thatthe austenite grain size at the temperature ordi-narly used in hardening an aluminum killed com-mercial steel containing 0.5-percent carbon in-creased with increase in rate of heating throughthe transformation temperature range.
Intermediate or coarse grains were establishedat each austenitizing temperature of each alloy(table 2 and fig. 18). This is to be expected, asthe alloys were of relatively high purity with thepresence of only small amounts, if any, of thegrain-refining elements (other than carbon) exceptfor the 0.04-percent aluminum in B13.
The austenite grain size of some of the alloysvaried with the initial condition of the specimens(table 2). At a selected temperature, the size ofthe grains in an initially homogenized specimenwas either approximately the same or coarser thanthat of the same alloy initially as cast.
With an initial structure as homogenized, theaverage size of the austenite grains of alloys B7,B12, B13 (all without boron) B6 and B5 (eachwith boron) was not significantly affected by therange in austenitizing temperatures used. How-ever, there was some increase in grain size of alloysB8 and B10 (without boron), and B2 and B14(with boron) with a change from the lower to thehigher part of the range in austenitizing tempera-tures.
With an initial structure as cast, the averagesize of the austenite grains of alloys B6, B2, and B5
Boron-Treated Alloys 549
(all with boron) was somewhat finer at the lowerthan at the higher austenitizing temperatures.
Apparently, boron had no consistent effect onthe austenite grain size and coarsening tempera-ture of these high-purity alloys.
V. Hardenability1. Procedure
Numerous methods have been proposed andused for determining the hardenability of steel.The selection of a method depends largely uponthe nature of the information desired and rangein hardenability of the steels or alloys. Thestandard end-quench test is widely used commer-cially for measuring the hardenability of low alloysteels (intermediate hardenability), but it is notwell suited for the shallow hardening type (plaincarbon) or for the deep hardening alloy steels,such as those that harden through ini^-in. roundsor larger sections by cooling in air.
In carrying out a fundamental study of harden-ability, it is a common practice to measure eitherthe cooling rate at a selected temperature or thecooling time or rate through a temperature in-terval during the quenching operation, and thenevaluate the cooling time or rate in terms of thestructure or hardness of the quenched specimen.However, different parameters, including tempera-ture intervals, structures, and hardnesses havebeen used by various investigators. French [14]used the cooling rate at 1,330° F, Boeghold andWeinman [15] at 1,300° F. and the time to coolfrom 1,350° to 900° F., and Post, Fetzer, andFenstermacher [16] used the rate at 1,000° F. toevaluate hardenability; values for the coolingrate at 1,300° F. are included in the chart preparedby the American Society for Testing Materials[17] for presenting data obtained in the end-quench test. Grossmann [18] and coworkers usedthe time required to cool from the quenching tem-perature to that half way down to the temperatureof the quenching medium, and they arbitrarilyselected a structure consisting of 50-percent mar-tensite and 50-percent pearlite (ferrite and car-bide) as the division between the hardened andunhardened condition. These data have beenused extensively in computing the hardenabilityfrom the chemical compositions of the steels.
The isothermal transformation diagrams (S orTTT curves) for numerous steels [19] show that thedecomposition of austenite to aggregates of ferrite
and carbide (pearlite) is most rapid in the tem-perature range of about 1,110° to 930° F (nose ofcurve) but in some steels, notably the deep harden-ing type containing high molybdenum, the noseof the isothermal transformation curve may occurin the lower part or below this range. To com-pletely harden a steel by quenching, it is essentialto cool with sufficient rapidity to prevent itsaustenite from transforming in this temperaturerange. If by a continuous quench to approxi-mately room temperature, the austenite is cooledthrough the range of 1,110° to 930° F withoutdecomposing, it remains unchanged until a tem-perature is reached that is favorable for its trans-formation to martensite. This applies to moststeels in which pearlite rather than bainite limitsthe formation of martensite. At some coolingrate, called the critical cooling rate, the austeniteof a steel that is capable of hardening by quench-ing just begins to transform at the nose of theS-curve. The critical cooling rate, therefore, is anindex to hardenability. The slower the criticalcooling rate, the deeper is the hardening of thesteel. Published data show that the temperatureof the initial transformation of austenite to marten-site is not affected by the rate of cooling, that is,the start of the Ar" or Ms temperature is notdepressed by rapid cooling.
A determination of the critical cooling rate wasused at this Bureau in a study of the hardenabilityof high-purity alloys of iron and carbon 120].With suitable equipment the method is capable ofproducing results of a high degree of accuracy, andit is applicable for alloys with a wide range inhardenability. This method was, therefore, selec-ted for use in the present study. In addition, thestandard end-quench test was used for evaluatingthe hardenability of the two alloys containingmanganese (B13 and B14, table 1) and for deter-mining the effects of quenching temperature andinitial structure on hardenability of the com-mercial steels.
(a) Critical Cooling Rate
The apparatus and procedures used for obtain-ing time-temperature cooling curves were similarto those described in some detail in a previousreport [20]. The essential features consisted ofusing specimens approximately 1/10 in. square by0.04 in. thick with one wire of a 32-gage chromel-alumel thermocouple spot welded to the center of
550 Journal of Research
a flat face and the other wire welded to the oppo-site face. The specimen was heated rapidly(usually the specimen attained the austenitizingtemperature within 2 min) in an atmosphere ofdry nitrogen, or in vacuo, to the required tem-perature and held at temperature for 15 min.before quenching directly in helium. Cooling ofthe specimen was recorded photographically bymeans of an Einthoven string galvonometer ap-paratus, and a time-temperature cooling curvewas plotted from this record. Metallographicexamination was made of the cross section of thequenched specimen a short distance from thepoints of contacts of the thermocouple wires, andthe structure of the specimen was correlated withits cooling time or rate. The quenching temper-ature used ranged from 1,425°, 1,500°, or 1,600°to 2,000° F, depending upon the carbon contentof the alloy.
The amount of fine pearlite (nodular troostite)or bainite contained in the quenched specimenwas estimated as 0.0 percent, trace, 0.2, 1.0 orover 1.0 percent. The photomicrographs offigure 3, A, B, and C were used as a "standard" inmaking this estimate. In a continuous quench ofthese high-purity alloys, the initial transformationproduct of austenite, which was formed at thenose of the S-curve was fine pearlite as is illus-trated in figure 3; some bainite also was formed insome of the specimens of the two alloys (B13 andB14), which contained about 0.7-percent manga-nese.
(b) End-Quench Test
The procedure as recommended by the AmericanSociety for Testing Materials [17] was regularlyfollowed in making the standard end-quench test,except that when higher quenching temperaturesthan those usually recommended were used, thequenched bar was ground to a depth of 0.030 to0.045 in. preparatory to making the hardnessmeasurements; with the high-purity alloys (B13and B14), the same specimen was used for eachof the three end-quenching treatments. Thesespecimens were not exactly round at the time ofcarrying-out the last two treatments, as they con-tained either two or four flats ground on the sur-face for use in the prior determination of hardness.A special fixture was used for positioning thespecimen for making the Rockwell hardnessmeasurements.
2. Results
(a) Iron-Carbon Alloys
Critical Cooling Rate. A photographic recordof the time-temperature relationship, which wasobtained with each specimen during the quencn,permits an evaluation of these data in terms ofthe cooling time or rate at any selected tempera-ture or temperature interval within the rangecorresponding to that of the start and finish of thequench (austenitizing and approximately roomtemperature, respectively).
Specimens Initially as Homogenized. The rela-tion of the time required to cool specimens throughthree temperature ranges to the structures of theiron-carbon alloys is given in figures 4 to 10.These specimens were prepared from initiallyhomogenized bars and were quenched from varioustemperatures. In these figures, the curves repre-sent the relation of the cooling time for the forma-tion of 0.2-percent fine pearlite (critical coolingtime) to the quenching (austenitizing) tempera-ture. The values for the specimens, which werecooled too rapidly to allow the critical amount ofaustenite to transform (at the nose of the S-curve),should fall below the curve, whereas the valuesfor the specimens containing more than 0.2-per-cent pearlite should lie above the curve. Therewere some inconsistencies in this relation thatmay have been caused by a variation in grainsize at the austenitizing temperature or by chemi-cal inhomogeneity. As is illustrated in figure 5,however, no definite correlation was obtainedbetween cooling time and structure of initiallyhomogenized specimens of the alloy B6 containing0.32-percent carbon and 0.0021-percent boronwhen quenched from temperatures ranging from1,600° to 2,000° F. It is believed that the rela-tive ineffectiveness of boron in improving thehardenability of some of the specimens may bedue to a change in the form of boron in the austen-ite brought about during the hot-working (forging)or homogenizing process. Evidence supportingthis view will be discussed later in connectionwith figure 15.
The relation of critical cooling time to quench-ing temperature of an alloy was quite similar foreach of the three temperature intervals used, as isshown by the shape of the curves. This is to beexpected because of the exponential type of cool-ing curve that was obtained on quenching the
Boron-Treated Alloys 551
small specimens from the austenitizing tempera-ture in gas at a rate sufficiently fast to prevent lessthan about 5 percent of the austenite transformingto relatively soft products. Thus a determinationof the cooling time through any one of the threetemperature ranges used appears to be as suitableas the remaining two for correlating with themicrostructure in evaluating the hardenability ofthese alloys. Obviously, however, the valuesused to express the hardenability in terms of thecritical cooling time or rate will vary with thetemperature ranges used. Since a determinationof the cooling rate through the range, 1,110° to930° F (nose of S-curve) was used in previousinvestigations to evaluate the hardenability ofhigh purity iron-carbon alloys, this temperaturerange was again selected for use in the presentstudy. The critical cooling rate, therefore, istaken as the average cooling rate between 1,110°and 930° F (600° to 500° C) which produced in,the quenched specimen a structure of martensitewith fine pearlite in an amount estimated to be0.2 percent.
The relation of critical cooling rate to quenchingtemperature of initially homogenized specimens ofiron-carbon alloys, without and with boron, isshown in figure 11. For alloys without boron, thecritical cooling rate decreased continuously withincrease in quenching temperature when the car-bon content was 0.32 percent (B8), but the criticalcooling rate of the alloys with 0.50- or 0.54-percentcarbon (B7 and B12) was not appreciably affectedby changes in quenching temperatures within therange from 1,425° to 2,000° F. With 0.70-percentcarbon (B10), the critical cooling rate was approx-imately constant when the alloy was quenchedfrom temperatures within the range of about 1,425°to 1,600° F, the rate decreased rapidly with changein quenching temperature from about 1,600° to1,800° F and then less rapidly with a further in-crease in quenching temperature.
For the alloys with boron, the critical coolingrate decreased continuously with increase inquenching temperature when the carbon was 0.47percent (B2), but with 0.74-percent carbon (B5)the rate was constant for quenching temperaturesup to 1,600° F. The critical cooling rate of thelatter alloy decreased somewhat with increase inquenching temperature from 1,600° to 2,000° F.As previously stated, no consistent relationshipwas shown between the cooling rate and structure
produced by quenching initially homogenized spec-imens of the 0.32-percent carbon—0.0021-percentboron alloy (B6).
The influence of boron on the hardenability ofalloys with about 0.5- and 0.7-percent carbon isshown by a comparison of the positions of thecurves of figure 11. The improvement in harden-ability of the boron-treated alloys was confinedprincipally to the high range in quenching tem-peratures for the alloys of the 0.5-percent carbontype and to the low range when the carbon con-tent was about 0.7 percent. Apparently this im-provement is a secondary effect, possibly due to achange in the grain size at the austenitizingtemperatures.
The relation of critical cooling rate to austenitegrain size of the iron-carbon alloys is given infigure 12. The general trend was for the harden-ability of the alloys, without and with boron, toincrease (critical cooling rate decreased) as thesize of the austenite grains increased. The criticalcooling rate of the 0.74-percent carbon—0.0028-percent boron alloy ranged from about 500° to900° F per second without an appreciable change inaustenite grain size.
To determine the primary effect of boron onhardenability, a comparison should be made of thecritical cooling rate of alloys of the same carboncontent, without and with boron, when quenchedfrom temperatures sufficiently high to ensure com-plete solution and uniform distribution of carbonin austenite of the same grain size. Unfortu-nately, in the present experiments these conditionswere not met for wide ranges in both carboncontent and size of the austenite grains. How-ever, the data obtained from figure 12 permit sucha comparison to be made of the alloys with austen-ite grain sizes of about 10 and 5 grains/in.2 at 100diameters (ASTM No. 4 and 3). When the criti-cal cooling rate is plotted against the carbon con-tent of the alloys each with the same austenitegrain size (10 or 5 grains/in.2 at X100), no signifi-cant improvement is shown in the hardenabilitydue to boron (fig. 13).
It is noteworthy that a change in austenitegrain size of about one ASTM number of a givenboron-free alloy initially as homogenized had con-siderably more effect on its hardenability than theaddition of about 0.002 percent boron, providedthe austenite grain size was not changed. ^
Specimens initially as cast. The hardenability
552 Journal of Research
of high-purity-iron-carbon-boron alloys may beaffected by hot-working, or thermal treatmentscarried out during the course of their preparation.Tests, therefore, were made on specimens preparedfrom boron-treated ingots (as cast) containing 0.32,0.47, and 0.74 percent of carbon, respectively(B6, B2, and B5) and on a boron-free alloy with 0.50percent of carbon (B7). The effect of the initialstructural condition on the hardenability of the0.50-percent carbon alloy without boron was notmarked; slightly higher critical cooling rates wererequired with initially cast than with homogenizedspecimens when the quenching temperature waswithin the range of about 1,500° to 1,600° F andlower rates in the former specimens when quenchedfrom 2,000° F.
The relation of cooling time to structure ofspecimens, initially as cast, of the 0.32-percent car-bon—0.0031-percent boron alloy when quenchedfrom different temperatures is given in figure 14.The curves show the relation of critical coolingtime to quenching temperature. More consistentresults were obtained with these specimens thanwith those prepared from the homogenized bar ofthe same alloy (fig. 5).
The relation of critical cooling rate to quenchingtemperature of some of the alloys initially as cast(curves A) and initially as homogenized (curves B)is summarized in figure 15. With an initial struc-ture as cast, the hardenability was markedly im-proved by the addition of boron to alloys contain-ing* 0.32- or 0.47-percent carbon, but the presenceof boron in the 0.74-percent carbon alloy again hadno material effect on the critical cooling rate.The lower hardenability of the initially castspecimens of the 0.74-percent carbon alloy whenquenched from 1,425° or 1,500° F was due toincomplete solution and nonuniform distributionof carbon in austenite at these temperatures, asevidenced by the presence of free carbides afterquenching. As previously stated, the initiallyhomogenized specimens of the 0.32-percent car-bon—0.0021-percent boron showed nonuniformhardening characteristics. Because of this con-dition, it was necessary to use the results obtainedwith initially homogenized specimens of the alloywithout boron as a basis for evaluating the effectof initial structure on the hardenability of theboron-treated alloy containing 0.32-percent car-bon. Considerably higher cooling rates wererequired to completely harden the 0.32- and 0.47-
percent carbon alloys in the initial condition ashomogenized than as cast when quenched fromalike temperatures within the range of 1,500° or1,600° to 2,000° F.
The observed difference in hardenability cannotbe ascribed to a grain-size effect, as the sizes ofthe grains established at the austenitizing tem-peratures for 0.47-percent carbon 0.0020-percentboron alloy were nearly alike in the two series ofspecimens, and the average size of the austenitegrains obtained at each austenitizing temperatureof the 0.32-percent carbon—0.0021-percent boronalloy was slightly finer in the initial condition ascast than as homogenized (table 2). As boronimproved the hardenability of the two alloys (0.3and 0.5% carbon) in the initial condition as castbut was practically without effect after hot-work-ing and homogenizing, it is clearly apparent thatthe action of boron on hardenability was adverselyaffected during the course of these treatments,probably by the exposure to the relatively hightemperature required for forging. In carrying outthe forging operation, the ingots (1 to 1% in. indiameter) were placed in a furnace within thetemperature range of 1,900° to 2,100° F, in areducing atmosphere, held in the furnace for %to 1 hr and then forged, without reheating, with adrop hammer to approximately % in. in diameter;forging was completed at a temperature aboveAr3, and the forged bars were cooled in air.Microscopic examination of cross sections ofthe forged bars showed the presence of a decar-burized layer at the surface of the 0.47-percentcarbon alloy (B2) and no appreciable decarburiza-tion of the 0.32-percent carbon alloy (B6). Theusual procedures as previously described werefollowed in removing the outer surfaces from theforged bars and in carrying out the homogenizingtreatments.
There was no pick-up in the amounts of nitrogenor oxygen during the forging and homogenizingoperation as shown by the results of analysis bythe vacuum fusion method on specimens of the0.32-percent carbon alloy (B6). The results ofdeterminations for boron by chemical analysis onbars as forged (B2) or as homogenized (B6) showedthe presence of sufficient boron (0.002%, table 1)to enhance the hardenability of each alloy.
Grange and Garvey [4] also found that when aboron-treated steel is heated at a very hightemperature for a very long time, the increase in
Boron-Treated Alloys 553
hardenability due to boron gradually diminishesand finally disappears, although the boron contentas measured by analysis remains unchanged.They express the opinion that possibly part orall of the efficacy of boron in enhancing harden-ability is lost when the steel is heated for rollingor forging.
The results summarized in figure 15 for initiallycast specimens also show that the boron-treatedalloys containing 0.32-percent and 0.47-percentcarbon had critical cooling rates of the same orderof'magnitude when austenitized alike, and theserates were, in all cases, slower than those of theboron-treated alloy containing 0.74-percent car-bon; in hypoeutectoid plain-carbon steels, thehardenability increases with an increase in carboncontent, provided all other factors that affecthardenability are alike. Thus the action of boronon the hardenability of these high-purity alloys,as cast, varied with their carbon content; theeffectiveness decreased with an increase in carbon,the improvement being very pronounced with0.3-percent, intermediate with 0.5-percent, andnil with 0.74-percent carbon. Rahrer and Arm-strong [21] and Grange and Garvey [4] also re-ported the above trends with commercial steels.
The hardenability of certain commercial boron-treated [4] and experimental [1] steels decreasedwith an increase in quenching temperature. I tis interesting, however, to note from the resultsgiven in figure 15, that the hardenability of theseboron-treated alloys did not decrease with anincrease in quenching temperature.
(b) Iron-Carbon-Manganese Alloys
Critical Cooling Bate. The relation of coolingtime to structure of the iron-carbon-manganesealloys, without and with 0.0024-percent boron,when quenched from various temperatures, isshown in figures 16 and 17, respectively, and therelation of critical cooling rate to quenchingtemperature is given in figure 19. Variation inquenching temperature from 1,500° to 2,000° Fhad no material effect on the critical cooling rate(fig. 19) or average size of the austenite grains(table 2) of the alloy without boron (B13), whereaswith the boron-treated alloy (B14) the trend wasfor the hardenability to increase slightly withtemperature and for the grain size to increase witha change in temperature from 1,600° to 2,000° F.
End-Quench Test. The curves obtained fromthe results of the end-quench test of the iron-carbon-manganese alloys are given in figure 18,and the relation of quenching temperature to thedistances from the quenched end of the bar cor-responding to Rockwell hardness values of C42(50% martensite) and C50 (95% martensite) isshown in figure 19.
When a comparison is made on the basis of thedistances from the quenched end for Rockwellvalues of C42 or C50 (fig. 19), the hardenabilityof each alloy was increased slightly by a change inquenching temperature from 1,500° to 1,700° F,but there was no further improvement by increas-ing the temperature to 1,900° F. The observedimprovement in hardenability with a change inquenching temperature from 1,500° to 1,700° maybe due to a grain size effect.
The effect of boron on the hardenability of theiron-carbon-manganese alloys as determined bycritical cooling rate and by the end-quench testsis also shown by the results summarized in figure19. For each austenitizing temperature used, thehardenability was enhanced by the presence ofboron. This improvement appears to be a pri-mary rather than a secondary effect, as the differ-ences in grain size of the alloys at each tempera-ture is insufficient to account for the magnitude ofthe observed effects. For example, the specimensof both alloys used for determining the criticalcooling rate had approximately the same grainsize at 1,500° and 1,600° F, but the hardenabilityof the alloy containing boron was considerablyhigher than that of the alloy without boron; apart of the observed increase in hardenability ofthe boron-treated alloy when quenched from withinthe temperature range of about 1,700° to 2,000° Fmay be due to its larger grains (table 2).
The increase in hardenability of the iron-carbon-manganese alloys by the addition of boron wasconsiderably more marked when measured interms of the critical cooling rate than by the end-quench test.
(c) Commercial Steels
End-Quench Test. It was shown previously [1]that the hardenability as determined in the end-quench test of certain boron-treated experimentaland commercial steels was affected by the quench-ing temperature. In some of the steels, the hard-enability was increased by increasing the quench-
554 Journal of Research
ing temperature above the usual recommendedrange; whereas in other steels the hardenabilitywas not affected, or was decreased by this change.With specimens initially normalized from the usualrecommended temperature range, it was shown[1] that variations in quenching temperature from1,550° to 1,900° F had no material effect on thehardenability of boron-treated steels (table 1) Cl4(0.0036% B), and C19 (0.0001% B); the harden-ability of the base steel C15 (without boron) in-creased slightly by increasing the quenching tem-perature from 1,550° to 1,900° F, but the hardena-bility of another boron-treated steel C12 (0.0022%B) was decreased somewhat by increasing thequenching temperature from about 1,550° or1,650° to 1,900° F. Several of these commercialopen hearth steels (table 1), all prepared from thesame heat, were selected for use in a further studyof the factors, such as variations in initial struc-ture, austenite grain size, etc., that might influencethe hardenability.
The results of some of the end-quench testsmade on the commercial steels containing 0.43-percent carbon, 1.6-perecnt manganese, and vary-ing amounts of boron are summarized in figure 20.
The influence of boron on the hardenability ofthese steels when normalized and quenched fromthe usually recommended temperatures is shownby the relative position of the curves in figure20A. The hardenability of each steel (C9, C12,C14, and C19) was markedly improved by boron,but the retention of 0.0001 percent was nearly aseffective as retaining 0.0036 percent. As theseresults were obtained on specimens that werenormalized and end-quenched from recommendedtemperatures, the curves are used as a basis forcorrelating the hardenability of the steels aftervarious thermal treatments.
A change in normalizing temperature from1,650° to 1,900° F followed by end-quenchingfrom 1,550° F did not appreciably affect thehardenability* of the base steel (C15), or boron-treated steels C9, C14, (fig. 20, B) and C12, butthe hardenability of steel C19 with 0.0001-percentretained boron was decreased slightly by thischange. The hardenability of these steels wasnot significantly affected by quenching from1,900° F in water prior to end-quenching from1,550° F, as is illustrated for steels C15, C9, andC19 in figure 20, C (C14 not included in the test).That steel C19 is sensitive to prior thermal treat-
ment is clearly shown by the results summarizedin figure 20, D, E, and F. Its hardenability wasof the same order of magnitude as the base steelwhen the specimens were treated alike by heatingto 1,900° F followed by cooling in another furnaceat either 1,550° or 1,425° F for 30 min beforeend-quenching (fig. 20, D and E). However, thehardenability of the steels with higher boroncontent was not appreciably affected by thesetreatments (steel C12, fig. 20, D and steels C9and C14, fig. 20, E). Furthermore, the harden-ability of steels C9 and C14 was not changed byincreasing the time of holding at 1,425° F from% to 5 hr. before end-quenching. The slightimprovement in the hardenability of the basesteel (compare curves of steel C15, fig. 20, A andE) was probably due to an increase in grain sizewith the higher austentizing temperature (1,550°and 1,900° F, respectively). The hardenabilityof boron-treated steel C19 was also impaired byan initial treatment that consisted of heating to1,900° F, cooling in another furnace at 1,425° Ffor 30 min, and then quenching in water beforeend-quenching from 1,550° F (fig. 20, F). Thehardenability thus impaired (specimen C19 A),however, was restored to approximately its normalvalue by increasing the temperature of the end-quench test from 1,550° to 1,750° F (specimenC19B).
VI. Effect of Quenching Temperature onAr" Transformation
Many of the photographic records obtainedduring the continuous cooling of small specimensby quenching directly from various austenitizingtemperatures showed an arrest in the cooling curvein the temperature range of martensite formation.The clarity of the arrest as shown in the photo-graphs and from a plot of the time-temperaturecooling curve varied with the carbon content ofthe alloys and with the rate of cooling. A sum-mary of the data from these photographic recordsindicated a very definite trend for the temperatureof the start of the transformation of austenite tomartensite (start of the Ar" or Ms) in the high-purity alloys to increase with increase in quenchingtemperature. Because of this unexpected relation,attempts were made to obtain the Ms point inseveral of the alloys (B2, B7, B13, and B14) by aquench-temper technique as described and usedby Greninger and Troiano [22]. These alloys,
Boron-Treated Alloys 555
however, are relatively shallow hardening, and theMs point was not accurately determined by thismethod. A deeper-hardening commercial steel(C14) was, therefore, selected for determining, bothby thermal analysis and by the metallographicmethod, the influence of quenching temperature onthe temperature of the Ms point.
Specimens of steel C14 were quenched directlyfrom the austenitizing temperatures and the tem-peratures of the start of the formation of marten-site were obtained from the photographic recordsin the usual manner. The procedures as alreadydescribed for preparing small specimens, heating,quenching, and recording the cooling curves, werealso followed in carrying out these tests. Theaverage value as determined from cooling curveson two to four specimens quenched from each ofthe selected temperatures are given in figure 21.Again the trend was for the temperature of Ms toincrease with increase in quenching temperature.However, additional tests on specimens that wereaustenitized at either 1,900° or 2,000° F and thencooled and held in the temperature range of 1,500°to 1,600° F before quenching, showed values forthe Ms temperature that were only slightly higherthan those obtained in austenitizing and quenchingdirectly from the lower temperatures. Otherspecimens that were austenitized at 2,000° F andthen cooled, without decomposing the austenite,to a temperature within the range of about 1,100°to 900° F before quenching, gave an average valuefor the Ms point that was about the same as thatobtained on quenching directly from 1,600° F.Furthermore, the results of determinations by themetallographic method show no appreciable differ-ence in the temperature of the Ms point withquenching temperatures of 1,600°, 1,800°, and2,000° F. The observed increase in the Ms tem-perature with increase in quenching temperatureis apparently due to the method of thermal anal-ysis and is probably not a characteristic of thealloys.
The average size of the austenite grains in spec-imens of steel C14 ranged from about ASTM grainnumber 5 to 2 with change in temperature from1,550° or 1,600° to 2,000° F. This range in grainsize had no significant effect on the temperatureof the start of the formation of martensite as deter-mined by the metallographic method.
VII. Diffusion of Boron in Austenite ofCommercial Steels
The penetration of boron in low-carbon steelhas been investigated by Tschischewsky [23] andby Campbell and Fay [24]. According to Camp-bell and Fay, the boron and carbon steels showmany similarities in the mechanism of their ab-sorption and diffusion phenomena. In the ab-sence of nitrogen, they found that the penetrationof boron followed a normal diffusion curve butwhen a boron-treated specimen was heated at900° C in ammonia, the nitrogen displaced theboron at its surface. They concluded that at900° C boron had a greater affinity for nitrogenthan it had for iron.
Specimens of three of the commercial boron-treated steels (Cll, C12, and C14, table 1) weredecarburized by heating in a reducing atmosphere(mixture of natural and manufactured gas withair, moisture not removed) at 1,550° or 1,900° Ffor 8 hr and then cooled in mica. The depth ofdecarburization was estimated metallographically,and the boron content in the decarburized layerwas determined spectrographically. The resultsobtained are summarized in table 3 and illustratedin figure 22. The depth of the decarburized layerof a specimen of steel C14 decarburized at 1,900° Fis shown by the structure reproduced in the photo-micrograph at the top of figure 22, and the heavyhorizontal line represents the nominal boroncontent (0.0038 %) as determined spectrographi-cally. There was a high concentration of boron atthe original surface of the specimens, which prob-ably was due to a reaction of the diffusing boronwith oxygen in the furnace atmosphere to formboron oxide (B2O3); the specimens were coloreddark during the decarburizing treatment. Theboron content slightly below the origiaal surface(about 0.003 in. for specimens of C14, fig. 22) wasusually less than the value that could be accuratelydetermined by the methods employed (limits ofsensitivity were about 0.0002 and 0.0005 % boron).A concentration gradient extended from this zonewhere the boron was practically depleted to adepth usually as great or greater than the severelydecarburized layer. The approximate value of thecoefficient of diffusion of boron (D) as computedfrom experimental results obtained with this
556 Journal of Research
specimen 2 also indicated that the rate of diffusionof boron in gamma iron was of the same order ofmagnitude as that of carbon. Thus the rate ofdiffusion of boron in austenite at 1,550° or 1,900° Fappears to be equivalent to or slightly greaterthan that of carbon in steels containing 0.4percent of carbon. It is therefore logical to assumethat the mechanism of the diffusion process forboron in austenite is quite similar to that of carbon.That is, the boron atoms are located in the inter-stices of the gamma iron lattice.
VIII. Structures of the Alloys and Steels
A metallographic examination was made of thehigh-purity alloys used to evaluate hardenabilityin the conditions as cast, forged, and homogenized.The examination was extended to include speci-mens specially heat-treated to develop a con-stituent containing boron in each of the boron-treated alloys and steels listed in table 1. Someof the specimens containing a boron constituentwere examined with an electron microscope.
1. Initially as Cast and as Homogenized
Numerous particles in the form of spheroidsand stringers were observed in the structures of theboron-treated alloys containing 0.3-, 0.5-, and 0.7-percent carbon in the conditions as cast and ashomogenized, as is illustrated in the photomicro-graphs of figure 23. The trend was for the particlesto form in the ferritic areas especially when theproeutectoid ferrite was located in the parentaustenite grain boundaries. These particles ap-pear to be carbides, some of which are complex(fig. 23, E), as is indicated by their reaction to apicral or nital etch (differentially attacked, fig. 23,E, not appreciably attacked, fig. 23, A, B, and C)and to an electrolytic etch in a sodium cyanidesolution (attacked, fig. 23, F). The results ofmicro hardness measurements using the Knoopinstrument with a 25-g load also indicated thatthe particles were harder than the ferrite matrix.The carbide particles also were observed in theprimary austenite grain boundaries of polished
2 The authors are indebted to Cyril Wells, Carnegie Institute of Technology,for computing and reporting the approximate value of the rate of diffusion of
. boron in this specimen (at 1,900° F, D=2.0X10⁻⁷ cm2/sec). Additional andconsiderably more precise tests to determine the rate of diffusion of boron inhigh-purity iron-carbon alloys containing 0.32 percent of carbon (B6 and B8)and in experimental and commercial steels under varying conditions are nowin progress in that laboratory. The results will be published at a laterdate by Wells.
TABLE 3.—Boron content of decarburized layer of commercialboron-treated steels
The limits of sensitivity of the spectrographic methods were 0.0002-percentfor the low, and 0.0005-percent boron for the high concentrations. Thesedeterminations were confined to layers 0.004 and 0.002 in. immediately belowthe surfaces, respectively. Each value for boron given in the table is theresult of a single determination, and the depth is that of the surface at whichthe arc was struck, not the depth to which the pit due to the arc extended.
The specimens were ground to the desired depths with boron-free wheels.
Depth iBoron-content of specimen—
C l l C12 C14
Decarburized 0.025 to 0.04 in.2
in.0.000.001.002.003.003
.011
.012
.022
.022
.031
.032
.041
.042
.051
.051
.054
.060
.063
.064
.077
.077
.090
%0.030.046
< 0005<. 0002< 0002
<.0005< 0005<.0005<:ooo5< . 0005
< 0005<.0005
.0005
.0006
.0007
<.0005.0006.0005.0007.0008
.0010
.0010
%0.029.017.0012
<.0002< 0002
<.0005<.0005<.0005< 0005< 0005
<.0005<• 0005
.0006
.0007
.0013
.0011
.0007
.0007
.0013
.0021
.0022
.0021
%0.051.022
< . 0005< . 0002< . 0002
< 0005<.0005
.0023
.0023
.0026
.0028
.0027
.0031
. 0034
.0030
.0027
.0031
.0032
. 0033
.0036
.0037
.0038
Decarburized 0.01 to 0.02 in.3
0.000.001.001.003.003
0.023<.OOO5
< 0002<.0002
0.013. 0035.0041
- .00055.00035
0.022.0025.010. 0021.0017
1 Distance from the surface of the specimen as decarburized. These sur-faces were ground prior to decarburizing.
2 The specimens were decarburized by heating at 1,900° F in a reducingatmosphere for 8 hr, followed by cooling in mica.
3 The specimens were decarburized by heating at 1,550° F in a reducingatmosphere for 8 hr, followed by cooling in mica.
but unetched specimens of the 0.47-percent car-bon—0.0020-percent boron alloy as cast (B2, fig.23, D). Since the free carbide particles wereobserved principally in the high-purity alloys con-taining boron, it is logical to believe that most ofthese particles are cementite containing boron.
Boron-Treated Alloys 557
The structure of the alloys as cast and as homo-genized consisted of proeutectoid ferrite, pearlitevarying somewhat in degree of fineness, andspheroided carbides (fig. 23, A, B, C, E, and F).Obviously, the relative amounts of ferrite andpearlite varied with the carbon content.
2. Heat Treatments to Develop a Boron Constituent
Grange and Garvey [4] described a metallo-graphic test for determining the presence ofboron in steel, and they attempted to correlatethe observed amounts of a constituent in speciallytreated specimens with the actual boron contentand hardenability. Essentially, the test consistsof austenitizing small specimens (about )i in.thick) at a high temperature (2,000° to 2,100° Ffor 10 min.) followed by cooling rapidly in a leador salt bath at 1,200° F (temperature of this bathmay be changed to suit existing conditions),holding at this temperature for a sufficient timeto allow the constituent to precipitate, and finallycooling to room temperature preferably by quench-ing in water or brine. The original surface layerof the heat-treated specimen is removed prepara-tory to polishing and then etching in picral formetallographic examination at a magnification ofapproximately 500 diameters. They found thatthe constituent (dark-etching dots) always formedas a partial or continuous network in the parentaustenite grain boundaries of the specially treatedspecimens of steels containing a minimum of0.0004-percent boron. The hardenability of theirsteels correlated somewhat better with the amountof boron constituent than with the actual boroncontent, but they concluded that the hardena-bility of boron-treated steels can be safely esti-mated only from the results of a hardenabilitytest. The precise nature of the constituent wasnot known, but to the authors it appeared to bean iron boride probably containing carbon andother alloying elements.
A boron constituent was observed in speciallytreated specimens of the boron containing alloysand steels listed in table 1; only very small amounts,were observed in a commercial steel with 0.0001-percent boron (C19) and possibly a trace in car-burized specimens of iron-boron alloy (B13) ini-tially with relatively high oxygen content. Someof these specimens were heat-treated according tothe procedure recommended by Grange andGarvey, but other specimens heat-treated quite
differently frequently contained this constituent.The results are illustrated in figures 24, 25, and 26.
The tendency for the carbides to spheroidize inhigh-purity iron-carbon-boron alloys is furtherillustrated in the photomicrographs of figure 24.Although this specimen, in cooling from 1,900° Fwas held for only 1 min in the temperature rangewhere pearlite is formed, the final structure indi-cates that the time was ample for some spheroidiz-ation of the carbides to occur in a coarse pearlitearea; the spheroids as shown extending linearlyacross the photomicrographs in figure 24, A and B,were attacked by etching electrolytically in asodium cyanide solution. The dark etching dots(believed to be a boron constituent) in the marten-site areas (fig. 24, C) are considerably smaller thanthe. carbides located in the ferritic area. Addi-tional study is needed to identify positively theformer particles. It is of interest to note thecontinuity in the alinement of both size particlesin the form of a partial network located in theprior austenite grain boundaries.
The trend was for the boron constituent to beconcentrated in the parent ausenite grain bound-aries of the specially treated specimens of thealloys and steels (fig. 25, A and B). However,some dark etching particles often were observedwithin the grains of these and of other specimensthat were cooled rapidly, directly from high aus-tenitizing temperatures, as is illustrated in figure25, C and D. The result obtained on a smallspecimen of a commercial steel (C14) that wasaustenitized at 2,000° F and quenched into icedsodium hydroxide solution (fig. 25, C and D) in-dicates either that all of the boron (0.0036 %)was not in solution in the austenite at 2,000° For that the formations of the precipitate cannot beentirely suppressed by extremely rapid coolingfrom this temperature. The constituent also wasobserved in other specimens of this steel that werecooled from the austenitizing temperature (2,000°F) in air or in oil.
Many of the data indicated that the solubilityof boron in gamma iron decreased with an in-crease in temperature but, in a few cases, theresults also indicated that the solubility increasedwith the temperature.
The number, size, and distribution of the boron-containing particles varied with the amount andform of boron and with the conditions used inheat treating the specimens, including austenitiz-
558 Journal of Research
ing temperature and atmosphere, rate of cooling,temperature of quenching bath, and time held inthe bath if at elevated temperature, and tempera-ture of reheating.
Furthermore, the success in revealing the pres-ence of the boron constituent in these specimensvaried appreciably from time to time, with thepolishing and etching technique, as is illustratedin figure 25, C and D. Although a similar pro-cedure for preparing this specimen was followedon two occasions by different persons, it is apparentthat considerably more of the "dots" are shownwithin the parent austenite grains in figure 25, D,than in figure 25, C.
The boron constituent was observed in a speci-men of a high-purity iron-boron alloy with lessthan 0.01-percent carbon that was heated to2,000° F and then cooled in a lead bath at 1,700°F (gamma field) for 5 min and finally quenched insodium hydroxide solution at room temperature(fig. 26, A). The dark etching constituent deline-ated the gamma (austenite) grains, and it alsoprecipitated within the grains on parallel planesthus giving the appearance of twinning. Althoughno appreciable decarburization could occur duringthe austenitizing of this specimen (less than 0.01 %carbon) the boron constituent did not extend toits original surface; the left edge of the photo-micrograph in figure 26, A, corresponds to thesurface of the quenched specimen. Some, butnot all, of the constituent was dissolved on reheat-ing this specimen in lead at 1,650° F for 5 min;compare the amount of the constituent as shownin the photomicrograph of figure 26, C, with thatof A and note in C that the ferrite grain boundariesappear to be located independently of the network.
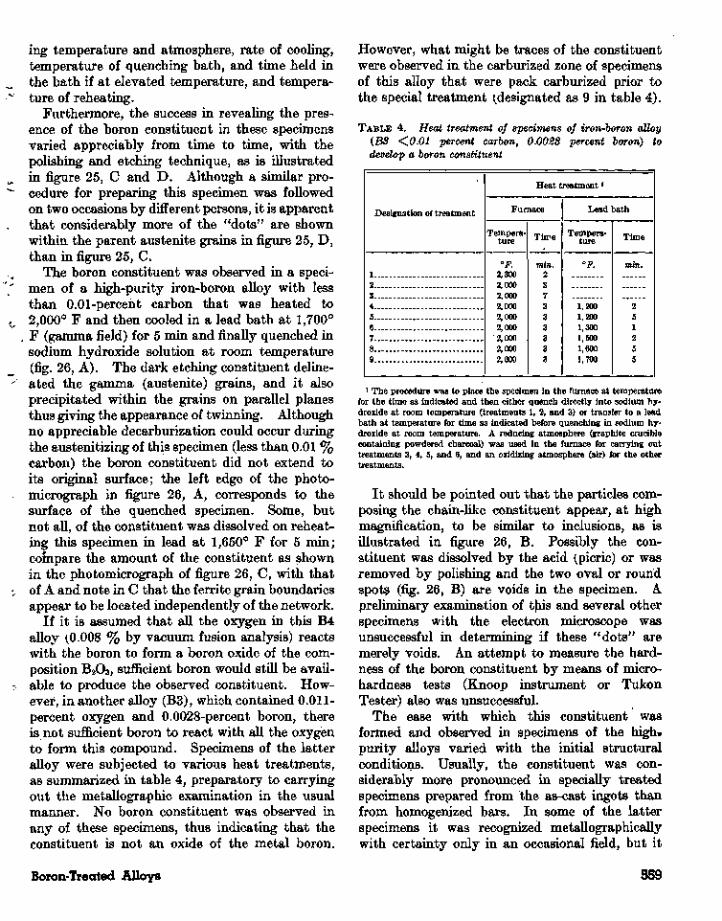
If it is assumed that all the oxygen in this B4alloy (0.008 % by vacuum fusion analysis) reactswith the boron to form a boron oxide of the com-position B2O3, sufficient boron would still be avail-able to produce the observed constituent. How-ever, in another alloy (B3), which contained 0.011-percent oxygen and 0.0028-percent boron, thereis not sufficient boron to react with all the oxygento form this compound. Specimens of the latteralloy were subjected to various heat treatments,as summarized in table 4, preparatory to carryingout the metallographic examination in the usualmanner. No boron constituent was observed inany of these specimens, thus indicating that theconstituent is not an oxide of the metal boron.
However, what might be traces of the constituentwere observed in the carburized zone of specimensof this alloy that were pack carburized prior tothe special treatment (designated as 9 in table 4).
TABLE 4. Heat treatment of specimens of iron-boron alloy(B3 <0.01 percent carbon, 0.0028 percent boron) todevelop a boron constituent
Designation of treatment
123 . . . . _ .456789
Heat treatment *
Furnace
Tempera-ture
2,3002,0002,0002,0002,0002,0002,0002,0002,000
Time
min.237333333
Lead bath
Tempera-ture
F.
1,2001,2001,3001,5001,6001,700
Time
min.
251255
1 The procedure was to place the specimen in the furnace at temperaturefor the time as indicated and then either quench directly into sodium hy-droxide at room temperature (treatments 1, 2, and 3) or transfer to a leadbath at temperature for time as indicated before quenching in sodium hy-droxide at room temperature. A reducing atmosphere (graphite cruciblecontaining powdered charcoal) was used in the furnace for carrying outtreatments 3, 4, 5, and 6, and an oxidizing atmosphere (air) for the othertreatments.
It should be pointed out that the particles com-posing the chain-like constituent appear, at highmagnification, to be similar to inclusions, as isillustrated in figure 26, B. Possibly the con-stituent was dissolved by the acid (picric) or wasremoved by polishing and the two oval or roundspots (fig. 26, B) are voids in the specimen. Apreliminary examination of this and several otherspecimens with the electron microscope wasunsuccessful in determining if these "dots" aremerely voids. An attempt to measure the hard-ness of the boron constituent by means of micro-hardness tests (Knoop instrument or TukonTester) also was unsuccessful.
The ease with which this constituent wasformed and observed in specimens of the high*purity alloys varied with the initial structuralconditions. Usually, the constituent was con-siderably more pronounced in specially treatedspecimens prepared from the as-cast ingots thanfrom homogenized bars. In some of the latterspecimens it was recognized metallographicallywith certainty only in an occasional field, but it
Boron-Treated Alloys 559
was never observed in severely decarburizedportions of any of the specimens from the alloysand steels (fig. 26, A).
Specimens prepared from various experimentalhigh-nitrogen steels described in a previous report[1] were subjected to different treatments todevelop the boron constituent. The constituentwas not observed in the specimens containinghigh-soluble nitrogen (0.01 to 0.03 % soluble insulfuric acid), whereas it was readily produced inspecimens of steels containing similar amounts ofnitrogen that were treated with titanium to fixthe nitrogen as titanium nitride. Thus the boronconstituent is not a nitride. Presumably com-pounds of boron and oxygen or boron and nitrogenexisted in specimens of the high-oxygen alloys orhigh-soluble nitrogen steels containing boron inwhich the chain-like constituent was not de-veloped. It should be pointed out that suchcompounds were not identified in these specimensas polished and unetched or as etched. Theboron constituent developed in these tests there-fore, was not an oxide or a nitride, and it does notappear to be a carbide. Its exact identificationis not established, but it is believed to be an ironboride.
Attempts were made to correlate the boron con-stituent, as observed in specially heated specimenswith the hardenability of the high-purity alloysand some of the experimental high-nitrogen steels.As previously stated, the boron constituent wasobserved in specimens prepared from the ingotsand from homogenized bars of the boron-treatedalloys containing 0.32, 0.47, and 0.74 percent ofcarbon, but in some of the initially homogenizedspecimens the amount of the constituent was con-siderably less than that of specimens from theingots. The hardenability of all the initiallyhomogenized alloys and of the 0.74-percent-carbonalloys as cast was not materially enhanced byboron. With the high-nitrogen steels the har-denability as determined in the end-quench testwas not significantly improved by the additionof boron and no boron constituent was observedin the metallographic test when the soluble nitro-gen was relatively high whereas the hardenabilitywas increased by boron, and the constituent wasobserved when the nitrogen was fixed withtitanium.
It is clear, therefore, that the presence or ab-sence of the boron constituent as determined by
the metallographic test often indicates the re-sponse in hardenability of the steel to a borontreatment but it is not always a reliable criterionof this effect.
IX. Mechanism of Boron Effect onHardenability
A summary of the present results and thosepublished previously strongly supports the beliefof the authors that the effectiveness of boron inenhancing the hardenability of certain steels is dueentirely to its action while in solid solution inaustenite. Only the portion of the boron that isin solutioD at the time of quenching contributestoward an increase in hardenability. The boronundissolved or in the form of compounds is eitherwithout effect, or possibly decreases hardenabilityby acting as transformation centers for austenitein the temperature range where pearlite is formed.
In addition to dissolving in austenite, boron canexist in steel in the form of compounds with nitrogen, oxygen, iron, and carbon. Some of thesecompounds are stable and are not decomposed attemperatures ordinarily used in the heat treatmentof boron-treated steels, whereas other compoundscontaining boron may be partially or entirelydecomposed at these temperatures. Some dataindicate an increase in solubility of boron ingamma iron with increasing temperature, whereasother results indicate a decrease in solubility withincreasing temperature in this field. In any event,only a very small amount of boron is retained insolution at heat-treating temperatures, and it ispossible to obtain the maximum response in thehardenability of certain steels by relatively minuteadditions of this element.
With steels, isothermally transformed, it wasshown [19] that the addition of boron did not de-crease the rate of formation of pearlite in the tem-perature range just below Aei (coarse pearlite),but boron had a marked effect in retarding therate of formation of pearlite in the temperaturerange corresponding to the nose of the S-curve(fine pearlite). Pearlite is formed by a process ofnucleation and growth. It has also been shown[25] that the rate of growth is the governing factorin the rate of formation of coarse pearlite, whereasthe rate of nucleation is the controlling factor inthe rate of formation of fine pearlite. Whenboron enhances the hardenability of a steel, there-fore, it decreases the rate of nucleation and not the
560 Journal of Research
rate of growth of ferrite and carbide. The boronatom, believed to be located interstitially in thegamma iron lattice, is effective in retarding eitherthe rate of formation of nuclei or the rate of theirgrowth to the critical size necessary for transforma-tion to begin, or both.
X. SummaryA series of high-purity iron-carbon alloys vary-
ing in carbon content and other high-purity alloyscontaining 0.4 percent of carbon and 0.7 percentof manganese were prepared for use in this investi-gation. Several steels from a commercial open-hearth heat also were included in the testing pro-gram. The hardenability of the iron-carbon al-loys as affected by variations in initial structuralconditions and in quenching temperature and ofthe iron-carbon-manganese alloys as affected byvariations in quenching temperature was deter-mined in terms of the critical cooling rate. Inaddition, the end-quench test was used for deter-mining the hardenability of the iron-carbon-manganese alloys in some of the experiments car-ried out with the commercial steels. Wide use wasmade of the metallographic test described byGrange and Garvey [4] for detecting the presenceof boron in the form of a constituent in speciallytreated specimens of the high-purity alloys, com-mercial steels, and other experimental steels con-taining high nitrogen.
The addition of 0.002 percent of boron had nomaterial effect on the austenite grain size or gr&incoarsening temperatures of the high-purity alloys.As these alloys were not deoxidized, except withcarbon and in one alloy by some aluminum pickedup from the crucible, the test specimens containedintermediate or coarse grains at relatively lowaustenitizing temperatures.
The general trend in the high-purity alloys,without and with boron, was for the critical coolingrate to decrease (hardenability increase) as thesize of the austenite grains increased.
The influence of boron on the hardenability ofthe iron-carbon alloys varied with the initialcondition of the alloys and with the carbon con-tent. The hardenability of the alloys containing0.3, 0.5, and 0.75 percent of carbon initially asforged and homogenized and the 0.75-percent-carbon alloy as cast was not significantly affectedby the addition of boron. However, the harden-ability of the ingots (as cast) containing 0.3 and
0.5 percent of carbon was markedly improved bythe boron. Each of these two ingots showedapproximately the same degree of hardenability,and they were somewhat deeper hardening thanthe boron-treated 0.75-percent-carbon alloy.
The hardenability of initially forged and homo-genized iron-carbon-manganese alloy was en-hanced by the presence of boron.
Evidence was obtained that the response inhardenability of a commercial steel containing0.0001 percent of boron was sensitive to priorthermal history. The hardenability of this steelwas first impaired and then restored to its normalvalue by certain heat treatments.
Boron was lost in the decarburized zone ofcommercial steels. Evidence indicated that thediffusion rate of boron in austenite is of the sameorder of magnitude as that of carbon.
A boron constituent was observed in speciallytreated specimens of the iron-carbon and iron-carbon-manganese alloys and in an iron-boronalloy with 0.011 percent of boron. It was notobserved in similarly treated specimens of an iron-boron alloy containing relatively high oxygen and0.003 percent of boron (except possibly a trace inspecimens initially packed carburized) or in someexperimental boron-treated steels containing high-soluble nitrogen. Thus the number, size, anddistribution of the boron-containing particlesvaried with the amount and form of the boronand also with the conditions used in heat treatingthe specimens. The presence or absence of aboron constituent as determined in the metal-lographic test often indicated the response inhardenability of the alloy or steel to the borontreatment, but the test was not always a reliablecriterion of this effect.
The effectiveness of boron in increasing thehardenability of certain alloys and steels is believedto be due to its action in retarding the rate ofnucleation of ferrite and carbide while in solidsolution in austenite.
The authors are indebted to Ellen H. Connellyand G. De Vries, former members of the section,
'for assistance in preparing the high-purity alloysand in carrying out some of the tests. Thespectrographic analyses were made by C. H.Corliss, chemical analyses by J. L. Hague andK. D. Fleischer and gas analyses by J. T. Sterling.
Boron-Treated Alloys 561
XL References
[1] T. G. Digges and F. M. Reinhart, J. Research NBS39, 67 (1947) RP1815.
[2] M. Hansen, Der Aufbam der Zweistofflegierungen(von Julius Springer, Berlin, 1936). (Iron-boronsystem, fig. 127, p. 274).
[3] International Critical Tables 2, 450.[4] R. A. Grange and T. M. Garvey, Trans. Am. Soc.
Metals 37, 136 (1946).[5] T. W. Lippert, Iron Age 150, 41 (Nov. 19, 1942).[6] H. T. Chandler and M. A. Bredig, discussion of paper
by Grange and Garvey [4].[7] M. G. Corson, discussion of paper by Grange and
Garvey [4].[8] H. A. Allen, Steel 112, 67 (Feb. 15, 1943).[9] R. S. Dean and B. Silkes, Boron in iron and steel,
Information Circular, Bureau of Mines [IC 73 63](Sept. 1946).
[10] G. H. Boss, Metal Progress 51, 265 (Feb. 1947).[11] M. A. Grossmann, Hardenability calculated from
chemical composition, Metals Tech. (June 1942)TP1437.
[12] Preparation of micrographs of metals and alloys, Am.Soc. Testing Materials Designation: E2-44T,Am. Soc. Testing Materials Standards, part I,Metals, p. 1875 (1944).
[13] S. J. Rosenberg and T. G. Digges, Trans. Am. Soc.Metals 29, 638 (1941); J. Research NBS 25, 215(1940) RP1322.
[14] H. J. French, Trans. Am. Soc. Steel Treating 17,798 (1930).
[15] A. L. Boeghold and E. W. Weinman, Metal Progress51, 96-B (Jan. 1947).
[16] C. B. Post, M. C. Fetzer, and W. H. Fenstermacher,Trans. Am. Soc. Metals 35, 85 (1945).
[17] Tentative method of end-quench test for harden-ability of steel, Am. Soc. Testing Materials Desig-nation A 255-42T, Am. Soc. Testing MaterialsStandards, part I, Metals, p. 1106 (1942).
[18] M. A. Grossmann, M. Asimow, and S. F. Urban,Hardenability, its relation to quenching and somequantitative date, Hardenability of alloy steels, p.125 (Published by the Am. Soc. Metals, 1939).
[19] United States Steel Corp., Research Laboratory,Atlas of isothermal transformation diagrams (1943).
[20] T. G. Digges, Trans. Am. Soc. Metals 29, 285 (1941);J. Research NBS 24, 723 (1940) RP1308.
[21] G. D. Rahrer and C. D. Armstrong1, Trans. Am. Soc.Metals 40, 1099 (1948).
[22] A. B. Greninger and A. R. Troiano, Trans. Am. Soc.Metals 28, 537 (1940).
[23] N. Tschischewski, J. Iron Steel Inst. 95, 185 (1917).[24] T. P. Campbell and H. Fay, Ind. Eng. Chem. 16, 719
(1924).[25] Robert F. Mehl, Trans. Am. Soc. Metals 29, 825
(1941).
562 Journal of Research
A B
* " ^ . I ' " " * • '" Hats • & R • - •: . i 1 - . ' ' - . "•
FIGURE 1. Effects of boron and temperature on the austenite grain size of high-purity alloys.
Etched with 1-percent picric—5-percent hydrochloric acid in alcohol, X100.
Figure
ABCDEF
Alloy
B14B14B12
B2B2
Bl2
C
0.41.41.54.47.47.54
Percentage of—
B
0.0024.0024None
0. 0020. 0020None
Al
0.003.003
< . 001Not detectedNot detected
<0.001
Tempera-ture
°F1, 5002, 0001,8001,8001,8001,800
ASTMgrain No.
404413
Boron-Treated Alloys 563
FIGURE 2. Effects of rate of heating, temperature, and time at temperature on the austenite grain size of the 0.42-percent-carbon—0.67-percent-manganese alloy without boron (BIS)
A, B, C,—Photomicrographs of specimens, 1 in. in diameter by 4 in. long, heated relatively slowly to 1,500°, 1,700°, or 1,900° F, respectively, and held attemperature for 30 to 35 min (in furnace for 45 min); etched with 1-percent nit'al, xlOO. D, E, F—Photomicrographs of specimens, 1/10 by 1/10 by 0.04 in., heatedrelatively rapidly to 1,500°, 1,700°, or 1,900°F, respectively, and held at temperature for 15 min (in furnace for 17 min); etched with 1-percent picric—5-percenthydrochloric acid in alcohol, xlOO.
F I G U R E 14. jEJ^erf 0/ cooZiw^ fo'meon the structure of the 0.32-percent-
" 0 0 .500 .eoo 1700 isoo 1900 2000
QUENCH.NO TEMPERATURE-«F
8 •<
b -2
1500 1600 1700 1800 1900 2000
QUENCHING TEMPERATURE, T
FIGURE 16. £Jfed 0/ cooling timestructure of the 0.42-percent-
carbon—0.0021-percent-boron alloy FIGURE 15. Relation of critical cooling carbon—0.67-percent-manganese alloy(B6) quenched from different tern- rate to quenching temperature of some (B13) quenched from different temper-
of the iron-carbon alloys.peratures.The specimens were prepared from the
ingot.
peratures.The specimens were prepared from a homogen-
FIGURE 17. Effect of cooling time on thestructure of the 0.41-percent-carbon—0.64 - percent-manganese—0.0024 - per-cent-boron alloy (B14) quenched fromdifferent temperatures.
The specimens were prepared from a homogenizedbar.
0 4 8 12 16 20 24 28 32 36 40
DISTANCE FROM QUENCHED END OF SPECIMEN-SIXTEENTHS OF INCH
FIGURE 18. Hardenability* curves of the iron-carbon-manganese alloys.
The specimens were normalized at 1,650° F before end-quench-ing from temperature as indicated.
568 Journal of Research
II-J oO UJ
FIGURE 19. Relation of quenchingtemperature to the hardenahility of theiron-carhon-manganese alloys.
The specimens were prepared from homogen-ized bars. Austenite grain size of the specimensused for determining the critical cooling rate isgiven in table 2 and for the end-quenched barsin figure 18.
DISTANCE FROM QUENCHED END OF SPECIMEN-SIXTEENTHS OF INCH
FIGURE 20. Effect of prior history on the hardenahility as determined in the end-quench test of some commercial steelscontaining 0.43 percent of carhon and 1.6 percent of manganese.
Steel C15 without boron; C9, 0.0003 percent of B (grainal No. 79); C12, 0.0022 percent of B (ferroboron); C14, 0.0036 percent of B (ferroboron); C19, 0.0001percent of B (grainal No. 1). All specimens were held for 45 min in the furnace at temperature just prior to end-quenching except as indicated. A, Specimensnormalized at 1,650° F before end-quenching from 1,550° F; B, specimens normalized at 1,900° F before end-quenching from 1,550° F; C, specimens quenchedfrom 1,900° F in water before end-quenching from 1,550° F; D, specimens normalized at 1,650° F reheated to 1,900° F, then cooled to 1,550° F and held for 30min before end-quenching; E, specimens normalized at 1,650° F, reheated to 1,900° F, then cooled to 1,425° F and held for 30 min before end-quenching; F,specimens normalized at 1,650° F, reheated to 1,900° F, then cooled to 1,425° F and held for 30 min then quenched in water. The specimens were then treatedas follows: Specimens C19 A and C9 reheated to 1,550° F and end-quenched; specimen C19 B reheated to 1,750° F and end-quenched.
Boron-Treated Alloys 569
FIGURE 21. Effect of quenching tem-perature on the temperature of thestart of the transformation of aus-tenite to martensite in a commercialsteel containing 0.43 percent of car-bon, 1.6 percent of manganese, and0.0036 percent of boron (C14).
>00
X -
: A U S T E N . T W T A T ^ S - T R
sis
* F̂ Roi THET12IP°EVA?SSE F R " G E " O O " - ^ - F
X -' —
t— ,_—•
c—. t
4
The average size of the austenite grains rangedfrom about American Society for Testing Mate-rials number 5 to 2 with change in temperaturefrom 1,550° to 2,000° F.
FIGURE 22. Distribution of boron in a decarburized layer of a commercial boron-treated steel (C14)-
The specimen was decarburized by heating in a furnace (reducing atmosphere) at 1,900° F for 8 hr and then cooling in mica. The left edge of the photomicro-graph corresponds to the original surface of the specimen, and the characteristic structure (not decarburized) is shown at the right, etched with 1 percent-nital,X100 (reduced approximately one-half in reduction). Determination for boron by spectrographic analysis was made on the heat-treated specimen at the surfaceand at various levels below this surface; the successive levels were obtained by progressive grinding. The nominal boron content of steel C14 was 0.0038 percent(heavy horizontal line) as determined spectrographically.
570 Journal of Research
B
cffi ' D
FIGURE 23. Typical structures of boron-treated alloys as cast or as homogenized.
A, Alloy (B6) containing 0.32 percent of carbon and 0.0021 percent of boron as cast. Ferrite (white) located in primary austenite grain boundaries containsspheroidized carbides; some spheroidization of carbides occurred during the cooling of the ingot, etched with 4-percent picral, X100. B, alloy (B2) containing0.47 percent of carbon and 0.0020 percent of boron as cast, etched with 4-percent picral, X100. C, alloy (B14) containing 0.41 percent of carbon, 0.64 percent ofmanganese, 0.0024 percent of boron as homogenized, etched with 1-percent nital, X500. D, alloy (B2) as cast, unetched, X100. E, alloy (B2) as cast, etchedwith 4-percent picral, X500. F, same area as E, etched electrolytically with 10-percent sodium cyanide in water, X500.
Boron-Treated Alloys 571
A B
FIGURE 24. Structure produced in a quenched specimen of the 0.47 percent carbon—0.0020-percent boron alloy (B2).
A small specimen, initially as cast, was heated to 1,900° F for 3 min and then cooled in a lead bath at 1,300° F for 1 min., followed by quenching in a solution
572 Journal of Research
A - B
. • • • . - • • : • . - X • • • •
T\
DFIGURE 25. Boron constituent in a commercial steel (C14)-
Etched with 4-percent picral. A, small specimen heated to 2,000° F for 20 min and then cooled in a lead bath at 1,200° F for 2 min, followed by quenching inwater at room temperature. The boron constituent (dark etching dots) is located principally in the parent austenite grain boundaries, X100; B, same specimenas A, X500; C, small specimen heated to 2,000° F for 20 min and then quenched in iced sodium hydroxide water-solution, X500; D, same specimen as C. Notethe boron constituent also within the grains, X500.
Boron-Treated Alloys 573
A
BFIGURE 26. Boron constituent in at high-puriy iron-boron alloy (B4).
Etched with 4-percent picral. A, small specimen, initially as cast, heated to 2,000° F for 3 min, and then cooled in a lead bath at 1,700° F for 5 min followedby quenching in sodium hydroxide solution at room temperature. The left edge of the photomicrograph corresponds to the original surface of the specimen.Note the boron constituent (dark etching dots) located in the parent grain boundaries and in parallel planes within some of the grains; it does not extend to theoriginal surface of the specimen, X100; B, same specimen as A, X4,000; C, same specimen as A after reheating in a lead bath at 1,650° F for 5 min and thenquenched in sodium hydroxide solution, X100.