Page 1
Effect of cerium doping on the structural, morphological,photoluminescent and thermoluminescent properties of sodiumstrontium pentaborate microstructures
S. W. Joo1 • B. Deva Prasad Raju2 • G. R. Dillip1 • A. N. Banerjee1 •
J. H. Jung3
Received: 12 September 2015 / Accepted: 15 January 2016
� Springer-Verlag Berlin Heidelberg 2016
Abstract We have reported a new blue-emitting cerium
(Ce3?)-doped sodium strontium pentaborate (Na3SrB5O10)
microstructures via a conventional high-temperature solid-
state reaction route. X-ray diffraction analysis revealed the
phosphors crystallized in triclinic structure. Significantly,
well-shaped morphology in micrometer dimension phos-
phors was identified by field emission scanning electron
microscopy. The phosphors displayed a single broad blue
emission centered at around 370 nm because of the Ce3?
5d–4f transition under the excitation wavelength of
232 nm. In the region of room temperature to 350 �C, thethermoluminescence (TL) glow curves consist of only one
sharp peak located at about 200.31 �C. The optimum
concentration of Ce3? for TL and PL intensity was found to
be 1 at.% in host. These results suggest that the newly
proposed Na3SrB5O10:Ce3? phosphor with the suitable TL
emission (Tm * 200 �C) in micrometer dimension might
potentially be used for thermoluminescence dosimetric
applications.
1 Introduction
Over the recent past, due to increased interest of the
researchers, they have been devoted to studying the borate
materials for thermoluminescence dosimetric (TLD)
applications because of their rich variety in structure, wide
transmittance spectra with high damage threshold, good
chemical and physical stability and wide band gaps [1–3].
Although various materials as TL materials have been used
in several applications, many efforts are placed on better
tissue equivalence, neutron and gamma sensitive to
develop new TL materials. Particularly, the TL materials
based on borates have been considered as one of the most
promising materials in dosimetry due to their tissue-
equivalent absorption coefficient and neutron sensitivity [4,
5]. Currently, there is a great demand of the dosimetric
phosphors, which exhibit simple and sharp glow curves. In
the literature, a large number of TL materials have been
investigated [6–9]; among them not all of the materials to
be attractive for dosimetry, especially for application in
connection with personal and environmental dosimetry.
But, the obtained results provide the useful information
regarding the defect and trap structure that will result in
search for new borate TLD material for further research in
this field. Therefore, efforts are being made either to
develop novel phosphors or to improve the existing ones.
The researchers in the field of luminescence have special
interest in Ce3?-doped materials because of their low cost,
spin and parity allowed optical 4f–5d transitions and have a
fast radiative lifetime of about 10–50 ns. It is desirable for
applications in scintillators, light-emitting diodes (LEDs)
and field emission displays (FEDs). And also covalence
allows altering the energy difference between 4f and
5d levels of Ce3? ions in the crystal lattice, which alters the
emission at different wavelengths [10–13]. Over the past
S. W. Joo and B. Deva Prasad Raju have contributed equally to this
work.
& G. R. Dillip
[email protected]
& A. N. Banerjee
[email protected] ; [email protected]
& J. H. Jung
[email protected]
1 School of Mechanical Engineering and Technology,
Yeungnam University, Gyeongsan 712 749, South Korea
2 Department of Future Studies, Sri Venkateswara University,
Tirupati 517 502, India
3 School of Chemical Engineering, Yeungnam University,
Gyeongsan 712 749, South Korea
123
Appl. Phys. A (2016) 122:102
DOI 10.1007/s00339-016-9638-1
Page 2
few decades, extensive research has been carried out on
Ce3?-doped borates because of their enormous applications
in phosphors, UV-absorbing filters (or) UV emitters and
activators for energy transfer, detectors for ionizing radi-
ation, scintillators for elemental particles, imaging,
lithography, optical data recording, solid-state lasers and
displays [14–16]. Generally, the Ce3? is optically active,
and the emission occurs typically in UV/blue region
depending upon the host structure and 4f–5d transition.
Ce3? ion plays an important role as an activator in the TL
phosphors and its emission, intense enough to be used for
practical applications. It is known that usually the Ce3?
emission results from 5d to 4f type of transition while the f–
f transition occurs in the IR region. The ground state of
Ce3? splits into 2F5/2 and 2F7/2 levels for possible 4f con-
figuration. The emission results above the 2F7/2 excited
state correspond to 5d configuration in the form of broad
bands [17, 18].
Recently, Wu et al. [19] reported the synthesis of a new
borate, Na3SrB5O10, crystallized in triclinic structure. In
the previous paper, our group studied and explored sys-
tematically, the Dy3?-doped Na3SrB5O10 phosphors for
solid-state lighting [20] application. In the present work,
the photoluminescence and thermoluminescence properties
of Ce3?-doped Na3SrB5O10 material were investigated. To
the best of our knowledge, no reports have appeared in the
literature on optical and thermal properties of Ce3?-doped
Na3SrB5O10 host. For the first time, the trapping parame-
ters such as order of kinetics (b), activation energy (E) and
frequency factor (s) of Na3SrB5O10:Ce3? phosphors were
estimated using Chen’s full width method, and the obtained
results were discussed and reported in detail. The TL
dosimetric properties of Ce3?-doped Na3SrB5O10
microstructures were examined under the irradiation of c-rays, indicating that the proposed phosphors might be a
potential material for radiation dosimetry.
2 Experimental
In general, synthesis of borate compounds is quite difficult
because of the fact that it may form crystalline as well as
glassy phase based on the method of selection. For
obtaining efficient luminescent materials, the crystalline
form is essential. In the present study, to receive pure phase
of the final product, the Ce3?-doped Na3SrB5O10 poly-
crystalline phosphors were synthesized by a single-step
solid-state reaction method. The starting materials were of
high-purity (99.9 %) analytical reagent (AR) grade of
Na2CO3, SrCO3, H3BO3 and CeO2 used as received with-
out further purification. The concentration of Ce3? was
fixed at 0.5, 1, 3 and 5 at.% in the host matrix. In the first
step, the stoichiometric amounts of raw materials were
mixed and ground homogenously in an agate mortar for
1 h. Then, the mixture was transferred into a porcelain
crucible and calcined in an electric furnace at 800 �C for
8 h. After that, the samples were furnace-cooled to room
temperature (RT) and finally ground again into powder for
further measurements.
Structure of the as-prepared phosphors was analyzed
using a PANalytical X’pert PRO X-ray diffractometer with
CuKa radiation (k = 0.154056 nm) at 40 kV and 30 mA.
The data were recorded over a 2h range from 20� to 80� inthe step-scan mode with a step size of 0.02�. Fourier
transform infrared (FTIR) spectra were measured on a
Bruker Alpha-T FTIR spectrophotometer using KBr pellets
in the spectral range between 4000 and 500 cm-1. The
microstructure of samples was investigated using a field
emission scanning electron microscope (FE-SEM, Hitachi
S-4200, Japan), and elemental analysis was carried out by
energy-dispersive X-ray analysis (EDS) on the FE-SEM
attached X-ray column. To improve the conductivity of the
samples, an ultra-thin layer of platinum was sputter-coated
(E-1030 Ion sputter, Hitachi, Japan) on the sample surface.
UV–Vis diffuse reflectance spectra (DRS) were measured
on a UV–Vis–NIR spectrophotometer (Jobin Varian Cary
5000, USA) using a polytetrafluoroethylene (PTFE) as a
standard. Photoluminescence excitation (PLE) and emis-
sion (PL) properties were characterized on a Jobin–Yvon
Fluorolog-3 Fluorimeter with a 150-W Xe lamp as the
excitation source. All the measurements were taken at RT.
For thermoluminescence studies, the powders were
exposed to gamma (c) rays from a 60Co source at a rate of
0.58 kGyh-1 for 5 Gy. TL glow curves were recorded at
two different irradiation times of 30 s and 5 min. In order
to reduce the error, after the desired exposure time, at the
same dose, the glow curves were measured immediately on
a standard TL reader Harshaw-3500 between RT and
350 �C at a heating rate of 5 �C/s.
3 Results and discussion
3.1 XRD studies
XRD patterns of the Na3SrB5O10:Ce3? phosphors
(Ce3? = 0.5, 1, 3 and 5 at.%) are shown in Fig. 1. For all
samples, the dominant diffraction peaks were well indexed
as the Na3SrB5O10 borate crystal of triclinic structure
reported by the Crystallography Open Database (COD) ID
no: 2016662. Due to the increase in CeO2 concentration in
the host, the predominant diffraction peaks are shifted
toward higher 2h angle side, suggesting that the introduced
Ce3? ions might be substituted in the host cation sites.
According to ionic radii of Na? (1.02 A, coordination
number (CN) = 6)/Sr2? (1.26 A, CN = 8)/B3? (0.11 A,
102 Page 2 of 10 S. W. Joo et al.
123
Page 3
CN = 4)/Ce3? (1.14 A, CN = 8) and disparity of ionic
states, the Ce3? ions would preferably occupy at the Na?/
Sr2? cation sites in Na3SrB5O10 crystal [21, 22]. This is
because of the similar ionic radii of both the ions (Na? and
Sr2?). In general, when a metal cation is substituted for an
ion with a different valence in the host lattice like Na3-SrB5O10, the charge compensator, such as, Na? is
employed to keep the charge balance. Therefore, the charge
compensation in the Na3SrB5O10:Ce3? phosphor is most
likely to be described by two possible mechanisms:
1. Two Sr2? ions are replaced by one Ce3? ion and one
alkaline cation,
2Sr2þ ! Ce3þMþ; Mþis an alkaline cation like Naþ
ð1Þ
2. Charge compensation by a strontium vacancy,
3Sr2þ ! 2Ce3þ þ VSr ð2Þ
Fig. 1 XRD patterns of
Na3Sr1-xB5O10:Cex3? phosphors
(x = 0.5 – 5 at.%)
Fig. 2 FTIR spectra of
Na3Sr1-xB5O10:Cex3? phosphors
(x = 0.5 – 5 at.%)
Effect of cerium doping on the structural, morphological, photoluminescent and… Page 3 of 10 102
123
Page 4
3.2 FTIR studies
In order to confirm the coordination surrounding the B–
O in Na3SrB5O10:Ce3? phosphors, the FTIR spectra
were recorded and are described in Fig. 2. We note from
the figure that the assignment of vibrations for all sam-
ples was similar in nature and no significant peak
shifting was observed. The bands observed in the region
of 1460 to 1225 cm-1 correspond to the BO3 asym-
metric stretching vibrations, while the bands between
1055 and 925 cm-1 are due to the BO4 asymmetric
stretching modes. The bands associated with BO3 and
BO4 out-of-plane bending modes are overlapped and
located in the range of 820 to 705 cm-1. The vibrations
below 550 cm-1 should be ascribed to the Na–O and Sr–
O vibrations [23]. The broad absorption band with a
sharp shoulder at about 3340 and 3617 cm-1, respec-
tively, suggests the presence of –OH group in the sam-
ples [24]. These vibrations usually arise from physically
absorbed water molecules on the samples surface during
the grinding process to make the KBr pellet under non-
vacuum condition.
3.3 FE-SEM and EDS studies
Figure 3 shows the surface morphology of Ce3?-doped
Na3SrB5O10 powders. In the figure, the morphology of
samples is similar to appear, even though a slight
aggregation of particles was seen in the figure that usually
occurs during the high calcination. However, the
agglomeration is decreased due to the increase in Ce3?
ions content in the host, suggesting the solubility of
dopant in Na3SrB5O10 crystal. A closer look at the
micrograms clearly suggests that the morphology of the
synthesized phosphors appears to have hexagonal plate-
like morphology (highlighted in the images by white
circles). Therefore, this kind of defined morphology of
phosphor might be act as a potential candidate in lumi-
nescence applications. To identify the presence of ele-
ments in the Na3SrB5O10:Ce3? phosphors, qualitatively
the EDS analysis was carried out. Figure 4 shows the
EDS spectra of Ce-doped Na3SrB5O10 microstructures. It
confirmed the presence of Ce element in the Na3SrB5-
O10:Ce3? phosphors. For reference, the authors presented
a table (inset of Fig. 4c), which represents the qualitative
estimation of elemental percentage of Na, Sr, O and Ce.
The elemental peaks of C and Pt are appeared in spectra
due to the carbon tap and coated platinum particles on the
sample surface, respectively. Hence, the absence of other
impurity elements in EDS profiles is an evidence of the
purity of prepared sample, which are matched well with
the structural analysis.
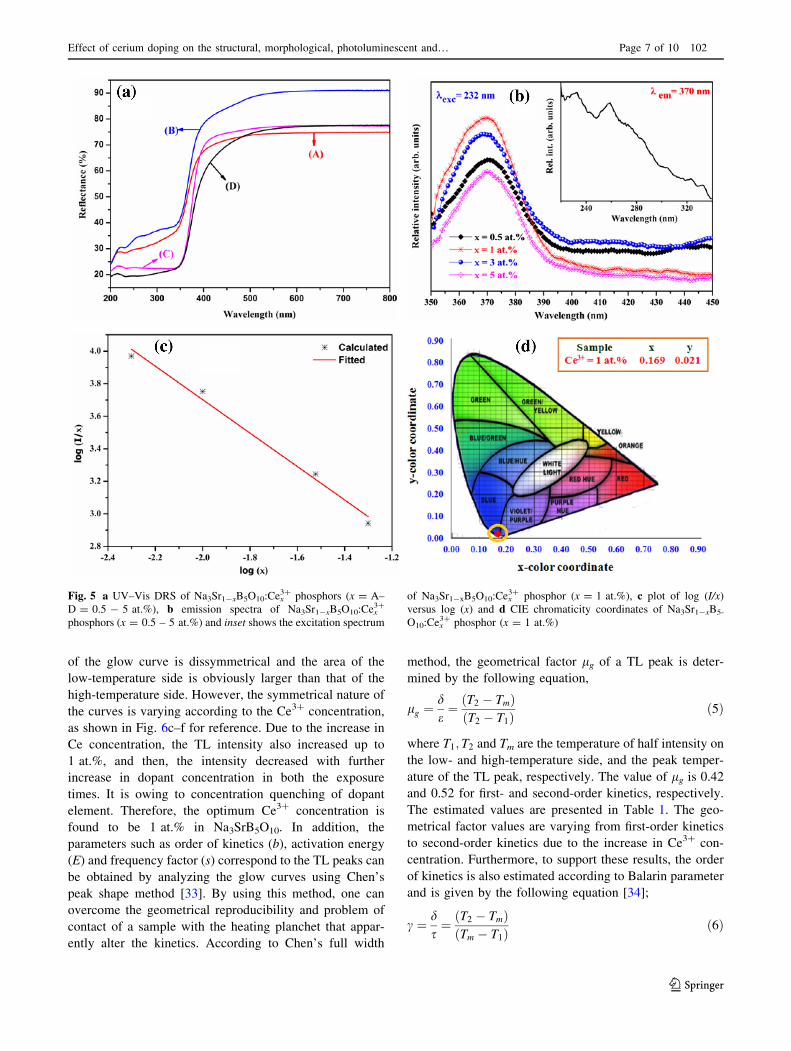
3.4 DRS studies
DRS of the Na3SrB5O10:Ce3? (Ce3? = 0.5, 1, 3 and
5 at.%) phosphors are depicted in Fig. 5a. In the range of
800 to 400 nm, all the samples show platform of high
reflectance and then start to decrease between 400 and
200 nm. In the range of 400 to 200 nm, a couple of
absorption bands at around 231 and 270 nm correspond to
the 4f–5d transition of Ce3? ion [25]. The similar bands are
also observed in the excitation spectrum. Therefore, due to
the increase in dopant concentration in the host material,
the enhancement of optical absorption in UV region was
observed.
3.5 Photoluminescence properties
The photoluminescence excitation spectrum of the Na3-SrB5O10:Ce
3? (Ce3? = 1 at.%) phosphor monitored at
370 nm emission is shown in inset of Fig. 5b. The spec-
trum composed of five bands, located at around 232, 259,
305, 323 and 332 nm that are corresponding to the transi-
tions from the Ce3? 4f 1 (2F5/2) ground state to the various
4f 0 (5d1) crystal-field components. These bands show that
the crystal-field splitting of Ce3? 5d level completely split
into five levels 5d(1), 5d(2), 5d(3), 5d(4) and 5d(5) at about
5.34, 4.79, 4.06, 3.84 and 3.73 eV energies, respectively
[26]. Among the absorption bands, we used the excitation
wavelength of 232 nm to further record the emission
spectra of phosphors. Figure 5b describes the emission
spectra of Na3SrB5O10:Ce3? phosphors as a function of
Ce3? ions. The spectra consist of only single broad band in
the range from 350 to 450 nm, for all the samples with
similar profiles peaked at around 370 nm. In the literature,
many reports have appeared on the similar emission bands
[14, 27–29]. For instance, Nagaoka and Adachi [28]
reported the emission spectra of NaCl:Ce3? phosphor,
peaked at 360 nm (blue emission) under the excitation of
269 nm. Kore et al. [29] explored the photoluminescence
properties of Na6Mg(SO4)4:RE (RE = Ce, Tb) phosphors,
and they obtained single broad emission band centered at
355 nm (kex = 300 nm). In our present investigation, the
authors obtained a single broad emission band peaked at
370 nm under the excitation wavelength of 232 nm at RT.
This broad band is ascribed to the excited state 5d to
4f ground state transition of Ce3? ions. However, due to the
increase in Ce3? ions concentration, the emission intensity
also increased and reached maximum at 1 at.%, and then,
the intensity declined drastically for 3 and 5 at.% of Ce3?
ions, respectively. This is due to the concentration
quenching. According to Dexter’s theory [30], the con-
centration quenching occurs by the non-radiative energy
migration between identical activators inside the host
crystal. Furthermore, to find electric multipolar interaction
102 Page 4 of 10 S. W. Joo et al.
123
Page 5
mechanism in Ce3?-doped Na3SrB5O10 phosphor, the
emission intensity (I) per activator ion was calculated
according to the Van Uitert equation [31];
I
x¼ k 1þ b xð Þh=d
h i�1
ð3Þ
where I/x is the emission intensity per activator content,
Fig. 3 SEM images of
Na3Sr1-xB5O10:Cex3? phosphors
(x = 0.5 – 5 at.%); a,b x = 0.5 at.%, c, d x = 1 at.%,
e, f x = 3 at.% and g,h x = 5 at.%
Effect of cerium doping on the structural, morphological, photoluminescent and… Page 5 of 10 102
123
Page 6
x is the activator concentration, which is not less than the
critical concentration, d is the sample dimension (d = 3 for
energy transfer among the activators inside particles), k and
b are the constants (independent of activator concentra-
tion), and h is an indication of electric multipolar. The
index h could be 6, 8 and 10 for the dipole–dipole (d–d),
dipole–quadrupole (d–q) and quadrupole–quadrupole (q–q)
electric interactions, respectively, and h = 3 corresponds
to exchange interactions. To find value of h, the log (I/
x) dependence of log (x) at 370 nm emission is plotted and
is shown in Fig. 5c, which gives a linear fit having an
y-intercept, 1.6448 and a slope (-h/3) of -1.0287. The
value of h estimated to be *3.08, which is close to 3.
Hence, the concentration quenching for the two Ce3? ions
results from exchange interaction in the Na3SrB5O10:Ce3?
phosphors. It is known that the distance between identical
activators could be found by critical distance (Rc) using the
following formula [32],
RC � 23V
4pxcN
� �1=3ð4Þ
where V is the volume of unit cell (A3), Xc is the critical
concentration of activator ions (at.%), and N is the number
of host cations (Sr2?) in the unit cell. In the present
phosphor, the values of V, Xc, and N are considered to be
446.47 A3, 0.01 and 2, respectively [19]. The value of Rc is
found to be around 34.09 A. Moreover, to examine the
emission color of phosphor, the International Commission
on Illumination (CIE) 1931 chromatic coordinates are
calculated. The estimated chromaticity coordinates of
Na3SrB5O10:Ce3? phosphor (Ce3? = 1 at.%) are located
in blue region, as shown in CIE diagram in Fig. 5d.
3.6 Thermoluminescence properties
To examine the defect properties of Ce3?-doped Na3-SrB5O10 phosphors, the thermoluminescence studies were
carried out. In general, the analysis of TL spectrum pro-
vides useful information of the presence of trapping centers
and their distribution in the borate materials. Figure 6a, b
shows the typical TL glow curves of Na3SrB5O10:Ce3?
microstructures, irradiated at a dose of 0.58 KGyh-1 for
5 Gy with irradiation times of 30 s and 5 min, respectively.
The glow curves consist of a single broad band having
similar profiles for various concentrations of the Ce3? ions,
measured in both the exposure times (5 and 30 min).
However, various peak positions and intensities are
observed for different concentrations of Ce3?. It is known
that a simple glow curve with a high-temperature TL glow
peak around 200 �C shows the high-temperature traps that
are formed during gamma ray irradiation, and these are not
decay at RT [5]. Hence, it is a key characteristic of the
TLD material. In our present investigation, we obtained a
simple glow curve with a main peak at about 200.31 �C for
1 at.% Ce3?-doped Na3SrB5O10 phosphor at 5 min of c-rayirradiation. For lower concentration of Ce3? ions, the shape
Fig. 4 EDS profiles of Na3Sr1-xB5O10:Cex3? phosphors (x = 0.5 – 5 at.%); a x = 0.5 at.%, b x = 1 at.%, c x = 3 at.% and d x = 5 at.%. Inset
of c shows the elemental percentage of Na3Sr1-xB5O10:Cex3? phosphor (x = 3 at.%)
102 Page 6 of 10 S. W. Joo et al.
123
Page 7
of the glow curve is dissymmetrical and the area of the
low-temperature side is obviously larger than that of the
high-temperature side. However, the symmetrical nature of
the curves is varying according to the Ce3? concentration,
as shown in Fig. 6c–f for reference. Due to the increase in
Ce concentration, the TL intensity also increased up to
1 at.%, and then, the intensity decreased with further
increase in dopant concentration in both the exposure
times. It is owing to concentration quenching of dopant
element. Therefore, the optimum Ce3? concentration is
found to be 1 at.% in Na3SrB5O10. In addition, the
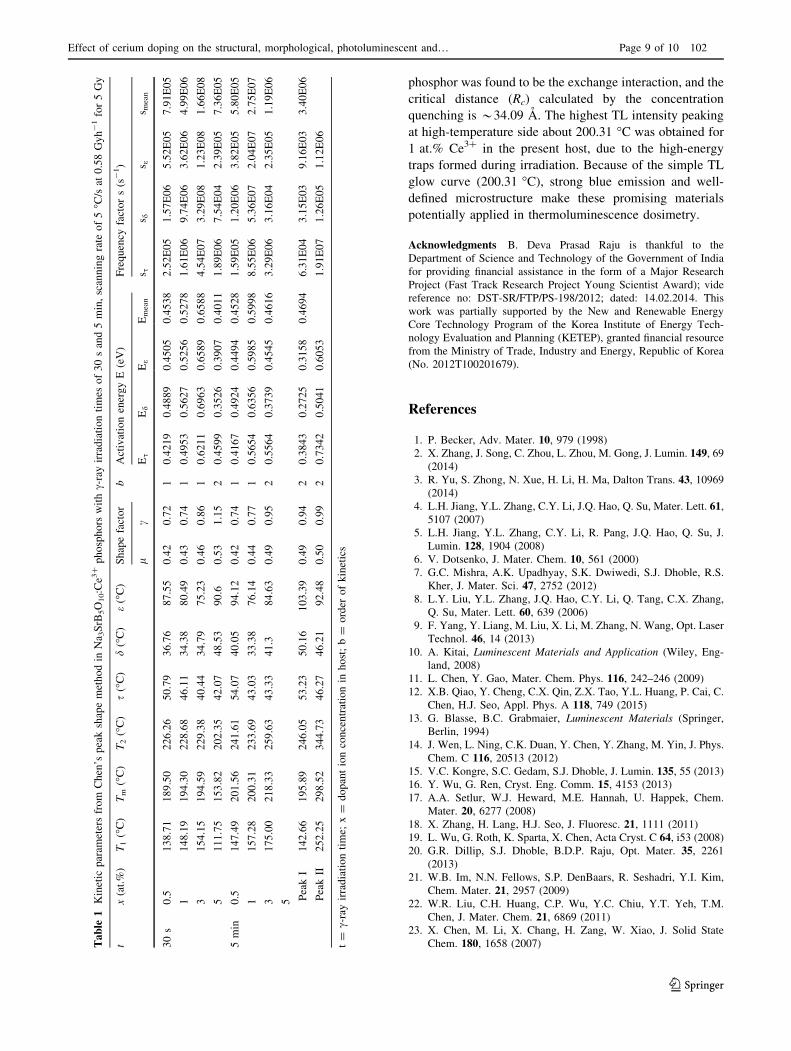
parameters such as order of kinetics (b), activation energy
(E) and frequency factor (s) correspond to the TL peaks can
be obtained by analyzing the glow curves using Chen’s
peak shape method [33]. By using this method, one can
overcome the geometrical reproducibility and problem of
contact of a sample with the heating planchet that appar-
ently alter the kinetics. According to Chen’s full width
method, the geometrical factor lg of a TL peak is deter-
mined by the following equation,
lg ¼de¼ T2 � Tmð Þ
T2 � T1ð Þ ð5Þ
where T1; T2 and Tm are the temperature of half intensity on
the low- and high-temperature side, and the peak temper-
ature of the TL peak, respectively. The value of lg is 0.42and 0.52 for first- and second-order kinetics, respectively.
The estimated values are presented in Table 1. The geo-
metrical factor values are varying from first-order kinetics
to second-order kinetics due to the increase in Ce3? con-
centration. Furthermore, to support these results, the order
of kinetics is also estimated according to Balarin parameter
and is given by the following equation [34];
c ¼ ds¼ T2 � Tmð Þ
Tm � T1ð Þ ð6Þ
Fig. 5 a UV–Vis DRS of Na3Sr1-xB5O10:Cex3? phosphors (x = A–
D = 0.5 - 5 at.%), b emission spectra of Na3Sr1-xB5O10:Cex3?
phosphors (x = 0.5 – 5 at.%) and inset shows the excitation spectrum
of Na3Sr1-xB5O10:Cex3? phosphor (x = 1 at.%), c plot of log (I/x)
versus log (x) and d CIE chromaticity coordinates of Na3Sr1-xB5-
O10:Cex3? phosphor (x = 1 at.%)
Effect of cerium doping on the structural, morphological, photoluminescent and… Page 7 of 10 102
123
Page 8
It ranges from 0.7 to 0.9 and between 1.05 and 1.20 for
first- and second-order kinetics, respectively. The calcu-
lated values are presented in Table 1, which is in good
agreement with the geometrical factor values. Therefore,
the activation energy (E) could be calculated using the
following relation [33, 35]
E ¼ Cg kT2m=g
� �� bg 2kTmð Þ ð7Þ
where g stands for s, d and x, while s ¼ Tm � T1 and
d ¼ T2 � Tm are the low- and high-temperature half-
widths, respectively, x ¼ T2 � T1 is the full width and k is
the Boltzmann’s constant.
Cs ¼ 1:51þ 3 lg � D� �
Cd ¼ 0:976þ 7:3 lg � D� �
Cx ¼ 2:52þ 10:2 lg � D� �
bs ¼ 1:58þ 4:2 lg � D� �
bd ¼ 0
bx ¼ 1
ð8Þ
Here, D = 0.42 and 0.52 for first- and second-order TL
peaks, respectively. Using the above equations, the acti-
vation energy (E) was estimated and is listed in Table 1.
The value of frequency factor (s) can be obtained with the
following equations,
bEkT2
m
¼ s exp�E
kTm
� �and
bEkT2
m
¼ s exp�E
kTm
� �1þ 2
kTm
E
��������
ð9Þ
for first- and second-order kinetics, respectively.where b is
the heating rate (5 �C/s). The calculated values are sum-
marized in Table 1. At 5-min irradiation time, the E and
s values were 0.5998 eV and 2.75E07 s-1, respectively, for
1 at.% Ce3? ions.
4 Conclusion
In conclusion, a new Na3SrB5O10:Ce3? blue-emitting
phosphors were synthesized via a simple and facile high-
temperature solid-state reaction route. The synthesized
phosphors show triclinic structure upon calcination at
800 �C for 8 h. The Na3SrB5O10:Ce3? phosphors exhibit
intense single broad emission for all concentrations cen-
tered at about 370 nm under the 232 nm excitation. The
energy transfer from Ce3? to Ce3? in Na3SrB5O10
Fig. 6 Thermoluminescence glow curves of Na3Sr1-xB5O10:Cex3?
phosphors (x = 0.5 – 5 at.%) with irradiation times of 30 s (a) and5 min (b) and their corresponding insets show the variation of TL
intensity as a function of Ce3? ion concentration. c–f Show the
variation nature of TL glow curves of Na3Sr1-xB5O10:Cex3? phos-
phors (x = 0.5 – 5 at.%) at 5 min of c-ray irradiation time,
respectively
102 Page 8 of 10 S. W. Joo et al.
123
Page 9
phosphor was found to be the exchange interaction, and the
critical distance (Rc) calculated by the concentration
quenching is *34.09 A. The highest TL intensity peaking
at high-temperature side about 200.31 �C was obtained for
1 at.% Ce3? in the present host, due to the high-energy
traps formed during irradiation. Because of the simple TL
glow curve (200.31 �C), strong blue emission and well-
defined microstructure make these promising materials
potentially applied in thermoluminescence dosimetry.
Acknowledgments B. Deva Prasad Raju is thankful to the
Department of Science and Technology of the Government of India
for providing financial assistance in the form of a Major Research
Project (Fast Track Research Project Young Scientist Award); vide
reference no: DST-SR/FTP/PS-198/2012; dated: 14.02.2014. This
work was partially supported by the New and Renewable Energy
Core Technology Program of the Korea Institute of Energy Tech-
nology Evaluation and Planning (KETEP), granted financial resource
from the Ministry of Trade, Industry and Energy, Republic of Korea
(No. 2012T100201679).
References
1. P. Becker, Adv. Mater. 10, 979 (1998)
2. X. Zhang, J. Song, C. Zhou, L. Zhou, M. Gong, J. Lumin. 149, 69(2014)
3. R. Yu, S. Zhong, N. Xue, H. Li, H. Ma, Dalton Trans. 43, 10969(2014)
4. L.H. Jiang, Y.L. Zhang, C.Y. Li, J.Q. Hao, Q. Su, Mater. Lett. 61,5107 (2007)
5. L.H. Jiang, Y.L. Zhang, C.Y. Li, R. Pang, J.Q. Hao, Q. Su, J.
Lumin. 128, 1904 (2008)
6. V. Dotsenko, J. Mater. Chem. 10, 561 (2000)
7. G.C. Mishra, A.K. Upadhyay, S.K. Dwiwedi, S.J. Dhoble, R.S.
Kher, J. Mater. Sci. 47, 2752 (2012)
8. L.Y. Liu, Y.L. Zhang, J.Q. Hao, C.Y. Li, Q. Tang, C.X. Zhang,
Q. Su, Mater. Lett. 60, 639 (2006)
9. F. Yang, Y. Liang, M. Liu, X. Li, M. Zhang, N. Wang, Opt. Laser
Technol. 46, 14 (2013)
10. A. Kitai, Luminescent Materials and Application (Wiley, Eng-
land, 2008)
11. L. Chen, Y. Gao, Mater. Chem. Phys. 116, 242–246 (2009)
12. X.B. Qiao, Y. Cheng, C.X. Qin, Z.X. Tao, Y.L. Huang, P. Cai, C.
Chen, H.J. Seo, Appl. Phys. A 118, 749 (2015)
13. G. Blasse, B.C. Grabmaier, Luminescent Materials (Springer,
Berlin, 1994)
14. J. Wen, L. Ning, C.K. Duan, Y. Chen, Y. Zhang, M. Yin, J. Phys.
Chem. C 116, 20513 (2012)
15. V.C. Kongre, S.C. Gedam, S.J. Dhoble, J. Lumin. 135, 55 (2013)
16. Y. Wu, G. Ren, Cryst. Eng. Comm. 15, 4153 (2013)
17. A.A. Setlur, W.J. Heward, M.E. Hannah, U. Happek, Chem.
Mater. 20, 6277 (2008)
18. X. Zhang, H. Lang, H.J. Seo, J. Fluoresc. 21, 1111 (2011)
19. L. Wu, G. Roth, K. Sparta, X. Chen, Acta Cryst. C 64, i53 (2008)
20. G.R. Dillip, S.J. Dhoble, B.D.P. Raju, Opt. Mater. 35, 2261
(2013)
21. W.B. Im, N.N. Fellows, S.P. DenBaars, R. Seshadri, Y.I. Kim,
Chem. Mater. 21, 2957 (2009)
22. W.R. Liu, C.H. Huang, C.P. Wu, Y.C. Chiu, Y.T. Yeh, T.M.
Chen, J. Mater. Chem. 21, 6869 (2011)
23. X. Chen, M. Li, X. Chang, H. Zang, W. Xiao, J. Solid State
Chem. 180, 1658 (2007)Table
1Kinetic
param
etersfrom
Chen’s
peakshapemethodin
Na 3SrB
5O10:Ce3
?phosphors
withc-rayirradiationtimes
of30sand5min,scanningrate
of5�C
/sat
0.58Gyh-1for5Gy
tx(at.%)
T1(�C)
Tm(�C)
T2(�C)
s(�C)
d(�C)
e(�C)
Shapefactor
bActivationenergyE(eV)
Frequency
factors(s-1)
lc
Es
Ed
Ee
Emean
s ss d
s es m
ean
30s
0.5
138.71
189.50
226.26
50.79
36.76
87.55
0.42
0.72
10.4219
0.4889
0.4505
0.4538
2.52E05
1.57E06
5.52E05
7.91E05
1148.19
194.30
228.68
46.11
34.38
80.49
0.43
0.74
10.4953
0.5627
0.5256
0.5278
1.61E06
9.74E06
3.62E06
4.99E06
3154.15
194.59
229.38
40.44
34.79
75.23
0.46
0.86
10.6211
0.6963
0.6589
0.6588
4.54E07
3.29E08
1.23E08
1.66E08
5111.75
153.82
202.35
42.07
48.53
90.6
0.53
1.15
20.4599
0.3526
0.3907
0.4011
1.89E06
7.54E04
2.39E05
7.36E05
5min
0.5
147.49
201.56
241.61
54.07
40.05
94.12
0.42
0.74
10.4167
0.4924
0.4494
0.4528
1.59E05
1.20E06
3.82E05
5.80E05
1157.28
200.31
233.69
43.03
33.38
76.14
0.44
0.77
10.5654
0.6356
0.5985
0.5998
8.55E06
5.36E07
2.04E07
2.75E07
3175.00
218.33
259.63
43.33
41.3
84.63
0.49
0.95
20.5564
0.3739
0.4545
0.4616
3.29E06
3.16E04
2.35E05
1.19E06
5 PeakI
142.66
195.89
246.05
53.23
50.16
103.39
0.49
0.94
20.3843
0.2725
0.3158
0.4694
6.31E04
3.15E03
9.16E03
3.40E06
PeakII
252.25
298.52
344.73
46.27
46.21
92.48
0.50
0.99
20.7342
0.5041
0.6053
1.91E07
1.26E05
1.12E06
t=
c-rayirradiationtime;
x=
dopantionconcentrationin
host;b=
order
ofkinetics
Effect of cerium doping on the structural, morphological, photoluminescent and… Page 9 of 10 102
123
Page 10
24. G.R. Dillip, K. Mallikarjuna, S.J. Dhoble, B.D.P. Raju, J. Phys.
Chem. Solids 75, 8 (2014)
25. J. Zhou, Z. Xia, M. Yang, K. Shen, J. Mater. Chem. 22, 21935(2012)
26. J. Chen, W. Zhao, J. Zhong, L. Lan, J. Wang, N. Wang, Ceram.
Int. 40, 15241 (2014)
27. Y. Zhang, G. Li, D. Geng, M. Shang, C. Peng, J. Lin, Inorg.
Chem. 51, 11655 (2012)
28. Y. Nagaoka, S. Adachi, J. Lumin. 145, 797 (2014)
29. B.P. Kore, N.S. Dhoble, S.J. Dhoble, Radiat. Meas. 67, 35 (2014)
30. D.L. Dexter, J. Chem. Phys. 21, 836 (1953)
31. L.G.V. Uitert, J. Electrochem. Soc. 114, 1048 (1967)
32. G. Blasse, J. Solid State Chem. 62, 207 (1986)
33. R. Chen, J. Electrochem. Soc. 116, 1254 (1969)
34. M. Balarin, J. Therm. Anal. 17, 319 (1979)
35. J. Azorin, C. Furetta, A. Gutierrez, J. Phys. D Appl. Phys. 22, 458(1989)
102 Page 10 of 10 S. W. Joo et al.
123