26
1 Effect of Coal Contaminants on SOFC System Performance and Service Life 7 th Annual SECA Review Meeting September 12-14, 2006 Philadelphia, PA

1
Effect of Coal Contaminants on SOFC System Performance and Service Life
7th Annual SECA Review MeetingSeptember 12-14, 2006
Philadelphia, PA
2
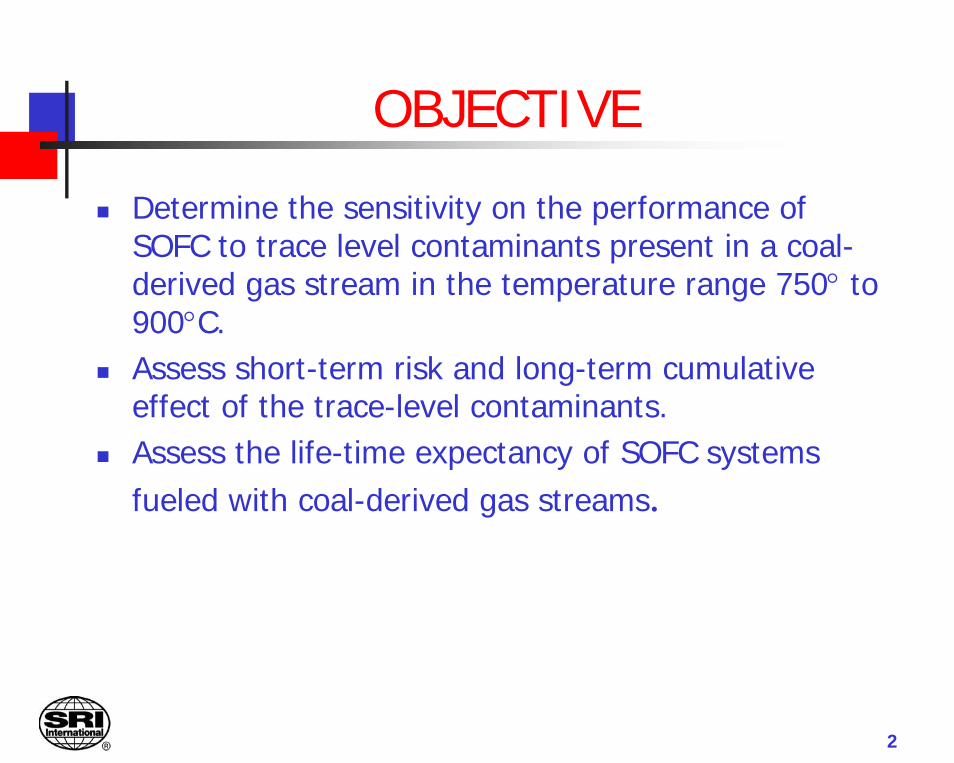
OBJECTIVE
Determine the sensitivity on the performance of SOFC to trace level contaminants present in a coal-derived gas stream in the temperature range 750° to 900°C. Assess short-term risk and long-term cumulative effect of the trace-level contaminants.Assess the life-time expectancy of SOFC systems fueled with coal-derived gas streams.

3
Coal and SOFC
Coal is an abundant fuel in the U.S.Integrated coal gasification-fuel cell system ⇒ Efficient and potentially low cost generation of electricity from domestic sources.Contaminants in the coal-derived gas can degrade the performance of SOFC.
4
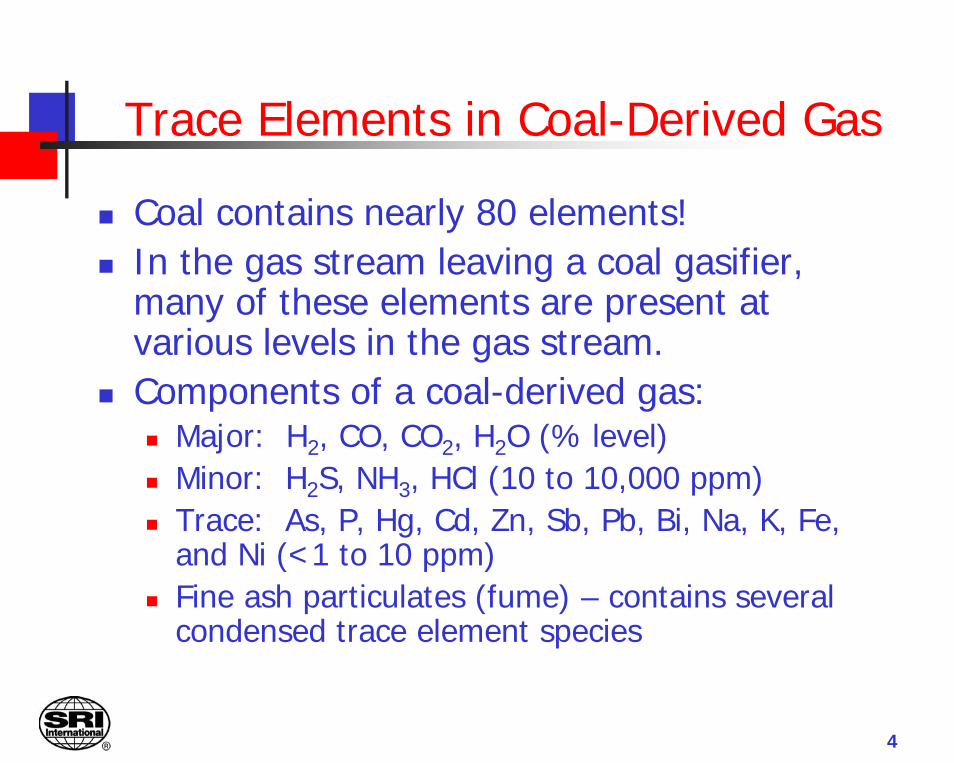
Trace Elements in Coal-Derived Gas
Coal contains nearly 80 elements!In the gas stream leaving a coal gasifier, many of these elements are present at various levels in the gas stream.Components of a coal-derived gas:
Major: H2, CO, CO2, H2O (% level)Minor: H2S, NH3, HCl (10 to 10,000 ppm)Trace: As, P, Hg, Cd, Zn, Sb, Pb, Bi, Na, K, Fe, and Ni (<1 to 10 ppm)Fine ash particulates (fume) – contains several condensed trace element species

5
Technical ApproachLiterature review.Thermodynamic calculations.Determine the performance of small SOFC samples to simulated coal gas containing trace element vapor.
Individual contaminants;Synergistic effect of multiple contaminants;Effect of coal ash fumes.
Assess the SOFC degradation and recommend tolerance limits.
6
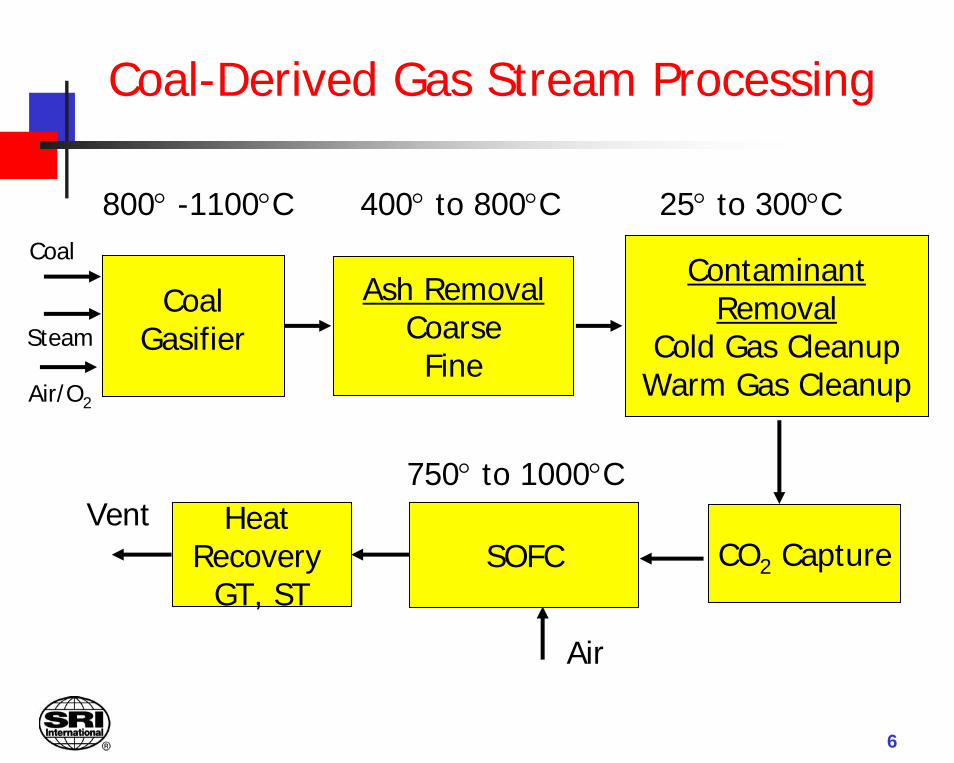
Coal-Derived Gas Stream Processing
800° -1100°C 400° to 800°C 25° to 300°C
Coal Gasifier
Ash RemovalCoarseFine
CoalContaminant
RemovalCold Gas Cleanup
Warm Gas CleanupAir/O2
SOFC
Air
Heat Recovery
GT, ST
Vent750° to 1000°C
CO2 Capture
Steam
7
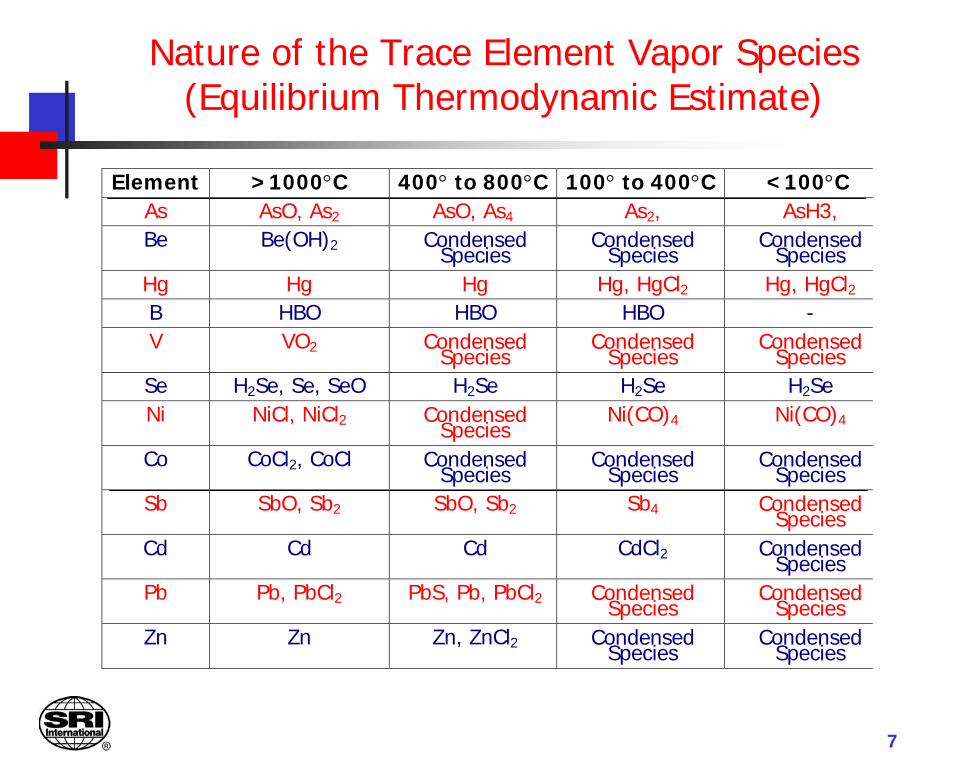
Nature of the Trace Element Vapor Species(Equilibrium Thermodynamic Estimate)
Element >1000°C 400° to 800°C 100° to 400°C <100°CAs AsO, As2 AsO, As4 As2, AsH3, Be Be(OH)2 Condensed
Species Condensed
Species Condensed
Species Hg Hg Hg Hg, HgCl2 Hg, HgCl2 B HBO HBO HBO - V VO2 Condensed
Species Condensed
Species Condensed
Species Se H2Se, Se, SeO H2Se H2Se H2Se Ni NiCl, NiCl2 Condensed
Species Ni(CO)4 Ni(CO)4
Co CoCl2, CoCl Condensed Species
Condensed Species
Condensed Species
Sb SbO, Sb2 SbO, Sb2 Sb4 Condensed Species
Cd Cd Cd CdCl2 Condensed Species
Pb Pb, PbCl2 PbS, Pb, PbCl2 Condensed Species
Condensed Species
Zn Zn Zn, ZnCl2 Condensed Species
Condensed Species
8
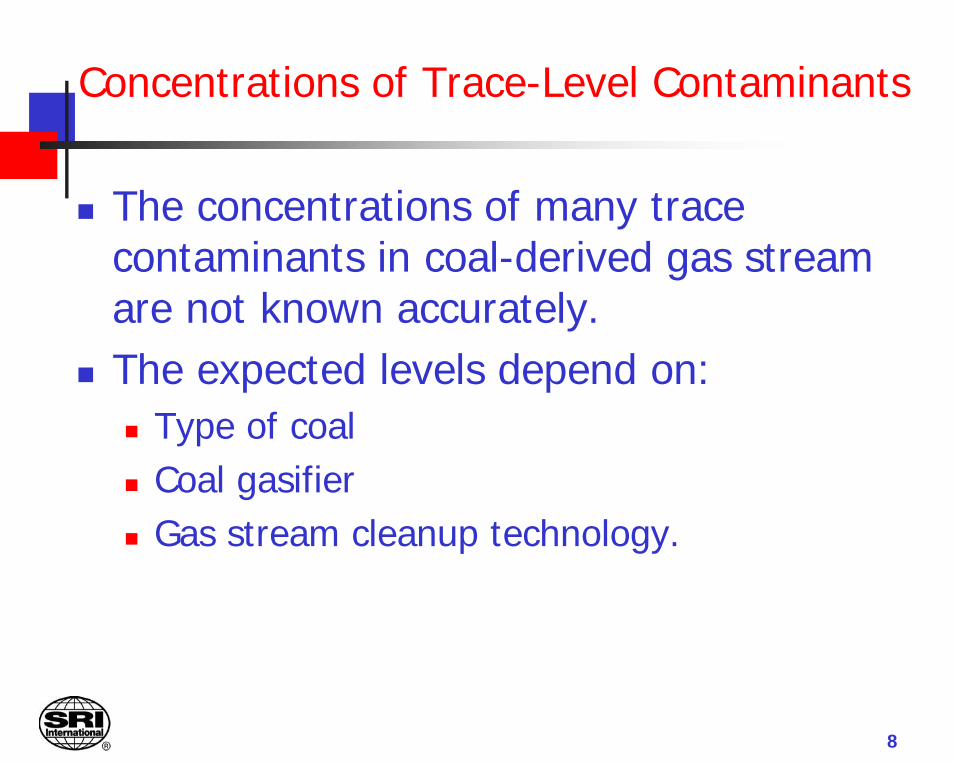
Concentrations of Trace-Level Contaminants
The concentrations of many trace contaminants in coal-derived gas stream are not known accurately.The expected levels depend on:
Type of coalCoal gasifierGas stream cleanup technology.

9
Estimate of Trace Level Contaminant Levels in Coal-Derived GasContaminant Concentration
(ppmv) at the Kingsport Facility
UND-EERC Estimate
As (AsH3) 0.15 to 0.58 0.2 Thiophene 1.6 Chlorine 120 CH3F 2.6 CH3Cl 2.01 HCl <1 Fe(CO)5 0.05 to 5.6 Ni(CO)5 0.001 to
0.025
CH3SCN 2.1 PH3 1.9 Antimony 0.025 0.07 Cadmium 0.01 Chromium <0.025 6.0 Mercury <0.025 0.002 Selenium <0.15 0.17 Vanadium <0.025 Lead 0.26 Zinc 9.0

10
Effect of Coal Contaminants on SOFC Anode Performance
Affect the ability of Ni crystallites to promote electrochemical reactions
Sulfur atoms on the surface poison Ni to dissociate H2 molecules or adsorb CO
Affect the ability of YSZ to transport oxygen ions
Formation of other phases such as zirconium silicate
Affect the electrical conductivityFormation of alloys or bulk phases such as sulfides

11
Known Effect of Contaminants
Published literature indicate the effect of H2S, NH3, and HCl on SOFC performance.Tolerance limits for SOFC:
H2S and HCl: Few ppm; NH3: 5,000 ppm
Catalyst literature on Ni-based catalysts indicate:H2S reduces the steam reforming actiivity;As (1 ppm) affect the steam reforming activity;Cl reduces H2 and CO adsorption on Ni; P inhibits H2 uptake by Ni;Bi reduces CO chemisorption;Addition of Zn to Ni prevent agglomeration of Ni/alumina catalysts.Most of the catalyst studies were performed at temperatures lower than the SOFC operation.
12
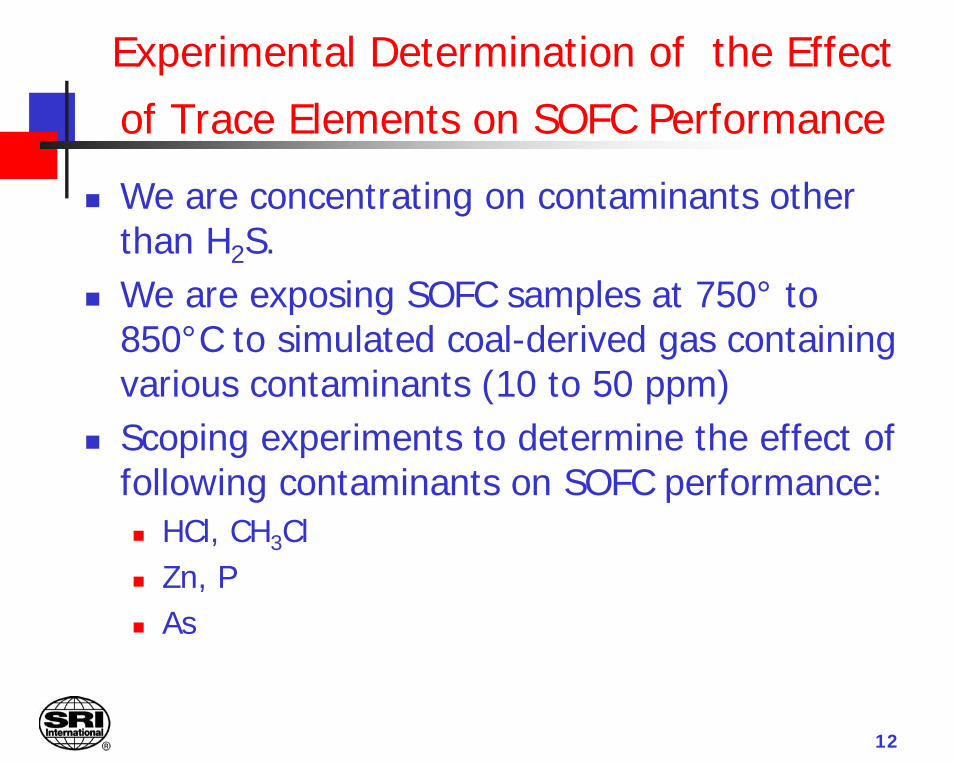
Experimental Determination of the Effect
of Trace Elements on SOFC Performance
We are concentrating on contaminants other than H2S.We are exposing SOFC samples at 750° to 850°C to simulated coal-derived gas containing various contaminants (10 to 50 ppm)Scoping experiments to determine the effect of following contaminants on SOFC performance:
HCl, CH3ClZn, PAs

13
Experimental Setup
YSZ Holder with the cell
InDec B.V. Cells; 1 in Dia; 4-6µm electrolyte;
5 to 10 µm Ni-YSZ anode; 520 to 600 µm anode support; 30 to 40 µm LSM-YSZ cathode;
Peak power: 0.15 W/cm2 at 700°C; 0.35 W/cm2 at 800°C <10% degradation over 2000 h
Gas Composition: 30.0% CO, 30.6% H2, 11.8% CO2, 27.6% H2O
Hydrogen
Anode Exhaust Fuel Gas Inlet
Auxiliary Furnace
Furnace
SOFC

14
Performance of SOFC in Clean Gas(800°C, ~0.7V and 0.2A/cm2)
0
50
100
150
200
300 320 340 360 380 400 420 440
Cell Power Density (mW/cm2) in H2
Cell Power Density (mW/cm2) in simulated coal-derived gas mixture
Time (hours)
Pow
er D
ensi
ty (m
W/c
m2 )
Note: The power density was 182 mW/cm2 during 0 to 300h.

15
Performance of SOFC with 38 ppm HCl Vapor at 750° and 800°C (~0.7V and 0.2A/cm2)
50
100
150
200
0 20 40 60 80 100 120
Power Density (mW/cm2) at 7500C
Power Density (mW/cm2) at 8000C
Pow
er D
ensi
ty (m
W/c
m2 )
Time (hours)

16
Performance of SOFC with 40 ppm CH3Cl Vapor at 800 and 850°C (~0.7V and 0.2A/cm2)
50
100
150
200
0 50 100 150 200 250 300
Power Density (mW/cm2) at 8000C
Power Density (mW/cm2) at 8500C
Pow
er D
ensi
ty (m
W/c
m2 )
Time (hours)
17
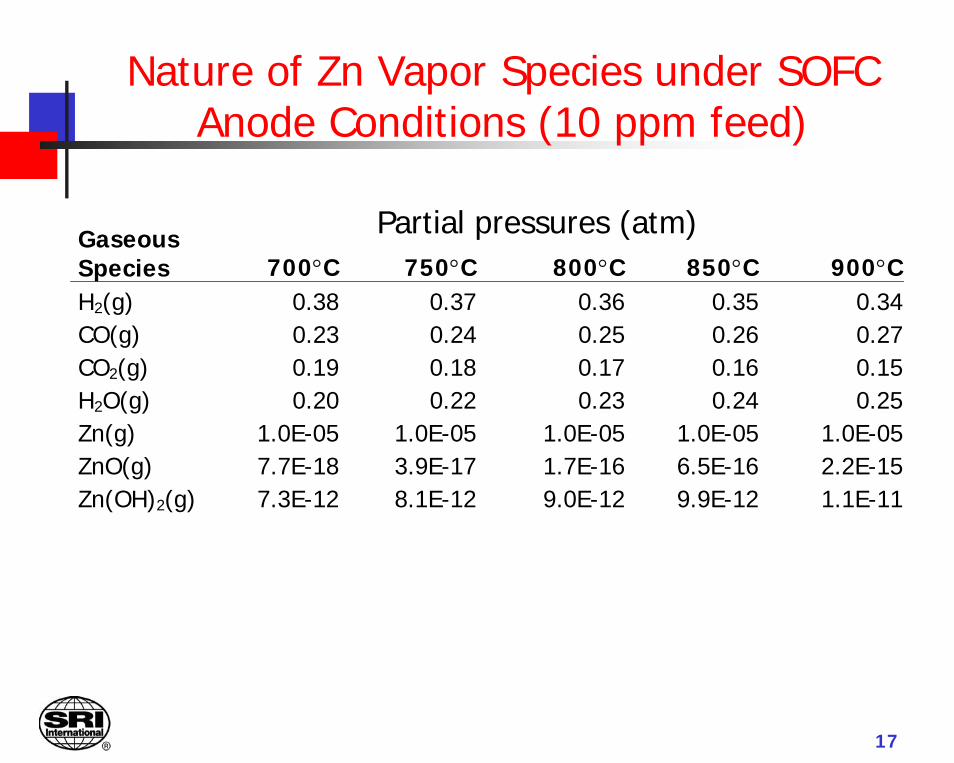
Nature of Zn Vapor Species under SOFC Anode Conditions (10 ppm feed)
Gaseous Species 700°C 750°C 800°C 850°C 900°CH2(g) 0.38 0.37 0.36 0.35 0.34CO(g) 0.23 0.24 0.25 0.26 0.27CO2(g) 0.19 0.18 0.17 0.16 0.15H2O(g) 0.20 0.22 0.23 0.24 0.25Zn(g) 1.0E-05 1.0E-05 1.0E-05 1.0E-05 1.0E-05ZnO(g) 7.7E-18 3.9E-17 1.7E-16 6.5E-16 2.2E-15Zn(OH)2(g) 7.3E-12 8.1E-12 9.0E-12 9.9E-12 1.1E-11
Partial pressures (atm)

18
Performance of SOFC with 10 ppm Zn Vapor at 750°C (~0.7V and 0.2A/cm2)
50
100
150
200
0 50 100 150
Time (hours)
Pow
er D
ensi
ty (m
W/c
m2 )

19
Performance of SOFC with 10 ppm Zn Vapor at 800°C (~0.7V and 0.2A/cm2)
Pow
er D
ensi
ty (m
W/c
m2 )
50
100
150
200
0 20 40 60 80 100 120 140
Time (hours)
20
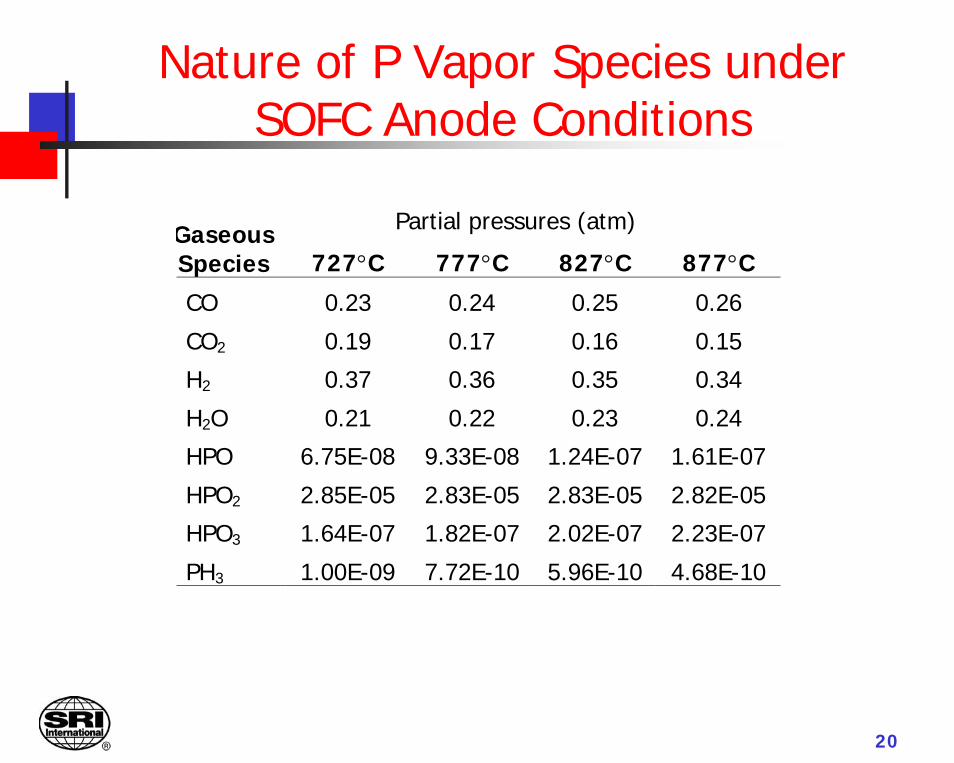
Nature of P Vapor Species under SOFC Anode Conditions
Gaseous Species 727°C 777°C 827°C 877°C
CO 0.23 0.24 0.25 0.26
CO2 0.19 0.17 0.16 0.15
H2 0.37 0.36 0.35 0.34
H2O 0.21 0.22 0.23 0.24
HPO 6.75E-08 9.33E-08 1.24E-07 1.61E-07
HPO2 2.85E-05 2.83E-05 2.83E-05 2.82E-05
HPO3 1.64E-07 1.82E-07 2.02E-07 2.23E-07
PH3 1.00E-09 7.72E-10 5.96E-10 4.68E-10
Partial pressures (atm)

21
Performance of SOFC with 10 ppm P2O5 Vapor at 750° and 800°C (~0.7V and 0.2A/cm2)
100
120
140
160
180
200
0 50 100 150 200
Power Density (mW/cm2) at 7500C
Power Density (mW/cm2) at 8000C Pow
er D
ensi
ty (m
W/c
m2 )
Time (hours)
22
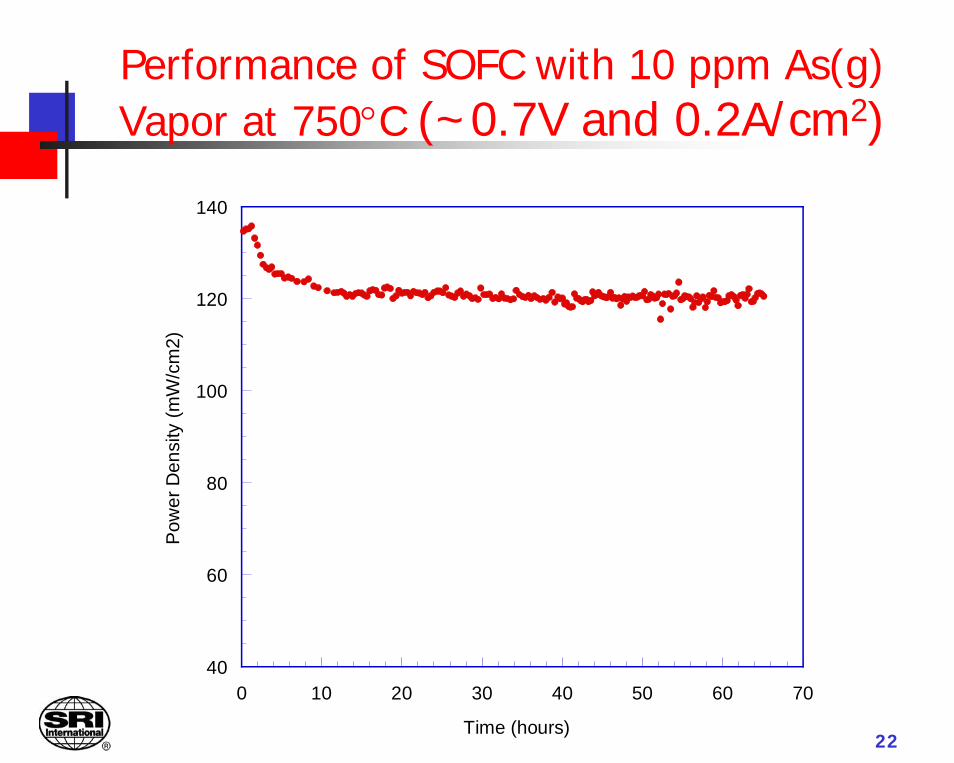
Performance of SOFC with 10 ppm As(g) Vapor at 750°C (~0.7V and 0.2A/cm2)
40
60
80
100
120
140
0 10 20 30 40 50 60 70
Pow
er D
ensi
ty (m
W/c
m2)
Time (hours)
23
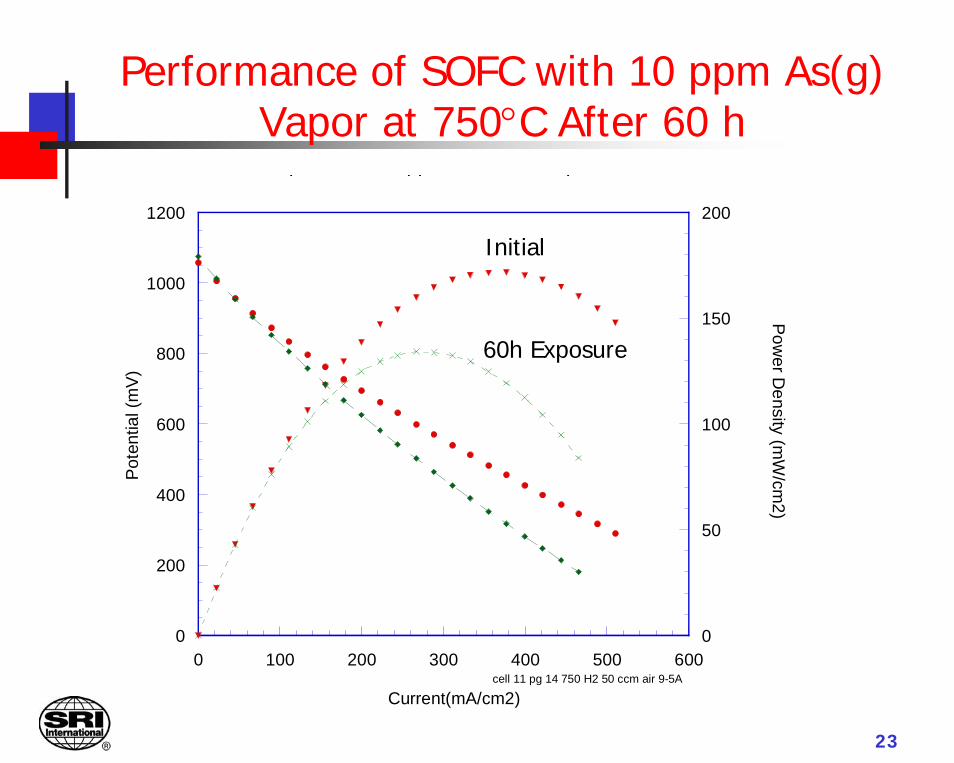
Performance of SOFC with 10 ppm As(g) Vapor at 750°C After 60 h
0
200
400
600
800
1000
1200
0
50
100
150
200
0 100 200 300 400 500 600cell 11 pg 14 750 H2 50 ccm air 9-5A
Pote
ntia
l (m
V)
Power D
ensity (mW
/cm2)
Current(mA/cm2)
p pp p
Initial
60h Exposure
24
Summary
100 h exposure tests in a simulated coal gas stream at 750° to 800°C show that:
HCl and CH3Cl at 38 ppm level do not have a significant effect. At 850°C, CH3Cl degrades the SOFC performance steadily.Zn vapor at 10 ppm level leads to a slow decline in performance at 800°C.P vapor (10 ppm) degrades the SOFC anode.As vapor at 750°C affects the performance rapidly initially, but remains steady after 10 h.
25
Future WorkDetermination of the effect of Hg, Cd, Sb, and Bi.Characterize the anode degradation using bulk and surface analyses.Relative ranking of the effect of individual contaminants. Determination of the effect of coal ash fumes.Determination of synergistic effect of contaminants. Preliminary determination of the sensitivity of SOFC to contaminants.Long term experiments with selected contaminants in large area cells at different concentrations.Recommendation of tolerance limits.

26
PROJECT TEAM
SRI InternationalGopala Krishnan, Palitha Jayaweera, Kai-Hung Lau, and Angel Sanjurjo.
Research Triangle InstituteJohn Albritton, Brian Turk, and Raghubir Gupta
U.S. Department of Energy (NETL)Shawna Toth, Wayne Sardoval, AyyakkannuMannivannan
Cooperative agreement: DE-FC26-05NT42627.


