This paper is accepted in Journal of Soil Dynamics and Earthquake Engineering 1 Effect of initial relative density on the post-liquefaction behaviour of sand Mehdi Rouholamin 1 , Subhamoy Bhattacharya 2 , Rolando P. Orense 3 1 Research Fellow, University of Surrey 2 Chair in Geomechanics, University of Surrey 3 Associate Professor, University of Auckland Corresponding author: Subhamoy Bhattacharya Chair in Geomechanics Department of Civil and Environmental Engineering University of Surrey GU2 7XH Email: [email protected]Keywords: Liquefaction, multi-stage soil element test, post-liquefaction behaviour, saturated sand Abstract Understanding the behaviour of soils under cyclic/dynamic loading has been one of the challenging topics in geotechnical engineering. The response of liquefiable soils has been well studied however, the post liquefaction behaviour of sands needs better understanding. In this paper, the post liquefaction behaviour of sands is investigated through several series of multi- stage soil element tests using a cyclic Triaxial apparatus. Four types of sand were used where the sands were first liquefied and then monotonically sheared to obtain stress-strain curves. Results of the tests indicate that the stress-strain behaviour of sand in post liquefaction phase can be modelled as a bi-linear curve using three parameters: the initial shear modulus ( 1 G ), critical state shear modulus ( 2 G ), and post-dilation shear strain ( dilation post ) which is the shear strain at the onset of dilation. It was found that the three parameters are dependent on the initial relative density of sands. Furthermore, it was observed that with the increase in the relative density both 1 G and 2 G increase and dilation post decreases. The practical application of the results is to generate p-y curves for liquefied soil.
Transcript
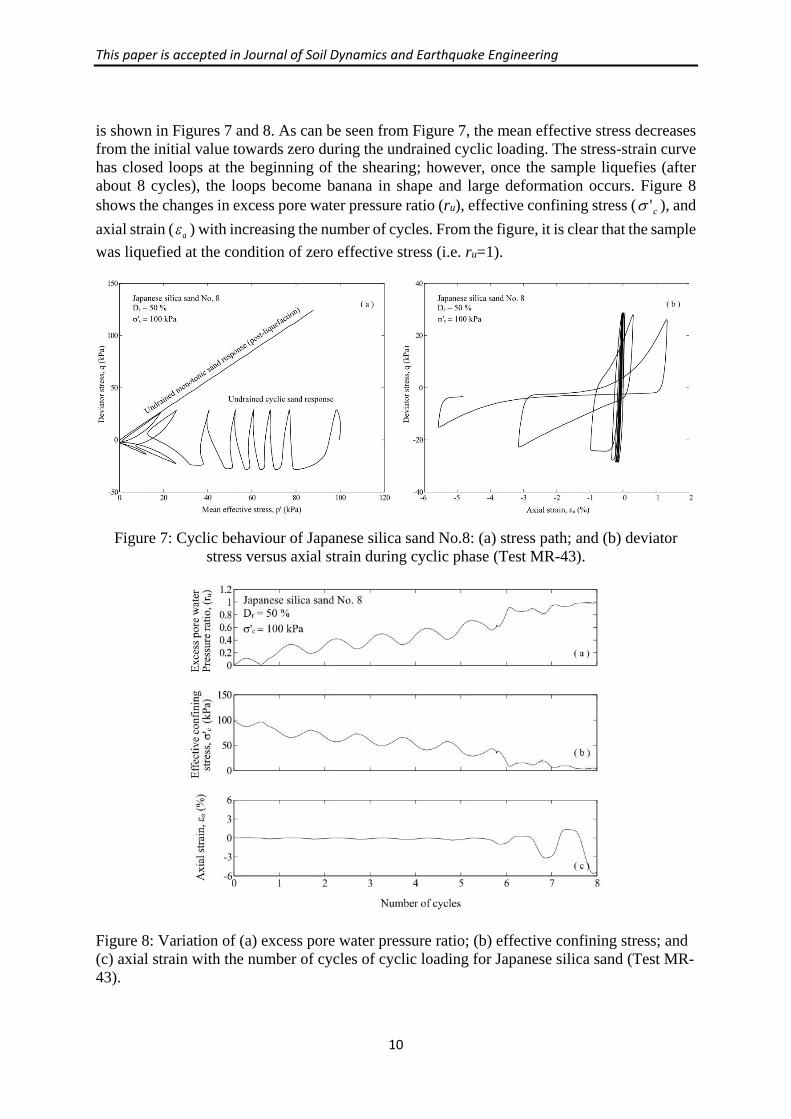
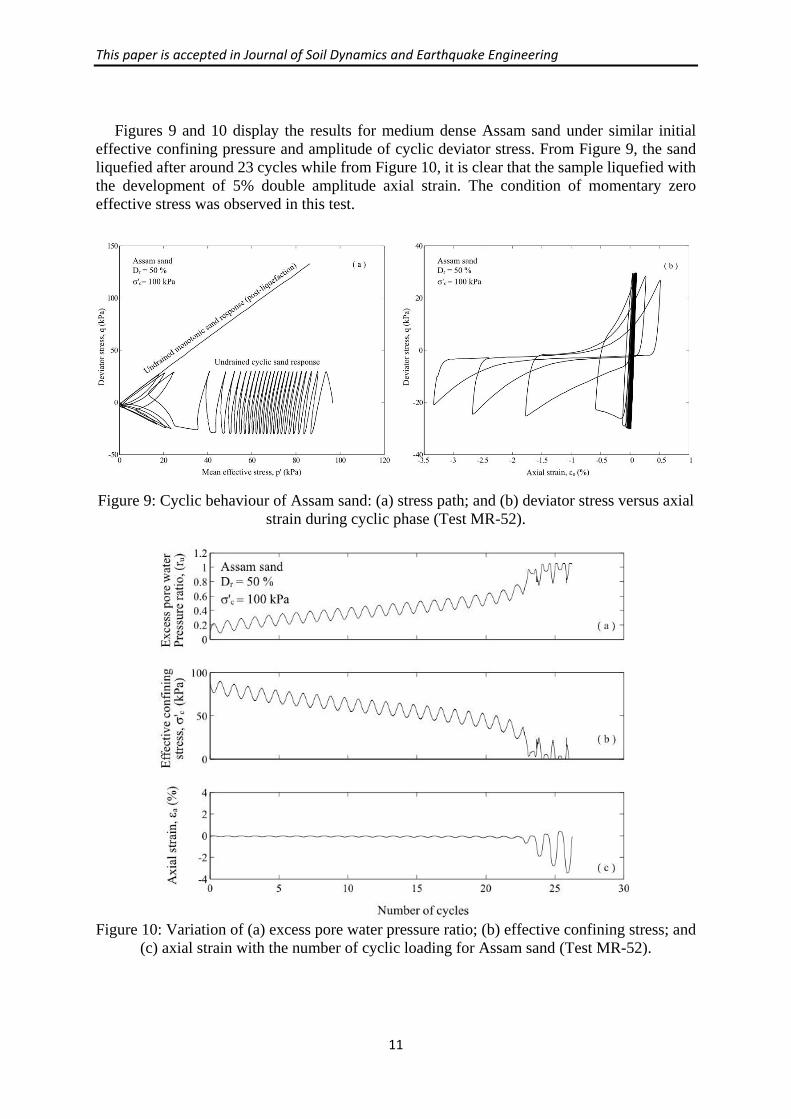
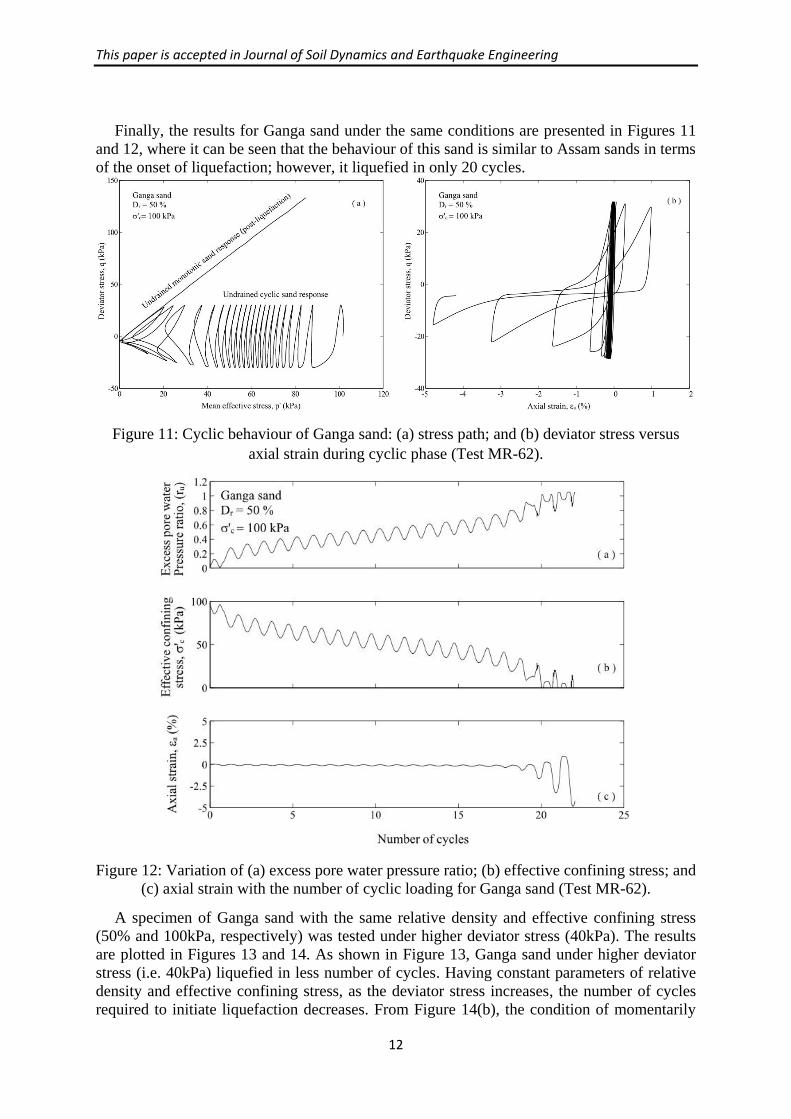
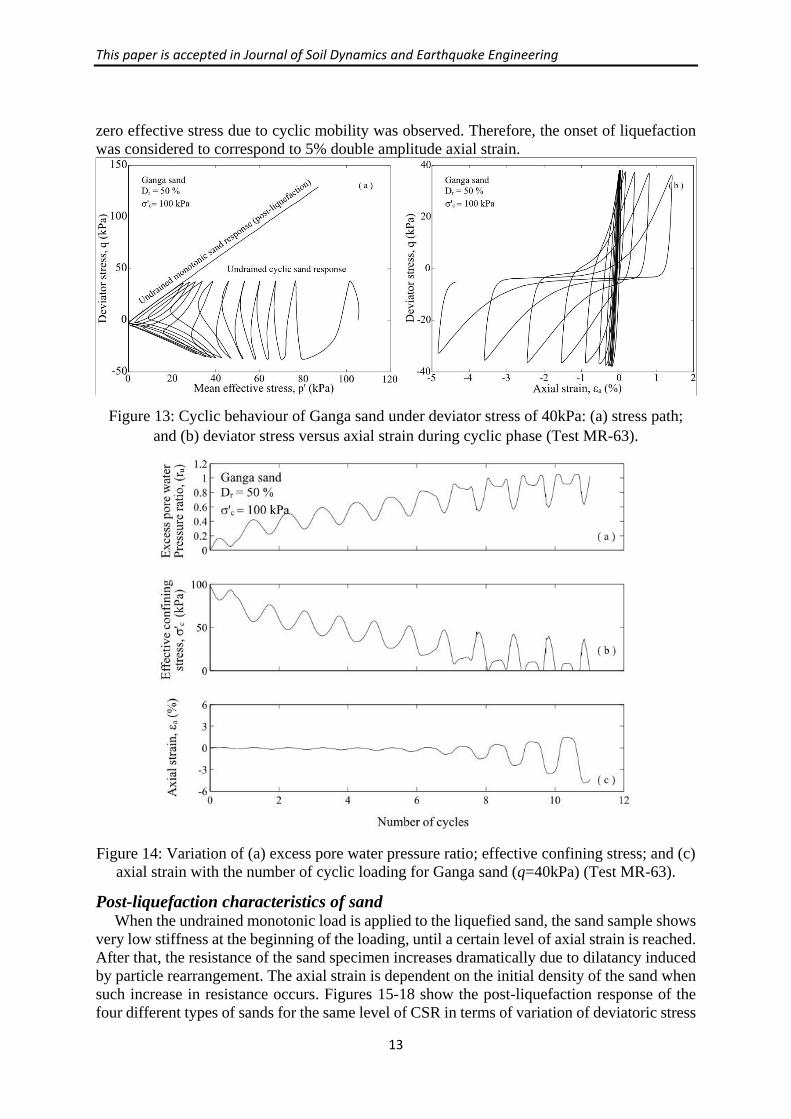
This paper is accepted in Journal of Soil Dynamics and Earthquake Engineering
1
Effect of initial relative density on the post-liquefaction behaviour of sand
Mehdi Rouholamin1, Subhamoy Bhattacharya2, Rolando P. Orense3
1Research Fellow, University of Surrey 2Chair in Geomechanics, University of Surrey 3Associate Professor, University of Auckland
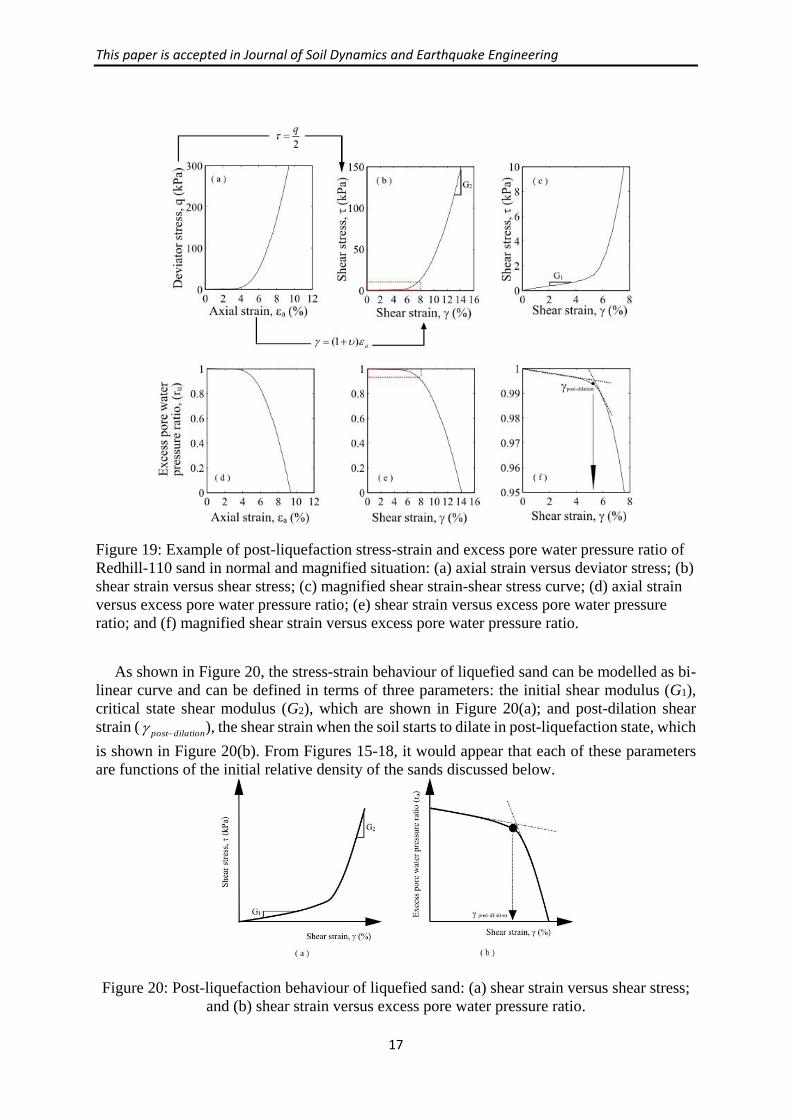
versus excess pore water pressure ratio; (e) shear strain versus excess pore water pressure
ratio; and (f) magnified shear strain versus excess pore water pressure ratio.
As shown in Figure 20, the stress-strain behaviour of liquefied sand can be modelled as bi-
linear curve and can be defined in terms of three parameters: the initial shear modulus (G1),
critical state shear modulus (G2), which are shown in Figure 20(a); and post-dilation shear
strain (dilationpost ), the shear strain when the soil starts to dilate in post-liquefaction state, which
is shown in Figure 20(b). From Figures 15-18, it would appear that each of these parameters
are functions of the initial relative density of the sands discussed below.
Figure 20: Post-liquefaction behaviour of liquefied sand: (a) shear strain versus shear stress;
and (b) shear strain versus excess pore water pressure ratio.
This paper is accepted in Journal of Soil Dynamics and Earthquake Engineering
18
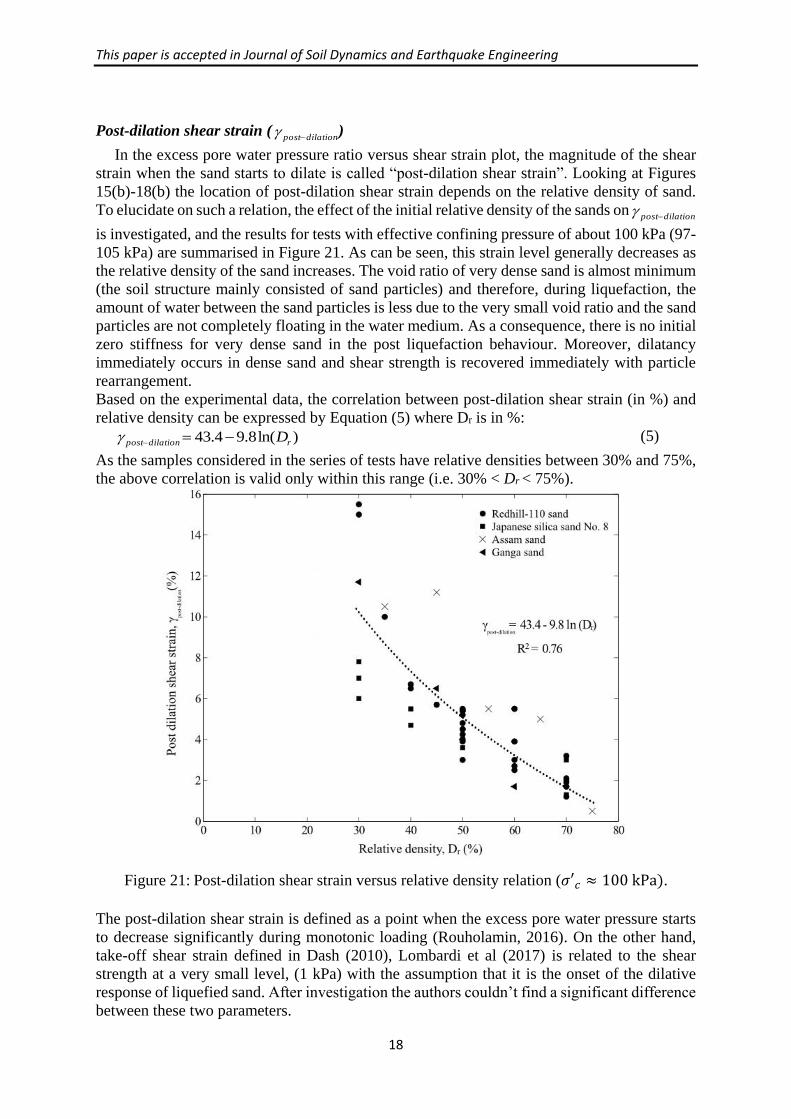
Post-dilation shear strain (dilationpost )
In the excess pore water pressure ratio versus shear strain plot, the magnitude of the shear
strain when the sand starts to dilate is called “post-dilation shear strain”. Looking at Figures
15(b)-18(b) the location of post-dilation shear strain depends on the relative density of sand.
To elucidate on such a relation, the effect of the initial relative density of the sands ondilationpost
is investigated, and the results for tests with effective confining pressure of about 100 kPa (97-
105 kPa) are summarised in Figure 21. As can be seen, this strain level generally decreases as
the relative density of the sand increases. The void ratio of very dense sand is almost minimum
(the soil structure mainly consisted of sand particles) and therefore, during liquefaction, the
amount of water between the sand particles is less due to the very small void ratio and the sand
particles are not completely floating in the water medium. As a consequence, there is no initial
zero stiffness for very dense sand in the post liquefaction behaviour. Moreover, dilatancy
immediately occurs in dense sand and shear strength is recovered immediately with particle
rearrangement.
Based on the experimental data, the correlation between post-dilation shear strain (in %) and
relative density can be expressed by Equation (5) where Dr is in %:
)ln(8.94.43 rdilationpost D (5)
As the samples considered in the series of tests have relative densities between 30% and 75%,
the above correlation is valid only within this range (i.e. 30% < Dr < 75%).
Figure 21: Post-dilation shear strain versus relative density relation (𝜎′𝑐 ≈ 100 kPa).
The post-dilation shear strain is defined as a point when the excess pore water pressure starts
to decrease significantly during monotonic loading (Rouholamin, 2016). On the other hand,
take-off shear strain defined in Dash (2010), Lombardi et al (2017) is related to the shear
strength at a very small level, (1 kPa) with the assumption that it is the onset of the dilative
response of liquefied sand. After investigation the authors couldn’t find a significant difference
between these two parameters.
This paper is accepted in Journal of Soil Dynamics and Earthquake Engineering
19
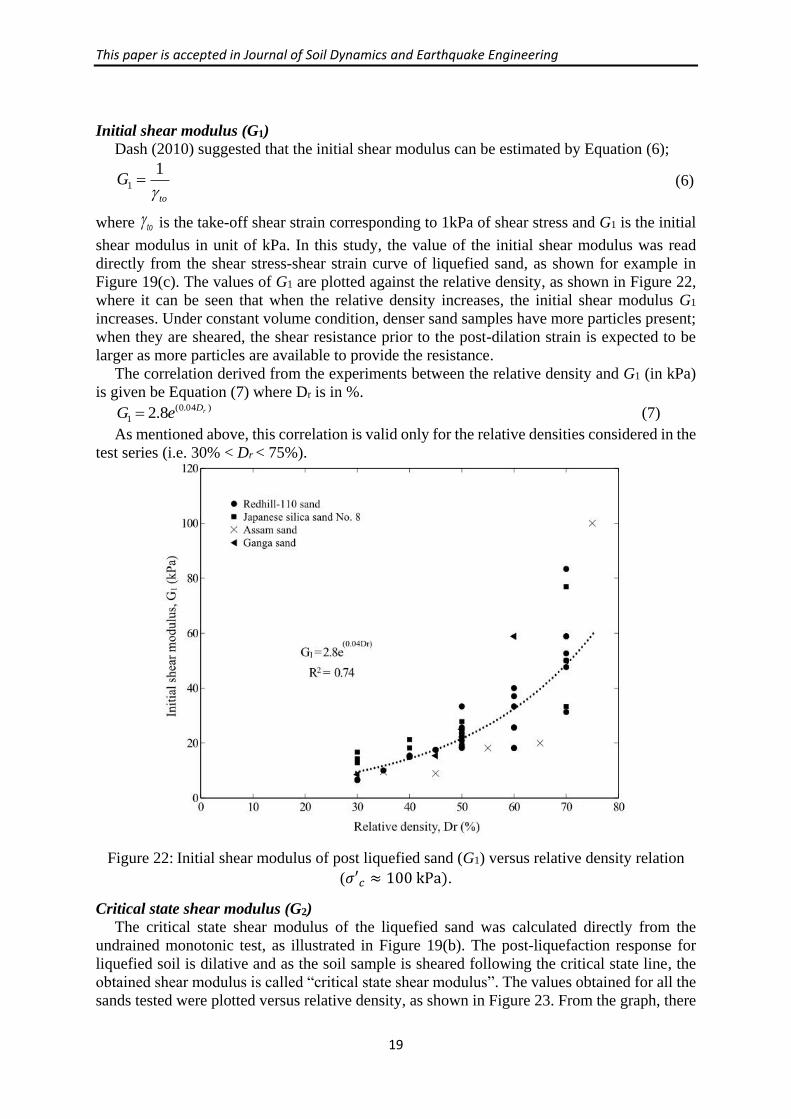
Initial shear modulus (G1)
Dash (2010) suggested that the initial shear modulus can be estimated by Equation (6);
to
G
11 (6)
where to is the take-off shear strain corresponding to 1kPa of shear stress and G1 is the initial
shear modulus in unit of kPa. In this study, the value of the initial shear modulus was read
directly from the shear stress-shear strain curve of liquefied sand, as shown for example in
Figure 19(c). The values of G1 are plotted against the relative density, as shown in Figure 22,
where it can be seen that when the relative density increases, the initial shear modulus G1
increases. Under constant volume condition, denser sand samples have more particles present;
when they are sheared, the shear resistance prior to the post-dilation strain is expected to be
larger as more particles are available to provide the resistance.
The correlation derived from the experiments between the relative density and G1 (in kPa)
is given be Equation (7) where Dr is in %. )04.0(
1 8.2 rDeG (7)
As mentioned above, this correlation is valid only for the relative densities considered in the
test series (i.e. 30% < Dr < 75%).
Figure 22: Initial shear modulus of post liquefied sand (G1) versus relative density relation
(𝜎′𝑐 ≈ 100 kPa).
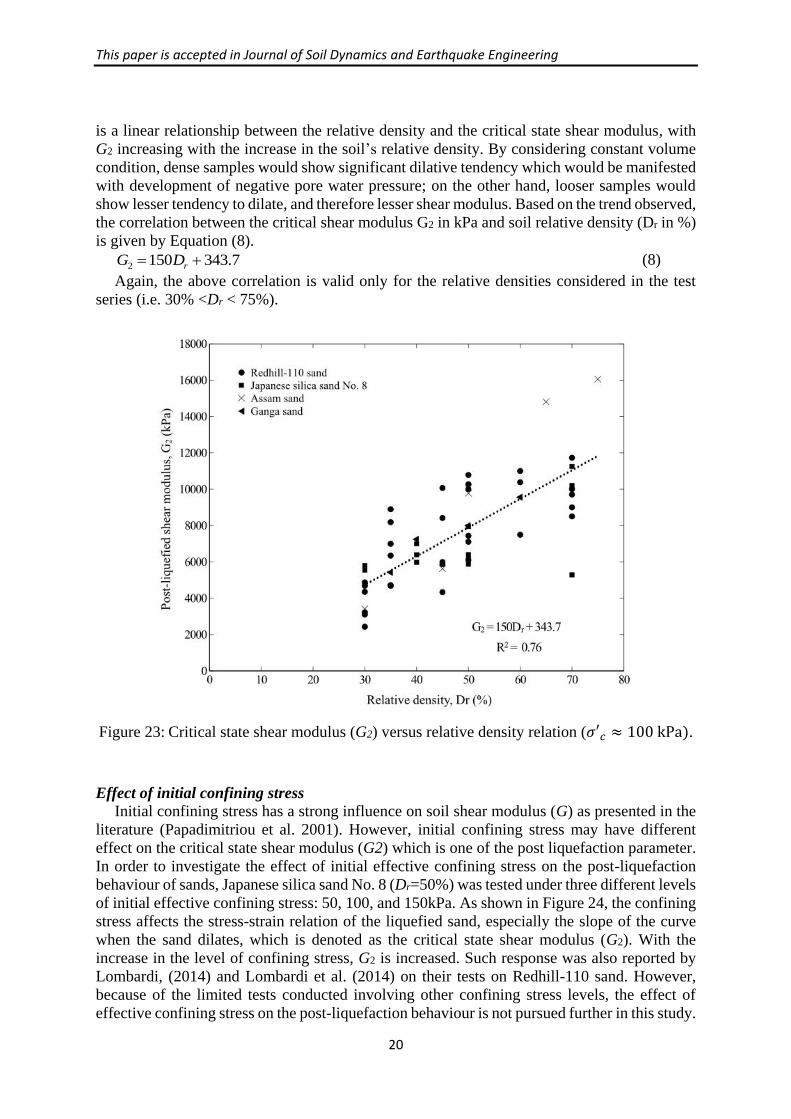
Critical state shear modulus (G2)
The critical state shear modulus of the liquefied sand was calculated directly from the
undrained monotonic test, as illustrated in Figure 19(b). The post-liquefaction response for
liquefied soil is dilative and as the soil sample is sheared following the critical state line, the
obtained shear modulus is called “critical state shear modulus”. The values obtained for all the
sands tested were plotted versus relative density, as shown in Figure 23. From the graph, there
This paper is accepted in Journal of Soil Dynamics and Earthquake Engineering
20
is a linear relationship between the relative density and the critical state shear modulus, with
G2 increasing with the increase in the soil’s relative density. By considering constant volume
condition, dense samples would show significant dilative tendency which would be manifested
with development of negative pore water pressure; on the other hand, looser samples would
show lesser tendency to dilate, and therefore lesser shear modulus. Based on the trend observed,
the correlation between the critical shear modulus G2 in kPa and soil relative density (Dr in %)
is given by Equation (8).
7.3431502 rDG (8)
Again, the above correlation is valid only for the relative densities considered in the test
series (i.e. 30% <Dr < 75%).
Figure 23: Critical state shear modulus (G2) versus relative density relation (𝜎′𝑐 ≈ 100 kPa).
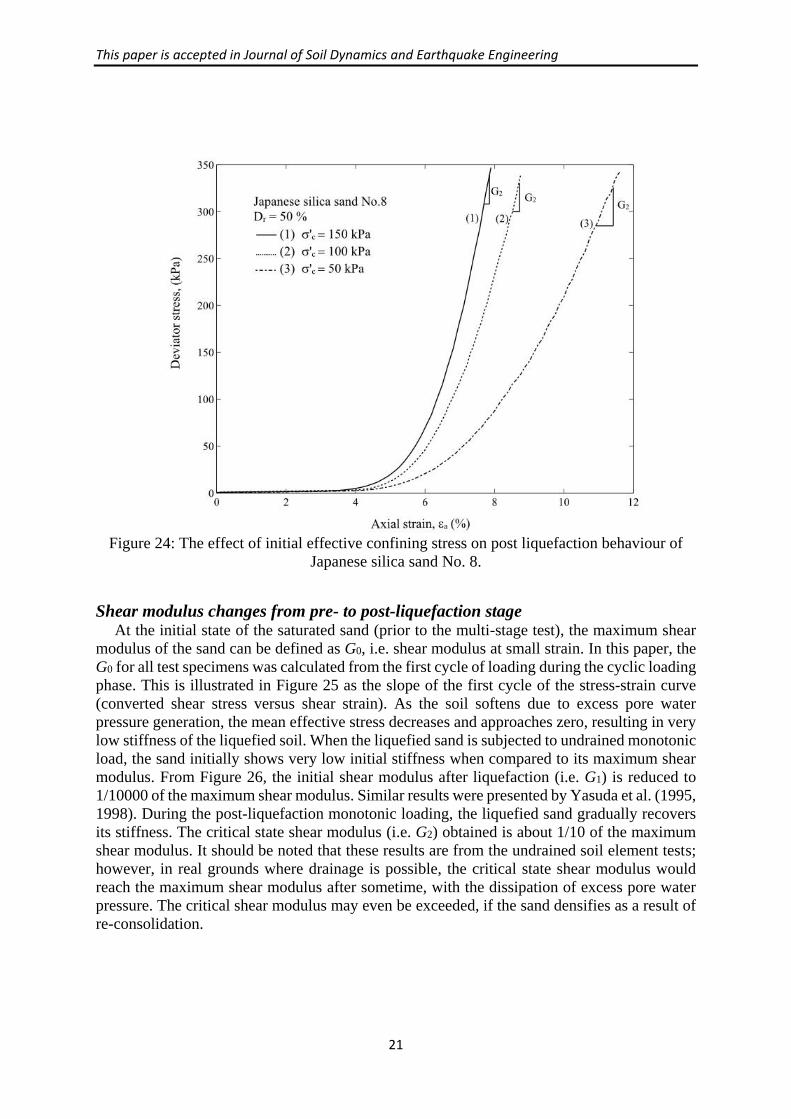
Effect of initial confining stress
Initial confining stress has a strong influence on soil shear modulus (G) as presented in the
literature (Papadimitriou et al. 2001). However, initial confining stress may have different
effect on the critical state shear modulus (G2) which is one of the post liquefaction parameter.
In order to investigate the effect of initial effective confining stress on the post-liquefaction
behaviour of sands, Japanese silica sand No. 8 (Dr=50%) was tested under three different levels
of initial effective confining stress: 50, 100, and 150kPa. As shown in Figure 24, the confining
stress affects the stress-strain relation of the liquefied sand, especially the slope of the curve
when the sand dilates, which is denoted as the critical state shear modulus (G2). With the
increase in the level of confining stress, G2 is increased. Such response was also reported by
Lombardi, (2014) and Lombardi et al. (2014) on their tests on Redhill-110 sand. However,
because of the limited tests conducted involving other confining stress levels, the effect of
effective confining stress on the post-liquefaction behaviour is not pursued further in this study.
This paper is accepted in Journal of Soil Dynamics and Earthquake Engineering
21
Figure 24: The effect of initial effective confining stress on post liquefaction behaviour of
Japanese silica sand No. 8.
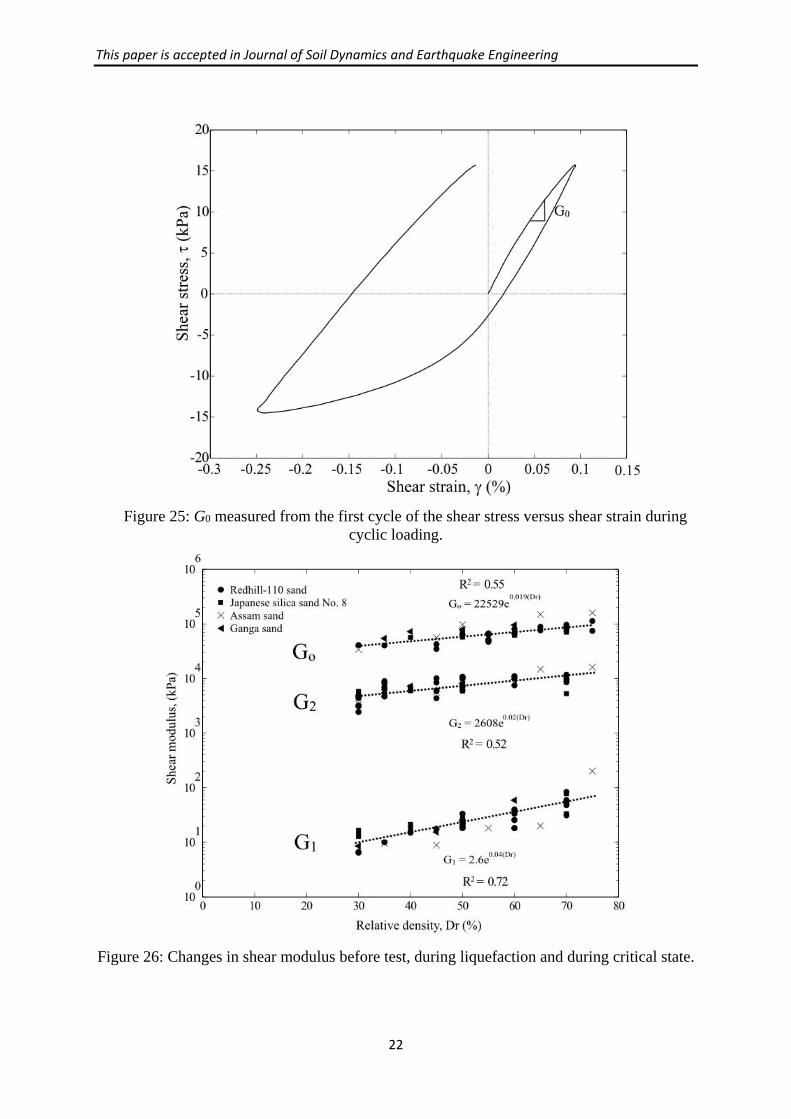
Shear modulus changes from pre- to post-liquefaction stage At the initial state of the saturated sand (prior to the multi-stage test), the maximum shear
modulus of the sand can be defined as G0, i.e. shear modulus at small strain. In this paper, the
G0 for all test specimens was calculated from the first cycle of loading during the cyclic loading
phase. This is illustrated in Figure 25 as the slope of the first cycle of the stress-strain curve
(converted shear stress versus shear strain). As the soil softens due to excess pore water
pressure generation, the mean effective stress decreases and approaches zero, resulting in very
low stiffness of the liquefied soil. When the liquefied sand is subjected to undrained monotonic
load, the sand initially shows very low initial stiffness when compared to its maximum shear
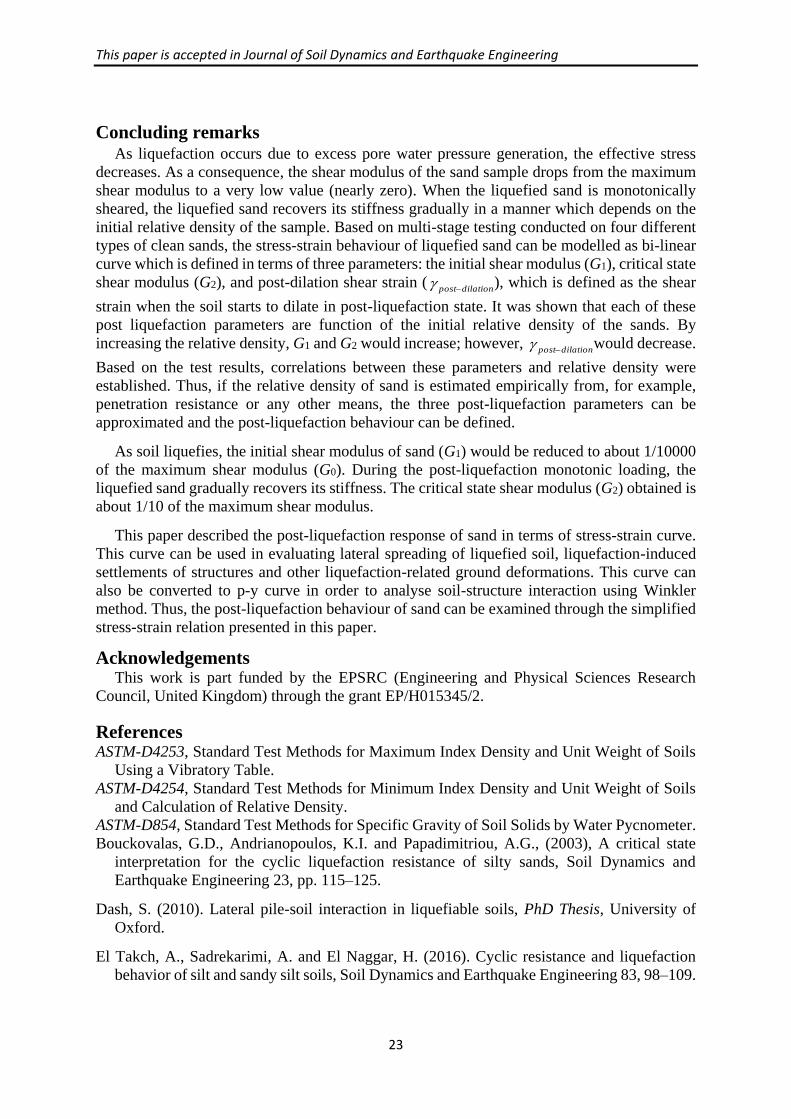
modulus. From Figure 26, the initial shear modulus after liquefaction (i.e. G1) is reduced to
1/10000 of the maximum shear modulus. Similar results were presented by Yasuda et al. (1995,
1998). During the post-liquefaction monotonic loading, the liquefied sand gradually recovers
its stiffness. The critical state shear modulus (i.e. G2) obtained is about 1/10 of the maximum
shear modulus. It should be noted that these results are from the undrained soil element tests;
however, in real grounds where drainage is possible, the critical state shear modulus would
reach the maximum shear modulus after sometime, with the dissipation of excess pore water
pressure. The critical shear modulus may even be exceeded, if the sand densifies as a result of
re-consolidation.
This paper is accepted in Journal of Soil Dynamics and Earthquake Engineering
22
Figure 25: G0 measured from the first cycle of the shear stress versus shear strain during
cyclic loading.
Figure 26: Changes in shear modulus before test, during liquefaction and during critical state.
This paper is accepted in Journal of Soil Dynamics and Earthquake Engineering
23
Concluding remarks As liquefaction occurs due to excess pore water pressure generation, the effective stress
decreases. As a consequence, the shear modulus of the sand sample drops from the maximum
shear modulus to a very low value (nearly zero). When the liquefied sand is monotonically
sheared, the liquefied sand recovers its stiffness gradually in a manner which depends on the
initial relative density of the sample. Based on multi-stage testing conducted on four different
types of clean sands, the stress-strain behaviour of liquefied sand can be modelled as bi-linear
curve which is defined in terms of three parameters: the initial shear modulus (G1), critical state
shear modulus (G2), and post-dilation shear strain (dilationpost ), which is defined as the shear
strain when the soil starts to dilate in post-liquefaction state. It was shown that each of these
post liquefaction parameters are function of the initial relative density of the sands. By
increasing the relative density, G1 and G2 would increase; however, dilationpost would decrease.
Based on the test results, correlations between these parameters and relative density were
established. Thus, if the relative density of sand is estimated empirically from, for example,
penetration resistance or any other means, the three post-liquefaction parameters can be
approximated and the post-liquefaction behaviour can be defined.
As soil liquefies, the initial shear modulus of sand (G1) would be reduced to about 1/10000
of the maximum shear modulus (G0). During the post-liquefaction monotonic loading, the
liquefied sand gradually recovers its stiffness. The critical state shear modulus (G2) obtained is
about 1/10 of the maximum shear modulus.
This paper described the post-liquefaction response of sand in terms of stress-strain curve.
This curve can be used in evaluating lateral spreading of liquefied soil, liquefaction-induced
settlements of structures and other liquefaction-related ground deformations. This curve can
also be converted to p-y curve in order to analyse soil-structure interaction using Winkler
method. Thus, the post-liquefaction behaviour of sand can be examined through the simplified
stress-strain relation presented in this paper.
Acknowledgements This work is part funded by the EPSRC (Engineering and Physical Sciences Research
Council, United Kingdom) through the grant EP/H015345/2.
References ASTM-D4253, Standard Test Methods for Maximum Index Density and Unit Weight of Soils
Using a Vibratory Table.
ASTM-D4254, Standard Test Methods for Minimum Index Density and Unit Weight of Soils
and Calculation of Relative Density.
ASTM-D854, Standard Test Methods for Specific Gravity of Soil Solids by Water Pycnometer.
Bouckovalas, G.D., Andrianopoulos, K.I. and Papadimitriou, A.G., (2003), A critical state
interpretation for the cyclic liquefaction resistance of silty sands, Soil Dynamics and
Earthquake Engineering 23, pp. 115–125.
Dash, S. (2010). Lateral pile-soil interaction in liquefiable soils, PhD Thesis, University of
Oxford.
El Takch, A., Sadrekarimi, A. and El Naggar, H. (2016). Cyclic resistance and liquefaction
behavior of silt and sandy silt soils, Soil Dynamics and Earthquake Engineering 83, 98–109.
This paper is accepted in Journal of Soil Dynamics and Earthquake Engineering
24
Hyodo, M., Hyde, A.F.L. & Aramaki, N. (1998). Liquefaction of crushable soils.
Geotechnique, 48(4), 527-543.
Ishihara K. (1993). Liquefaction and flow failure during earthquakes. Géotechnique,