PATHAK ET AL. VOL. 7 ’ NO. 10 ’ 8593–8604 ’ 2013 www.acsnano.org 8593 September 03, 2013 C 2013 American Chemical Society Local Relative Density Modulates Failure and Strength in Vertically Aligned Carbon Nanotubes Siddhartha Pathak, †, ) , * Nisha Mohan, † Elizabeth Decolvenaere, † Alan Needleman, ‡ Mostafa Bedewy, § A. John Hart, §,^ and Julia R. Greer † † Materials Science, California Institute of Technology (Caltech), Pasadena, California, United States, ‡ Department of Materials Science and Engineering, College of Engineering and Center for Advanced Scienti fic Computing and Modeling (CASCaM), University of North Texas, Denton, Texas, United States, § Mechanosynthesis Group, Department of Mechanical Engineering, University of Michigan, Ann Arbor, Michigan, United States, ) Center for Integrated Nanotechnologies, Los Alamos National Laboratory, Los Alamos, New Mexico, United States, and ^ Department of Mechanical Engineering, Massachusetts Institute of Technology, Cambridge, Massachusetts, United States D eveloping low-density materials for engineering applications requires a precise knowledge of relationships between their component geometries and the physical and mechanical properties of the constituent materials, like density and strength. In a typical metal, the Hall-Petch effect 1,2 relates the yield strength, σ, to the average grain size, d, through σ ∼ d 1/2 . In cellular materials, Young's modulus, E, and strength, σ, scale with density: E, σ ∼ F 2 . 3 Such relationships are challenging to obtain for complex hierarchical cellular structures like vertically aligned carbon nanotubes (VACNT) forests, with possible applications ranging from microelectro-mechanical systems (MEMS) to energy dissipative systems. 49 These materials represent examples of spa- tial hierarchy because the individual nano- tubes have diameters on the order of tens of nanometers; the intertube distances may range from a few to hundreds of nano- meters; the heights of the forests may be as high as hundreds of micrometers to several millimeters; and their lateral extent can have macroscopic dimensions. The * Address correspondence to [email protected], [email protected]. Received for review May 29, 2013 and accepted September 3, 2013. Published online 10.1021/nn402710j ABSTRACT Micromechanical experiments, image analysis, and theoretical modeling revealed that local failure events and compressive stresses of vertically aligned carbon nanotubes (VACNTs) were uniquely linked to relative density gradients. Edge detection analysis of systematically obtained scanning electron micrographs was used to quantify a microstructural figure-of-merit related to relative local density along VACNT heights. Sequential bottom-to-top buckling and hardening in stressstrain response were observed in samples with smaller relative density at the bottom. When density gradient was insubstantial or reversed, bottom regions always buckled last, and a flat stress plateau was obtained. These findings were consistent with predictions of a 2D material model based on a viscoplastic solid with plastic non-normality and a hardeningsofteninghardening plastic flow relation. The hardening slope in compression generated by the model was directly related to the stiffness gradient along the sample height, and hence to the local relative density. These results demonstrate that a microstructural figure-of-merit, the effective relative density, can be used to quantify and predict the mechanical response. KEYWORDS: vertically aligned carbon nanotubes . compression . mechanical properties . energy storage . finite element simulation ARTICLE
Transcript
PATHAK ET AL. VOL. 7 ’ NO. 10 ’ 8593–8604 ’ 2013
www.acsnano.org
8593
September 03, 2013
C 2013 American Chemical Society
Local Relative Density ModulatesFailure and Strength in VerticallyAligned Carbon NanotubesSiddhartha Pathak,†, ),* Nisha Mohan,† Elizabeth Decolvenaere,† Alan Needleman,‡ Mostafa Bedewy,§
A. John Hart,§,^ and Julia R. Greer†
†Materials Science, California Institute of Technology (Caltech), Pasadena, California, United States, ‡Department of Materials Science and Engineering, College of Engineeringand Center for Advanced Scientific Computing and Modeling (CASCaM), University of North Texas, Denton, Texas, United States, §Mechanosynthesis Group, Department ofMechanical Engineering, University of Michigan, Ann Arbor, Michigan, United States, )Center for Integrated Nanotechnologies, Los Alamos National Laboratory, Los Alamos,New Mexico, United States, and ^Department of Mechanical Engineering, Massachusetts Institute of Technology, Cambridge, Massachusetts, United States
Developing low-density materials forengineering applications requires aprecise knowledge of relationships
between their component geometries andthe physical and mechanical properties ofthe constituent materials, like density andstrength. In a typical metal, the Hall-Petcheffect1,2 relates the yield strength, σ, to theaverage grain size, d, through σ ∼ d1/2. Incellular materials, Young's modulus, E, andstrength, σ, scale with density: E, σ ∼ F2.3
Such relationships are challenging to obtainfor complex hierarchical cellular structures
like vertically aligned carbon nanotubes(VACNT) forests, with possible applicationsranging frommicroelectro-mechanical systems(MEMS) to energy dissipative systems.4�9
These materials represent examples of spa-tial hierarchy because the individual nano-tubes have diameters on the order of tens ofnanometers; the intertube distances mayrange from a few to hundreds of nano-meters; the heights of the forests may beas high as hundreds of micrometers toseveral millimeters; and their lateral extentcan have macroscopic dimensions. The
Received for review May 29, 2013and accepted September 3, 2013.
Published online10.1021/nn402710j
ABSTRACT
Micromechanical experiments, image analysis, and theoretical modeling revealed that local failure events and compressive stresses of vertically aligned
carbon nanotubes (VACNTs) were uniquely linked to relative density gradients. Edge detection analysis of systematically obtained scanning electron
micrographs was used to quantify a microstructural figure-of-merit related to relative local density along VACNT heights. Sequential bottom-to-top
buckling and hardening in stress�strain response were observed in samples with smaller relative density at the bottom. When density gradient was
insubstantial or reversed, bottom regions always buckled last, and a flat stress plateau was obtained. These findings were consistent with predictions of a
2D material model based on a viscoplastic solid with plastic non-normality and a hardening�softening�hardening plastic flow relation. The hardening
slope in compression generated by the model was directly related to the stiffness gradient along the sample height, and hence to the local relative density.
These results demonstrate that a microstructural figure-of-merit, the effective relative density, can be used to quantify and predict the mechanical response.
KEYWORDS: vertically aligned carbon nanotubes . compression . mechanical properties . energy storage . finite element simulation
ARTIC
LE
PATHAK ET AL. VOL. 7 ’ NO. 10 ’ 8593–8604 ’ 2013
www.acsnano.org
8594
complexity associated with the structure of VACNTs, aswell as the unique properties driven by the nanometerdimensions and the van der Waals interactions amongthe individual tubes, render quantifying their physicalproperties like density, characteristic mean-free path,and cell size particularly challenging. No quantitativetheory exists which can predict the mechanical re-sponse of carbon nanotube networks as a function oftheir local microstructural attributes like density, por-osity, and tortuosity. Establishing such a link will serveas the foundation for predicting failure, deformation
mechanisms, andmacroscalemechanical properties asa function of the controllable material characteristics.The details of VACNT synthesis10�12 determine the
diameter and quality of individual CNTs, as well as theiralignment and density within the forest. Such varia-tions are evident at the individual tube level (diametersvarying between 2�3 nm,13 to 20�50 nm,14 to greaterthan 100 nm15) and at the collective matrix levels(density varying from 0.01816 to 0.95 g/cm3).13 This isevidenced, in part, by the wide range of mechanicalproperties reported for VACNTs grown by differentmethods. For example, compressive modulus andbuckling strengths of VACNTs have ranged from sub-MPa9,17 to tens of MPa18�20 to GPa13,21 (Figure S1).Further, nominally identical VACNT samples havebeen found to both substantially recover their shapeafter large compressions (Figure S1a,c4,8,9,22,23), as wellas to deform permanently even at modest strains(Figure S1b,d14,20,24�26).Uniaxial compression experiments on VACNT sam-
ples withmicrometer dimensions4,10,14,23,27 and inden-tations into VACNT forests13,28�30 have demonstratedtheir mechanical deformation characteristics to besimilar to open-cell foams.3,31 In the spirit of a foam-like response, the compressive stress�strain relation-ship for VACNTs has three distinct regimes: (1) initiallinear elastic loading, (2) an oscillatory plateau, whereeach undulation in the data corresponded to a loca-lized buckle formation in the material, and (3) a densi-fication, manifested by a rapid stress increase. Incontrast to cellular foams, which typically deform bybending and collapsing of cell walls,3,31 postelasticflow in VACNTs is accommodated by the formationof localized folds or buckles of the entangled arrays,usually oriented orthogonally to the compression di-rection (Figure S1).4,10,17,24,25,28,31 Most VACNT struc-tures, including patterned micropillars, have beenreported to follow a particular bottom-to-top bucklingsequence under uniaxial compression. The first foldgenerally nucleated close to the substrate, and eachsubsequent lateral collapse event initiated only afterthe preceding one was completed, sequentially collap-sing the entire structure.4,10,14,23 Another departurein the compressive behavior of VACNTs from that oftypical open-cell foams is that the plateau in theirstress�strain curves has a positive global slope,
ranging from 0.5 to 12 MPa4,10,14,23 (Figure S1), while inopen-cell foams, this plateau is virtually horizontal.3
It has been speculated that the observed nonzeroplateau slopes in VACNTs may be uniquely related toa gradient in the material mechanical properties, likestiffness or yield strength, along the sample height.4,14
This reasoning is partly motivated by the numerousobservations of localized folds within CNT structuresalways forming first at the locations close to the growthsubstrate, which correspond to the lowest CNT numberdensity.32,33 Sparser-spaced individual tubes close tothe growth substrate reduce the load-bearing capacityof the overall structure under compression hence result-ing in a lower stiffness and yield stress at the base.4,24
Interactions between adjacent CNTs have been in-vestigated atmolecular levels,34�36 as well as for arraysof CNTs.37�40 Recent computational models, whichqualitatively captured the mechanics of VACNT de-formation, have provided a physical foundation forstrengthening in the stress plateau. Using a con-stitutive hardening�softening�hardeningmodel withplastic non-normality, Hutchens et al.41�43 showedthat a linear variation in the input yield-like propertyalong sample height correlated with the output slopeof the stress plateau. A constant property along thesample height resulted in a flat stress plateau. Introdu-cing a linear gradient in the input property caused acorresponding linear increase in the slope of the stressplateau. What remains unknown is the relationshipbetween this yield-like mechanical property and phy-sical attributes of thematerial. This is due, in part, to thedifficulty of quantifying local microstructural charac-teristics of VACNTs, as well as by the lack of experi-mental data that show a flat plateau in the com-pressive stress�strain response of VACNTs.This line of reasoning suggests that the stress�strain
response of VACNT forests is related to the variations inrelative density along the forest height. The develop-ment experimentally informed quantitative models ofVACNT deformation has been hampered by challengesin measuring local CNT density within a forest. Duringthe early growth of a VACNT forest, the van der Waalsattraction betweenCNTs causes them to self-align afterattaining a threshold density,32,44 which results in theformation of a highly intertwined, porous three-dimen-sional network. These morphological complexities re-sult in several challenges when using scanning electronmicroscopes (SEMs) to image VACNT forests: (1) ampleadjustments in imaging conditions like depth of field,contrast, and brightness are required as the beam israstered along the sample; (2) interaction volumebetween incident and secondary electrons is ambig-uous, which obscures the interpretation of a two-dimensional image onto a three-dimensional struc-ture; and (3) sample-to-sample variation is substantial.While other nondestructive techniques, such as small-angle X-ray scattering (SAXS) and mass attenuation,
ARTIC
LE
PATHAK ET AL. VOL. 7 ’ NO. 10 ’ 8593–8604 ’ 2013
www.acsnano.org
8595
have been used to quantify the evolution of alignment,diameter, and density of CNTs during growth,32,44�46
the lower resolution and larger beam size of thesetechniques (>10 μm44,47) limit their applicability formicroscale density gradient determination. Althoughmeasurements of optical extinction have been recentlyemployed to verify density variations across individualCNT pillars,48 wewere unable (logistically, and becauseof sample design) to apply it to this study. Hence, weapply an edge detection technique based on theCanny algorithm49 to systematic SEM images of VACNTsto calculate the relative differences in two-dimensionalareal density as a function of spatial coordinates. Acombination of image analysis, in situ microcompres-sion experiments, and theoretical modeling used in thiswork revealed a quantifiable relationship between therelative density within VACNTs, their microstructuraldeformationmechanism, and the stress�strain response.
RESULTS
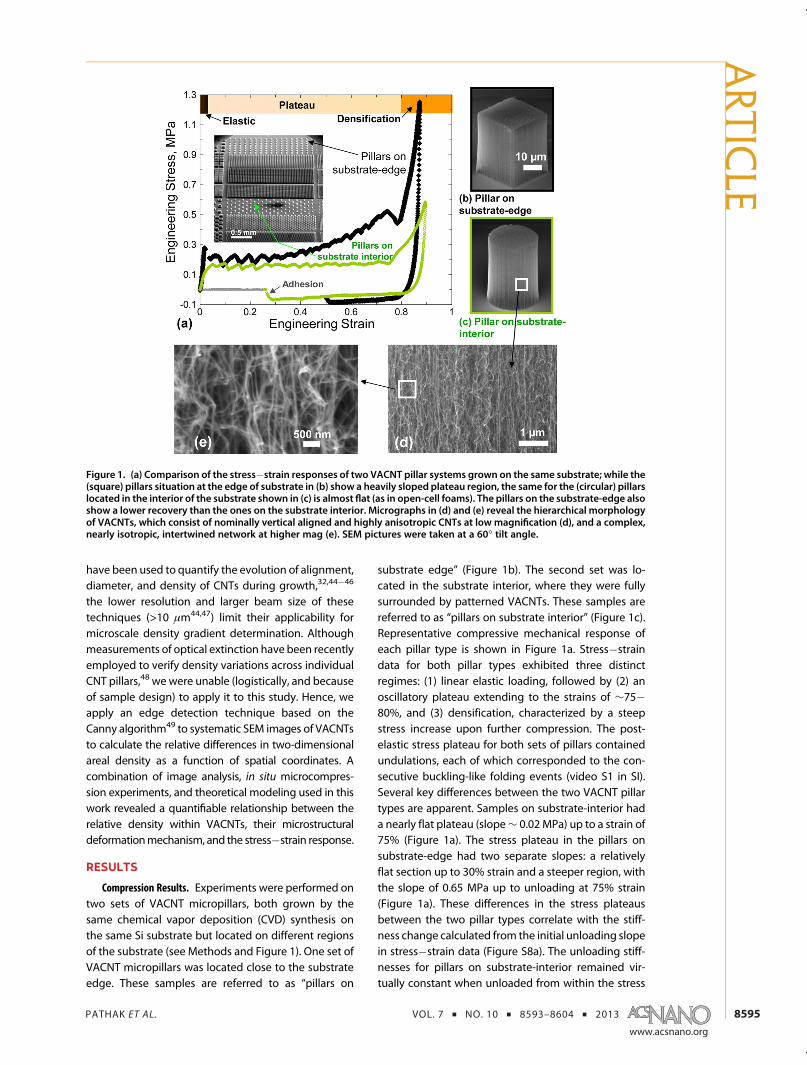
Compression Results. Experiments were performed ontwo sets of VACNT micropillars, both grown by thesame chemical vapor deposition (CVD) synthesis onthe same Si substrate but located on different regionsof the substrate (see Methods and Figure 1). One set ofVACNT micropillars was located close to the substrateedge. These samples are referred to as “pillars on
substrate edge” (Figure 1b). The second set was lo-cated in the substrate interior, where they were fullysurrounded by patterned VACNTs. These samples arereferred to as “pillars on substrate interior” (Figure 1c).Representative compressive mechanical response ofeach pillar type is shown in Figure 1a. Stress�straindata for both pillar types exhibited three distinctregimes: (1) linear elastic loading, followed by (2) anoscillatory plateau extending to the strains of ∼75�80%, and (3) densification, characterized by a steepstress increase upon further compression. The post-elastic stress plateau for both sets of pillars containedundulations, each of which corresponded to the con-secutive buckling-like folding events (video S1 in SI).Several key differences between the two VACNT pillartypes are apparent. Samples on substrate-interior hada nearly flat plateau (slope∼ 0.02 MPa) up to a strain of75% (Figure 1a). The stress plateau in the pillars onsubstrate-edge had two separate slopes: a relativelyflat section up to 30% strain and a steeper region, withthe slope of 0.65 MPa up to unloading at 75% strain(Figure 1a). These differences in the stress plateausbetween the two pillar types correlate with the stiff-ness change calculated from the initial unloading slopein stress�strain data (Figure S8a). The unloading stiff-nesses for pillars on substrate-interior remained vir-tually constant when unloaded from within the stress
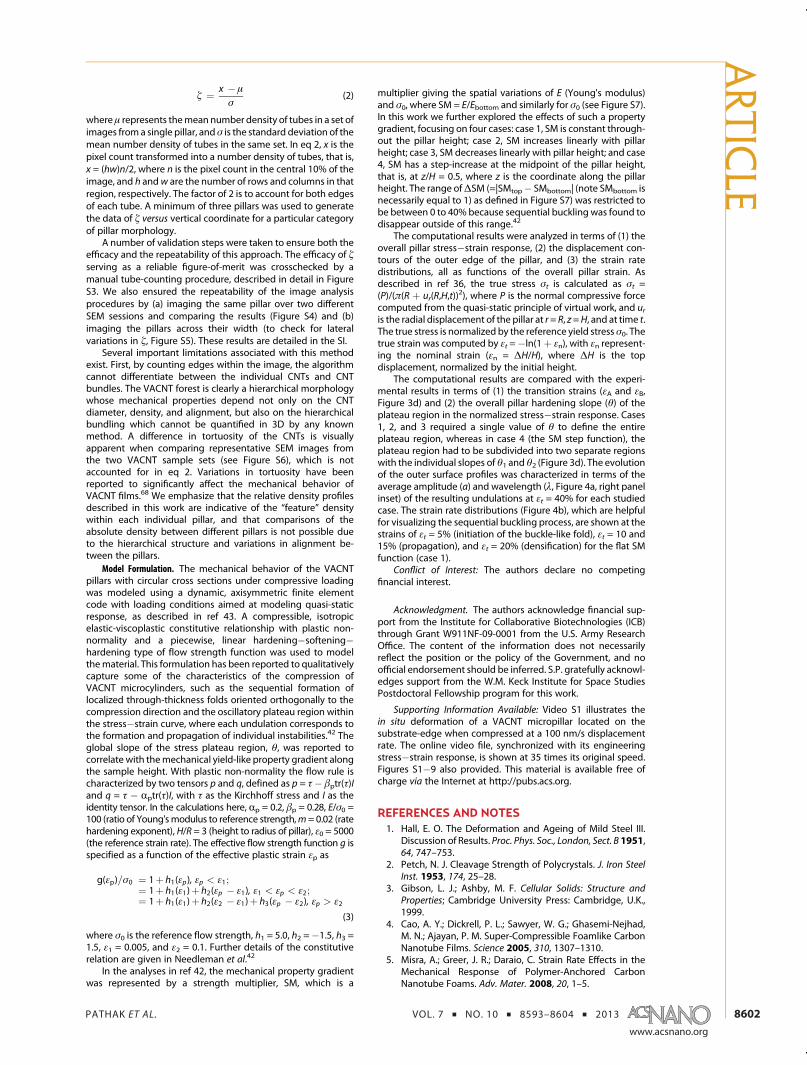
Figure 1. (a) Comparison of the stress�strain responses of two VACNT pillar systems grown on the same substrate; while the(square) pillars situation at the edge of substrate in (b) show a heavily sloped plateau region, the same for the (circular) pillarslocated in the interior of the substrate shown in (c) is almost flat (as in open-cell foams). The pillars on the substrate-edge alsoshow a lower recovery than the ones on the substrate interior. Micrographs in (d) and (e) reveal the hierarchical morphologyof VACNTs, which consist of nominally vertical aligned and highly anisotropic CNTs at low magnification (d), and a complex,nearly isotropic, intertwined network at higher mag (e). SEM pictures were taken at a 60� tilt angle.
ARTIC
LE
PATHAK ET AL. VOL. 7 ’ NO. 10 ’ 8593–8604 ’ 2013
www.acsnano.org
8596
plateau region (E = 9.11 ( 2.7 MPa). Stiffness of thepillars on substrate-edge increased from E≈ 20MPa toE ≈ 31 MPa as the strain increased beyond 30%. Ingeneral, pillars on substrate-edge appeared stiffer thanpillars on substrate interior (see Figure S8a). The twopillar sets also differed in the amount of recovery whenunloaded from postdensification regime: pillars onsubstrate-interior (R≈ 57.9( 0.9%) showed an almost45% higher recovery than those on substrate-edge(R ≈ 39.8 ( 3.9%, Figure S8b).
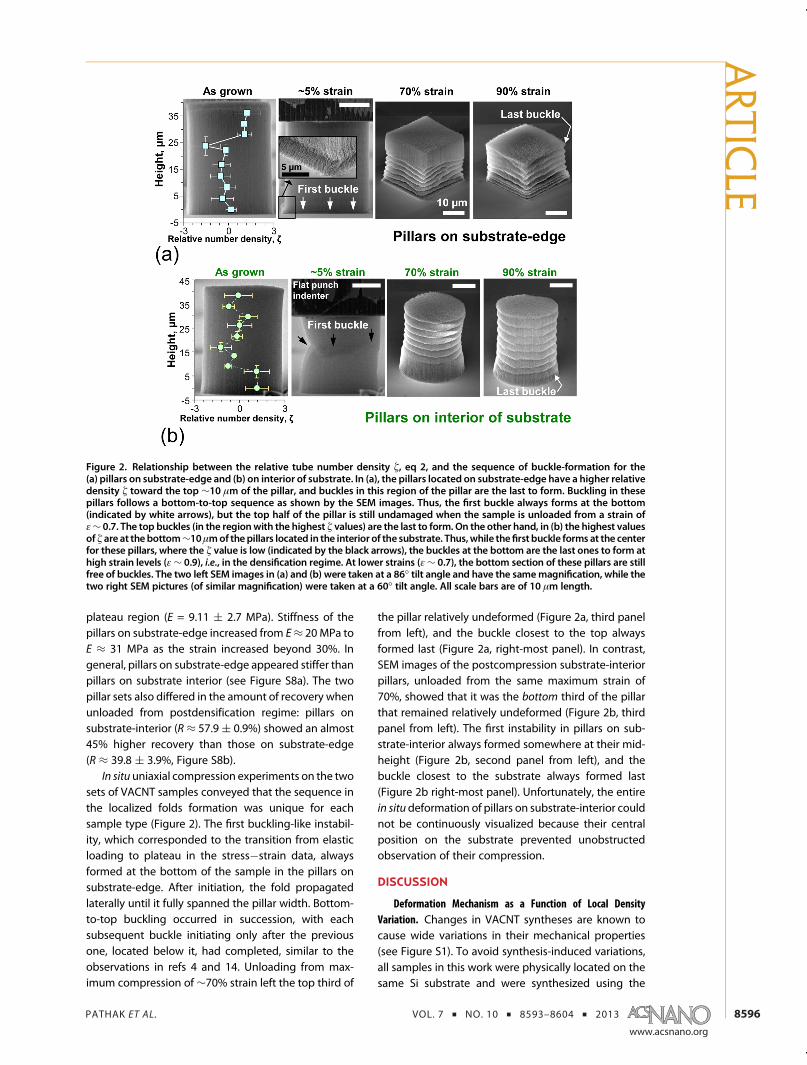
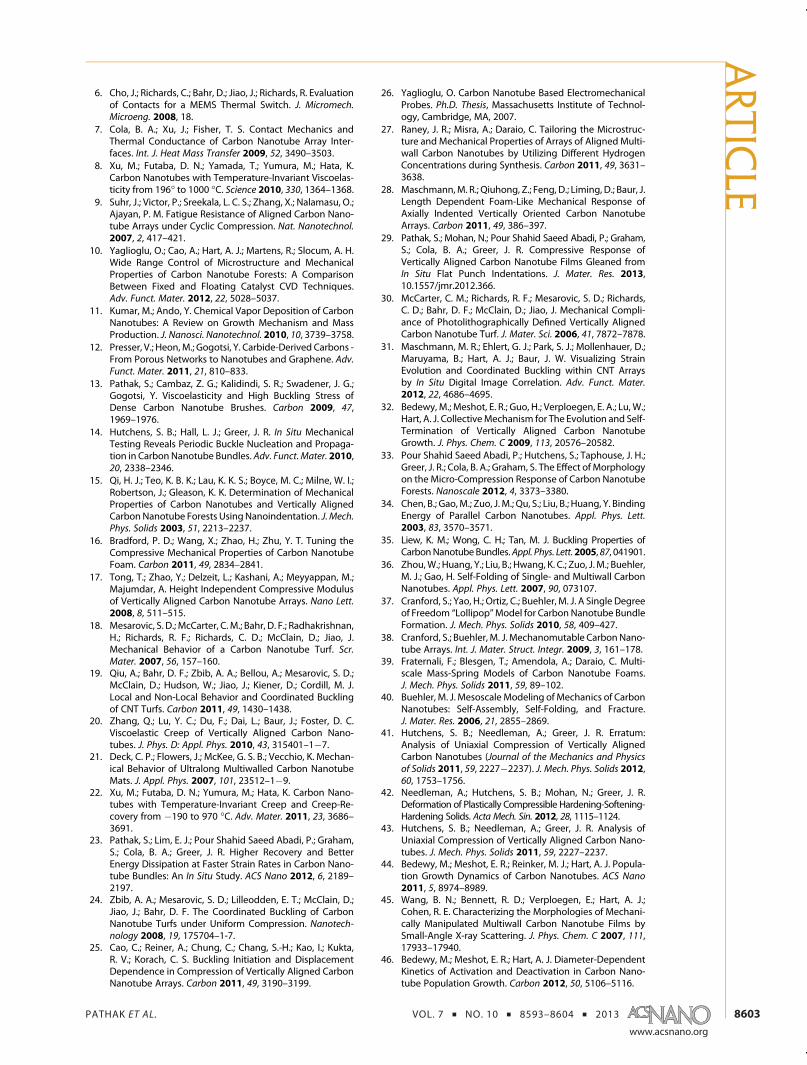
In situ uniaxial compression experiments on the twosets of VACNT samples conveyed that the sequence inthe localized folds formation was unique for eachsample type (Figure 2). The first buckling-like instabil-ity, which corresponded to the transition from elasticloading to plateau in the stress�strain data, alwaysformed at the bottom of the sample in the pillars onsubstrate-edge. After initiation, the fold propagatedlaterally until it fully spanned the pillar width. Bottom-to-top buckling occurred in succession, with eachsubsequent buckle initiating only after the previousone, located below it, had completed, similar to theobservations in refs 4 and 14. Unloading from max-imum compression of∼70% strain left the top third of
the pillar relatively undeformed (Figure 2a, third panelfrom left), and the buckle closest to the top alwaysformed last (Figure 2a, right-most panel). In contrast,SEM images of the postcompression substrate-interiorpillars, unloaded from the same maximum strain of70%, showed that it was the bottom third of the pillarthat remained relatively undeformed (Figure 2b, thirdpanel from left). The first instability in pillars on sub-strate-interior always formed somewhere at their mid-height (Figure 2b, second panel from left), and thebuckle closest to the substrate always formed last(Figure 2b right-most panel). Unfortunately, the entirein situ deformation of pillars on substrate-interior couldnot be continuously visualized because their centralposition on the substrate prevented unobstructedobservation of their compression.
DISCUSSION
Deformation Mechanism as a Function of Local DensityVariation. Changes in VACNT syntheses are known tocause wide variations in their mechanical properties(see Figure S1). To avoid synthesis-induced variations,all samples in this work were physically located on thesame Si substrate and were synthesized using the
Figure 2. Relationship between the relative tube number density ζ, eq 2, and the sequence of buckle-formation for the(a) pillars on substrate-edge and (b) on interior of substrate. In (a), the pillars located on substrate-edge have a higher relativedensity ζ toward the top ∼10 μm of the pillar, and buckles in this region of the pillar are the last to form. Buckling in thesepillars follows a bottom-to-top sequence as shown by the SEM images. Thus, the first buckle always forms at the bottom(indicated by white arrows), but the top half of the pillar is still undamaged when the sample is unloaded from a strain ofε∼ 0.7. The top buckles (in the regionwith the highest ζ values) are the last to form. On the other hand, in (b) the highest valuesof ζ are at thebottom∼10μmof thepillars located in the interior of the substrate. Thus,while thefirst buckle forms at the centerfor these pillars, where the ζ value is low (indicated by the black arrows), the buckles at the bottom are the last ones to form athigh strain levels (ε∼ 0.9), i.e., in the densification regime. At lower strains (ε∼ 0.7), the bottom section of these pillars are stillfree of buckles. The two left SEM images in (a) and (b) were taken at a 86� tilt angle and have the samemagnification, while thetwo right SEM pictures (of similar magnification) were taken at a 60� tilt angle. All scale bars are of 10 μm length.
ARTIC
LE
PATHAK ET AL. VOL. 7 ’ NO. 10 ’ 8593–8604 ’ 2013
www.acsnano.org
8597
same CVD process during the same run. Differences intheir mechanical response, therefore, must stem fromthe specific details of their microstructure.8,9,14 Hierarch-ical arrangements within VACNT microstructure acrossmultiple length scales are shown in Figures 1b�e.At the lower magnifications of 4000�, sample crosssections appear either square (Figure 1b) or circular(Figure 1c). Increasing magnification 10 times to40000� reveals the nominally vertical alignment ofCNTs growing perpendicularly to the substrate withinthe overall VACNT network (Figure 1d). A further 5-foldincrease in magnification to 200000� reveals an iso-tropic CNT network with significant intertwiningamong the somewhat vertically aligned long, curvedsegments of individual tubes (Figure 1e).14,43,50 As-grown, some tube segments within the CNT forestwere bent and formed contact points with othersegments as a result of van der Waals forces duringgrowth. The overall properties of such a hierarchicallycomposed material are expected to be a combinationof the mechanical attributes of its constituents at eachrelevant length scale; from individual nanotubes,whose properties are a function of their geometries,number of walls, and chirality, to micrometer-sized“cell” dimensions, and to the final macroscopic, mono-lithic-like forests. The shapes of VACNT pillar crosssections (square vs circular) did not appear to influencetheir deformation characteristics; pillars with bothcross-sectional geometries showed an equivalent me-chanical response and similar buckling sequenceswhen they were located in the substrate interior(Figure S9). Thus, the substantial differences in thedeformation and mechanical properties between thetwo pillar types studied in this work were likely causedby their differing microstructural features rather thancross-sectional shapes.
Quantification of Local Density via Image Analysis. Quanti-fying absolute density while concurrently capturinglocal fluctuations in density of VACNTs is challengingbecause these samples do not have enough massfor the standard BET-type absorption techniques51�53
and are too complex for the typical image-basedmethods.54,55 To overcome these difficulties, we choseto evaluate the relative changes in the local VACNTdensity as a function of height rather than to attemptto compute the absolute densities. We utilized edgedetection techniques using the Canny algorithm49 tosystematically calculate the average relative numberdensity, ζ, of tubes in each SEM image (see Methods).Image analysis revealed that the two types of pillarsexhibitedopposite trends in relative density (Figure 2a,b).Pillars on substrate-edge had highest ζ in the top10 μm, and their density profiles resembled a step func-tion, where ζ ≈ 1 for all locations above the height of∼23 μm, and ζ e 0 at all locales below. Maximum ζ inpillars on the substrate-interior was located in thebottom ∼10 μm, close to the substrate, and any
changes in density within this region did not exceedthe measurement error. Image analysis also revealedthat the apparent density decreased in the midsectionof all samples: at∼23.7( 3.5 μm in 36 μm tall pillars onsubstrate-edge and at ∼16.3 ( 1.5 μm in 40 μm tallsamples on substrate-interior.
Quantifying relative density differences betweenthe two sample sets is useful in understanding theirdeformation mechanisms, and the knowledge of therelative density profiles can be used to predict thelocation of initial buckling instability in a VACNTmatrix.It is reasonable to expect the first folding/bucklingevent during compressions of VACNTs to originateclose to the substrate because of its rigid constraint.24
Pillars located on substrate-edge corroborated thisnotion (Figure 2a). In contrast, the incipient instabilityin pillars on sample-interior occurred somewhere in themiddle of pillar height, at the locales with the lowestrelative CNT density. It appears that the lower relativedensity trumps the constraining effects of the substratein driving the location of the buckling instability in thesesample-interior pillars. The last buckles in both sets ofpillars occurred in the regions with the highest relativeCNT densities: near the top in the substrate-edge sam-ples and at the base in the substrate-interior ones.
We note two important limitations associated withthe calculation of ζ using eq 2 (seeMethods and FigureS6): (i) the reported values of ζ may be an under-estimate, because eq 2 cannot differentiate betweenthe edges of individual CNTs and CNT bundles; (ii)possible differences in tortuosity (alignment) of theCNTs are also unaccounted for by our approach. Thus,we emphasize that the relative density profiles de-scribed in this work are indicative of the “feature”density within each individual pillar, and that compar-isons of the absolute density between different pillarsis not possible due to the hierarchical structure andvariations in alignment between the pillars.
Previous studies have revealed that key attributes(e.g., diameter, alignment, and number density) of theCNT forest morphology evolve in concert during thesuccessive,mechanically coupledstagesofgrowth.32,44,46,56
These reports showed that a higher areal density ofCNTs in as-grown forests results in a higher alignment,where alignment is typically quantified using an or-ientation parameter. Another factor that determinesthe tortuosity of CNTs is the stiffness of individual CNTs,which depends on both the diameter and the numberof walls. Hence, growth recipes that produce higherCNT nucleation density result in denser and morealigned CNT forests, which in turn typically have great-er mechanical stiffness. In addition, tuning the size ofthe catalyst nanoparticles seeding the growth of CNTsto favor the growth of larger diameter CNTs havingmore walls also produces stiffer and more alignedforests, owing to the increased stiffness and straight-ness of individual CNTs. We suggest thatmore tortuous
ARTIC
LE
PATHAK ET AL. VOL. 7 ’ NO. 10 ’ 8593–8604 ’ 2013
www.acsnano.org
8598
CNTs, which exist in lower density forests, have moredefects due to the mechanochemical nature ofgrowth,56 which in turn may influence the mechanicalproperties of the forest.
Linking Density and Strength. Quantifying the localvariations in density along sample heights can alsobe useful in predicting their compressive strengths as afunction of deformation. Some of the features asso-ciated with the inelastic deformation of VACNTs undercompression, that is, sequential buckle formation andplateau-densification in the stress�strain response,have been qualitatively captured using a finite defor-mation model by Hutchens et al.41�43 This formulationuses a compressible elastic-viscoplastic constitutive rela-tion with plastic non-normality and a linear hardening�softening�hardening flow strength function (seeMethods). The analyses in ref 43 also showed that anaxial gradient in the yield-like property over sampleheight correlated with the global slope in the com-puted stress�strain output and affected outer surfacedisplacement. Extending this model toward mechan-ical stresses and strain predictions as a function ofmicrostructural detail such as density requires deter-mining the relationship between the relative densityand a mechanical property, which corresponds to theinput strength multiplier, SM, in the finite elementmodel. For example, the E ∼ ζ2 relationship for open-cell foams3 may not hold for VACNTs, whose complexhierarchical makeup, as well as friction and van derWaals attraction among individual nanotubes, elicit aunique stress�strain response. It is reasonable to ex-pect that the stiffness or modulus of VACNT forestswould depend on the number of intertube junctions inthe matrix, as well as by the number of load-bearingmembers and their individual mechanical properties.To determine the dependence of Young's modulus onamorphology-governed figure of merit, Astrom et al.57
applied a modified semitheoretical version of the Coxshear-lag model58 to CNTmats and fibers, while takinginto account the statistical number of bundle�bundlecontacts, which can be altered by chemical or irradia-tion-induced cross-linking. They reported that theeffective modulus of a single walled CNT mat waslinearly related to the average number of bundle�bundle contacts per bundle, which has not beenexperimentally quantified. The number of fiber cross-ings increased with the greater number of fibers,59 andhence with the density, although this effect was notnecessarily linear. This suggests that, to a first approx-imation, the stiffness of VACNTsmay be linearly relatedto its density, E ∼ ζ. Such a linear correlation wasexperimentally verified by Bradford et al.16 who used apostgrowth CVD treatment onVACNT arrays to system-atically vary their densities and then measured com-pressive stresses as a function of compressive strain.Unloading elastic moduli as a function of densityinferred from data reported in ref 16 shows a nearly
linear E vs ζ dependence. This line of reasoning and alack of any other conclusive experimental reports onthe subject30,60�62 suggests that the relationship be-tween stiffness and relative density in VACNTs is linear.
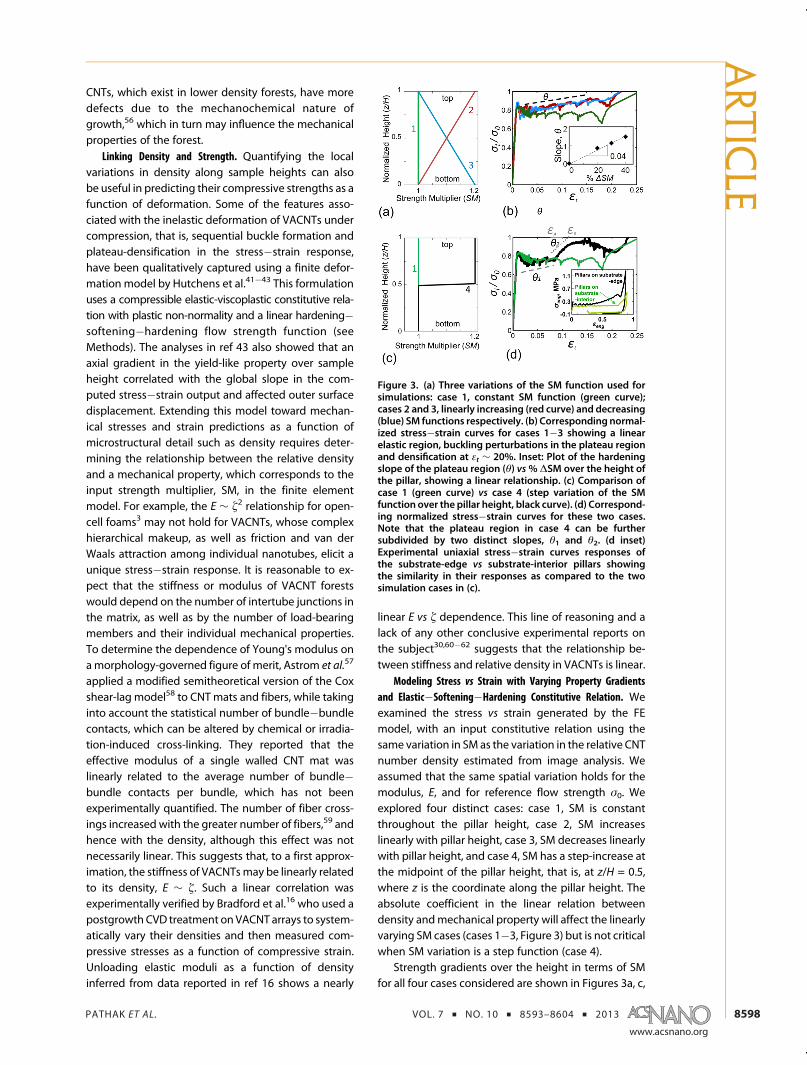
Modeling Stress vs Strain with Varying Property Gradientsand Elastic�Softening�Hardening Constitutive Relation. Weexamined the stress vs strain generated by the FEmodel, with an input constitutive relation using thesame variation in SM as the variation in the relative CNTnumber density estimated from image analysis. Weassumed that the same spatial variation holds for themodulus, E, and for reference flow strength σ0. Weexplored four distinct cases: case 1, SM is constantthroughout the pillar height, case 2, SM increaseslinearly with pillar height, case 3, SM decreases linearlywith pillar height, and case 4, SM has a step-increase atthe midpoint of the pillar height, that is, at z/H = 0.5,where z is the coordinate along the pillar height. Theabsolute coefficient in the linear relation betweendensity andmechanical property will affect the linearlyvarying SM cases (cases 1�3, Figure 3) but is not criticalwhen SM variation is a step function (case 4).
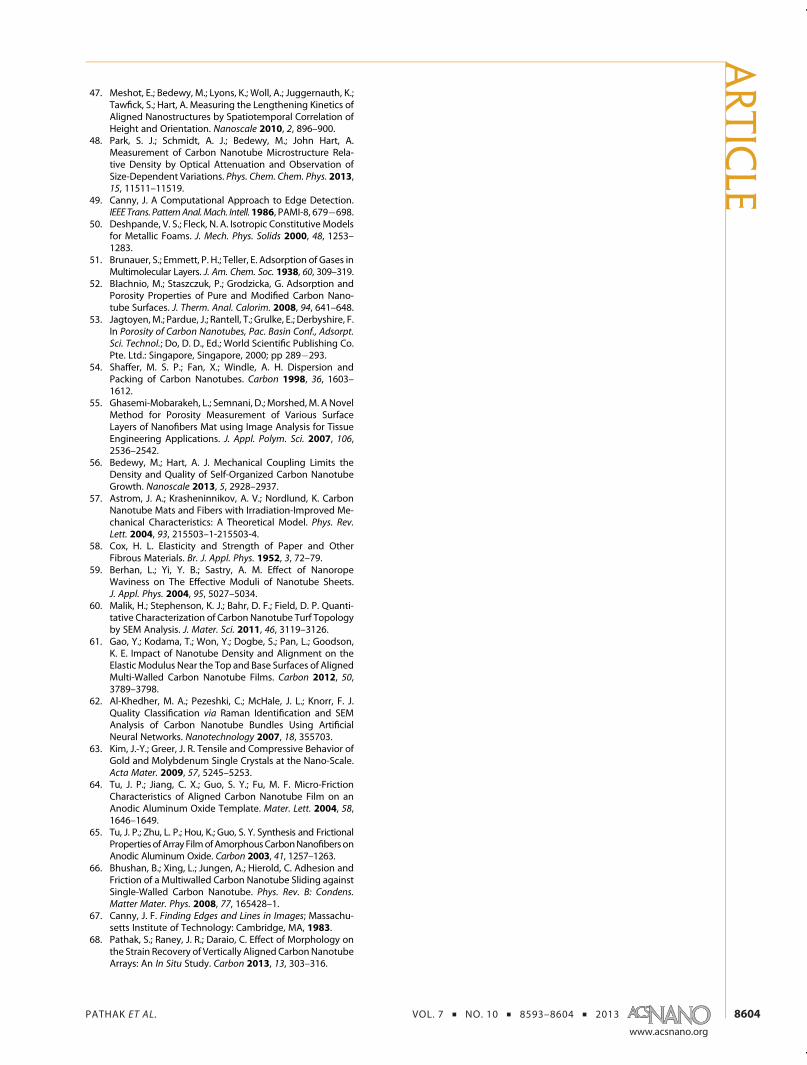
Strength gradients over the height in terms of SMfor all four cases considered are shown in Figures 3a, c,
Figure 3. (a) Three variations of the SM function used forsimulations: case 1, constant SM function (green curve);cases 2 and 3, linearly increasing (red curve) and decreasing(blue) SM functions respectively. (b) Corresponding normal-ized stress�strain curves for cases 1�3 showing a linearelastic region, buckling perturbations in the plateau regionand densification at εt ∼ 20%. Inset: Plot of the hardeningslope of the plateau region (θ) vs% ΔSM over the height ofthe pillar, showing a linear relationship. (c) Comparison ofcase 1 (green curve) vs case 4 (step variation of the SMfunction over the pillar height, black curve). (d) Correspond-ing normalized stress�strain curves for these two cases.Note that the plateau region in case 4 can be furthersubdivided by two distinct slopes, θ1 and θ2. (d inset)Experimental uniaxial stress�strain curves responses ofthe substrate-edge vs substrate-interior pillars showingthe similarity in their responses as compared to the twosimulation cases in (c).
ARTIC
LE
PATHAK ET AL. VOL. 7 ’ NO. 10 ’ 8593–8604 ’ 2013
www.acsnano.org
8599
and normalized stress�strain data for Cases 1�3 areshown in Figures 3b and d. These plots revealed adirect linear relationship between the global harden-ing slope, θ, of the stress plateau and strength multi-plier range ΔSM (ΔSM = |SMtop � SMbottom| = 20%(inset in Figure 3a). Comparing cases 2 and 3 revealedthat a forward or reverse gradient in SM of the samemagnitude led to the same hardening plateau slope inthe normalized stress�strain curve. This lack of sensi-tivity to the direction in the gradient is likely due to theidentical fixed boundary conditions in axial direction(but not necessarily in the radial direction) at both endsof the sample in the model. When gradients of oppo-site signs are prescribed, the deformation would com-mence in the direction of weaker-to-stronger part ofthe pillar, that is, in the opposing directions. No distinc-tion between stress�strain outputs would be expectedbecause in both cases the stress is governed by thestrain rate wave overcoming the progressively harderregions, regardless of their position within the pillar.For case 4, where SM is represented as a step functionalong the sample height and which matches theexperiment most closely, a single value of slope wasinsufficient to characterize the stress�strain data. Twodistinct slopes, θ1 and θ2, correlated with the relativelyporous (weaker) bottom part and the more denselypopulated (stiffer) top segment. The normalizedstress�strain curve for case 4 (Figure 3d, black curve)closely matched that for case 1 (constant property, nogradient) until εA. The second slope, θ2, between thestrains of εA and εB, was significantly higher thanθ1 dueto the abrupt shift to higher strengths in the middleof the pillar. The hardening slope in case 1, uniquelydefined by a single value of θ, was lower compared tothe two linearly varying cases (cases 2 and 3), whichsuggests a linear relation between output slope θ andinput property variation, ΔSM. In all cases, the slope(s)of the stress�strain output generated by the FE modelqualitatively reflected the shape of the input yield-likeproperty gradient. It is reasonable that this linearcorrelation can provide a quantifiable link betweenthe measurable microstructural property, density, andmacroscopic mechanical response, that is, stress, as afunction of strain.
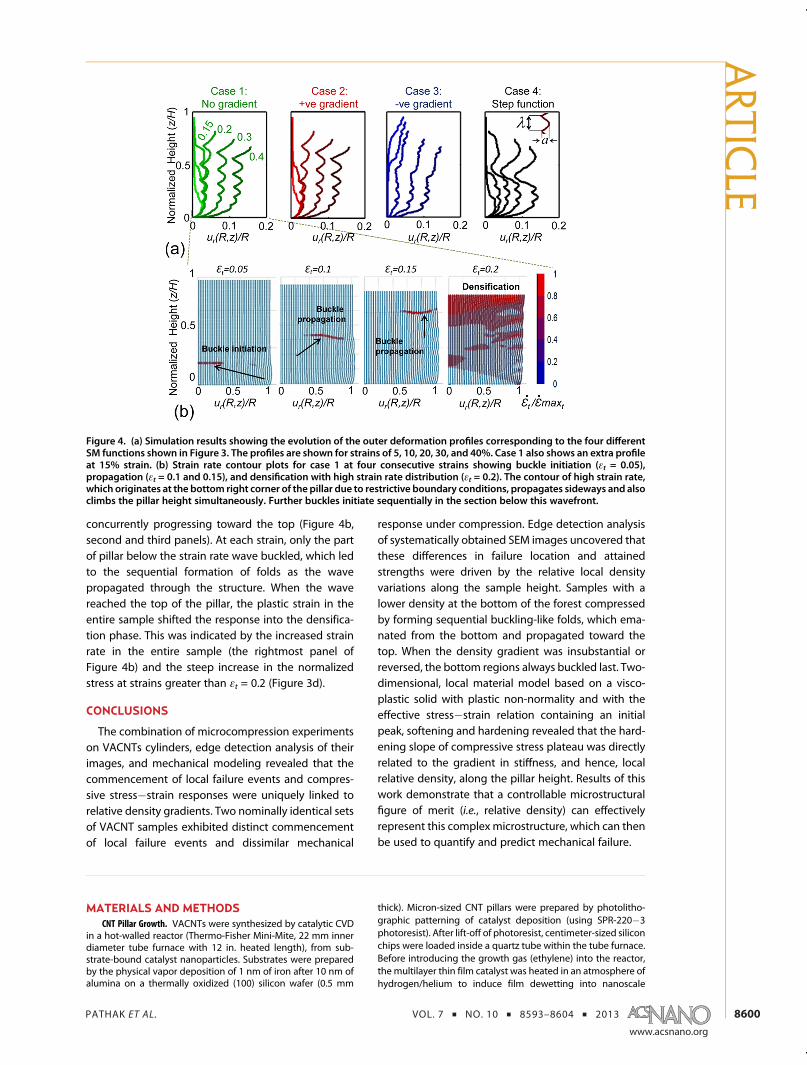
Table 1 provides a matrix of input and outputparameters for each studied case. Additional outputfigures of merit were amplitude, a, and wavelength, λ,of the outer surface displacement undulations, whosedefinitions are schematically shown in Figure 4a.Table 1 demonstrates a close-to-50% drop in the ampli-tude of oscillations in case 3 (negative propertygradient) compared to case 1 (no gradient), likely dueto the substrate-like hindrance from the fixed radialdisplacement boundary condition at the bottom.As the instability progresses from the top towardthe bottom of the sample, radial displacements arerestricted, which lowers the buckle amplitude.
The buckle wavelength remained unaffected becausethe axial boundary conditions at the top and bottomwere similar. The presence of a step-shaped barrier instrength in case 4 reduces the effective length of pillarto half of its real length, allowing only the lower half toundergo sequential folding, while the upper half has asingle instability. In this case, both the amplitude andthe wavelength of the outer surface displacementswere lower than in all other cases. Assuming a linearcorrelation between the local density and yield-likestrength at the same location, strength variations in thesimulated cases 1 and 4 represent reasonable approx-imations to the density distributions gleaned from theuninformed image analysis for the two sets of pillars.Both experimental and simulated stress vs strain rela-tionships reflect the attributes of these input variations.
Effects of Strain Rate Wave. We also evaluated theeffects of strain rate within the individual foldingevents. The folding instability appears to occur in twoconsecutive phases: initiation and propagation. Theinitiation of these instabilities is uniquely defined byand is sensitive to the direction of the density gradient:the first fold/buckling-like instability always nucleatedat the weakest point over the height. This holds true inboth the experiment (Figure 2) and the simulations(Figure 3). For case 2, where SM function is lowest at thebottom of the pillar, the first buckle occurred at thepillar base, while the reverse holds true for case 3,which had the lowest SM value at the top of thesample. Case 4 in the simulations differed from allothers because the sequential buckling propagatedonly in the relatively weaker bottom half of the pillar.The hardening slope θ1 from the initial loading to εA forcase 4 (step function) was virtually equivalent to thatfor case 1 (uniform property), which implies that thestrain rate wave had not yet reached the strengthbarrier at that point (see Table 1). Figure 4a showsouter surface displacements for each studied case atfour progressively higher applied strains, and Figure 4bshows the strain rate contour plots within the bucklingphases for the no-gradient case (case 1). These com-putational results revealed that in case 1 (no gradient)the first fold initiated at the bottom with a localizedincrease in strain rate, which initiated at the onsetof the first buckling instability (leftmost panel inFigure 4b) and propagated laterally to the right while
TABLE 1. Comparison of the Deformation Characteristics
Measured for the Four Variations of the SM Function
concurrently progressing toward the top (Figure 4b,second and third panels). At each strain, only the partof pillar below the strain rate wave buckled, which ledto the sequential formation of folds as the wavepropagated through the structure. When the wavereached the top of the pillar, the plastic strain in theentire sample shifted the response into the densifica-tion phase. This was indicated by the increased strainrate in the entire sample (the rightmost panel ofFigure 4b) and the steep increase in the normalizedstress at strains greater than εt = 0.2 (Figure 3d).
CONCLUSIONS
The combination of microcompression experimentson VACNTs cylinders, edge detection analysis of theirimages, and mechanical modeling revealed that thecommencement of local failure events and compres-sive stress�strain responses were uniquely linked torelative density gradients. Two nominally identical setsof VACNT samples exhibited distinct commencementof local failure events and dissimilar mechanical
response under compression. Edge detection analysisof systematically obtained SEM images uncovered thatthese differences in failure location and attainedstrengths were driven by the relative local densityvariations along the sample height. Samples with alower density at the bottom of the forest compressedby forming sequential buckling-like folds, which ema-nated from the bottom and propagated toward thetop. When the density gradient was insubstantial orreversed, the bottom regions always buckled last. Two-dimensional, local material model based on a visco-plastic solid with plastic non-normality and with theeffective stress�strain relation containing an initialpeak, softening and hardening revealed that the hard-ening slope of compressive stress plateau was directlyrelated to the gradient in stiffness, and hence, localrelative density, along the pillar height. Results of thiswork demonstrate that a controllable microstructuralfigure of merit (i.e., relative density) can effectivelyrepresent this complex microstructure, which can thenbe used to quantify and predict mechanical failure.
MATERIALS AND METHODSCNT Pillar Growth. VACNTs were synthesized by catalytic CVD
in a hot-walled reactor (Thermo-Fisher Mini-Mite, 22 mm innerdiameter tube furnace with 12 in. heated length), from sub-strate-bound catalyst nanoparticles. Substrates were preparedby the physical vapor deposition of 1 nm of iron after 10 nm ofalumina on a thermally oxidized (100) silicon wafer (0.5 mm
thick). Micron-sized CNT pillars were prepared by photolitho-graphic patterning of catalyst deposition (using SPR-220�3photoresist). After lift-off of photoresist, centimeter-sized siliconchips were loaded inside a quartz tube within the tube furnace.Before introducing the growth gas (ethylene) into the reactor,the multilayer thin film catalyst was heated in an atmosphere ofhydrogen/helium to induce film dewetting into nanoscale
Figure 4. (a) Simulation results showing the evolution of the outer deformation profiles corresponding to the four differentSM functions shown in Figure 3. The profiles are shown for strains of 5, 10, 20, 30, and 40%. Case 1 also shows an extra profileat 15% strain. (b) Strain rate contour plots for case 1 at four consecutive strains showing buckle initiation (εt = 0.05),propagation (εt = 0.1 and 0.15), and densification with high strain rate distribution (εt = 0.2). The contour of high strain rate,which originates at the bottom right corner of the pillar due to restrictive boundary conditions, propagates sideways and alsoclimbs the pillar height simultaneously. Further buckles initiate sequentially in the section below this wavefront.
ARTIC
LE
PATHAK ET AL. VOL. 7 ’ NO. 10 ’ 8593–8604 ’ 2013
www.acsnano.org
8601
particles. LabVIEW was used to interface and control all processvariables, such as temperature and gas flow rates. After a 5 minhelium (1000 sccm) purging step, hydrogen (400 sccm) andhelium (100 sccm) were mixed and the temperature wasramped up to 775 �C for 10 min. The same temperature wasmaintained for another 10 min. Finally, ethylene (100 sccm) wasintroduced to the system for a maximum of 30 growth minutes.After growth, the tube was purged again with helium duringcooling.
Ex Situ Compression Experiments. Two sets of stand-alone pat-terned VACNT samples, grown on the same Si substrate, werechosen for the compression tests (see Figures 1 and S9). Whileboth sample sets were patterned as micropillars, their locationson the substrate significantly affected their mechanical re-sponse. One set of VACNT micropillars was located at the edgeof the substrate and had square cross sections with side lengthsof ∼25 μm (referred to as “pillar on substrate edge”, Figures 1band S9). This set consisted of three rows of pillars at the extremeedge of substrate (a total of 51 pillars, three rows of 17 pillarseach). All remaining pillars were located in the interior of thesubstrate where it was surrounded by patterned VACNTs on allsides. The VACNT micropillars in this set includes the remainingsquare pillars, which were situated in a more interior location(Figure S9c), aswell as the pillarswith circular cross sectionswithdiameters of∼28μm(referred to as “pillar on substrate interior”,Figures 1c and S9). A total of 114 pillars tested showed the“pillars in substrate interior” behavior, out of which 34 werepillars of square cross section and the rest of circular crosssection. The heights of both types of samples increased from 30to 40.5 μm for the edge and from 38.7 to 42.6 μm for the interiorsamples over the lateral distance of 2 mm on the Si substrate.
The compression experiments were performed in air, usingthe XP module of Agilent's nanoindenter G200 with a customfabricated,∼120 μmdiameter, diamond flat punch indenter tip.Tests were performed at constant displacement rates of 10, 100,and 1000 nm/s using the Testworks software control methodsdescribed in ref 14. The maximum prescribed displacementsranged from 10 to 90% of the pillar heights, with multiple (up to99) unload�reload cycles performed on the same pillar atdiscrete displacement intervals. During cyclical testing, the sam-ples were unloaded to 10% of the maximum load in the previouscycle and immediately unloaded (i.e., no hold segments). At leastfive tests were conducted at each compression rate.
In Situ Compression Experiments. In situ uniaxial compressiontests were conducted to capture the local microstructuralevolution in the course of deformation. The in situ testing wasconducted in a custom built nanomechanical instrument,SEMentor,63 which is comprised of a nanomechanical dynamiccontactmodule (Agilent Corp.) inside of a SEM (Quanta 200, FEI).The experimental methodology was nominally identical to theex situ experiments, with the exceptions of a vacuum environ-ment and the flat punch dimensions of ∼60 � 80 μm in theSEMentor. The compression axis in the SEMentor is inclined by∼86� with respect to the vertically oriented electron beam,which allows for the unobstructed view of the deforming gaugesection, while simultaneously acquiring the mechanical loadand displacement data. The continuously captured image scanswere recorded as a video file during the test and were synchro-nized with the mechanical data during postprocessing tocorrelate each video frame with its corresponding position onthe stress�strain curve (see video S1 in the SI). The CNTmicropillars in the SEMentor were compressed horizontally,that is, with the gravity acting perpendicular to the compressionaxis, while those in the G200 were conducted vertically.Although the effects of these differences are expected to beminor, the SEMentor-generated results were limited to visuali-zation purposes, and all the data analyses were performed ontests conducted ex situ in air in G200.
Data Analysis. Engineering stresses (σ) and strains (ε) werecalculated using the initial dimensions of the VACNTmicropillaralong with the corrected load (pcorr) and displacement (ucorr)following the procedure in ref 14.
σ ¼ pcorrA0
, ε ¼ ucorrh0
(1)
where A0 = w02 for the square pillars on substrate edge with the
initial side width w0, A0 = πd02/4 for the circular pillars on
substrate interior with the initial diameter d0 and h0 was theinitial height of the pillars. Frictional forces between the VACNTpillar and the indenter head were not taken into account.64�66
The unloading modulus (E) was calculated from the initialunloading slope of the stress�strain curves. The percentagerecovery (R) was defined as the strain recovered at the end ofevery cycle with respect to the total applied strain, R = (εmax �εunload)/(εmax), where εmax is the maximum strain at the end ofloading and εunload is the strain after unloading to 10% of themax load in the previous cycle.
Image Analysis. The relative change in VACNT density alongthe heights of the samples was computed using an algorithmicimage analysis technique centered on edge detection. Duringimaging, the samples were tilted to 30� with respect to thedirection of the electron beam and imaged in a Zeiss 1550VPfield emission SEM. The best imaging conditions were deter-mined to be at 100 kXmagnification, 10 kV accelerating voltage,at a working distance of 6 mm. These parameters captured alarge enough representative area of the VACNT forest whilemaintaining an adequate resolution of the individual CNTs andbundles. To improve accuracy and to reduce variability in theinteraction volume, the same SEM imaging conditions weremaintained for each sample. A total of 9�10 images at evenlyspaced intervals were taken along the height of each pillar. Theprescribed imaging contrast was set as constant along theentire height of every sample, and only the brightness wasadjusted to capture the full range of the intensity spectrum. Toavoid any loss in resolution due to the 30� tilt of the samples,only the central 10% of each imagewas used for image analysis,as demonstrated in Figure S2.
To estimate the number of CNTs in each image, the imageswere first converted to grayscale, and the edges were identifiedand isolated using the Canny algorithm49 (Figure S2). Thismethod has been shown to be more accurate than the purethreshold-based methods61 because it preserves the overlap-ping tubes as individual entities. The Canny algorithm is deter-ministic, that is, it always produces the same result for the sameimage, and it is not sensitive to the image brightness or itsgradient. In the Canny algorithm, the image is first blurred usinga Gaussian filter to remove the noise, with the pixel radius of thefilter chosen specifically to minimize the background noisewhile preserving the necessary detail. In this work, a radius of3 pixels, which corresponds to 1.8 nm in the SEM images, wastaken as the lower bound for the width of the tubes that were inbest focus, that is, likely located in the front of the sample. Thepartial derivatives of the intensities were taken along thehorizontal and vertical directions in the image and were sub-sequently inserted into analytical expressions to produce sets ofangles and magnitudes of these partial derivatives at eachpoint. A total of six discrete angles were evaluated at each pointto minimize both computational time and the rate of falsenegatives. The resulting magnitudes were further filtered bythe nonmaximum suppressionmethod,67 which leaves only theimage of the local maxima in the intensity gradient. Theresulting image was thresholded based on these magnitudes,using hysteresis to preserve the neighboring lower intensitymagnitudes thatmay belong to longer lines. Finally a black-and-white image was generated with a pixel intensity of 1 at thedetected “edges”, and 0 was assigned to all other locations. Theresulting binary image was subsequently treated as a matrixand summed along the rows, producing a column vector of thenumber of edges.
Hereafter, the number of edges per unit width in each SEMimage was calculated as half of the average of the columnvectors. Although these values were found to be comparableacross different samples captured with identical imaging con-ditions, the dependence of the Canny algorithm on the gradientmeans that the images had to be standardized for cross-comparison. This normalization required the images to bemodified such that the mean became 0 and the standarddeviation became 1. This was accomplished by defining theaverage relative CNT number density, ζ, as
ARTIC
LE
PATHAK ET AL. VOL. 7 ’ NO. 10 ’ 8593–8604 ’ 2013
www.acsnano.org
8602
ζ ¼ x � μ
σ(2)
whereμ represents themean number density of tubes in a set ofimages froma single pillar, andσ is the standard deviation of themean number density of tubes in the same set. In eq 2, x is thepixel count transformed into a number density of tubes, that is,x = (hw)n/2, where n is the pixel count in the central 10% of theimage, and h andw are the number of rows and columns in thatregion, respectively. The factor of 2 is to account for both edgesof each tube. A minimum of three pillars was used to generatethe data of ζ versus vertical coordinate for a particular categoryof pillar morphology.
A number of validation steps were taken to ensure both theefficacy and the repeatability of this approach. The efficacy of ζserving as a reliable figure-of-merit was crosschecked by amanual tube-counting procedure, described in detail in FigureS3. We also ensured the repeatability of the image analysisprocedures by (a) imaging the same pillar over two differentSEM sessions and comparing the results (Figure S4) and (b)imaging the pillars across their width (to check for lateralvariations in ζ, Figure S5). These results are detailed in the SI.
Several important limitations associated with this methodexist. First, by counting edges within the image, the algorithmcannot differentiate between the individual CNTs and CNTbundles. The VACNT forest is clearly a hierarchical morphologywhose mechanical properties depend not only on the CNTdiameter, density, and alignment, but also on the hierarchicalbundling which cannot be quantified in 3D by any knownmethod. A difference in tortuosity of the CNTs is visuallyapparent when comparing representative SEM images fromthe two VACNT sample sets (see Figure S6), which is notaccounted for in eq 2. Variations in tortuosity have beenreported to significantly affect the mechanical behavior ofVACNT films.68 We emphasize that the relative density profilesdescribed in this work are indicative of the “feature” densitywithin each individual pillar, and that comparisons of theabsolute density between different pillars is not possible dueto the hierarchical structure and variations in alignment be-tween the pillars.
Model Formulation. The mechanical behavior of the VACNTpillars with circular cross sections under compressive loadingwas modeled using a dynamic, axisymmetric finite elementcode with loading conditions aimed at modeling quasi-staticresponse, as described in ref 43. A compressible, isotropicelastic-viscoplastic constitutive relationship with plastic non-normality and a piecewise, linear hardening�softening�hardening type of flow strength function was used to modelthematerial. This formulation has been reported to qualitativelycapture some of the characteristics of the compression ofVACNT microcylinders, such as the sequential formation oflocalized through-thickness folds oriented orthogonally to thecompression direction and the oscillatory plateau region withinthe stress�strain curve, where each undulation corresponds tothe formation and propagation of individual instabilities.42 Theglobal slope of the stress plateau region, θ, was reported tocorrelate with themechanical yield-like property gradient alongthe sample height. With plastic non-normality the flow rule ischaracterized by two tensors p and q, defined as p = τ� βptr(τ)Iand q = τ � Rptr(τ)I, with τ as the Kirchhoff stress and I as theidentity tensor. In the calculations here, Rp = 0.2, βp = 0.28, E/σ0 =100 (ratio of Young'smodulus to reference strength,m= 0.02 (ratehardening exponent), H/R = 3 (height to radius of pillar), ε0 = 5000(the reference strain rate). The effective flow strength function g isspecified as a function of the effective plastic strain εp as
where σ0 is the reference flow strength, h1 = 5.0, h2 =�1.5, h3 =1.5, ε1 = 0.005, and ε2 = 0.1. Further details of the constitutiverelation are given in Needleman et al.42
In the analyses in ref 42, the mechanical property gradientwas represented by a strength multiplier, SM, which is a
multiplier giving the spatial variations of E (Young's modulus)and σ0, where SM = E/Ebottom and similarly for σ0 (see Figure S7).In this work we further explored the effects of such a propertygradient, focusing on four cases: case 1, SM is constant through-out the pillar height; case 2, SM increases linearly with pillarheight; case 3, SM decreases linearly with pillar height; and case4, SM has a step-increase at the midpoint of the pillar height,that is, at z/H = 0.5, where z is the coordinate along the pillarheight. The range ofΔSM (=|SMtop� SMbottom| (note SMbottom isnecessarily equal to 1) as defined in Figure S7) was restricted tobe between 0 to 40% because sequential buckling was found todisappear outside of this range.42
The computational results were analyzed in terms of (1) theoverall pillar stress�strain response, (2) the displacement con-tours of the outer edge of the pillar, and (3) the strain ratedistributions, all as functions of the overall pillar strain. Asdescribed in ref 36, the true stress σt is calculated as σt =(P)/(π(R þ ur(R,H,t))
2), where P is the normal compressive forcecomputed from the quasi-static principle of virtual work, and uris the radial displacement of the pillar at r= R, z=H, and at time t.The true stress is normalized by the reference yield stress σ0. Thetrue strain was computed by εt =�ln(1þ εn), with εn represent-ing the nominal strain (εn = ΔH/H), where ΔH is the topdisplacement, normalized by the initial height.
The computational results are compared with the experi-mental results in terms of (1) the transition strains (εA and εB,Figure 3d) and (2) the overall pillar hardening slope (θ) of theplateau region in the normalized stress�strain response. Cases1, 2, and 3 required a single value of θ to define the entireplateau region, whereas in case 4 (the SM step function), theplateau region had to be subdivided into two separate regionswith the individual slopes of θ1 and θ2 (Figure 3d). The evolutionof the outer surface profiles was characterized in terms of theaverage amplitude (a) and wavelength (λ, Figure 4a, right panelinset) of the resulting undulations at εt = 40% for each studiedcase. The strain rate distributions (Figure 4b), which are helpfulfor visualizing the sequential buckling process, are shown at thestrains of εt = 5% (initiation of the buckle-like fold), εt = 10 and15% (propagation), and εt = 20% (densification) for the flat SMfunction (case 1).
Conflict of Interest: The authors declare no competingfinancial interest.
Acknowledgment. The authors acknowledge financial sup-port from the Institute for Collaborative Biotechnologies (ICB)through Grant W911NF-09-0001 from the U.S. Army ResearchOffice. The content of the information does not necessarilyreflect the position or the policy of the Government, and noofficial endorsement should be inferred. S.P. gratefully acknowl-edges support from the W.M. Keck Institute for Space StudiesPostdoctoral Fellowship program for this work.
Supporting Information Available: Video S1 illustrates thein situ deformation of a VACNT micropillar located on thesubstrate-edge when compressed at a 100 nm/s displacementrate. The online video file, synchronized with its engineeringstress�strain response, is shown at 35 times its original speed.Figures S1�9 also provided. This material is available free ofcharge via the Internet at http://pubs.acs.org.
REFERENCES AND NOTES1. Hall, E. O. The Deformation and Ageing of Mild Steel III.
Discussion of Results. Proc. Phys. Soc., London, Sect. B 1951,64, 747–753.
2. Petch, N. J. Cleavage Strength of Polycrystals. J. Iron SteelInst. 1953, 174, 25–28.
3. Gibson, L. J.; Ashby, M. F. Cellular Solids: Structure andProperties; Cambridge University Press: Cambridge, U.K.,1999.
4. Cao, A. Y.; Dickrell, P. L.; Sawyer, W. G.; Ghasemi-Nejhad,M. N.; Ajayan, P. M. Super-Compressible Foamlike CarbonNanotube Films. Science 2005, 310, 1307–1310.
5. Misra, A.; Greer, J. R.; Daraio, C. Strain Rate Effects in theMechanical Response of Polymer-Anchored CarbonNanotube Foams. Adv. Mater. 2008, 20, 1–5.
ARTIC
LE
PATHAK ET AL. VOL. 7 ’ NO. 10 ’ 8593–8604 ’ 2013
www.acsnano.org
8603
6. Cho, J.; Richards, C.; Bahr, D.; Jiao, J.; Richards, R. Evaluationof Contacts for a MEMS Thermal Switch. J. Micromech.Microeng. 2008, 18.
7. Cola, B. A.; Xu, J.; Fisher, T. S. Contact Mechanics andThermal Conductance of Carbon Nanotube Array Inter-faces. Int. J. Heat Mass Transfer 2009, 52, 3490–3503.
8. Xu, M.; Futaba, D. N.; Yamada, T.; Yumura, M.; Hata, K.Carbon Nanotubes with Temperature-Invariant Viscoelas-ticity from 196� to 1000 �C. Science 2010, 330, 1364–1368.
9. Suhr, J.; Victor, P.; Sreekala, L. C. S.; Zhang, X.; Nalamasu, O.;Ajayan, P. M. Fatigue Resistance of Aligned Carbon Nano-tube Arrays under Cyclic Compression. Nat. Nanotechnol.2007, 2, 417–421.
10. Yaglioglu, O.; Cao, A.; Hart, A. J.; Martens, R.; Slocum, A. H.Wide Range Control of Microstructure and MechanicalProperties of Carbon Nanotube Forests: A ComparisonBetween Fixed and Floating Catalyst CVD Techniques.Adv. Funct. Mater. 2012, 22, 5028–5037.
11. Kumar, M.; Ando, Y. Chemical Vapor Deposition of CarbonNanotubes: A Review on Growth Mechanism and MassProduction. J. Nanosci. Nanotechnol. 2010, 10, 3739–3758.
12. Presser, V.; Heon,M.; Gogotsi, Y. Carbide-Derived Carbons -From Porous Networks to Nanotubes and Graphene. Adv.Funct. Mater. 2011, 21, 810–833.
13. Pathak, S.; Cambaz, Z. G.; Kalidindi, S. R.; Swadener, J. G.;Gogotsi, Y. Viscoelasticity and High Buckling Stress ofDense Carbon Nanotube Brushes. Carbon 2009, 47,1969–1976.
14. Hutchens, S. B.; Hall, L. J.; Greer, J. R. In Situ MechanicalTesting Reveals Periodic Buckle Nucleation and Propaga-tion in Carbon Nanotube Bundles. Adv. Funct. Mater. 2010,20, 2338–2346.
15. Qi, H. J.; Teo, K. B. K.; Lau, K. K. S.; Boyce, M. C.; Milne, W. I.;Robertson, J.; Gleason, K. K. Determination of MechanicalProperties of Carbon Nanotubes and Vertically AlignedCarbonNanotube Forests UsingNanoindentation. J. Mech.Phys. Solids 2003, 51, 2213–2237.
16. Bradford, P. D.; Wang, X.; Zhao, H.; Zhu, Y. T. Tuning theCompressive Mechanical Properties of Carbon NanotubeFoam. Carbon 2011, 49, 2834–2841.
18. Mesarovic, S. D.; McCarter, C. M.; Bahr, D. F.; Radhakrishnan,H.; Richards, R. F.; Richards, C. D.; McClain, D.; Jiao, J.Mechanical Behavior of a Carbon Nanotube Turf. Scr.Mater. 2007, 56, 157–160.
19. Qiu, A.; Bahr, D. F.; Zbib, A. A.; Bellou, A.; Mesarovic, S. D.;McClain, D.; Hudson, W.; Jiao, J.; Kiener, D.; Cordill, M. J.Local and Non-Local Behavior and Coordinated Bucklingof CNT Turfs. Carbon 2011, 49, 1430–1438.
20. Zhang, Q.; Lu, Y. C.; Du, F.; Dai, L.; Baur, J.; Foster, D. C.Viscoelastic Creep of Vertically Aligned Carbon Nano-tubes. J. Phys. D: Appl. Phys. 2010, 43, 315401–1�7.
21. Deck, C. P.; Flowers, J.; McKee, G. S. B.; Vecchio, K. Mechan-ical Behavior of Ultralong Multiwalled Carbon NanotubeMats. J. Appl. Phys. 2007, 101, 23512–1�9.
22. Xu, M.; Futaba, D. N.; Yumura, M.; Hata, K. Carbon Nano-tubes with Temperature-Invariant Creep and Creep-Re-covery from �190 to 970 �C. Adv. Mater. 2011, 23, 3686–3691.
23. Pathak, S.; Lim, E. J.; Pour Shahid Saeed Abadi, P.; Graham,S.; Cola, B. A.; Greer, J. R. Higher Recovery and BetterEnergy Dissipation at Faster Strain Rates in Carbon Nano-tube Bundles: An In Situ Study. ACS Nano 2012, 6, 2189–2197.
24. Zbib, A. A.; Mesarovic, S. D.; Lilleodden, E. T.; McClain, D.;Jiao, J.; Bahr, D. F. The Coordinated Buckling of CarbonNanotube Turfs under Uniform Compression. Nanotech-nology 2008, 19, 175704–1-7.
25. Cao, C.; Reiner, A.; Chung, C.; Chang, S.-H.; Kao, I.; Kukta,R. V.; Korach, C. S. Buckling Initiation and DisplacementDependence in Compression of Vertically Aligned CarbonNanotube Arrays. Carbon 2011, 49, 3190–3199.
26. Yaglioglu, O. Carbon Nanotube Based ElectromechanicalProbes. Ph.D. Thesis, Massachusetts Institute of Technol-ogy, Cambridge, MA, 2007.
27. Raney, J. R.; Misra, A.; Daraio, C. Tailoring the Microstruc-ture and Mechanical Properties of Arrays of Aligned Multi-wall Carbon Nanotubes by Utilizing Different HydrogenConcentrations during Synthesis. Carbon 2011, 49, 3631–3638.
29. Pathak, S.; Mohan, N.; Pour Shahid Saeed Abadi, P.; Graham,S.; Cola, B. A.; Greer, J. R. Compressive Response ofVertically Aligned Carbon Nanotube Films Gleaned fromIn Situ Flat Punch Indentations. J. Mater. Res. 2013,10.1557/jmr.2012.366.
30. McCarter, C. M.; Richards, R. F.; Mesarovic, S. D.; Richards,C. D.; Bahr, D. F.; McClain, D.; Jiao, J. Mechanical Compli-ance of Photolithographically Defined Vertically AlignedCarbon Nanotube Turf. J. Mater. Sci. 2006, 41, 7872–7878.
31. Maschmann, M. R.; Ehlert, G. J.; Park, S. J.; Mollenhauer, D.;Maruyama, B.; Hart, A. J.; Baur, J. W. Visualizing StrainEvolution and Coordinated Buckling within CNT Arraysby In Situ Digital Image Correlation. Adv. Funct. Mater.2012, 22, 4686–4695.
32. Bedewy, M.; Meshot, E. R.; Guo, H.; Verploegen, E. A.; Lu, W.;Hart, A. J. CollectiveMechanism for The Evolution and Self-Termination of Vertically Aligned Carbon NanotubeGrowth. J. Phys. Chem. C 2009, 113, 20576–20582.
33. Pour Shahid Saeed Abadi, P.; Hutchens, S.; Taphouse, J. H.;Greer, J. R.; Cola, B. A.; Graham, S. The Effect of Morphologyon the Micro-Compression Response of Carbon NanotubeForests. Nanoscale 2012, 4, 3373–3380.
34. Chen, B.; Gao,M.; Zuo, J. M.; Qu, S.; Liu, B.; Huang, Y. BindingEnergy of Parallel Carbon Nanotubes. Appl. Phys. Lett.2003, 83, 3570–3571.
35. Liew, K. M.; Wong, C. H.; Tan, M. J. Buckling Properties ofCarbonNanotubeBundles.Appl. Phys. Lett.2005, 87, 041901.
36. Zhou,W.; Huang, Y.; Liu, B.; Hwang, K. C.; Zuo, J. M.; Buehler,M. J.; Gao, H. Self-Folding of Single- and Multiwall CarbonNanotubes. Appl. Phys. Lett. 2007, 90, 073107.
37. Cranford, S.; Yao, H.; Ortiz, C.; Buehler, M. J. A Single Degreeof Freedom “Lollipop”Model for Carbon Nanotube BundleFormation. J. Mech. Phys. Solids 2010, 58, 409–427.
38. Cranford, S.; Buehler, M. J. Mechanomutable CarbonNano-tube Arrays. Int. J. Mater. Struct. Integr. 2009, 3, 161–178.
40. Buehler, M. J. Mesoscale Modeling of Mechanics of CarbonNanotubes: Self-Assembly, Self-Folding, and Fracture.J. Mater. Res. 2006, 21, 2855–2869.
41. Hutchens, S. B.; Needleman, A.; Greer, J. R. Erratum:Analysis of Uniaxial Compression of Vertically AlignedCarbon Nanotubes (Journal of the Mechanics and Physicsof Solids 2011, 59, 2227�2237). J. Mech. Phys. Solids 2012,60, 1753–1756.
42. Needleman, A.; Hutchens, S. B.; Mohan, N.; Greer, J. R.Deformation of Plastically Compressible Hardening-Softening-Hardening Solids. Acta Mech. Sin. 2012, 28, 1115–1124.
43. Hutchens, S. B.; Needleman, A.; Greer, J. R. Analysis ofUniaxial Compression of Vertically Aligned Carbon Nano-tubes. J. Mech. Phys. Solids 2011, 59, 2227–2237.
44. Bedewy, M.; Meshot, E. R.; Reinker, M. J.; Hart, A. J. Popula-tion Growth Dynamics of Carbon Nanotubes. ACS Nano2011, 5, 8974–8989.
45. Wang, B. N.; Bennett, R. D.; Verploegen, E.; Hart, A. J.;Cohen, R. E. Characterizing the Morphologies of Mechani-cally Manipulated Multiwall Carbon Nanotube Films bySmall-Angle X-ray Scattering. J. Phys. Chem. C 2007, 111,17933–17940.
46. Bedewy, M.; Meshot, E. R.; Hart, A. J. Diameter-DependentKinetics of Activation and Deactivation in Carbon Nano-tube Population Growth. Carbon 2012, 50, 5106–5116.
ARTIC
LE
PATHAK ET AL. VOL. 7 ’ NO. 10 ’ 8593–8604 ’ 2013
www.acsnano.org
8604
47. Meshot, E.; Bedewy, M.; Lyons, K.; Woll, A.; Juggernauth, K.;Tawfick, S.; Hart, A. Measuring the Lengthening Kinetics ofAligned Nanostructures by Spatiotemporal Correlation ofHeight and Orientation. Nanoscale 2010, 2, 896–900.
48. Park, S. J.; Schmidt, A. J.; Bedewy, M.; John Hart, A.Measurement of Carbon Nanotube Microstructure Rela-tive Density by Optical Attenuation and Observation ofSize-Dependent Variations. Phys. Chem. Chem. Phys. 2013,15, 11511–11519.
49. Canny, J. A Computational Approach to Edge Detection.IEEE Trans. PatternAnal.Mach. Intell.1986, PAMI-8, 679�698.
50. Deshpande, V. S.; Fleck, N. A. Isotropic Constitutive Modelsfor Metallic Foams. J. Mech. Phys. Solids 2000, 48, 1253–1283.
51. Brunauer, S.; Emmett, P. H.; Teller, E. Adsorption of Gases inMultimolecular Layers. J. Am. Chem. Soc. 1938, 60, 309–319.
52. Bzachnio, M.; Staszczuk, P.; Grodzicka, G. Adsorption andPorosity Properties of Pure and Modified Carbon Nano-tube Surfaces. J. Therm. Anal. Calorim. 2008, 94, 641–648.
53. Jagtoyen, M.; Pardue, J.; Rantell, T.; Grulke, E.; Derbyshire, F.In Porosity of Carbon Nanotubes, Pac. Basin Conf., Adsorpt.Sci. Technol.; Do, D. D., Ed.; World Scientific Publishing Co.Pte. Ltd.: Singapore, Singapore, 2000; pp 289�293.
54. Shaffer, M. S. P.; Fan, X.; Windle, A. H. Dispersion andPacking of Carbon Nanotubes. Carbon 1998, 36, 1603–1612.
55. Ghasemi-Mobarakeh, L.; Semnani, D.; Morshed, M. A NovelMethod for Porosity Measurement of Various SurfaceLayers of Nanofibers Mat using Image Analysis for TissueEngineering Applications. J. Appl. Polym. Sci. 2007, 106,2536–2542.
56. Bedewy, M.; Hart, A. J. Mechanical Coupling Limits theDensity and Quality of Self-Organized Carbon NanotubeGrowth. Nanoscale 2013, 5, 2928–2937.
57. Astrom, J. A.; Krasheninnikov, A. V.; Nordlund, K. CarbonNanotube Mats and Fibers with Irradiation-Improved Me-chanical Characteristics: A Theoretical Model. Phys. Rev.Lett. 2004, 93, 215503–1-215503-4.
58. Cox, H. L. Elasticity and Strength of Paper and OtherFibrous Materials. Br. J. Appl. Phys. 1952, 3, 72–79.
59. Berhan, L.; Yi, Y. B.; Sastry, A. M. Effect of NanoropeWaviness on The Effective Moduli of Nanotube Sheets.J. Appl. Phys. 2004, 95, 5027–5034.
60. Malik, H.; Stephenson, K. J.; Bahr, D. F.; Field, D. P. Quanti-tative Characterization of Carbon Nanotube Turf Topologyby SEM Analysis. J. Mater. Sci. 2011, 46, 3119–3126.
61. Gao, Y.; Kodama, T.; Won, Y.; Dogbe, S.; Pan, L.; Goodson,K. E. Impact of Nanotube Density and Alignment on theElastic Modulus Near the Top and Base Surfaces of AlignedMulti-Walled Carbon Nanotube Films. Carbon 2012, 50,3789–3798.
62. Al-Khedher, M. A.; Pezeshki, C.; McHale, J. L.; Knorr, F. J.Quality Classification via Raman Identification and SEMAnalysis of Carbon Nanotube Bundles Using ArtificialNeural Networks. Nanotechnology 2007, 18, 355703.
63. Kim, J.-Y.; Greer, J. R. Tensile and Compressive Behavior ofGold and Molybdenum Single Crystals at the Nano-Scale.Acta Mater. 2009, 57, 5245–5253.
64. Tu, J. P.; Jiang, C. X.; Guo, S. Y.; Fu, M. F. Micro-FrictionCharacteristics of Aligned Carbon Nanotube Film on anAnodic Aluminum Oxide Template. Mater. Lett. 2004, 58,1646–1649.
65. Tu, J. P.; Zhu, L. P.; Hou, K.; Guo, S. Y. Synthesis and FrictionalProperties ofArray FilmofAmorphousCarbonNanofibersonAnodic Aluminum Oxide. Carbon 2003, 41, 1257–1263.
66. Bhushan, B.; Xing, L.; Jungen, A.; Hierold, C. Adhesion andFriction of a Multiwalled Carbon Nanotube Sliding againstSingle-Walled Carbon Nanotube. Phys. Rev. B: Condens.Matter Mater. Phys. 2008, 77, 165428–1.
67. Canny, J. F. Finding Edges and Lines in Images; Massachu-setts Institute of Technology: Cambridge, MA, 1983.
68. Pathak, S.; Raney, J. R.; Daraio, C. Effect of Morphology onthe Strain Recovery of Vertically Aligned CarbonNanotubeArrays: An In Situ Study. Carbon 2013, 13, 303–316.