1 RELATIVE DENSITY RELATIVE DENSITY AND ITS USE IN THINNING AND ITS USE IN THINNING Ralph D. Nyland Department of Forest and Natural Resources Management SUNY College of Environmental Science and Forestry Syracuse, NY 13210 Nyland - 2010 All rights reserved Use of all or parts of this permission prohibited without express consent of Ralph D. Nyland Background reading: Chapter 17, in Nyland, R.D. 2002. Silviculture: Concepts and Applications. Waveland Press. Long Grove, IL. 2ed. Sources cited: Dale, M.E. 1968. Growth response from thinning young even-aged white oak stands. US For. Serv. Res. Rpt. NE-112 Daniel, T.W. J.A. Helms, and F.S. Baker. 1979. Principles of Silviculture. McGraw—Hill Book. Co. NY. 2ed. Mar:Moller, C. 1954. The influence of thinning on volume increment. 1. Results of investigations. Pp. 5-32, in Thinning Problems and Practices in Denmark. SUNY Coll. For. at Syracuse, World For. Ser. Bull. No. 1, Tech. Publ. No. 76. Marquis. D.A. 1986. Thinning Allegheny hardwood pole and small sawtimber stands. Pp. 68-84, in Guidelines for Managing Immature Appalachian Hardwood Stands. H.C. Smith and M. Eyes (Ed.). W. Va. Univ./, Morgantown. Soc. Am. For. Publ. 86-02. Marquis, D.A., R.L. Ernst, and S.L. Stout. 1984. Prescribing silvicultural treatments in hardwood sands of the Alleghanies. US For. Serv. Gen. Tech. Rpt. NE-96. Nyland,. R.D. 2002. Silviculture: Concepts and Applications. McGraw-Hill Book Co. NY. 2ed. Roach, B.A. and S.F. Gingrich. 1968. Even-aged silviculture for upland central hardwoods. US Dept. Agric., Agric Handbk. No.355. Roach, B.A. 1977. A stocking guide for Allegheny hardwoods and its use in controlling intermediate cuttings. US For. Serv. Res.Rpt. NE-373.
Transcript
1
RELATIVE DENSITYRELATIVE DENSITYAND ITS USE IN THINNINGAND ITS USE IN THINNING
Ralph D. NylandDepartment of Forest and Natural Resources Management
SUNY College of Environmental Scienceand Forestry
Syracuse, NY 13210
Nyland - 2010
All rights reservedUse of all or parts of this permission prohibited
without express consent of Ralph D. Nyland
Background reading:
Chapter 17, in Nyland, R.D. 2002. Silviculture: Concepts and Applications.Waveland Press. Long Grove, IL. 2ed.
Sources cited:
Dale, M.E. 1968. Growth response from thinning young even-aged white oak stands. US For. Serv. Res. Rpt. NE-112
Daniel, T.W. J.A. Helms, and F.S. Baker. 1979. Principles of Silviculture. McGraw—Hill Book. Co. NY. 2ed.
Mar:Moller, C. 1954. The influence of thinning on volume increment. 1. Results of investigations. Pp. 5-32, in Thinning Problems and Practices in Denmark. SUNY Coll. For. at Syracuse, World For. Ser. Bull. No. 1, Tech. Publ. No. 76.
Marquis. D.A. 1986. Thinning Allegheny hardwood pole and small sawtimber stands. Pp. 68-84, in Guidelines for Managing Immature Appalachian Hardwood Stands. H.C. Smith and M. Eyes (Ed.). W. Va. Univ./, Morgantown. Soc. Am. For. Publ. 86-02.
Marquis, D.A., R.L. Ernst, and S.L. Stout. 1984. Prescribing silvicultural treatments in hardwood sands of the Alleghanies.US For. Serv. Gen. Tech. Rpt. NE-96.
Nyland,. R.D. 2002. Silviculture: Concepts and Applications. McGraw-Hill Book Co. NY. 2ed.
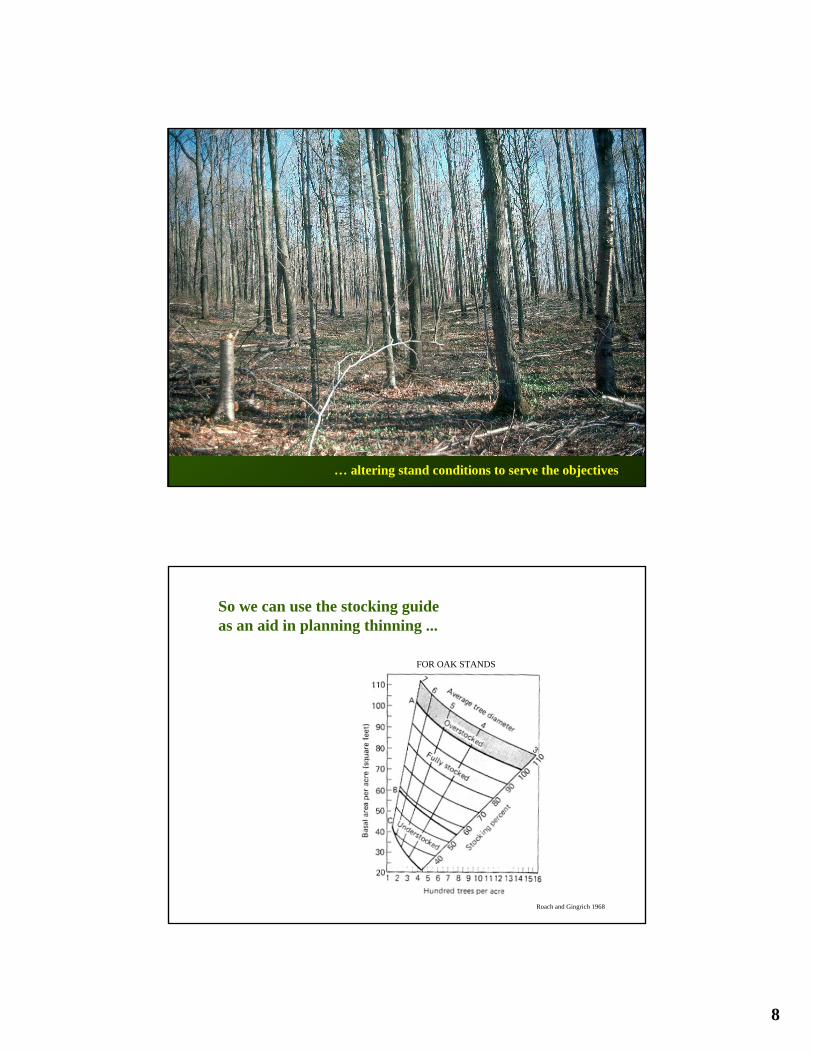
Roach, B.A. and S.F. Gingrich. 1968. Even-aged silviculture for upland central hardwoods. US Dept. Agric., Agric Handbk. No.355.
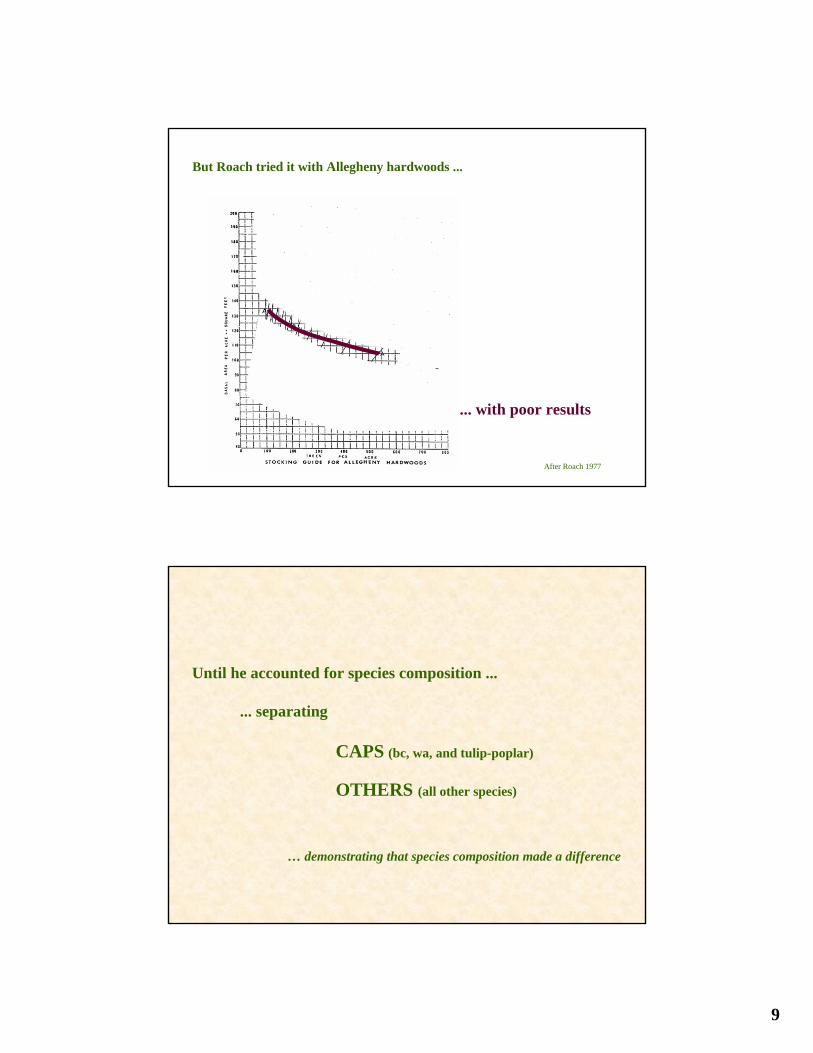
Roach, B.A. 1977. A stocking guide for Allegheny hardwoods and its use in controlling intermediate cuttings. US For. Serv. Res.Rpt. NE-373.
2
Reukema, D.L., and D. Bruce. 1977. Effects of thinning on yield of Douglas-fir: Concepts and some estimates obtained by simulation. US For. Serv. Gen. Tech. Rpt. PNW-58.
Steneker, G.A., and J.M. Jarvis. 1966. Thinning in trembling aspen stands in Manitoba and Saskatchewan. Can. Dept. For. Publ. No. 1140.
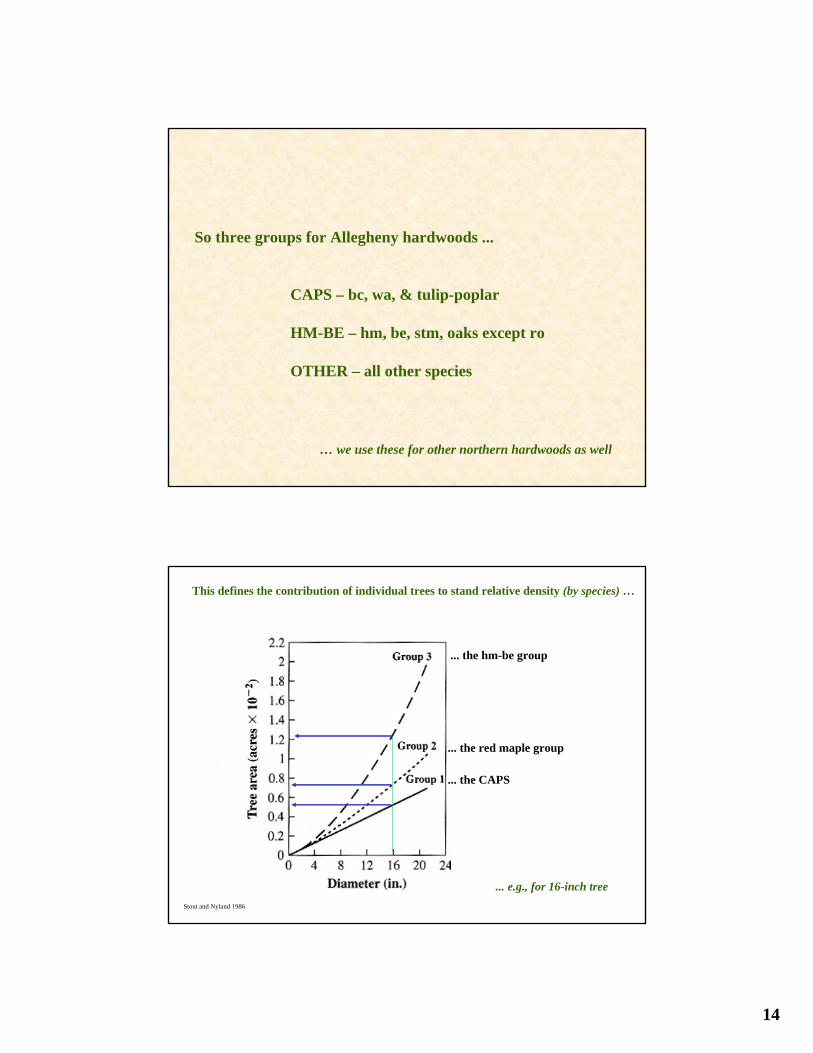
Stout, S.L. and R.D. Nyland. 1986. Role of species composition in relative density measurement in Allegheny hardwoods. Can. J. For. Res. 16:574-579.
Stout, S.L. 1990. Progress report for relative stand density in northern hardwoods throughout the Northeast. USFor. Serv. Northeast. For. Expt. Stn. 4110-FS-NE-1152-119.
Stout, S.L. and R.D. Nyland. 1986. Role of species composition in relative density measurement in Allegheny hardwoods. Can. J. For. Res. 16:574-579.
WHY THIN …- Improve sawtimber production
... get larger trees in less time
... increase board-foot yields
... enhance stand-wide quality and value
... influence species composition
- Promote stand development... enhance habitat for plants and animals... alter visual qualities... facilitate other non-market uses... move toward “old-growth” conditions
- Influence hydrologic characteristics (water quality and yields)
- Promote tree vigor and stand health (growth and resiliency)
- Stimulate seed production (like preparatory cutting)