ORIGINAL ARTICLE Efficiency improvement opportunities for ceiling fans Nihar Shah & Nakul Sathaye & Amol Phadke & Virginie Letschert Received: 26 April 2013 /Accepted: 11 June 2014 /Published online: 1 July 2014 # The Author(s) 2014. This article is published with open access at Springerlink.com Abstract Ceiling fans contribute significantly to resi- dential electricity consumption, especially in developing countries with warm climates. This paper provides an analysis of costs and benefits of several options to improve the efficiency of ceiling fans to assess the global potential for electricity savings and green house gas (GHG) emission reductions. Ceiling fan efficiency can be cost-effectively improved by at least 50 % using commercially available technology. If these efficiency improvements are implemented in all ceiling fans sold by 2020, 70 TWh/year could be saved and 25 million metric tons of carbon dioxide equivalent (CO 2 -e) emis- sions per year could be avoided, globally. We assess how policies and programs such as standards, labels, and financial incentives can be used to accelerate the adoption of efficient ceiling fans in order to realize potential savings. Keywords Ceiling fan . Energy efficiency . Standards . Labeling . Incentives . Market transformation Introduction This paper presents the results of an analysis of ceiling fan efficiency commissioned by the US Department of Energy and performed by the International Energy Studies group at Lawrence Berkeley National Laboratory in support of the Super-efficient Equipment and Appliance Deployment (SEAD) initiative. 1 SEAD aims to transform the global market by increasing the penetration of highly efficient equipment and appliances. The objective of this analysis is to provide the background technical informa- tion necessary to improve ceiling fan efficiency and support the voluntary activities of SEAD-participating countries. Ceiling fans contribute significantly to residential electricity consumption in warm climates and especially in developing countries. For example, in India, ceiling fans alone accounted for approximately 6 % of residen- tial energy use in 2000. This figure is expected to grow to 9 % in 2020 (De la Rue du Can et al. 2009), an increase that is equivalent to the energy output of 15 mid-sized power plants. 2 In addition, ceiling fan Energy Efficiency (2015) 8:37–50 DOI 10.1007/s12053-014-9274-6 1 An initiative of the Clean Energy Ministerial (CEM) and a task within the International Partnership for Energy Efficiency Coop- eration (IPEEC), SEAD seeks to engage governments and the private sector to transform the global market for energy-efficient equipment and appliances. As of October 2012, the governments participating in SEAD are Australia, Brazil, Canada, the European Commission, France, Germany, India, Japan, Korea, Mexico, Russia, South Africa, Sweden, the United Arab Emirates, the UK, and the USA. More information on SEAD is available on its website at http://www.superefficient.org/. 2 For this estimate, we assume an increase in BAU power con- sumption of ~20 TWh. We also conservatively estimate that one- tenth of ceiling fans are used during the peak hour and that a mid- sized power plant has a 500-MW capacity and runs at 70 % efficiency (as described in Koomey et al. 2010). However, cur- rently installed power plants in India have a much lower average efficiency (du Can et al. 2009). N. Shah (*) : N. Sathaye : A. Phadke : V. Letschert Energy Analysis Department, Environmental Energy Technologies Division, Lawrence Berkeley National Laboratory, 1 Cyclotron Rd., Berkeley, CA 94720, USA e-mail: [email protected]
Transcript
ORIGINAL ARTICLE
Efficiency improvement opportunities for ceiling fans
Nihar Shah & Nakul Sathaye & Amol Phadke &
Virginie Letschert
Received: 26 April 2013 /Accepted: 11 June 2014 /Published online: 1 July 2014# The Author(s) 2014. This article is published with open access at Springerlink.com
Abstract Ceiling fans contribute significantly to resi-dential electricity consumption, especially in developingcountries with warm climates. This paper provides ananalysis of costs and benefits of several options toimprove the efficiency of ceiling fans to assess theglobal potential for electricity savings and green housegas (GHG) emission reductions. Ceiling fan efficiencycan be cost-effectively improved by at least 50 % usingcommercially available technology. If these efficiencyimprovements are implemented in all ceiling fans soldby 2020, 70 TWh/year could be saved and 25 millionmetric tons of carbon dioxide equivalent (CO2-e) emis-sions per year could be avoided, globally. We assesshow policies and programs such as standards, labels,and financial incentives can be used to accelerate theadoption of efficient ceiling fans in order to realizepotential savings.
Keywords Ceiling fan . Energy efficiency. Standards .
Labeling . Incentives . Market transformation
Introduction
This paper presents the results of an analysis of ceilingfan efficiency commissioned by the US Department ofEnergy and performed by the International Energy
Studies group at Lawrence Berkeley National Laboratoryin support of the Super-efficient Equipment and ApplianceDeployment (SEAD) initiative.1 SEAD aims to transformthe global market by increasing the penetration of highlyefficient equipment and appliances. The objective of thisanalysis is to provide the background technical informa-tion necessary to improve ceiling fan efficiency andsupport the voluntary activities of SEAD-participatingcountries.
Ceiling fans contribute significantly to residentialelectricity consumption in warm climates and especiallyin developing countries. For example, in India, ceilingfans alone accounted for approximately 6 % of residen-tial energy use in 2000. This figure is expected to growto 9 % in 2020 (De la Rue du Can et al. 2009), anincrease that is equivalent to the energy output of 15mid-sized power plants.2 In addition, ceiling fan
Energy Efficiency (2015) 8:37–50DOI 10.1007/s12053-014-9274-6
1 An initiative of the Clean Energy Ministerial (CEM) and a taskwithin the International Partnership for Energy Efficiency Coop-eration (IPEEC), SEAD seeks to engage governments and theprivate sector to transform the global market for energy-efficientequipment and appliances. As of October 2012, the governmentsparticipating in SEAD are Australia, Brazil, Canada, the EuropeanCommission, France, Germany, India, Japan, Korea, Mexico,Russia, South Africa, Sweden, the United Arab Emirates, theUK, and the USA. More information on SEAD is available onits website at http://www.superefficient.org/.2 For this estimate, we assume an increase in BAU power con-sumption of ~20 TWh. We also conservatively estimate that one-tenth of ceiling fans are used during the peak hour and that a mid-sized power plant has a 500-MW capacity and runs at 70 %efficiency (as described in Koomey et al. 2010). However, cur-rently installed power plants in India have a much loweraverage efficiency (du Can et al. 2009).
N. Shah (*) :N. Sathaye :A. Phadke :V. LetschertEnergy Analysis Department, Environmental EnergyTechnologies Division, Lawrence Berkeley NationalLaboratory, 1 Cyclotron Rd., Berkeley, CA 94720, USAe-mail: [email protected]
ownership rates have been shown to significantly in-crease in low-income Indian households as incomelevels increase (De la Rue du Can et al. 2009). Althoughceiling fan standards and labeling programs are speci-fied for every major economy in the world, these pro-grams only discourage the use of highly inefficient fans(Waide and Harrington 2011). In developed countriesand countries with milder climates, a smaller frac-tion of electricity consumption is attributable toceiling fans. Nevertheless, ceiling fans accountfor as much as 5 % of residential electricity usein the USA, although this varies greatly by region(Calwell and Horowitz 2001). Even in those areaswhere they do not constitute a significant fractionof electricity demand, ceiling fans can reduce en-ergy consumption by reducing the use of othercooling devices.
This study assesses the potential for global ceil-ing fan energy-efficiency improvement. We ana-lyze the cost-effectiveness of ceiling fan efficiencyimprovements while estimating the global potentialfor both energy consumption and CO2-e emissionreductions. We utilize the Bottom-Up EnergyAnalysis System (BUENAS) to make these esti-mates (McNeil et al. 2012). First, we present atechnological economic analysis of fan efficiencyimprovement options followed by global energysaving estimates. Finally, we discuss implicationsfor the design of market transformation programsand conclude the paper.
Technological-economic assessment of efficiencyimprovement options in ceiling fans
Ceiling fan energy performance is typically mea-sured in units of meters cubed per minute per watt(m3/min/W). This represents the ratio of air deliv-ery to power input. The term “efficiency” is com-monly used to represent the ratio of mechanical-output to electrical-input power. In this paper, wefollow the example of earlier studies (Chakraborty2004).The term “efficacy” refers to fan perfor-mance, while the term “efficiency” is used as ageneral performance descr ip tor and whendiscussing the performance of motors.
Standards and labeling programs for ceiling fans aretypically designed to ensure a specified level of efficacy.Specifications include subcategories that are classified
by characteristics such as fan size, operating speed, orairflow. Fans have higher efficacy at lower speedsmean-ing standards and labeling programs categorize fans byoperating speed (Chakraborty 2004). Fan efficacy canbe increased through increasing blade length becausepower consumption decreases as blade length increasesassuming constant airflow. Accordingly, some programscategorize fan standards and labels by fan size or sweep.Table 1 summarizes fan standards and labeling frame-works in various countries. In the USA, the ENERGYSTAR program specifies minimum ceiling fan efficacyrankings for three different airflow levels (ENERGY2012b). Similarly, the Indian standard IS-374 definesminimum efficacy levels for five different ceiling fansize categories (BIS 2007). In addition to this, the IndianBureau of Energy Efficiency (BEE) maintains a starrating system based on fan efficacy (Singh et al. 2010).However, the Indian star rating system is applicable toonly one size of fan (1,200 mm) and does not vary byfan speed.
Efficiency improvement options for ceiling fansystems
The ceiling fan system consists of multiple componentsthat together determine the fan’s overall energy con-sumption. We focus on engineering improvements thatare easily quantifiable such as changes to fan motors andblades that improve ceiling fan efficiency.
Fan motors
Historically, ceiling fans have utilized AC inductionmotors because these motors are durable, easy to con-struct, and relatively inexpensive to manufacture. How-ever, these AC induction fan motors are relatively inef-ficient because of the slip3 associated with single-phaseinduction motors. Brushless DC (BLDC) motors havebecome increasingly common in appliances in recentdecades due to developments in electronic commutationand the availability of inexpensive and high-performingmagnetic materials (Desroches and Garbesi 2011). Suchmotors are more efficient than brushed DC motors be-cause they do not have the friction loss associated withmechanical commutation. Induction motors are
3 The slip is the difference between the speed of the rotor and themagnetic field in an AC induction motor.
38 Energy Efficiency (2015) 8:37–50
inefficient because their rotors do not rotate synchro-nously with the magnetic field that induces rotor motionwhich results in slip. BLDC motors alleviate theseissues because the rotor moves synchronously withthe rotating AC magnetic field produced by elec-tronic commutation. For instance, a 75-W BLDCmotor has been estimated to have an efficiency ofup to about 90 %, whereas the average new 75-WAC induction motor has an efficiency of around75 % (Desroches and Garbesi 2011). Table 2shows this efficiency along with those of other75-W motors.
Multiple engineering studies have estimated the po-tential for reducing energy consumption through the useof BLDC motors. One experimental Taiwanese studyshows that the energy consumption of a ceiling fan witha BLDC motor is about 50 % that of a fan with a split-phase inductionmotor (Liu et al. 2009).An experimentalstudy from Australia shows that BLDC motors de-creases ceiling fan energy consumption by a factor ofthree at low speeds and a factor of two at high speeds(Schmidt and Patterson 2001). Industry experts indicatethat using a BLDC motor can reduce ceiling fan energy
consumption by an estimated 60 % in the USA (Parkerand Hibbs 2010). In addition to the potential energyefficiency improvements achieved with BLDC motors,some fans in India incorporate a combination of elementsthat affect AC induction motor efficiency. These fansconsume significantly less energy than normal. At highspeeds, these fans can reduce power consumption from70–75 W to about 45–50 W. AC induction motor effi-ciency in these fans are increased with the amount of“active” material (such as lamination steel and copper),reduced air gap between the stator and rotor, and incor-poration of standard-grade aluminum for die-cast rotors.4
Fan blades
Improving fan blade design has been shown to have asignificant influence on fan efficiency. Efficiency im-provements have been achieved bymultiple approaches.For example, these include incorporation of aerodynam-ic attachments for conventional blades (Volk 1990), adecrease in the angle of attack through the use oftwisted, tapered (TT) blades (Bird 2004), and use of TTblades with an air foil (Sonne and Parker 1998). We focuson the last of these options due to the wide use of this typeof blade and the potentially large energy savings that areassociated with this design. TT blades with an airfoilincrease efficiency by reducing energy lost to turbulenceand flow separation as discussed by Parker et al. (1999).Optimal blade design requires a balance between multipleobjectives including maximization of air speed, uniform
Table 2 Efficiency data for various 75-Wmotor types in the USA
Motor type Efficiency
NovaTorquea 90 %
Practical limits BLDC6 87 %
Practical limits AC induction 84 %
Average new production 75 %
Average installed base 60 %
Source: Desroches and Garbesi 2011a The company NovaTorque has incorporated technical improve-ments to push efficiency further beyond the so-called practicallimits of a BLDC motor.
4 Note: This information including proprietary cost and technolo-gy data has been collected by the Prayas Energy Group in consul-tations with manufacturers and industry experts during the estab-lishment of the Super Efficient Equipment Program (SEEP) forceiling fans in India and shared with the authors confidentially(Prayas Energy Group 2012).
Table 1 Summary of characteristics used in various standards and labeling programs
Country Agency Standard/Label type Speed Size category Rating type
India BIS Standard Voluntary Yes Specifies minimum efficacy for various fan sizes
India BEE Label Voluntary Only 1,200 mm Assigns star ratings to fans meeting minimumefficacy requirements
China NDRC, AQSIQ Standard Mandatory Yes Assigns ratings based on efficacy, to fans classifiedby size
USA EPA Label Voluntary Yes Specifies minimum efficacy for fans classified byoperating speed
Note: In Europe and India, the term “service value” is used to refer to efficacy.
Energy Efficiency (2015) 8:37–50 39
air speed along the fan radius, and maximization ofairflow coverage. A test of one such patented bladedesign indicates that the subject invention has an effica-cy 86–111 % higher than that of a conventional flatblade, indicating remarkable potential for energy-efficiency improvements from changes in fan bladedesign (Parker et al. 2000). These blades can also beused to reduce motor size and cost, and the resultingdevice will still outperform a conventional fan. Someefficient blade designs have been adapted for aestheticpurposes to appear like traditional blades from the bot-tom side while being aerodynamic on the top side, thusimproving efficiency 10–26 % when compared to con-ventional designs (Parker and Hibbs 2010). The bladehas been designed to meet a market preference by someconsumers for energy-efficient fans with a traditionalappearance.
Fan efficiency improvement opportunities: empiricalevidence from the US market
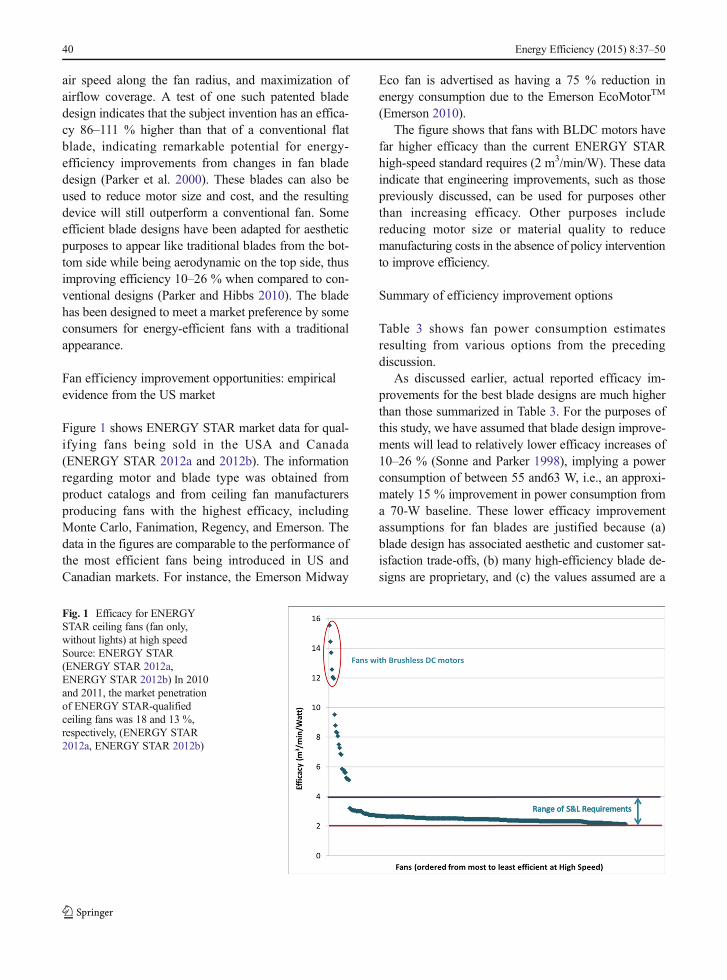
Figure 1 shows ENERGY STAR market data for qual-ifying fans being sold in the USA and Canada(ENERGY STAR 2012a and 2012b). The informationregarding motor and blade type was obtained fromproduct catalogs and from ceiling fan manufacturersproducing fans with the highest efficacy, includingMonte Carlo, Fanimation, Regency, and Emerson. Thedata in the figures are comparable to the performance ofthe most efficient fans being introduced in US andCanadian markets. For instance, the Emerson Midway
Eco fan is advertised as having a 75 % reduction inenergy consumption due to the Emerson EcoMotorTM
(Emerson 2010).The figure shows that fans with BLDC motors have
far higher efficacy than the current ENERGY STARhigh-speed standard requires (2 m3/min/W). These dataindicate that engineering improvements, such as thosepreviously discussed, can be used for purposes otherthan increasing efficacy. Other purposes includereducing motor size or material quality to reducemanufacturing costs in the absence of policy interventionto improve efficiency.
Summary of efficiency improvement options
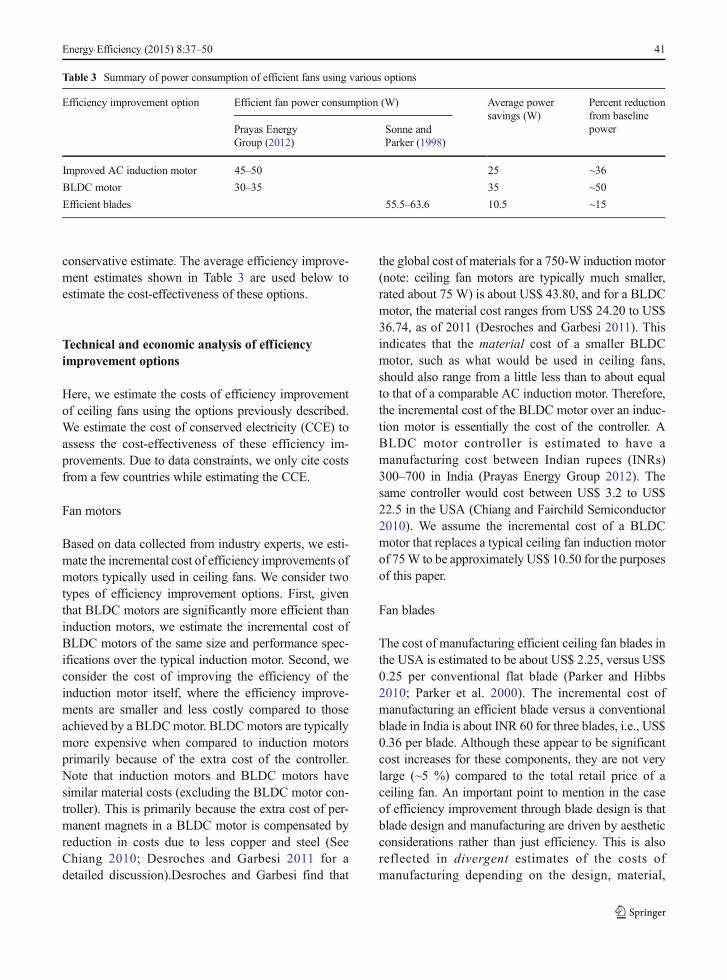
Table 3 shows fan power consumption estimatesresulting from various options from the precedingdiscussion.
As discussed earlier, actual reported efficacy im-provements for the best blade designs are much higherthan those summarized in Table 3. For the purposes ofthis study, we have assumed that blade design improve-ments will lead to relatively lower efficacy increases of10–26 % (Sonne and Parker 1998), implying a powerconsumption of between 55 and63 W, i.e., an approxi-mately 15 % improvement in power consumption froma 70-W baseline. These lower efficacy improvementassumptions for fan blades are justified because (a)blade design has associated aesthetic and customer sat-isfaction trade-offs, (b) many high-efficiency blade de-signs are proprietary, and (c) the values assumed are a
Fig. 1 Efficacy for ENERGYSTAR ceiling fans (fan only,without lights) at high speedSource: ENERGY STAR(ENERGY STAR 2012a,ENERGY STAR 2012b) In 2010and 2011, the market penetrationof ENERGY STAR-qualifiedceiling fans was 18 and 13 %,respectively, (ENERGY STAR2012a, ENERGY STAR 2012b)
40 Energy Efficiency (2015) 8:37–50
conservative estimate. The average efficiency improve-ment estimates shown in Table 3 are used below toestimate the cost-effectiveness of these options.
Technical and economic analysis of efficiencyimprovement options
Here, we estimate the costs of efficiency improvementof ceiling fans using the options previously described.We estimate the cost of conserved electricity (CCE) toassess the cost-effectiveness of these efficiency im-provements. Due to data constraints, we only cite costsfrom a few countries while estimating the CCE.
Fan motors
Based on data collected from industry experts, we esti-mate the incremental cost of efficiency improvements ofmotors typically used in ceiling fans. We consider twotypes of efficiency improvement options. First, giventhat BLDC motors are significantly more efficient thaninduction motors, we estimate the incremental cost ofBLDC motors of the same size and performance spec-ifications over the typical induction motor. Second, weconsider the cost of improving the efficiency of theinduction motor itself, where the efficiency improve-ments are smaller and less costly compared to thoseachieved by a BLDCmotor. BLDCmotors are typicallymore expensive when compared to induction motorsprimarily because of the extra cost of the controller.Note that induction motors and BLDC motors havesimilar material costs (excluding the BLDC motor con-troller). This is primarily because the extra cost of per-manent magnets in a BLDC motor is compensated byreduction in costs due to less copper and steel (SeeChiang 2010; Desroches and Garbesi 2011 for adetailed discussion).Desroches and Garbesi find that
the global cost of materials for a 750-W induction motor(note: ceiling fan motors are typically much smaller,rated about 75 W) is about US$ 43.80, and for a BLDCmotor, the material cost ranges from US$ 24.20 to US$36.74, as of 2011 (Desroches and Garbesi 2011). Thisindicates that the material cost of a smaller BLDCmotor, such as what would be used in ceiling fans,should also range from a little less than to about equalto that of a comparable AC induction motor. Therefore,the incremental cost of the BLDC motor over an induc-tion motor is essentially the cost of the controller. ABLDC motor controller is estimated to have amanufacturing cost between Indian rupees (INRs)300–700 in India (Prayas Energy Group 2012). Thesame controller would cost between US$ 3.2 to US$22.5 in the USA (Chiang and Fairchild Semiconductor2010). We assume the incremental cost of a BLDCmotor that replaces a typical ceiling fan induction motorof 75W to be approximately US$ 10.50 for the purposesof this paper.
Fan blades
The cost of manufacturing efficient ceiling fan blades inthe USA is estimated to be about US$ 2.25, versus US$0.25 per conventional flat blade (Parker and Hibbs2010; Parker et al. 2000). The incremental cost ofmanufacturing an efficient blade versus a conventionalblade in India is about INR 60 for three blades, i.e., US$0.36 per blade. Although these appear to be significantcost increases for these components, they are not verylarge (~5 %) compared to the total retail price of aceiling fan. An important point to mention in the caseof efficiency improvement through blade design is thatblade design and manufacturing are driven by aestheticconsiderations rather than just efficiency. This is alsoreflected in divergent estimates of the costs ofmanufacturing depending on the design, material,
Table 3 Summary of power consumption of efficient fans using various options
Efficiency improvement option Efficient fan power consumption (W) Average powersavings (W)
Percent reductionfrom baselinepowerPrayas Energy
Group (2012)Sonne andParker (1998)
Improved AC induction motor 45–50 25 ~36
BLDC motor 30–35 35 ~50
Efficient blades 55.5–63.6 10.5 ~15
Energy Efficiency (2015) 8:37–50 41
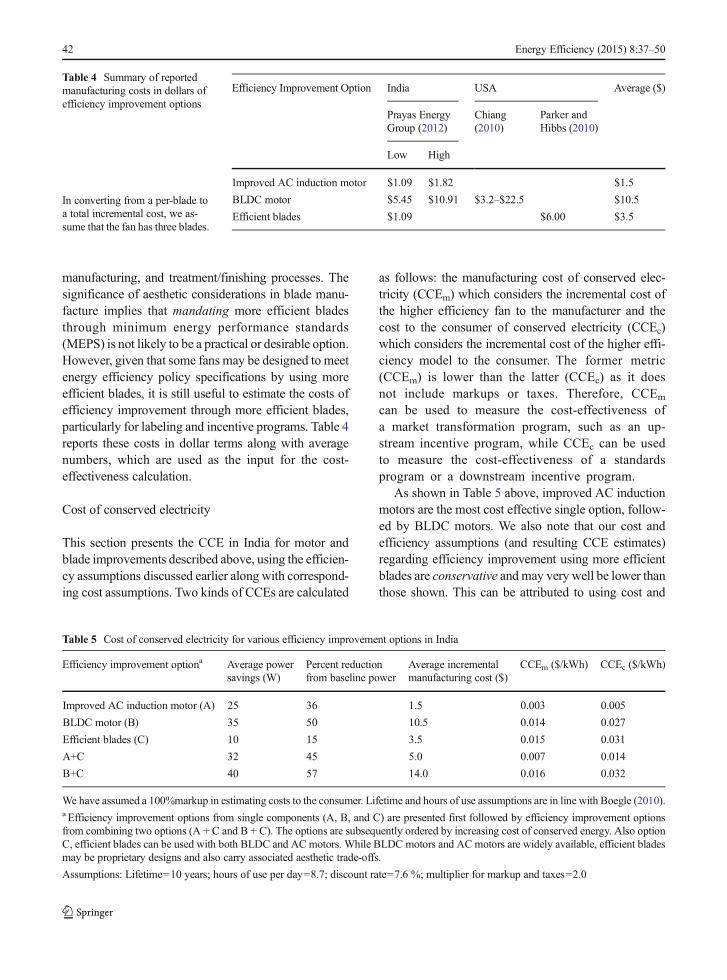
manufacturing, and treatment/finishing processes. Thesignificance of aesthetic considerations in blade manu-facture implies that mandating more efficient bladesthrough minimum energy performance standards(MEPS) is not likely to be a practical or desirable option.However, given that some fans may be designed to meetenergy efficiency policy specifications by using moreefficient blades, it is still useful to estimate the costs ofefficiency improvement through more efficient blades,particularly for labeling and incentive programs. Table 4reports these costs in dollar terms along with averagenumbers, which are used as the input for the cost-effectiveness calculation.
Cost of conserved electricity
This section presents the CCE in India for motor andblade improvements described above, using the efficien-cy assumptions discussed earlier along with correspond-ing cost assumptions. Two kinds of CCEs are calculated
as follows: the manufacturing cost of conserved elec-tricity (CCEm) which considers the incremental cost ofthe higher efficiency fan to the manufacturer and thecost to the consumer of conserved electricity (CCEc)which considers the incremental cost of the higher effi-ciency model to the consumer. The former metric(CCEm) is lower than the latter (CCEc) as it doesnot include markups or taxes. Therefore, CCEm
can be used to measure the cost-effectiveness ofa market transformation program, such as an up-stream incentive program, while CCEc can be usedto measure the cost-effectiveness of a standardsprogram or a downstream incentive program.
As shown in Table 5 above, improved AC inductionmotors are the most cost effective single option, follow-ed by BLDC motors. We also note that our cost andefficiency assumptions (and resulting CCE estimates)regarding efficiency improvement using more efficientblades are conservative and may very well be lower thanthose shown. This can be attributed to using cost and
Table 4 Summary of reportedmanufacturing costs in dollars ofefficiency improvement options
In converting from a per-blade toa total incremental cost, we as-sume that the fan has three blades.
Efficiency Improvement Option India USA Average ($)
Prayas EnergyGroup (2012)
Chiang(2010)
Parker andHibbs (2010)
Low High
Improved AC induction motor $1.09 $1.82 $1.5
BLDC motor $5.45 $10.91 $3.2–$22.5 $10.5
Efficient blades $1.09 $6.00 $3.5
Table 5 Cost of conserved electricity for various efficiency improvement options in India
Efficiency improvement optiona Average powersavings (W)
Percent reductionfrom baseline power
Average incrementalmanufacturing cost ($)
CCEm ($/kWh) CCEc ($/kWh)
Improved AC induction motor (A) 25 36 1.5 0.003 0.005
BLDC motor (B) 35 50 10.5 0.014 0.027
Efficient blades (C) 10 15 3.5 0.015 0.031
A+C 32 45 5.0 0.007 0.014
B+C 40 57 14.0 0.016 0.032
We have assumed a 100%markup in estimating costs to the consumer. Lifetime and hours of use assumptions are in line with Boegle (2010).a Efficiency improvement options from single components (A, B, and C) are presented first followed by efficiency improvement optionsfrom combining two options (A + C and B + C). The options are subsequently ordered by increasing cost of conserved energy. Also optionC, efficient blades can be used with both BLDC and ACmotors. While BLDC motors and ACmotors are widely available, efficient bladesmay be proprietary designs and also carry associated aesthetic trade-offs.
Assumptions: Lifetime=10 years; hours of use per day=8.7; discount rate=7.6 %; multiplier for markup and taxes=2.0
42 Energy Efficiency (2015) 8:37–50
efficiency estimates for more efficient blades with atraditional appearance as discussed earlier rather thanthe most efficient blades (Parker and Hibbs 2010). Also,data on blades indicated divergent estimates of the costsof manufacturing depending on design, material,manufacturing, and treatment/finishing processes,which varied due to aesthetic considerations. Giventhe globally traded nature, maturity, and high con-tribution of material costs to the total costs of theefficiency technologies considered, cost estimatesbased on the data in India and the USA are likelyto be a reasonable approximation of the costs inother regions. To give a picture of cost-effectivenessunder various scenarios, we also present the results ofa sensitivity analysis on the CCE in the next section ofthis article.
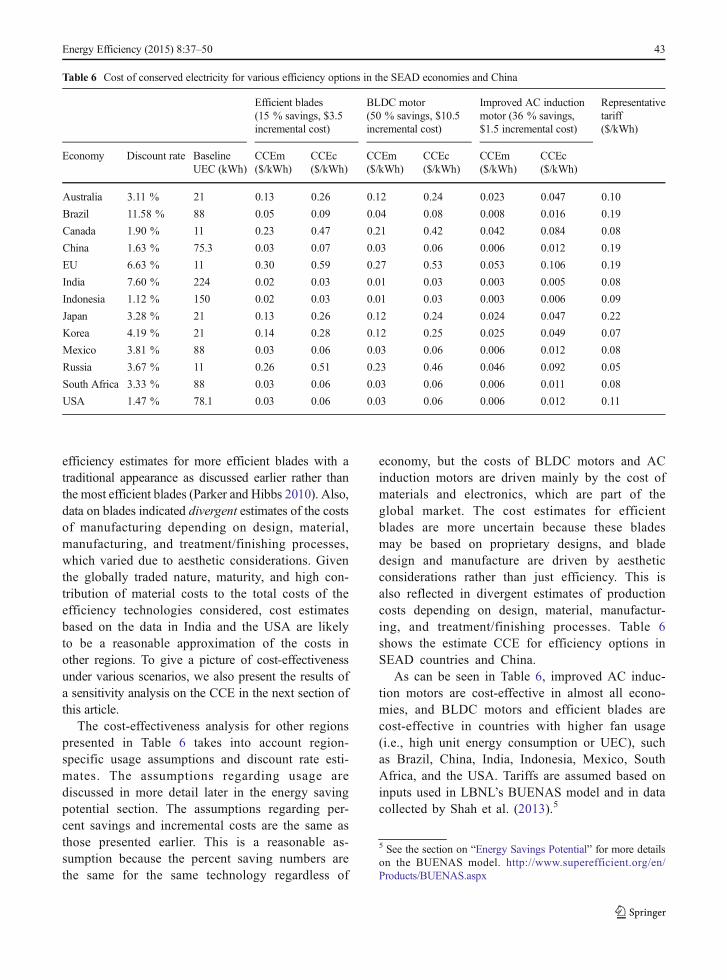
The cost-effectiveness analysis for other regionspresented in Table 6 takes into account region-specific usage assumptions and discount rate esti-mates. The assumptions regarding usage arediscussed in more detail later in the energy savingpotential section. The assumptions regarding per-cent savings and incremental costs are the same asthose presented earlier. This is a reasonable as-sumption because the percent saving numbers arethe same for the same technology regardless of
economy, but the costs of BLDC motors and ACinduction motors are driven mainly by the cost ofmaterials and electronics, which are part of theglobal market. The cost estimates for efficientblades are more uncertain because these bladesmay be based on proprietary designs, and bladedesign and manufacture are driven by aestheticconsiderations rather than just efficiency. This isalso reflected in divergent estimates of productioncosts depending on design, material, manufactur-ing, and treatment/finishing processes. Table 6shows the estimate CCE for efficiency options inSEAD countries and China.
As can be seen in Table 6, improved AC induc-tion motors are cost-effective in almost all econo-mies, and BLDC motors and efficient blades arecost-effective in countries with higher fan usage(i.e., high unit energy consumption or UEC), suchas Brazil, China, India, Indonesia, Mexico, SouthAfrica, and the USA. Tariffs are assumed based oninputs used in LBNL’s BUENAS model and in datacollected by Shah et al. (2013).5
5 See the section on “Energy Savings Potential” for more detailson the BUENAS model. http://www.superefficient.org/en/Products/BUENAS.aspx
Table 6 Cost of conserved electricity for various efficiency options in the SEAD economies and China
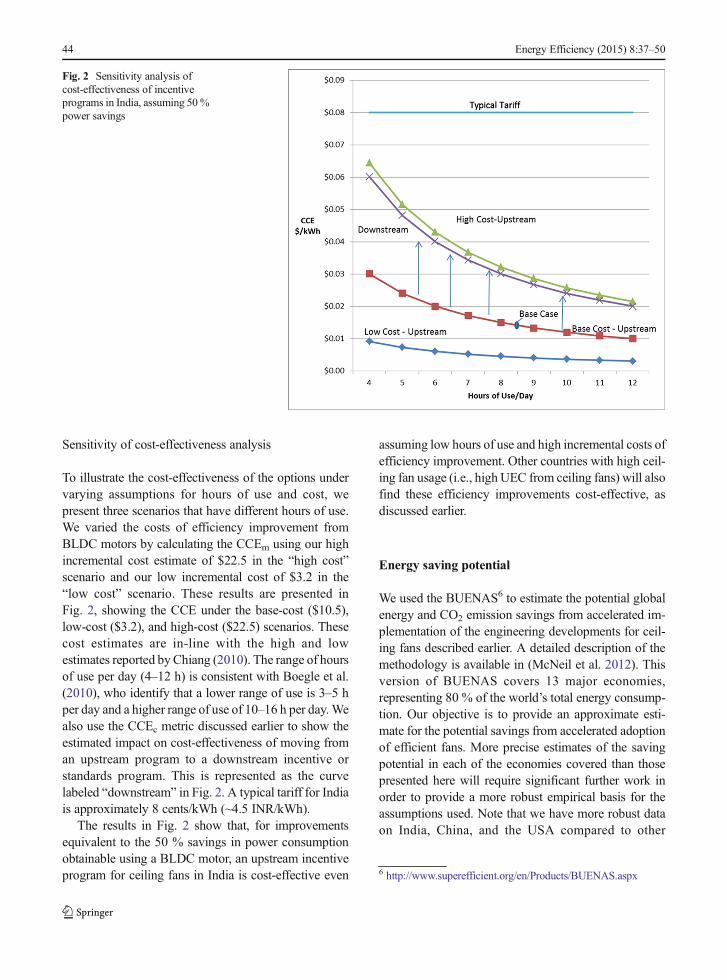
To illustrate the cost-effectiveness of the options undervarying assumptions for hours of use and cost, wepresent three scenarios that have different hours of use.We varied the costs of efficiency improvement fromBLDC motors by calculating the CCEm using our highincremental cost estimate of $22.5 in the “high cost”scenario and our low incremental cost of $3.2 in the“low cost” scenario. These results are presented inFig. 2, showing the CCE under the base-cost ($10.5),low-cost ($3.2), and high-cost ($22.5) scenarios. Thesecost estimates are in-line with the high and lowestimates reported by Chiang (2010). The range of hoursof use per day (4–12 h) is consistent with Boegle et al.(2010), who identify that a lower range of use is 3–5 hper day and a higher range of use of 10–16 h per day.Wealso use the CCEc metric discussed earlier to show theestimated impact on cost-effectiveness of moving froman upstream program to a downstream incentive orstandards program. This is represented as the curvelabeled “downstream” in Fig. 2. A typical tariff for Indiais approximately 8 cents/kWh (~4.5 INR/kWh).
The results in Fig. 2 show that, for improvementsequivalent to the 50 % savings in power consumptionobtainable using a BLDC motor, an upstream incentiveprogram for ceiling fans in India is cost-effective even
assuming low hours of use and high incremental costs ofefficiency improvement. Other countries with high ceil-ing fan usage (i.e., high UEC from ceiling fans) will alsofind these efficiency improvements cost-effective, asdiscussed earlier.
Energy saving potential
We used the BUENAS6 to estimate the potential globalenergy and CO2 emission savings from accelerated im-plementation of the engineering developments for ceil-ing fans described earlier. A detailed description of themethodology is available in (McNeil et al. 2012). Thisversion of BUENAS covers 13 major economies,representing 80 % of the world’s total energy consump-tion. Our objective is to provide an approximate esti-mate for the potential savings from accelerated adoptionof efficient fans. More precise estimates of the savingpotential in each of the economies covered than thosepresented here will require significant further work inorder to provide a more robust empirical basis for theassumptions used. Note that we have more robust dataon India, China, and the USA compared to other
Fig. 2 Sensitivity analysis ofcost-effectiveness of incentiveprograms in India, assuming 50%power savings
countries, and hence, the estimates of saving potentialfor these countries are likely to bemore accurate than forthe others.
Data and methodology
BUENAS is an end-use energy forecasting model de-signed to provide a detailed assessment of the potentialfor energy savings and green house gas GHG emissionreductions from energy-efficiency standards and label-ing programs worldwide (see McNeil et al. 2012 for adetailed description of the model). The model is “bot-tom-up” in that it calculates energy demand based oninput data for individual appliance products. BUENASis composed of three modules. The first calculates thenumber of appliances per household (diffusion) in acountry at a given point in time, primarily based on anempirical relationship observed between appliance own-ership and macroeconomic household variables such ashousehold income. The secondmodule estimates energyconsumption and efficiency improvements at the appli-ance level. The third module is a stock turnover modulethat calculates the sales of appliances every year basedon retirement of old units and increased penetration ofappliances in households. This module combines thesales in every year with UEC to estimate the total stockenergy consumption. The difference in stock energyconsumption between a business as usual (BAU) and
an efficiency case equals the savings. Energy savingsare then converted into CO2 equivalent emission miti-gation according to the power generation mix from eachcountry.
Results
This section presents the BUENAS results in terms ofstock energy consumption and global potential energysavings. BUENAS also provides CO2 emission mitiga-tion potential calculated using country-specific carbonfactors (McNeil et al. 2012).
Efficiency scenario
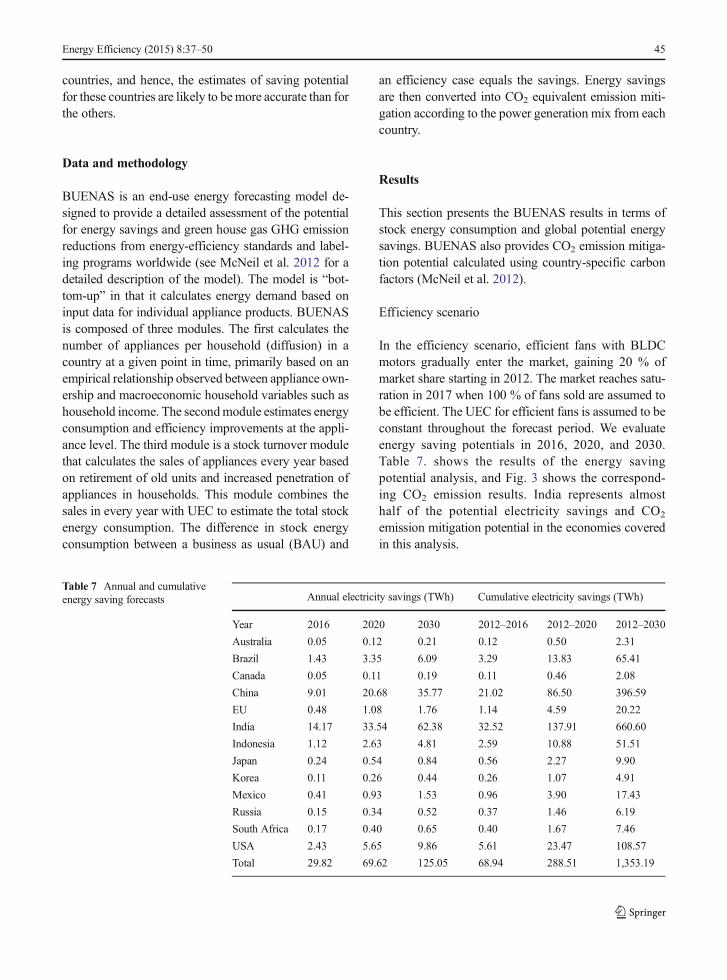
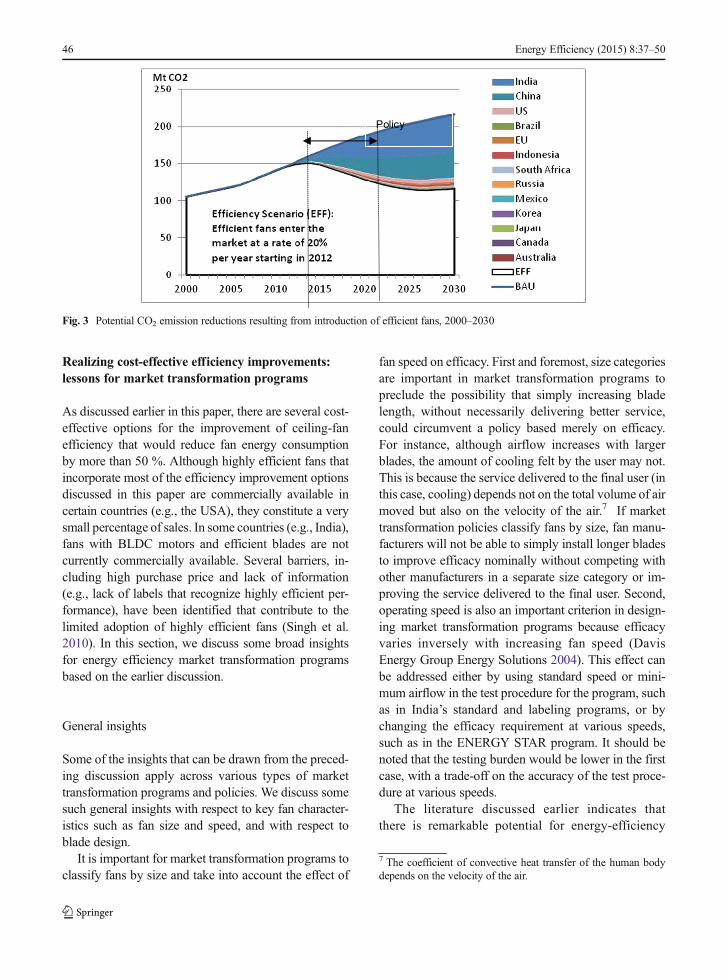
In the efficiency scenario, efficient fans with BLDCmotors gradually enter the market, gaining 20 % ofmarket share starting in 2012. The market reaches satu-ration in 2017 when 100 % of fans sold are assumed tobe efficient. The UEC for efficient fans is assumed to beconstant throughout the forecast period. We evaluateenergy saving potentials in 2016, 2020, and 2030.Table 7. shows the results of the energy savingpotential analysis, and Fig. 3 shows the correspond-ing CO2 emission results. India represents almosthalf of the potential electricity savings and CO2
emission mitigation potential in the economies coveredin this analysis.
Realizing cost-effective efficiency improvements:lessons for market transformation programs
As discussed earlier in this paper, there are several cost-effective options for the improvement of ceiling-fanefficiency that would reduce fan energy consumptionby more than 50 %. Although highly efficient fans thatincorporate most of the efficiency improvement optionsdiscussed in this paper are commercially available incertain countries (e.g., the USA), they constitute a verysmall percentage of sales. In some countries (e.g., India),fans with BLDC motors and efficient blades are notcurrently commercially available. Several barriers, in-cluding high purchase price and lack of information(e.g., lack of labels that recognize highly efficient per-formance), have been identified that contribute to thelimited adoption of highly efficient fans (Singh et al.2010). In this section, we discuss some broad insightsfor energy efficiency market transformation programsbased on the earlier discussion.
General insights
Some of the insights that can be drawn from the preced-ing discussion apply across various types of markettransformation programs and policies. We discuss somesuch general insights with respect to key fan character-istics such as fan size and speed, and with respect toblade design.
It is important for market transformation programs toclassify fans by size and take into account the effect of
fan speed on efficacy. First and foremost, size categoriesare important in market transformation programs topreclude the possibility that simply increasing bladelength, without necessarily delivering better service,could circumvent a policy based merely on efficacy.For instance, although airflow increases with largerblades, the amount of cooling felt by the user may not.This is because the service delivered to the final user (inthis case, cooling) depends not on the total volume of airmoved but also on the velocity of the air.7 If markettransformation policies classify fans by size, fan manu-facturers will not be able to simply install longer bladesto improve efficacy nominally without competing withother manufacturers in a separate size category or im-proving the service delivered to the final user. Second,operating speed is also an important criterion in design-ing market transformation programs because efficacyvaries inversely with increasing fan speed (DavisEnergy Group Energy Solutions 2004). This effect canbe addressed either by using standard speed or mini-mum airflow in the test procedure for the program, suchas in India’s standard and labeling programs, or bychanging the efficacy requirement at various speeds,such as in the ENERGY STAR program. It should benoted that the testing burden would be lower in the firstcase, with a trade-off on the accuracy of the test proce-dure at various speeds.
The literature discussed earlier indicates thatthere is remarkable potential for energy-efficiency
7 The coefficient of convective heat transfer of the human bodydepends on the velocity of the air.
Policy
Fig. 3 Potential CO2 emission reductions resulting from introduction of efficient fans, 2000–2030
46 Energy Efficiency (2015) 8:37–50
improvements from changes in fan blade design. Wealso find that blade design improvements have greaterefficacy/power consumption saving impact at higherspeeds. This implies that market transformation pro-grams in economies with hotter climates and higheraverage airflows (e.g., India) will benefit proportionallymore from blade design improvements than economieswhere average airflows tend to be lower (e.g., the USA).For example, the most efficient blade designs discussedin the literature will improve efficacy by 86 % at lowerspeeds (airflows) versus 111 % at higher speeds(airflows) compared with conventional blade designs(Parker and Hibbs 2010).
Standards and labeling programs
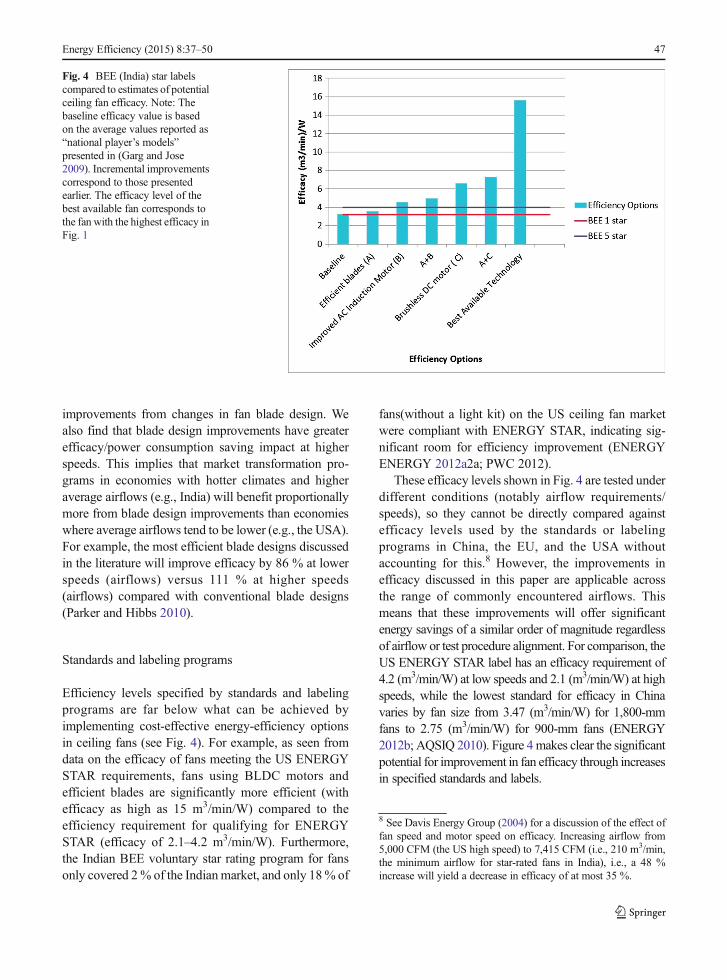
Efficiency levels specified by standards and labelingprograms are far below what can be achieved byimplementing cost-effective energy-efficiency optionsin ceiling fans (see Fig. 4). For example, as seen fromdata on the efficacy of fans meeting the US ENERGYSTAR requirements, fans using BLDC motors andefficient blades are significantly more efficient (withefficacy as high as 15 m3/min/W) compared to theefficiency requirement for qualifying for ENERGYSTAR (efficacy of 2.1–4.2 m3/min/W). Furthermore,the Indian BEE voluntary star rating program for fansonly covered 2% of the Indianmarket, and only 18% of
fans(without a light kit) on the US ceiling fan marketwere compliant with ENERGY STAR, indicating sig-nificant room for efficiency improvement (ENERGYENERGY 2012a2a; PWC 2012).
These efficacy levels shown in Fig. 4 are tested underdifferent conditions (notably airflow requirements/speeds), so they cannot be directly compared againstefficacy levels used by the standards or labelingprograms in China, the EU, and the USA withoutaccounting for this.8 However, the improvements inefficacy discussed in this paper are applicable acrossthe range of commonly encountered airflows. Thismeans that these improvements will offer significantenergy savings of a similar order of magnitude regardlessof airflow or test procedure alignment. For comparison, theUS ENERGY STAR label has an efficacy requirement of4.2 (m3/min/W) at low speeds and 2.1 (m3/min/W) at highspeeds, while the lowest standard for efficacy in Chinavaries by fan size from 3.47 (m3/min/W) for 1,800-mmfans to 2.75 (m3/min/W) for 900-mm fans (ENERGY2012b; AQSIQ 2010). Figure 4makes clear the significantpotential for improvement in fan efficacy through increasesin specified standards and labels.
8 See Davis Energy Group (2004) for a discussion of the effect offan speed and motor speed on efficacy. Increasing airflow from5,000 CFM (the US high speed) to 7,415 CFM (i.e., 210 m3/min,the minimum airflow for star-rated fans in India), i.e., a 48 %increase will yield a decrease in efficacy of at most 35 %.
Fig. 4 BEE (India) star labelscompared to estimates of potentialceiling fan efficacy. Note: Thebaseline efficacy value is basedon the average values reported as“national player’s models”presented in (Garg and Jose2009). Incremental improvementscorrespond to those presentedearlier. The efficacy level of thebest available fan corresponds tothe fan with the highest efficacy inFig. 1
Energy Efficiency (2015) 8:37–50 47
The highest efficacy level recognized by labels inseveral countries is significantly lower than what canbe achieved by adopting cost-effective efficiency op-tions. Hence, current efficacy label levels need to berevised significantly to encourage deeper penetration ofefficient ceiling fans at the top of the market withefficacy achievable using BLDC motors and efficientblades that are already on the market in the USA andthat are cost-effective in other countries. The low pene-tration level of efficient ceiling fans in both India and theUSA seems to indicate the presence of barriers to effi-ciency other than information, such as first cost, thatmay not be able to be addressed within a standards andlabeling framework.
Incentive programs
Incentive programs for efficient fans could acceleratethe penetration of superefficient fans for the followingreasons. First, adoption of cost-effective efficient appli-ances is often hindered by high first cost, e.g., asdiscussed by Sathaye and Gupta (2010). In emergingeconomies, consumers are highly sensitive to high firstcosts (Singh et al. 2010). Second, due to the importanceof aesthetics discussed earlier, it is not practical ordesirable to mandate efficiency improvement fromblade design through MEPS. However, the full existingpotential from more efficient blades, as well as fromBLDC motors, could be exploited through incentiveprograms for superefficient fans. Such programs couldcost-effectively target efficacy of up to 15m3/min/W, asdiscussed earlier. There are several examples of finan-cial incentive programs that lower the first cost of cost-effective energy-efficient appliances and equipment toaccelerate their adoption. However, despite the largesaving potential, financial incentive programs to pro-mote the adoption of highly efficient fans are notcommon.
Conclusions
This paper presents an analysis of the potential for theimprovement of ceiling fan components to reduce glob-al energy consumption and GHG emissions. Improvedblade design and AC induction motor materials, and theincreased use of BLDC motors, are identified as cost-effective options to improve the efficiency of ceilingfans. Adaptation of these technologies could provide
ceiling fan power consumption savings of more than50 %. Out of the several types of policies typically usedto accelerate adoption of efficient products (e.g., awards,incentives, and standards and labeling programs), stan-dards and labeling programs are the most commonlyused to accelerate the market penetration of efficientfans.
Efficacy levels are tested under different conditions(notably airflow requirements/speeds) in various coun-tries, so they cannot be directly compared against eachother without accounting for this fact. Nevertheless, theimprovements in efficacy discussed in this paper areapplicable across the range of commonly encounteredairflows, meaning that these improvements will offersignificant energy savings of a similar order of magni-tude regardless of airflow or test procedure alignment.
The highest efficacy level required by standards andlabeling programs in several countries is significantlylower than what can be achieved by adopting the cost-effective efficiency improvement options discussedhere. Hence, current efficacy label levels need to berevised significantly to encourage deeper penetrationof efficient ceiling fans at the top of the market.
The low penetration level of efficient ceiling fans inboth India and the USA, even with labeling programs inplace,9 seems to indicate the presence of barriers. Thesebarriers to efficiency, in addition to information, such asfirst cost, may not be able to be addressed fully within astandards and labeling framework, particularly inemerging economies with price-sensitive consumers.However, despite the large saving potential, financialincentive programs that promote the adoption of highlyefficient fans by removing the first cost barrier are notcommon.
One notable example under development is the SEEPin India where financial incentives will be provided tofan manufacturers to produce and sell highly efficientfans: fans that consume less than half of the energyconsumed by fans typically sold on the Indian market(Singh et al. 2010). Even if the entire incremental cost ofthe highly efficient fans is covered by the financialincentives, the cost of the conserved electricity for effi-ciency improvements over 50 % is just 0.7 rupees perkilowatt hour (US$ 0.014/kWh) which is about one
9 BEE’s voluntary star rating program for fans only covered 2% ofthe Indian market, while only 18 % of the fans (without a light kit)on the US ceiling fan market were compliant with ENERGYSTAR (ENERGY2012a) indicating significant room for efficiencyimprovement.
48 Energy Efficiency (2015) 8:37–50
sixth of the cost of supplying electricity in India(Sathaye and Gupta 2010). SEEP or a similar upstreamincentive program for ceiling fans would be cost-effective even assuming higher costs and lower hoursof use as discussed earlier. Therefore, there remainssignificant scope for improved policy design and imple-mentation for aggressive and cost-effective ceiling fanefficiency improvements.
Acknowledgments This work was funded by the Bureau ofOceans and International Environmental and ScientificAffairs, US Department of State, and administered by theUS Department of Energy in support of the SEAD initiativethrough the US Department of Energy under Contract No.DE-AC02-05CH11231.
Michael McNeil and Jing Ke of Lawrence Berkeley NationalLaboratory provided support for the BUENAS modeling effort.Daljit Singh and Adwait Pednekar of Prayas Energy Groupprovided a lot of the underlying data, as well as insightsand comments on the draft article. Steve Pantano and P.K.Mukherjee at the Collaborative Labeling and ApplianceStandards Program (CLASP), Abigail Daken at the USEnvironmental Protection Agency, Gabrielle Dreyfus at the USDepartment of Energy, Bonn Maguire of the Department ofClimate Change and Energy Efficiency of Australia, and WonYoung Park at the Lawrence Berkeley National Laboratoryprovided helpful comments and suggestions. Any errors oromissions are the authors’ own.
Open Access This article is distributed under the terms of theCreative Commons Attribution License which permits any use,distribution, and reproduction in any medium, provided the orig-inal author(s) and the source are credited.
References
Bird, G. (2004). High efficiency ceiling fan. United States PatentNumber 6733241.
Boegle, A., Singh, D. and Sant, G. (2010). Estimating technicalenergy saving potential from improving appliance efficiencyin Indian households. In ACEEE summer study on energyefficiency in buildings: the climate for efficiency is now.
Bureau of Indian Standards. (2007). Indian Standard - specificationfor electric ceiling type fans and regulators (3rd Revision),Edition 4.6 (Incorporating Amendments No. 1-6).
Calwell, C., & Horowitz, N. (2001). Ceiling fans: fulfilling theenergy efficiency promise. Home Energy, 18(1), 24–30.
Chakraborty, A. (2004). Energy conservation in ceiling fans. InProceedings of the 13th National Power Systems Conference,Chennai, India, pp. 835-838.
Chiang, J., Fairchild Semiconductor. (2010), Power point presentation,September 16. Available at: http://edg1.vcall.com/irwebsites/fairchildsemi/Final%20-%20PCIA.pdf.
Davis Energy Group Energy Solutions. (2004). “Codes andstandards enhancement initiative for PY2004: title 20
standards development: analysis of standards optionsfor ceiling fans.”
Desroches, L.-B.,and Garbesi, K. (2011). Max Tech and Beyond:maximizing appliance and equipment efficiency by design.Berkeley, CA: Lawrence Berkeley National LaboratoryReport LBNL-4998E.
De la Rue du Can, Stephane, Virginie, E, Letschert, Michael A.McNeil, Nan Zhou, and Jayant, A. (2009). Sathaye.Residential and transport energy use in India: past trendand future outlook. LBNL.
ENERGY STAR. (2012a). ENERGY STAR ceiling fan productlist posted on November 14, 2012. http://www.energystar.gov/index.cfm?fuseaction=find_a_product.showProductGroupandpgw_code=CF.
ENERGY STAR. (2012b). ENERGY STAR unit shipment andmarket penetration report calendar year 2011 Summary.http://www.energystar.gov/ia/partners/downloads/unit_shipment_data/2011_USD_Summary_Report.pdf.
Garg, S., and Jose, A. (2009). Energy efficiency labellingof ceiling fans in India: challenges and the way for-ward. Proceedings of the 5th International Conferenceon Energy Efficiency in Domestic Appliances andLighting. http://www.enbook.pl/sites/default/files/publikacje/150/20120130/energy_efficinency_in_domestic_vol_3_p2.pdf.
General Administration of Quality Supervision Inspection andQuarantine of the People’s Republic of China, (AQSIQ).(2010). Minimum allowable values of energy efficiency andenergy efficiency grades of AC electric fans GB 12021.9-2008, Standardization Administration of the People’sRepublic of China.
Koomey, J. et al. (2010). Defining a standard metric for electricitysavings. Environmental Research Letters, 5.
Liu, Chuan-Sheng, Jong-Chin, Hwang, Liang-Rui, Chen,Chih-Cheng, Fu. (2009). “Development of new structure ofbrushless DC servo motor for ceiling fan,” IndustrialElectronics and Applications, 2009. ICIEA 2009. 4th IEEEConference on , vol., no., pp.2640,2643, 25-27 May.
McNeil, M., Letschert, V., de la Rue du Can, S., and Ke, J.(2012). Bottom-up energy analysis system – methodol-ogy and results. Berkeley CA: Lawrence BerkeleyNational Laboratory Report LBNL 5722E.
Parker, D, and Hibbs, B. (2010), Efficient traditionallyappearing ceiling fan blades with aerodynamical uppersurfaces. United States Patent Number 7665967.
Parker, D., Callahan, M., Sonne J., and Su, G. (1999).Development of a high efficiency ceiling fan “thegossamer wind.” Tallahassee, FL: Florida EnergyOffice, Department of Community Affairs.
Parker, D., Hua, G., and Hibbs, B. (2000). High efficiency ceilingfan. United States Patent Number 6039541.
Prayas Energy Group, (2012). Singh G, Sant G, ChunekarA, Pednekar A and Dixit S, Development of Super-Efficient Equipment Program (SEEP) for fans,Ava i lab le a t : h t tp : / /www.prayaspune .org /peg /publications/item/175.html.
Sathaye, J., and Gupta, A. (2010). Eliminating electricitydeficit through energy efficiency in India: an
evaluation of aggregate economic and carbon benefits.Berkeley CA: Lawrence Berkeley National LaboratoryReport LBNL-3381E.
Schmidt, K., & Patterson, D. (2001). Performance resultsfor a high efficiency tropical ceiling fan and compar-isons with conventional fans: Demand side manage-ment via small appliance efficiency. RenewableEnergy, 22(1–3), 169–176.
Shah, N., Waide, P., and Phadke, A. (2013). Cooling theplanet: opportunities for deployment of superefficientroom air conditioners, Lawrence Berkeley NationalLaboratory and Navigant Consulting Report, LBNL6164E, available at:http://superefficient.org/en/Activities/Technical%20Analysis/~/media/Files/Final%20SEAD%20Room%20AC%20Report.pdf.
Singh, D., Barve, A., and Sant, G. (2010).Ceiling fan theoverlooked appliance in energy efficiency discussions.Pune, India: Prayas Energy Group.
Sonne, J., and Parker, D. (1998). Measured ceiling fan perfor-mance and usage patterns: implications for efficiency andcomfort improvement. In Proceedings of ACEEE SummerStudy on Energy Efficiency in Buildings: Energy Efficiency ina Competitive Environment, pp.335-341.
Volk, S. (1990). Propeller breeze enhancing blades for conven-tional ceiling fans.United States Patent Number 4892460.
Waide, P., and Harrington, L. (2011). Opportunities for successand CO2 savings from appliance energy efficiencyharmonisation. Navigant Consulting in Partnership withCLASP. Available at: http://www.clasponline.org/clasp.online.resource.php?disdoc=781#opportunities.