Electrical properties of methane hydrate+ sediment mixturesWyatt L. Du Frane1, Laura A. Stern2, Steven Constable3, Karen A. Weitemeyer3,4, Megan M. Smith1,and Jeffery J. Roberts1
1Lawrence Livermore National Laboratory, Livermore, California, USA, 2U. S. Geological Survey, Menlo Park, California, USA,3Scripps Institution of Oceanography, La Jolla, California, USA, 4National Oceanography Centre Southampton, University ofSouthampton Waterfront Campus, Southampton, UK
Abstract Knowledge of the electrical properties of multicomponent systems with gas hydrate, sediments,and pore water is needed to help relate electromagnetic (EM) measurements to specific gas hydrateconcentration and distribution patterns in nature. Toward this goal, we built a pressure cell capable ofmeasuring in situ electrical properties of multicomponent systems such that the effects of individualcomponents andmixing relations can be assessed. We first established the temperature-dependent electricalconductivity (σ) of pure, single-phase methane hydrate to be ~5 orders of magnitude lower than seawater,a substantial contrast that can help differentiate hydrate deposits from significantly more conductivewater-saturated sediments in EM field surveys. Here we report σ measurements of two-component systemsin which methane hydrate is mixed with variable amounts of quartz sand or glass beads. Sand by itself haslow σ but is found to increase the overall σ of mixtures with well-connected methane hydrate. Alternatively,the overall σ decreases when sand concentrations are high enough to cause gas hydrate to be poorlyconnected, indicating that hydrate grains provide the primary conduction path. Our measurements suggestthat impurities from sand induce chemical interactions and/or doping effects that result in higher electricalconductivity with lower temperature dependence. These results can be used in the modeling of massiveor two-phase gas-hydrate-bearing systems devoid of conductive pore water. Further experiments thatinclude a free water phase are the necessary next steps toward developing complex models relevant to mostnatural systems.
1. Introduction
Gas hydrates are clathrate structures of H2O that encage gases of small molecular diameter, such as methane,ethane, propane, and CO2 [Sloan and Koh, 2007]. The formation of gas hydrates typically requires moderatelylow temperatures, high pressure, and sufficient quantities of water and free- or dissolved-phase hydrate-forming gas. Such conditions occur globally—and often extensively—in permafrost regions and shallowmarine environments such as in seafloor sediments along continental margins [Kvenvolden and Lorenson,2001]. Consequently, gas hydrates are very common in these regions and harbor a significant hydrocarbonsource that is of keen interest for economic as well as geohazard considerations [e.g., Kvenvolden, 1999;Collett, 2002; Ruppel, 2007; Maslin et al., 2010; Boswell and Collett, 2011]. Estimates of the total globalhydrate inventory have varied by up to 4 orders of magnitude [e.g., Kvenvolden, 1999; Milkov, 2004], withmore recent estimates predicting that the amount of carbon bound by gas hydrates is greater than thetotal amounts in the atmosphere plus conventional natural gas reserves [Boswell and Collett, 2011;Wallmann et al., 2012]. Estimates continue to improve with significant advances in global modeling andgeophysical mapping of gas hydrate inventories [Maslin et al., 2010; Boswell and Collett, 2011].
Traditional methods for geophysical detection of gas hydrates include well-logging and seismic surveys.Well-logging provides point measurements of gas hydrate concentration versus depth but is expensiveand invasive. Seismic methods are also used to map the spatial distribution of gas hydrate deposits. Thepresence of a bottom simulating reflector may indicate the phase boundary between gas hydrate and freegas [e.g., Hornbach et al., 2003]. This boundary alone, however, provides little information about theamount and distribution of gas hydrate above it. Seismic blanking zones can be used in some cases tohelp predict gas hydrate occurrence [e.g., Hornbach et al., 2003; Zhang and McMechan, 2006]. Additionalgeophysical methods are clearly needed to obtain a more complete picture of gas hydrate distribution.
DU FRANE ET AL. THE σ OF CH4 HYDRATE + SEDIMENT 4773
PUBLICATIONSJournal of Geophysical Research: Solid Earth
RESEARCH ARTICLE10.1002/2015JB011940
Key Points:• Ionic impurities from sand have adoping effect on methane hydrateconductivity
• Methane hydrate provides the primaryconduction path within mixtureswith sand
• Results help model the effects ofimpurities on systems devoid ofpore water
Supporting Information:• Figure Data S1• Sections S1 and S2, Table S1, andFigures S1–S3
Citation:Du Frane, W. L., L. A. Stern, S. Constable,K. A. Weitemeyer, M. M. Smith, andJ. J. Roberts (2015), Electrical propertiesof methane hydrate + sedimentmixtures, J. Geophys. Res. Solid Earth,120, 4773–4783, doi:10.1002/2015JB011940.
Received 10 FEB 2015Accepted 23 JUN 2015Accepted article online 25 JUN 2015Published online 30 JUL 2015
Electrical methods can be effective in remotely detecting gas hydrate due to the sensitivity of electricalproperties to the compositions and microstructures of sedimentary materials [Edwards, 1997]. Gas hydrateshave low electrical conductivity (σ—note that this is the inverse of resistivity: ρ= σ�1) that provides a suitabletarget for marine controlled source electromagnetic (CSEM) surveys. CSEM sounding measures the amplitudeand phase of electromagnetic (EM) energy propagating through the seafloor at one or more frequencies,and these data can be inverted to obtain the spatial distribution of conductivity. The combined use of bothseismic and EM methods can help distinguish between gas (low velocity and high resistivity) and gas hydrate(high velocity and high resistivity) to map both the upper and lower boundaries of gas hydrate deposits.Pilot CSEM studies have demonstrated the sensitivity of this method in assessing general gas hydrateconcentration, saturation, and distribution patterns [e.g., Schwalenberg et al., 2005; Evans, 2007; Weitemeyeret al., 2006, 2011]. Quantifying the estimates of hydrate volume, however, requires knowledge of theelectrical conductivity of gas hydrates in combination with petrophysical mixing relations established fromtheory and experiment [Collett and Ladd, 2000; Ellis et al., 2008].
Several previous laboratory studies focused on the electrical properties of gas hydrates in mixtures withsediment and water [Spangenberg and Kulenkampff, 2006; Lee et al., 2010; Ren et al., 2010]. The electricalconductivity of CH4 hydrate was measured during formation from liquid water in the pore space of glassbeads [Spangenberg and Kulenkampff, 2006] and quartz sand [Ren et al., 2010]. A similar study examinedelectrical conductivity before and after gas hydrate formation within sandy sediments, using brine with3.35wt % NaCl [Li et al., 2012]. These measurements are important for helping resolve mixing laws, butthey are dominated by the presence of water, which obscures quantitative information on the more subtlecontributions by gas hydrate or sediments to the overall electrical conductivity. Geometrical mixing laws,such as Archie’s law or Hashin-Shtrikman lower bounds models, can be used with the assumption that gashydrate has low σ compared to the surrounding seawater [Archie, 1942; Hashin and Shtrikman, 1962; Gloveret al., 2000]. This assumption is valid when the conductive pore water phase dominates the bulkconductivity—which is in fact the common mode in nature—but may not be valid where gas hydrate (thelow conductivity phase) occurs in massive form or otherwise dominates bulk conductivity. The latter casecan be especially important for mapping hydrate formations that are impermeable to gas, as they mayalso be relatively impermeable to pore water [e.g., Kneafsey et al., 2011]. Lee et al. [2010] published asystematic examination of electrical conductivity and permittivity (electric field response) for water-freetetrahydrofuran (THF) hydrate mixed with sand, silts, and clay, but as THF hydrate is only an analog fornatural gas hydrate, it may have different conduction mechanisms due to its different molecular structureas a structure II hydrate versus the more common naturally occurring structure I (sI) hydrate.
Lastly, the previous studies have not carefully examined the temperature dependence of the electricalconductivity gas hydrate/sediment mixtures. Most electrical insulators, such as gas hydrates, have electricalconductivity that increases exponentially with increasing temperature. Details of this relationship can yieldimportant mechanistic information about conduction mechanisms [e.g., Roberts, 2002], which must beunderstood to properly apply laboratory measurements to the widely varying conditions that exist inthe field.
Du Frane et al. [2011] published the first direct measurements of the electrical conductivity of single-phaseCH4 hydrate formed from reacting high purity H2O and CH4. The σ of CH4 hydrate ranged between 10�5
and 10�4 S/m for temperatures between �15 and 15°C, indicating strong, positive temperaturedependence. These results were obtained in a custom-built pressure cell designed to allow synthesis ofincreasingly complex gas hydrate + sediment ±water mixtures, in which electrical conductivity can bemeasured in situ during both formation and dissociation of the hydrate phase. This method allows forcontrolled and predetermined mixing and textural arrangement of the various components in the system,meaning that the effects of individual components can be assessed for better integration into mixingmodels. In this study, we present new electrical conductivity results for the two-component system of fullyreacted (i.e., water-free) methane hydrate in mixtures with varying proportions of sediments (quartz sandand glass beads) for a range of temperatures between �15 and 15°C.
We note that many—if not most—gas hydrate systems in nature contain a pore water component thatdominates the overall electrical properties of the system; hence, results from multicomponent samplesthat include a pore water phase will obviously be critical for modeling most systems in nature. However,
Journal of Geophysical Research: Solid Earth 10.1002/2015JB011940
DU FRANE ET AL. THE σ OF CH4 HYDRATE + SEDIMENT 4774
massive gas hydrate formations that arelacking in pore water are expected to bepresent in some locations in nature, andsuch units could be of high economicvalue. Measuring electrical conductivityof mixed-phase systems in which thereis no knowledge of the competingeffects of the separate components,how the various components are posi-tioned or connected within the system,or in what manner individual conductionmechanisms influence total conductivity,would simply yield isolated and ambigu-ous measurements due to the numerousunknowns. Also, the more subtle effectsof adding sediment to gas hydratewould be eclipsed when adding an addi-tional free water phase, and the only wayto investigate such effects is by carefulmeasurement of liquid-free systems.Future experiments are anticipated toincorporate a free water phase into thesystem in order to help develop themore complex models relevant to mostnatural systems.
2. Experimental Techniques
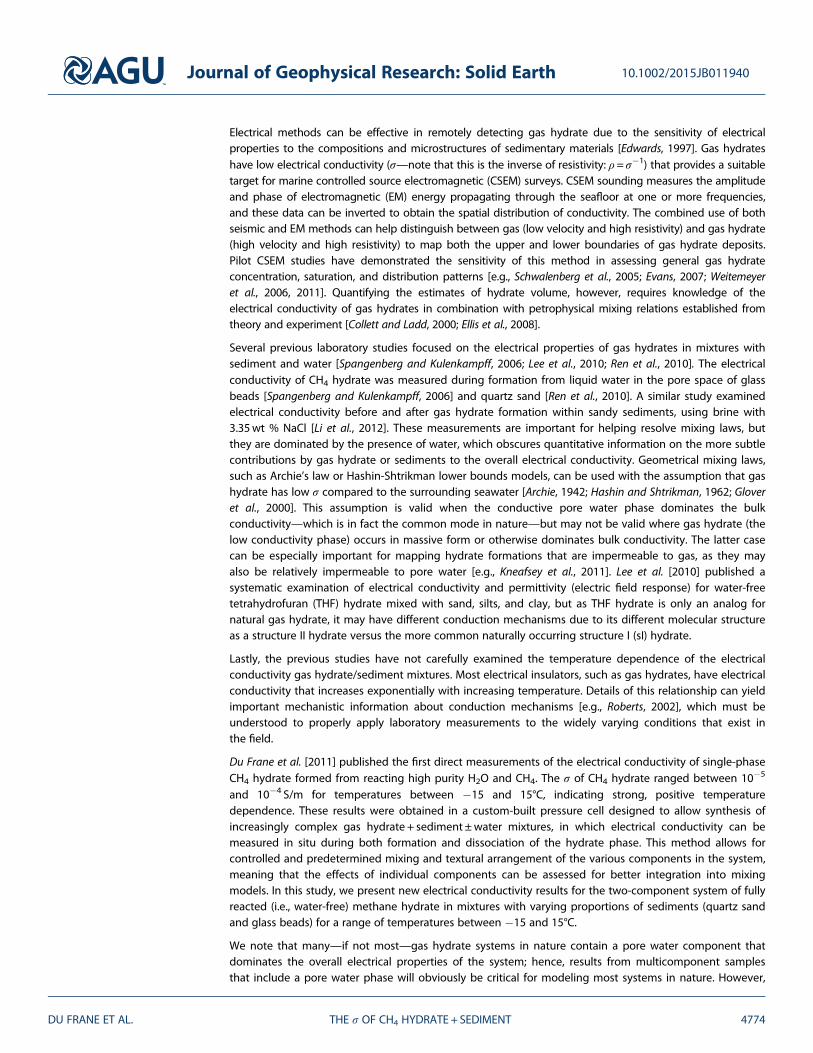
We developed a cell to synthesize gashydrate and simultaneously measureelectrical conductivity (Figure 1). Theapparatus is built around a commer-
cially available pressure vessel (High Pressure Equipment Company) with the addition of high-pressuremanifolds on each end cap. Each manifold has a single port feed-through where methane gas and electri-cal leads enter into the vessel. Samples were 2.0″ in diameter and 0.5″ thick and were sandwiched by silverelectrodes and Teflon spacers. Methane hydrate was synthesized in the pressure cell using a temperaturecycling technique that enables full reaction of H2O ice “seeds” and pressurized CH4 (15–30MPa) topolycrystalline CH4 hydrate in a reproducible manner [Stern et al., 1996, 2004]. The reactant ice seeds weremade from a block of nearly gas-free ice that was grown from distilled-deionized water, then crushed andsieved to 0.180–0.250mm.
Starting samples were prepared from granular ice that was free of sediment, mixed with quartz sand, ormixed with silica glass beads. The quartz sand and glass beads were not washed prior to use. Mixtureswere made in proportions ranging from pure (100%) ice down to 10 vol % ice and 0–90 vol % sand orbeads, with percentages referring to the solid phase only. All samples initially contained ~30–40%porosity, determined from mass measurements of each phase prior to mixing and packing into theknown-volume sample chamber. Ice-only samples had highest initial porosity given their relatively uniformgrain size compared to mixed-phase samples. In all samples, porosity reduces during reaction due to the~16% volumetric increase of the H2O phase that accompanies the ice to hydrate reaction, assumingdensity of ice and an empty sI hydrate lattice to be 917 and 790 kg/m3, respectively [Dvorkin et al., 2000].Porosity of final samples is thus easily calculated, and the issue of porosity has been discussed previouslyin Du Frane et al. [2011]. For mixtures with sand, we used Oklahoma #1 (OK #1) high-purity quartz (SiO2)sand that had minor hematite, illite, calcite, and alumina (<1 vol % combined) and a narrow grain sizedistribution with 84% of grain diameters between 0.106 to 0.250mm [Durham et al., 2009]. Two samplemixtures contained glass beads (Cataphote) made of high-purity soda-lime-silica (amorphous SiO2 with a
Figure 1. Pressure vessel designed to synthesize gas hydrate and measureimpedance spectroscopy in situ [from Du Frane et al., 2011].
Journal of Geophysical Research: Solid Earth 10.1002/2015JB011940
DU FRANE ET AL. THE σ OF CH4 HYDRATE + SEDIMENT 4775
small amount of Na2CO3 [NIIR Board of Consultants and Engineers, 2005]) glass with diameters rangingbetween 0.105 and 0.125mm. Sample mixtures and run conditions are listed in Table 1.
The cell was first loaded with seed ice ± sediments and placed under methane pressure in a temperaturecontrolled bath of inert coolant, d-Limonene. Heating the reactants above the ice point to conditions wellwithin the methane hydrate stability field promoted full and efficient reaction to hydrate. The first run wascarried out with one manifold replaced by a thermocouple to calibrate and monitor the synthesis reaction;any unreacted H2O remaining after the heating stage was easily discernible by a discontinuity in thepressure-temperature curve upon cooling the sample below the ice point, in which case additional heatingcycles were implemented. Subsequent runs were then performed without a thermocouple in the sample,using the σ measurement itself as an indicator of complete reaction, as it was similarly sensitive to excessliquid when cycling past the freezing/melting point. Samples were cycled multiple (≥7) times to ensure fullreaction. During experiments, temperature and electrical conductivity were monitored and recordedthroughout formation, stabilization, and dissociation.
Impedance spectroscopy data (20Hz to 2MHz) were collected with an Agilent E4980A LCR (inductance,capacitance, and resistance) meter throughout each run. The spectra were used to determine whatfrequency impedance measurement is needed to calculate the true electrical conductivity of the samplewhile excluding systemic contributions [e.g., Roberts and Tyburczy, 1991, 1993]. It should be noted that therange of frequencies swept during impedance spectroscopy measurements in the laboratory is unrelatedto the frequencies used in CSEM field measurements. Our previous equivalent circuit modeling [Du Franeet al., 2011] indicates that conductivity can be measured reliably at the frequency associated with thesmallest capacitance to isolate the electrical response of our samples and avoid systemic effects, such aselectrode polarization at low frequency. Measurements were performed on samples with fully reacted CH4
hydrate between �15 and 15°C after seven or more automated temperature cycles. Heating was isochoricsuch that the pore pressure of CH4 gas increased during the measurement (pressure ranges are listed inTable 1). Comparative impedance measurements were also performed between �15 and �2°C on severalsamples after the CH4 hydrate was dissociated back into ice by venting CH4 from the vessel attemperatures ≤�3°C for ≥6 days (Table 1). Single-frequency electrical conductivity (typically at 100 kHz)was monitored during CH4 hydrate synthesis and dissociation to verify completion of each reaction. We
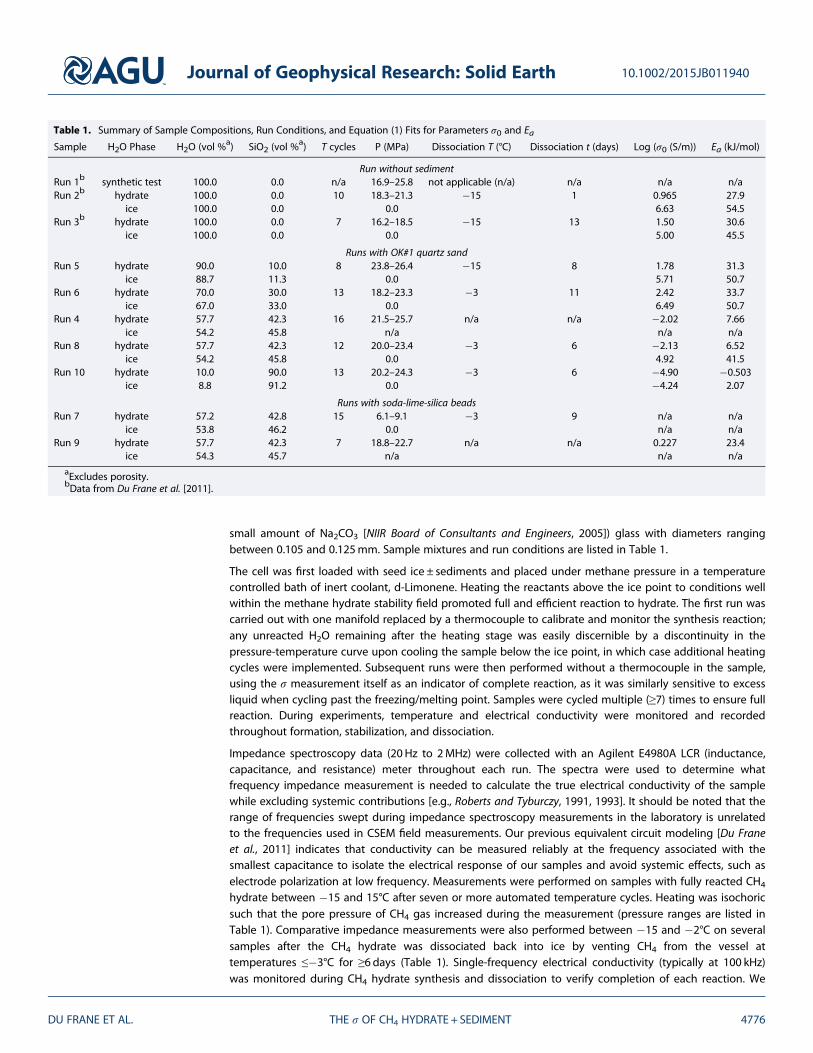
Table 1. Summary of Sample Compositions, Run Conditions, and Equation (1) Fits for Parameters σ0 and EaSample H2O Phase H2O (vol %a) SiO2 (vol %
a) T cycles P (MPa) Dissociation T (°C) Dissociation t (days) Log (σ0 (S/m)) Ea (kJ/mol)
Run without sedimentRun 1b synthetic test 100.0 0.0 n/a 16.9–25.8 not applicable (n/a) n/a n/a n/aRun 2b hydrate 100.0 0.0 10 18.3–21.3 �15 1 0.965 27.9
aExcludes porosity.bData from Du Frane et al. [2011].
Journal of Geophysical Research: Solid Earth 10.1002/2015JB011940
DU FRANE ET AL. THE σ OF CH4 HYDRATE + SEDIMENT 4776
also monitored sample conductivity after each incremental heating step to ensure that samples hadreequilibrated to each new temperature before performing broadband measurements used to calculateelectrical conductivity.
Samples containing either CH4 hydrate or ice were recovered for cryogenic scanning electron microscope(cryo-SEM) analysis. To recover samples with CH4 hydrate, the vessel was cooled sufficiently with liquidnitrogen (LN) prior to depressurization. CH4 hydrate samples were then stored and transported in LN to acryo-preparation station and imaging stage (Gatan Alto Model 2100) that in turn attached directly to aLEO982 field emission SEM. Samples were cleaved under vacuum in the preparation station to producefresh surfaces uncontaminated by water condensation and then transferred under vacuum into the SEM
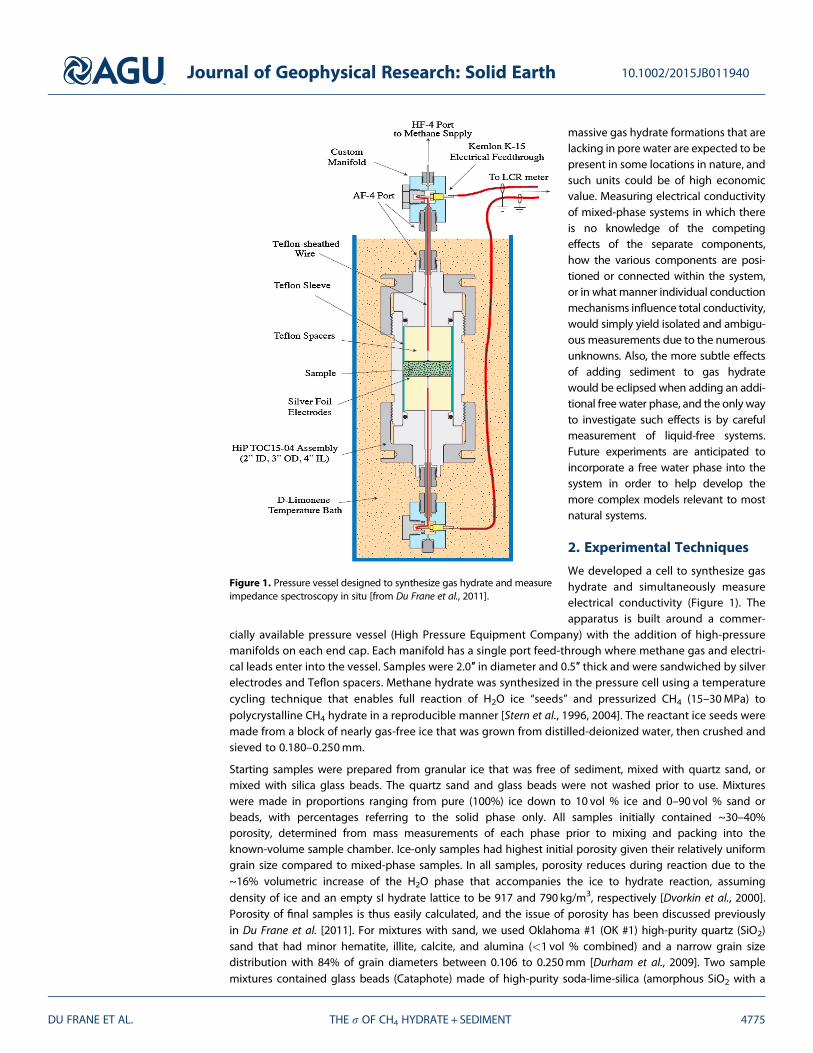
Figure 2. Cryo-SEM images of CH4 hydrate and hydrate-sediment mixtures. (a and b) Single-phase polycrystalline CH4hydrate has ~20% porosity, grain size diameters of 10–80 μm, and fully dense crystals as-grown (Figure 2a, inset) thatdevelop surface pitting with time in the high-vacuum SEM column, resulting in a nanoporous or mesoporous surfacetexture (Figure 2b, inset). (c) Approximately 55:45 vol % hydrate:sand (run 4) and (d) ~55:45 vol % ice:sand (run 8).Significant annealing of the ice grains accompanies dissociation at our test conditions (compare insets in Figures 2c and 2d),but there is no significant migration of sand. (e) Approximately 55:45 vol % hydrate:beads sample (run 9). SEM shows uniformdistribution of components in mixed-phase samples (Figures 2c–2e) as well as similarities in the nature of the grain contacts,establishing a basis for comparison of conductivity measurements. The pitting and more porous appearance of Figure 2eis a result of sublimation of gas hydrate under high-vacuum conditions in the FE-SEM column, which is accentuated insamples with higher sediment content due to higher surface-to-volume ratio of the hydrate phase [Stern et al., 2004].(f) Approximately 10:90 vol% ice:sand (run 10) with connecting ice expanded in the inset. In Figures 2d and 2f, the samples aremore porous than Figures 2a–2c because the hydrate-to-ice dissociation reaction results in a 16% volumetric reduction of theH2O phase, as discussed in text.
Journal of Geophysical Research: Solid Earth 10.1002/2015JB011940
DU FRANE ET AL. THE σ OF CH4 HYDRATE + SEDIMENT 4777
column. A thermocouple embedded in the SEM sample stage recorded temperature throughout the imagingprocess. Imaging was conducted at temperature <�185°C, vacuum <10�6 kPa, and accelerating voltage≤2 kV. Further details of cryo-SEM imaging techniques and instrumentation are given in Stern et al. [2004].Sample material was destroyed in the process of SEM imaging due to the high-vacuum environment.
3. Results3.1. Cryogenic Scanning Electron Microscopy
Cryo-SEM images verified that the synthesized gas hydrate was fully reacted polycrystalline CH4 hydrate(Figure 2). Sample porosity is greatly reduced in the final material due to the volumetric increaseaccompanying the ice to gas hydrate reaction, resulting in primarily isolated macropores (Figure 2a).Images verified that grain-scale characteristics were, in general, reproducible across all samples, withindividual grains ranging from 10 to 80μm in diameter. CH4 hydrate grains were fully dense as grown(Figure 2a and inset), but surface pitting developed within several minutes of imaging in the high-vacuumcolumn (Figure 2b and inset). OK#1 and glass bead sediments were uniformly distributed in mixedsamples (Figures 2c–2f), thereby establishing a basis for comparison of σ measurements between mixed-phase runs. Despite annealing of ice grains accompanying dissociation, SEM images also indicated nosignificant migration of sediments during any given run, thus enabling comparison of σ measurementsbefore, during, and after dissociation within a single run. The hydrate or ice grains appear to be wellconnected in all samples except for the one with 10:90 vol % ice:sand (Figure 2f). We were unable toevaluate subtle textural changes due to the effects of sublimation during cryo-SEM analyses. It has been
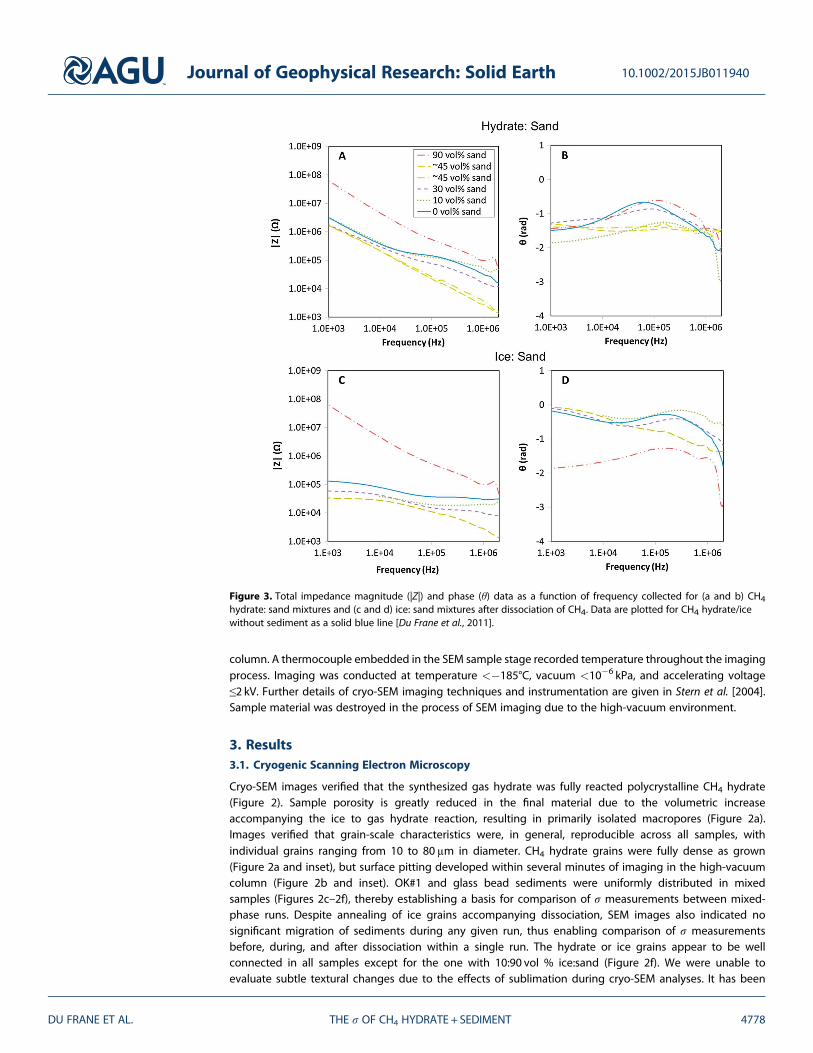
Figure 3. Total impedance magnitude (|Z|) and phase (θ) data as a function of frequency collected for (a and b) CH4hydrate: sand mixtures and (c and d) ice: sand mixtures after dissociation of CH4. Data are plotted for CH4 hydrate/icewithout sediment as a solid blue line [Du Frane et al., 2011].
Journal of Geophysical Research: Solid Earth 10.1002/2015JB011940
DU FRANE ET AL. THE σ OF CH4 HYDRATE + SEDIMENT 4778
previously established that our forma-tion techniques result in samples withconsistent texture, having undergonemultiple cycles through the ice pointwith lengthy holds at the peak tempera-tures well above 0°C that allows samplesto anneal [Stern et al., 2004]. The textureof the methane hydrate in samplesmixed with sand also resembles texturesobserved in at least some hydrate-bearing sands retrieved from nature,such as from the Alaska North Slope[Stern et al., 2011].
3.2. Electrical Conductivity
The H2O was verified to be fully reactedto CH4 hydrate within several tempera-ture cycles, consistent with previousstudies [e.g., Stern et al., 1996, 2004].Impedance spectra were then collectedon samples while heating incrementallyfrom �15 to 15°C, with samples under-going 7–16 temperature cycles totalduring the full run (Table 1). At eachtemperature increment, samples typi-
cally required ~1 h to reequilibrate before electrical conductivity could be measured due to the low thermalconductivity/ diffusivity of the samples [e.g., Waite et al., 2007].
The addition of sediment complicated the interpretation of impedance spectra of the CH4 hydrate. Equivalentcircuit modeling of these spectra was not feasible due to the noisiness of impedancemagnitude datameasuredat frequencies >500 kHz and <1 kHz (Figure 3a). Equivalent circuit modeling by Du Frane et al. [2011] forsediment-free samples indicated that the impedance magnitude associated with the maximum phase anglecould be used to avoid systemic effects due to the electrodes and their leads (see Figure 3a in Du Frane et al.[2011]). For CH4 hydrate mixed with sediments, the phase angle data show maxima at intermediatefrequencies on the order of ~100 kHz similar to pure CH4 hydrate samples (Figure 3b). This was also the caseafter dissociation of CH4 hydrate to ice (Figures 3c and 3d). Based on these observations, we similarly usedphase angle to determine the correct frequency to calculate electrical conductivity.
Electrical conductivity of mixtures generally exhibited exponential dependence on temperature both afterCH4 hydrate formation, and after dissociation to ice, which is typical for electrolytic materials. We fit datausing an Arrhenius expression,
σ Tð Þ ¼ σ0e�Ea=RT (1)
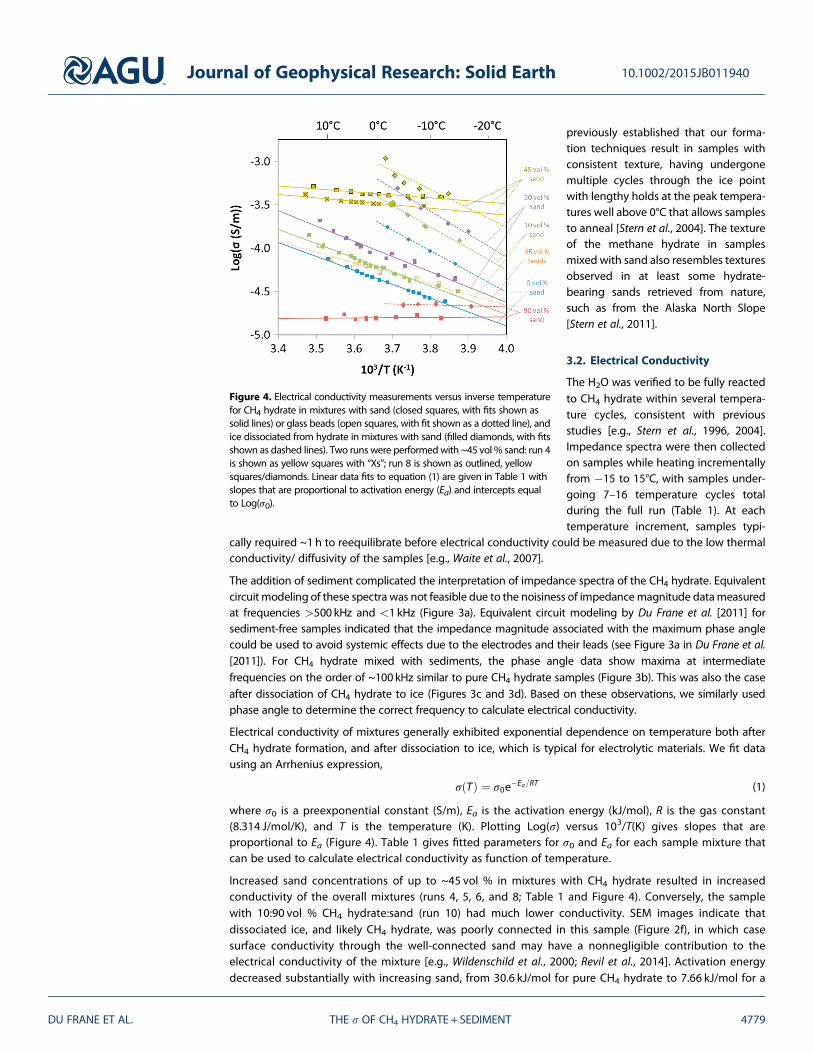
where σ0 is a preexponential constant (S/m), Ea is the activation energy (kJ/mol), R is the gas constant(8.314 J/mol/K), and T is the temperature (K). Plotting Log(σ) versus 103/T(K) gives slopes that areproportional to Ea (Figure 4). Table 1 gives fitted parameters for σ0 and Ea for each sample mixture thatcan be used to calculate electrical conductivity as function of temperature.
Increased sand concentrations of up to ~45 vol % in mixtures with CH4 hydrate resulted in increasedconductivity of the overall mixtures (runs 4, 5, 6, and 8; Table 1 and Figure 4). Conversely, the samplewith 10:90 vol % CH4 hydrate:sand (run 10) had much lower conductivity. SEM images indicate thatdissociated ice, and likely CH4 hydrate, was poorly connected in this sample (Figure 2f), in which casesurface conductivity through the well-connected sand may have a nonnegligible contribution to theelectrical conductivity of the mixture [e.g., Wildenschild et al., 2000; Revil et al., 2014]. Activation energydecreased substantially with increasing sand, from 30.6 kJ/mol for pure CH4 hydrate to 7.66 kJ/mol for a
Figure 4. Electrical conductivity measurements versus inverse temperaturefor CH4 hydrate in mixtures with sand (closed squares, with fits shown assolid lines) or glass beads (open squares, with fit shown as a dotted line), andice dissociated from hydrate in mixtures with sand (filled diamonds, with fitsshown as dashed lines). Two runs were performedwith ~45 vol % sand: run 4is shown as yellow squares with “Xs”; run 8 is shown as outlined, yellowsquares/diamonds. Linear data fits to equation (1) are given in Table 1 withslopes that are proportional to activation energy (Ea) and intercepts equalto Log(σ0).
Journal of Geophysical Research: Solid Earth 10.1002/2015JB011940
DU FRANE ET AL. THE σ OF CH4 HYDRATE + SEDIMENT 4779
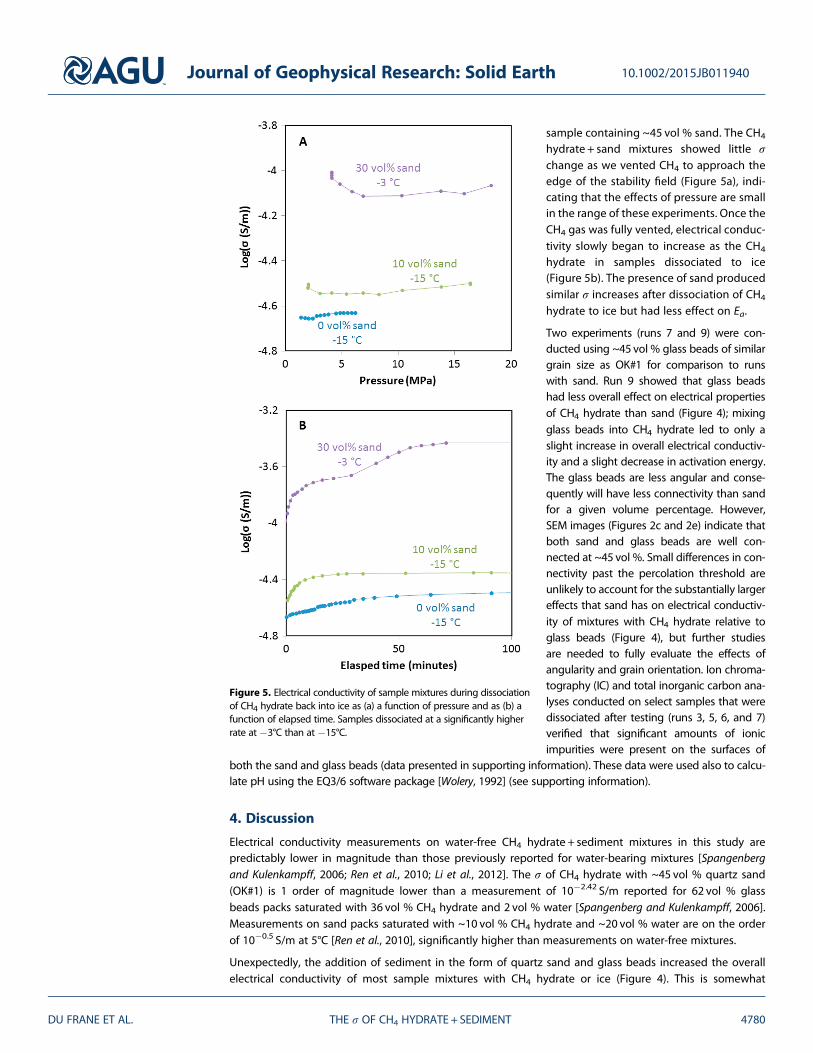
sample containing ~45 vol % sand. The CH4
hydrate + sand mixtures showed little σchange as we vented CH4 to approach theedge of the stability field (Figure 5a), indi-cating that the effects of pressure are smallin the range of these experiments. Once theCH4 gas was fully vented, electrical conduc-tivity slowly began to increase as the CH4
hydrate in samples dissociated to ice(Figure 5b). The presence of sand producedsimilar σ increases after dissociation of CH4
hydrate to ice but had less effect on Ea.
Two experiments (runs 7 and 9) were con-ducted using ~45 vol % glass beads of similargrain size as OK#1 for comparison to runswith sand. Run 9 showed that glass beadshad less overall effect on electrical propertiesof CH4 hydrate than sand (Figure 4); mixingglass beads into CH4 hydrate led to only aslight increase in overall electrical conductiv-ity and a slight decrease in activation energy.The glass beads are less angular and conse-quently will have less connectivity than sandfor a given volume percentage. However,SEM images (Figures 2c and 2e) indicate thatboth sand and glass beads are well con-nected at ~45 vol %. Small differences in con-nectivity past the percolation threshold areunlikely to account for the substantially largereffects that sand has on electrical conductiv-ity of mixtures with CH4 hydrate relative toglass beads (Figure 4), but further studiesare needed to fully evaluate the effects ofangularity and grain orientation. Ion chroma-tography (IC) and total inorganic carbon ana-lyses conducted on select samples that weredissociated after testing (runs 3, 5, 6, and 7)verified that significant amounts of ionicimpurities were present on the surfaces of
both the sand and glass beads (data presented in supporting information). These data were used also to calcu-late pH using the EQ3/6 software package [Wolery, 1992] (see supporting information).
4. Discussion
Electrical conductivity measurements on water-free CH4 hydrate + sediment mixtures in this study arepredictably lower in magnitude than those previously reported for water-bearing mixtures [Spangenbergand Kulenkampff, 2006; Ren et al., 2010; Li et al., 2012]. The σ of CH4 hydrate with ~45 vol % quartz sand(OK#1) is 1 order of magnitude lower than a measurement of 10�2.42 S/m reported for 62 vol % glassbeads packs saturated with 36 vol % CH4 hydrate and 2 vol % water [Spangenberg and Kulenkampff, 2006].Measurements on sand packs saturated with ~10 vol % CH4 hydrate and ~20 vol % water are on the orderof 10�0.5 S/m at 5°C [Ren et al., 2010], significantly higher than measurements on water-free mixtures.
Unexpectedly, the addition of sediment in the form of quartz sand and glass beads increased the overallelectrical conductivity of most sample mixtures with CH4 hydrate or ice (Figure 4). This is somewhat
Figure 5. Electrical conductivity of sample mixtures during dissociationof CH4 hydrate back into ice as (a) a function of pressure and as (b) afunction of elapsed time. Samples dissociated at a significantly higherrate at �3°C than at �15°C.
Journal of Geophysical Research: Solid Earth 10.1002/2015JB011940
DU FRANE ET AL. THE σ OF CH4 HYDRATE + SEDIMENT 4780
counterintuitive because quartz sand and silica beads by themselves have low electrical conductivity. Theone exception was the mixture with 90 vol % sand that had significantly lower electrical conductivity thanother sample mixtures. Ice appeared poorly connected within this mixture in SEM images (Figure 2f),suggesting that this high concentration of sand exceeds the percolation threshold (i.e., the concentrationrequired for connectivity) for both the dissociated ice and CH4 hydrate. This indicates that the CH4 hydrateor ice grains provided the primary path for current when connected through sample mixtures, althoughthe presence of sediment raised total electrical conductivity. The increase to electrical conductivity by thepresence of ~45 vol % glass beads was significant (run 9), but substantially lower than the effects ofnaturally weathered quartz sand (Figure 4).
Electrical conductivity was likely enhanced in the CH4 hydrate grains by impurities that were introduced fromweathered surfaces of the sand. Ionic doping of the CH4 hydrate grains could explain why activation energiesdecreased with increased sand concentrations. The activation energy contains two physical phenomena: anincrease in defect mobility with temperature and an increase in defect population with temperature. Theseimpurities are likely to have low mobility but are charge-compensated by protonic defects that haverelatively high mobility. When there are few to no impurities present, protonic defects are likely to bethermally induced in the gas hydrate structure, which would make electrical conductivity stronglydependent on temperature. If the structure is doped with impurities there could be a population ofprotonic defects induced to maintain charge balance that are relatively insensitive to temperature. Dopingwould cause electrical conductivity to increase substantially with a population of charge carriers that maskthose that are thermally induced, yielding electrical conductivity with less temperature dependence, i.e.,lower activation energy. The electrical conductivity of CH4 hydrate + sand mixtures was substantiallyhigher than pure CH4 hydrate (Figure 4), which indicates that some impurities from sand can be includedin CH4 hydrate. Probable candidates include ions that were found in higher concentrations on the surfacesof the sand compared with those on the surface of glass beads: K+, Ca2+, Mg2+, NH4
+, Cl�, and SO42�
(Table S1 in the supporting information). Most impurities that are dissolved in water become excludedduring ice crystallization, with the exception of a few acids (HF and HCl), ammonia (NH3), alkalis (KOH andNaOH), and their derivatives (NH4F or KCl) that drastically change the protonic carrier concentration [e.g.,Petrenko and Whitworth, 1999]. KOH inclusion into THF hydrate has also been demonstrated to triggerformation of charge carriers, Bjerrum and protonic defects, and could also affect mobilities of other pointdefects [Nelson et al., 2013]. If CH4 hydrate behaves similar to ice, then the sand may have contributedKOH and its derivative KCl during synthesis, which is consistent with IC detection of both K+ water meltedfrom samples containing sand (runs 5 and 6), but not in those containing glass beads (run 7) or in thosethat did contain any sediment (run 3) (Table S1). It would also be expected that NaCl and Na2CO3 wouldbe excluded during its crystallization. Inclusion of K+ and Cl� is thus one possible explanation for whatcaused the observed doping effect on the electrical conductivity of CH4 hydrate-sand mixtures.
A first-order model of the doping effect on the electrical conductivity of CH4 hydrate and ice caused byimpurities from sand is presented in section S2 in the supporting information. The model includes asecond conductivity term that is proportional to sand concentration and assumes a simple parallel mixinglaw relationship. We were able to obtain excellent fits to data for sample mixtures with 10 or 30 vol % sandbut not for those with ~45 or 90 vol % sand. This is because mixing laws are typically incapable ofexpressing behavior across percolation thresholds. If impurities do not move far from the sand surface,CH4 hydrate/sand interfaces may have higher electrical conductivity than the bulk conductivity of CH4
hydrate grains. If both CH4 hydrate and sand are interconnected, then interfaces between the two phaseswill also be interconnected possibly creating a high conductivity path throughout mixtures. This couldexplain the large increase in electrical conductivity and decrease in activation energy when increasing theamount of sand in mixtures from 30 to ~45 vol %. Therefore, the model is only applicable to scenarioswhere hydrate/ice is well connected in mixtures, but the sediment is not, and should be consideredpreliminary at best given the limited range of compositions examined here.
The results of this study imply that sediment composition, in addition to sediment amount and distribution,will be a critical factor in determining bulk electrical conductivity of gas hydrates, at least in sections devoid ofpore water. In nature, impurities could be acquired from sediments, organic material, or pore water itself.While gas hydrate formation is typically viewed as a purification process—a promising aspect that can
Journal of Geophysical Research: Solid Earth 10.1002/2015JB011940
DU FRANE ET AL. THE σ OF CH4 HYDRATE + SEDIMENT 4781
potentially be exploited for desalination of highly saline wastewater into potable water [Cha and Seol, 2013]—our results suggest that even trace amounts of impurities incorporated within the CH4 hydrate latticeproduce substantial effects on the overall electrical properties of CH4 hydrate. The OK#1 and glass beadswere chosen for this study because they are regarded to have high purity in comparison to most sedimentand facilitated our attempt to study the fundamental contributions of individual conduction mechanismsto total conductivity. In contrast, sediments found in permafrost and marine settings have the potential tocontribute different and larger concentrations of impurities. Pore water may also contribute impurities inamounts substantial enough to affect the electrical properties, although this effect would likely be maskedin comparison with the effect of the pore water itself. For example, seawater contains roughly 400mg/L ofK+ [Webb, 1939], which is within the range of measured values for water melted from the postrun samples(Table S1). Physical and chemical conditions will also play a role in what concentrations of impurities areincluded during gas hydrate formation. Chemical transfer of ionic impurities must be carefully consideredto accurately determine the electrical conductivity of gas hydrate formations in marine sediments.
5. Conclusions
The electrical conductivity of liquid-free CH4 hydrate-sediment mixtures is highly dependent on compositionand temperature. Increasing sand concentrations up to 45 vol % increased the overall electrical conductivityof mixtures by as much as an order of magnitude at 0°C. The overall electrical conductivity of mixturesplummeted in a sample containing a sufficiently high sediment concentration (90 vol %) that crossed apercolation threshold, such that the CH4 hydrate was poorly connected. This observation providesevidence that CH4 hydrate (and ice after dissociation) is the primary current path within mixtures.
Ionic impurities from sand caused a doping effect on the electrical properties of CH4 hydrate (and ice). This isconsistent with the observation that increasing sand content in mixtures resulted in higher-magnitudeelectrical conductivity and less temperature dependence, i.e., lower activation energy values. Over therange of geologically relevant temperatures from �5 to 15°C, the overall electrical conductivity of CH4
hydrate mixtures with ≤30 vol % sand increased by ~3 times. Mixtures with ≥45 vol % CH4 hydrateexhibited almost no change in conductivity over that same range. Most of the ionic impurities associatedwith the glass beads appear to have been excluded during CH4 hydrate formation (Na+, CO3
2�, andHCO3
�), while at least some of the ionic impurities more strongly associated with the sand grains wereincluded (K+, Ca2+, Mg2+, NH4
+, Cl�, and SO42�).
The addition of sediments to samples is themethodical second step in the evolution of this work, following ourinitial measurements of pure, end-member CH4 hydrate. While these results can only be loosely applied to “dry”systems with essentially no pore water present, they are necessary experiments to increase the fundamentalunderstanding of individual conduction mechanisms and the properties of mixtures in these systems. Futuretests involving the controlled addition of liquid water with varying salinities will be necessary for furtherapplication to complex natural systems.
ReferencesArchie, G. E. (1942), The electrical resistivity log as an aid in determining some reservoir characteristics, Trans. Am. Inst. Min. Metall. Pet. Eng.,
146, 54–62.Boswell, R., and T. Collett (2011), Current perspectives on gas hydrate resources, Energy Environ. Sci., 4, 1206–1215.Cha, J.-H., and Y. Seol (2013), Increasing gas hydrate formation temperature for desalination of high salinity produced water with secondary
guests, ACS Sustainable Chem. Eng., 1(10), 1218–1224.Collett, T. (2002), Energy resource potential of natural gas hydrate, Am. Assoc. Pet. Geol. Bull., 86, 1971–1992.Collett, T. S., and J. W. Ladd (2000), Detection of gas hydrate with downhole logs and assessment of gas hydrate concentrations (saturations)
and gas volumes on the Blake Ridge with electrical resistivity log data, Proc. Ocean Drill. Program Sci. Results, 164, 179–191.Du Frane W. L., L. A. Stern, K. A. Weitemeyer, S. Constable, J. C. Pinkston, and J. J. Roberts (2011), Electrical properties of polycrystalline
methane hydrate, Geophys. Res. Lett., 38, L09313, doi:10.1029/2011GL047243.Durham, W. B., A. V. Pathare, L. A. Stern, and H. J. Lenferink (2009), Mobility of icy sand packs, with application to Martian permafrost, Geophys.
Res. Lett., 36, L23203, doi:10.1029/2009GL040392.Dvorkin, J., M. B. Helgerud, W. F. Waite, S. H. Kirby, and A. Nur (2000), Introduction to physical properties and elasticity models, in Natural Gas
Hydrate In Oceanic and Permafrost Environments, edited by M. D. Max, pp. 245–260, Kluwer Acad., Dordrecht, Netherlands.Edwards, R. N. (1997), On the resource evaluation of marine gas hydrate deposits using sea-floor transient electric dipole-dipole methods,
Geophysics, 62(1), 63–74.
AcknowledgmentsThe authors thank S. Roberts (LLNL) forassisting with ion chromatographymeasurements; W. Durham (MIT) forproviding the OK#1 sand used in thisstudy; J. Pinkston, S. Kirby, D. Lockner,W. Waite, and A. Hunt (U. S. GeologicalSurvey) for their helpful discussions,advice, and reviews; and J. Lemire(Scripps Institution of Oceanography)for the help with the cell fabrication anddesign. Data supporting Figures 3–5 areavailable in the supporting information.Support for this work was provided byDOE contract DE-NT0005668 awardedto S. Constable (SIO) and InteragencyAgreement DE-NT0006147 between theUSGS Gas Hydrate Project and the DOE’sMethane Hydrate R&D Program.Prepared by LLNL under contractDE-AC52-07NA27344. The use of trade,product, industry, or firm names in thisreport is for descriptive purposes onlyand does not constitute endorsement bythe U.S. Geological Survey or the U.S.Government.
Journal of Geophysical Research: Solid Earth 10.1002/2015JB011940
DU FRANE ET AL. THE σ OF CH4 HYDRATE + SEDIMENT 4782
Ellis, M. H., T. A. Minshull, M. C. Sinha, and A. I. Best (2008), Joint seismic/electrical effective medium modelling of hydrate-bearing marinesediments and an application to the Vancouver Island margin, in Proceedings of the 6th International Conference on Gas Hydrates,5586–[12p], Vancouver, Canada.
Evans, R. L. (2007), Using CSEM techniques to map the shallow section of seafloor: From the coastline to the edges of the continental slope,Geophysics, 72(2), WA105–WA116.
Glover, P. W. J., M. J. Hole, and J. Pous (2000), A modified Archie’s law for two conducting phases, Earth Planet. Sci. Lett., 180, 369–383.Hashin, Z., and S. Shtrikman (1962), A variational approach to the theory of effective magnetic permeability of multiphase materials, J. Appl.
Phys., 33, 3125–3131.Hornbach, M. J., W. S. Holbrook, A. R. Gorman, K. L. Hackwith, D. Lizarralde, and I. Pecher (2003), Direct seismic detection of methane hydrate
on the Blake Ridge, Geophysics, 68(1), 92–100.Kneafsey, T. J., Y. Seol, A. Gupta, and L. Tomutsa (2011), Permeability of laboratory-formed methane-hydrate-bearing sand: measurements
and observations using X-ray computed tomography, SPE J., 16(1), 78–94.Kvenvolden, K., and T. Lorenson (2001), The global occurrence of natural gas hydrate, in Natural Gas Hydrates: Occurrence, Distribution, and
Detection, Geophys. Monogr. Ser., vol. 124, edited by C. Paull and W. Dillon, pp. 87–98.Kvenvolden, K. A. (1999), Potential effects of gas hydrate on human welfare, Proc. Natl. Acad. Sci. U.S.A., 96(7), 3420–3426.Lee, J. Y., J. C. Santamarina, and C. Ruppel (2010), Parametric study of the physical properties of hydrate-bearing sand, silt, and clay
sediments: 1. Electromagnetic properties, J. Geophys. Res., 115, B11104, doi:10.1029/2009JB006669.Li, F. G., C. Y. Sun, S. L. Li, G. J. Chen, X. Q. Guo, L. Y. Yang, H. Pan, S. Li, and K. Zhang (2012), Experimental studies on the evolvement of
electrical resistivity during methane hydrate formation in sediments, Energy Fuels, 26, 6210–6217.Maslin, M., M. Owen, R. Betts, S. Day, T. Dunkley Jones, and A. Ridgwell (2010), Gas hydrates: Past and future geohazard?, Proc. R. Soc. A,
368(1919), 2369–2393.Milkov, A. V. (2004), Global estimates of hydrate-bound gas in marine sediments: How much is really out there?, Earth Sci. Rev., 66(3–4),
183–197.Nelson, H., S. Schildmann, A. Nowaczyk, C. Gainaru, B. Geil, and R. Bohmer (2013), Small-angle water reorientations in KOH doped hexagonal
ice and clathrate hydrates, Phys. Chem. Chem. Phys., 15, 6355–6367.NIIR Board of Consultants & Engineers (2005), The Complete Book on Glass and Ceramics Technology, 624 pp., Asia Pacific Business Press,
New Dehli.Petrenko, V. F., and R. W. Whitworth (1999), Physics of Ice, Oxford Univ. Press, New York.Ren, S. R., Y. Liu, and W. Zhang (2010), Acoustic velocity and electrical resistance of hydrate bearing sediments, J. Petrol. Sci. Eng., 70, 52–56.Revil, A., P. Kessouri, and C. Torres-Verdín (2014), Electrical conductivity, induced polarization, and permeability of the Fontainebleau
sandstone, Geophysics, 79(5), D301–D318.Roberts, J. J. (2002), Electrical properties of microporous rock as a function of saturation and electrical conductivity, J. Appl. Phys., 91(3),
1687–1694.Roberts, J. J., and J. A. Tyburczy (1991), Frequency-dependent electrical-properties of polycrystalline olivine compacts, J. Geophys. Res.,
96(B10), 16,205–16,222, doi:10.1029/91JB01574.Roberts, J. J., and J. A. Tyburczy (1993), Impedance spectroscopy of single and polycrystalline olivine: Evidence for grain-boundary transport,
Phys. Chem. Miner., 20(1), 19–26.Ruppel, C. (2007), Tapping methane hydrates for unconventional natural gas, Elements, 3(3), 193–199.Schwalenberg, K., E. Willoughby, R. Mir, and R. N. Edwards (2005), Marine gas hydrate electromagnetic signatures in Cascadia and their
correlation with seismic blank zones, First Break, 23, 57–63.Sloan, E., and C. Koh (2007), Clathrate Hydrates of Natural Gases, 3rd ed., p. 721, Taylor and Francis, CRC Press, Boca Raton, Fla.Spangenberg, E., and J. Kulenkampff (2006), Influence of methane hydrate content on electrical sediment properties, Geophys. Res. Lett., 33,
L24315, doi:10.1029/2006GL028188.Stern, L. A., S. H. Kirby, and W. B. Durham (1996), Peculiarities of methane clathrate hydrate formation and solid-state deformation, including
possible superheating of water ice, Science, 273(5283), 1843–1848.Stern, L. A., S. H. Kirby, S. Circone, and W. B. Durham (2004), Scanning electron microscopy investigations of laboratory-grown gas clathrate
hydrates formed from melting ice, and comparison to natural hydrates, Am. Mineral., 89(8–9), 1162–1175.Stern, L. A., T. D. Lorenson, and J. C. Pinkston (2011), Gas hydrate characterization and grain-scale imaging of recovered cores from the Mount
Elbert Gas Hydrate Stratigraphic Test Well, Alaska North Slope, Mar. Pet. Geol., 28, 394–403.Waite, W. F., L. A. Stern, S. H. Kirby, W. J. Winters, and D. H. Mason (2007), Simultaneous determination of thermal conductivity, thermal
diffusivity and specific heat in sI methane hydrate, Geophys. J. Int., 169(2), 767–774.Wallmann, K., E. Pinero, E. Burwicz, M. Haeckel, C. Hensen, A. Dale, and L. Ruepke (2012), The global inventory of methane hydrate in marine
sediments: A theoretical approach, Energies, 5, 2449–2498.Webb, D. A. (1939), The sodium and potassium content of sea water, J. Exp. Biol., 16, 178–183.Weitemeyer, K. A., S. C. Constable, K. W. Key, and J. P. Behrens (2006), First results from a marine controlled-source electromagnetic survey to
detect gas hydrates offshore Oregon, Geophys. Res. Lett., 33, L03304, doi:10.1029/2005GL024896.Weitemeyer, K. A., S. Constable, and A. M. Tréhu (2011), A marine electromagnetic survey to detect gas hydrate at Hydrate Ridge, Oregon,
Geophys. J. Int., doi:10.1111/j.1365-246X.2011.05105.x.Wildenschild, D., J. J. Roberts, and E. D. Carlberg (2000), On the relationship betweenmicrostructure and electrical and hydraulic properties of
sand-clay mixtures, Geophys. Res. Lett., 27(19), 3085–3088, doi:10.1029/2000GL011553.Wolery, T. W. (1992), EQ3/6, a software package for geochemical modeling of aqueous systems; UCRL MA-110662-PT-1; Lawrence Livermore
National Laboratory, Livermore, Calif.Zhang, Z. J., and G. A. McMechan (2006), Elastic inversion for distribution of gas hydrate, with emphasis on structural controls, J. Seismic
Explor., 14(4), 349–370.
Journal of Geophysical Research: Solid Earth 10.1002/2015JB011940
DU FRANE ET AL. THE σ OF CH4 HYDRATE + SEDIMENT 4783


![Hydrate thermal dissociation behavior and dissociation enthalpies in methane … · mole basis, methane hydrate consists of 85.69(± 0.14)% water and 14.31(± 0.14)% methane [2].](https://static.documents.pub/doc/80x56/5fbd4df89eb682309316b186/hydrate-thermal-dissociation-behavior-and-dissociation-enthalpies-in-methane-mole.jpg)

