66
ELTIS Training on Environmental Zones Krakow 2009 Mathias Winter, TU Dresden, Verkehrsökologie, D- 01062 Dresden [email protected] TU DRESDEN Lehrstuhl für Verkehrsökologie
| Date post: | 26-Dec-2015 |
| Category: |
Documents |
| Upload: | julie-french |
| View: | 217 times |
| Download: | 1 times |

ELTIS Training on Environmental Zones
Krakow 2009
Mathias Winter, TU Dresden, Verkehrsökologie, D- 01062 [email protected]
TU DRESDENLehrstuhl für
Verkehrsökologie
Environmental zones
Workflow of this part:1. Definition
2. Legal context
3. Main pollutants
4. Environmental zones
Status in Europe
Examples
Planning and assessing EZ
Lessons learnt

Environmental zones – definition of the topic
Definition
spatial (and temporal) traffic restriction measures,
entry permissible to vehicles:
Combinations of these criteria are common.
fulfilling pre-defined emission standards,
of defined age,
that belong to defined vehicle categories (weight, length),
that utilise a given loading capacity (% of max. load).

Environmental zones – definition of the topic
Intention: usually to reduce the negative environmental effects of road traffic as a main cause of urban air pollution and noise.
Display/ signage: additional sign indicting which vehicles are effected / exempted from the driving ban.
Alternative terms:
Low emission zones (LEZ) (e.g. GE; IT, SE)
Green zones, clear zones (e.g. GB, London)
(Vehicle) access restriction zones (e.g. CZ)

Environmental zones – the context
Criteria for air quality assessment in Europe and air quality limit values were defined in “air quality framework directive” (directive 99/30/EC) and its daughter directives
Directive 1999/30/EC addressing SO2, NO2 / NOX, PM10 and lead
Directive 2000/69/EC addressing CO and benzene
Directive 2002/3/EC regulates ozone concentration in ambient air.
Replacement of these directives with directive 2008/50/EC on May 21th 2008.

Environmental zones – the context
Aims of the directives:
definition of targets for air quality
reduction ore avoidance of negative impacts on health and environment
consistent assessment of air quality in the member states
to rise awareness by establishing threshold values
increase of air quality if not satisfying
Most relevant emissions in ambient air of developed countries:
PM10; PM2,5 (1); NO2, Ozone; (SO2)

Environmental zones – the context
** Die Einhaltung des absoluten AEI-Schwellenwertes von 20 µg/m³ ist rechtlich bindend. Gleichzeitig wurde ein rechtlich nicht bindendes nationales Ziel für eine prozentuale Minderung des AEI-Indikators festgelegt, das ausgehend vom Niveau der Jahre 2008-2010 einen bis zu 20%-igen Rückgang der Expositionskonzentration bis 2020 vorsieht.
* AEI - Average Exposure Indicator- to be measured for urban background und als Mittelwerte für Gebiete und Ballungsräumen des gesamten Hoheitsgebiets eines Mitgliedstaats (aus Berlin 3 Messpunkte) ermittelt. Letztendlich gibt er die durchschnittliche Exposition von PM2,5 für die Bevölkerung in Deutschland an.
component type of limit value
average for threshold concentration
[µg/m³]
tolerable number of limit value
exciedances
originally to be obeyed until
possible extension of
deadline until
35 x / a(90.41- percentile)
limit value 1 year 40 -- 2005 2011target value 1 year 25 -- 2010limit value 1 year 25 -- 2015guideline value 1 year 20 -- 2020
obligation** regarding Average Exposure Indicator (AEI)*
gliding annual
average over 3 years
20 -- 2015
18 x / a(99.8- percentile)
limit value 1 year 40 -- 2010 2015
200 2010 2015
following the new air quality directive 2008/50/EG of May 21th 2008
fine particles (PM2,5)
nitrogen dioxide NO2
limit value 1 h
Selected limit- and target values to protect human health
fine particles (PM10)
limit value 24 h 50 2005 2011

Environmental zones – the context
In case of limit value accedence's municipalities are obliged to set up:
short term action plans or
medium and long term clean air plans,
Measures described in those plans need to be adequate to reduce pollution.
The air quality directive targets all pollution sources not transport in particular!

Environmental zones – the context
Possible measures vary considerably with regard to:
effectiveness,
costs,
political feasibility,
temporal and spatial scales.
Ideally, an optimal combination of short and long term actions should be implemented, aiming at both the short term reduction of overall air pollutant emissions and the long term improvement of air quality in areas where limit values are exceeded.
Environmental zones – the context
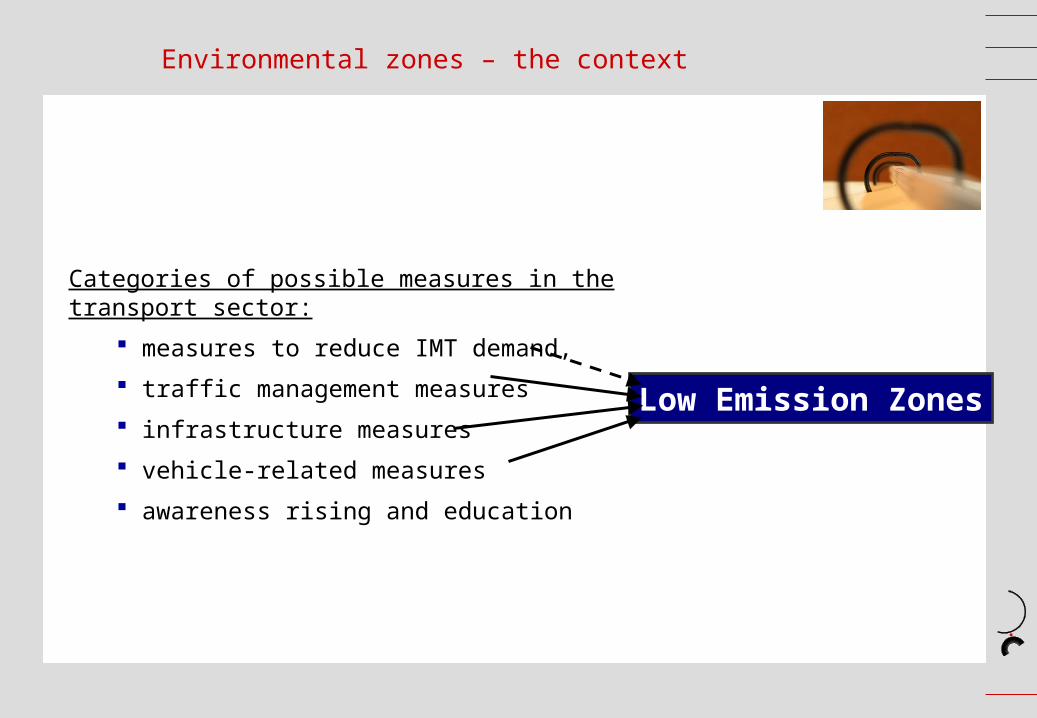
Low Emission Zones
Categories of possible measures in the transport sector:
measures to reduce IMT demand,
traffic management measures
infrastructure measures
vehicle-related measures
awareness rising and education

Environmental zones – the context
Traffic restrictions can be rather effective measures.
Their temporal and spatial extent can be defined by the municipalities by means of the set up clean air plans.
Legal framework and responsibilities vary considerably within the EU member states.

Environmental zones – status and future developments
Most current environmental zones target PM10.
Further key pollutants to be covered:
PM 2,5 (target value 2010,limit value 2015)
nitrogen dioxide (NO2) (limit value 2010)
ozone
(sulphur dioxide (SO2))
noise !!!

Key pollutants & environmental and health effects

Environmental zones – excursus urban key pollutants
Road accidents (only Germany) 5.800 killed people in 2006
2. Transport related noise (only Germany) ca. 20.000 premature deaths
1. Diesel particles (only Germany) 8.000 - 17.000 cardiopulmonary 1.100 - 2.200 lung cancer---------------------------------------------- 9.000 – 19.000 premature deaths (9 years of lifetime per affected person lost)

Particles

Excursus urban key pollutants - particles
Particles:
sum parameter,
complex physico-chemical mixture,
consists of primary emitted and secondary formulated particles (main share)
Air quality limit values and today's emission limits concern mass of particles.
Health effects correlate with surface and particle number!

Excursus urban key pollutants - particles
Health effects correlate with surface are and particle number!
[Atmospheric Environment, Volume 12, Withbby K.]

Excursus urban key pollutants - particles
Particles:
shorten life expectancy and
increase the number of premature deaths,
increase hospital admission and
increase emergency room visits.
Particularly dangerous is the fine fraction, that includes particles with a diameter up to 2.5 μm (PM2.5), as it penetrates more deeply into the lungs.
Both fine and ultrafine particles contribute to the observed health effects.
Pathways for health effects depend on structure, chemical composition and particle size.
Excursus urban key pollutants - particles
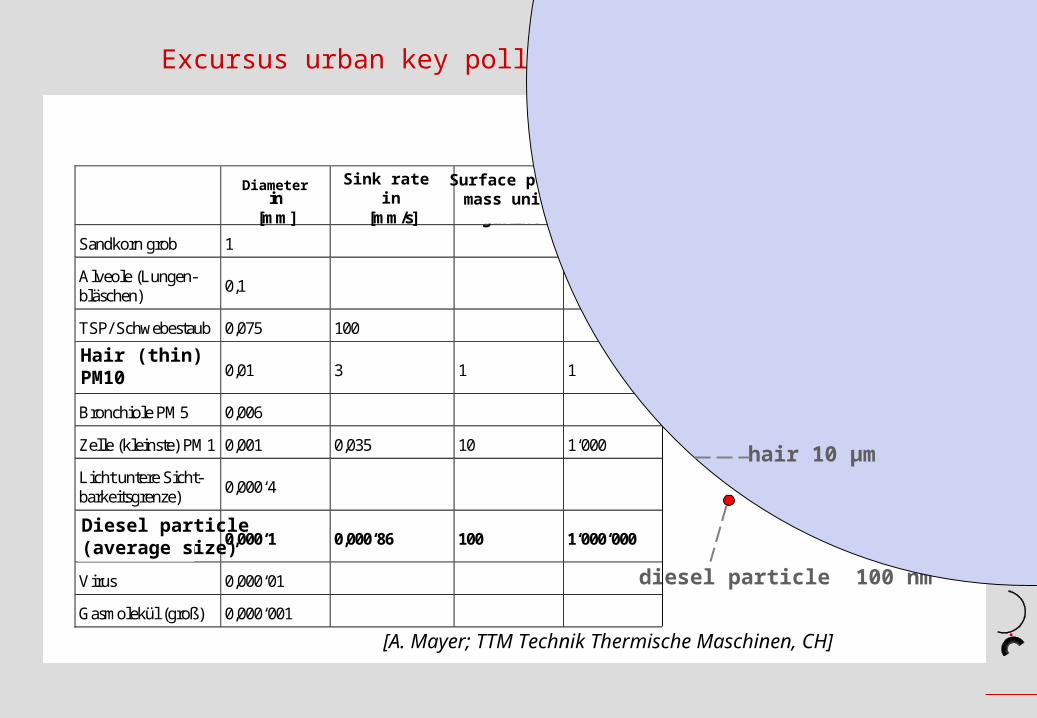
diesel particle 100 nm
[A. Mayer; TTM Technik Thermische Maschinen, CH]
Durchmesserin
[mm]
Sinkgeschwin-digkeit in
[mm/s]
Oberflächepro Einheits-
gewicht
Anzahl proEinheitsge-
wicht
Sandkorn grob 1
Alveole (Lungen-bläschen)
0,1
TSP/ Schwebestaub 0,075 100
Haar (feinstes)PM10
0,01 3 1 1
Bronchiole PM5 0,006
Zelle (kleinste) PM1 0,001 0,035 10 1‘000
Licht untere Sicht-barkeitsgrenze)
0,000‘4
Dieselpartikel(mittlere Größe)
0,000‘1 0,000‘86 100 1‘000‘000
Virus 0,000‘01
Gasmolekül (groß) 0,000‘001
Diameter
Hair (thin)PM10
Diesel particle(average size)
Sink rate in
Surface per mass unit
Number per mass unit
hair 10 μm

Excursus urban key pollutants - particles
sources of particle formulation
transformation of gaseous emissions
transport
industrial processes
agriculture/ mining
volcanic activity
combustion processeswind
sea spray biogenic sources
natural background
natural sources anthropogenic sources

Excursus urban key pollutants - particles
transport related particles
fuel combustion/thermal processes
abrasion resuspension
secondary primary ash particles
sooth particles
condensates

Excursus urban key pollutants - particles
transport exhaust emissions 42%(share diesel 95%)
transport abrasion and resuspension 38%
industry and power plants 5%heating and
solvents 6%
other sources 10%
Share of particle sources at a road side gauging station

Excursus urban key pollutants - particles
transport related PM10 – emissionsincluding abrasion and resuspension
city
35% - 55%
rest
street
50% - 85%
rest
spatial reference
country
17% - 32%
rest

Excursus urban key pollutants - particles
>100.000
725.000 years of life lost [Health report WHO 2002]
Premature death in Europe due to fine particles:

Nitrogen dioxide

Excursus urban key pollutants – nitrogen dioxide
Nitrogen dioxide
sources:
high temperature processes (fuel combustion)
catalytic reactions (diesel oxidation catalyst, catalytic coated DPT)
near ground ozone depletion
main source is road transport
NO2 is a strong irritant for all mucosa's and tissues (e.g. lung)
rising share in diesel exhaust gas emissions (OC, DPT)
no separate emissions limit value (included in NOx)
rising concentration in ambient air

Excursus urban key pollutants – nitrogen dioxide
Associated effect categories:
NO, NO2: Human toxicity, eutrophication, photochemical oxidant formation, acidification N2O: greenhouse effect, stratospheric ozone depletion
Indicator
Ecological danger
Contribution of transport
Target distance
Tendency of
immissions
Primary location of effects and reductions
Critical immission limit value
NOx +++ +++ ++ local, regional, global 30 µg/m3 *
NO ++ +++ ++ local, regional -
NO2 +++ +++ +++ local, regional 40g/m3 **
N2O +++ ++ ++ global -
* limit value aiming at protection of the vegetation according to directive 1999/30/EC, valid from 07-19-2001
** annual average value according to directive 1999/30/EC, valid from 01-01-2010
+++ very large ++ large + average
Assessment of nitrogen dioxide
New limit value to be abode by 2010!

Environmental zones – NO2 emission factors HDV and buses
Vehicle emission factors NO2 [IFEU etc.]
NO2-eission factors HDV
Euro IEURO II EURO III EURO IV
EURO IV DPF
EURO V DPF
0
0,5
1
1,5
2
2,5
3
3,5
4
4,5
NO
2-ei
ssio
ns
[g
/km
]
NO2-emission factors city buses
Euro I
EURO II
EURO II DPF
EURO III
EURO IVEURO V DPF
EURO IV DPF
EURO III DPF
0
0,5
1
1,5
2
2,5
3
3,5
4
4,5
NO
2-em
iss
ion
fa
kto
rs [
g/k
m]
typ of vehicle/ emission badge HDVemission standard/exhaust treatment Euro I EURO II EURO III EURO IV EURO IV DPF EURO V DPT
NO2 [g/km NO2 Äquivalent] 0,4 0,6 0,55 0,4 2,55 0,28
type of vehicle/ emission badge city busesemission standard/ exhaust treatment Euro I EURO II EURO II DPT EURO III EURO III DPT EURO IV EURO IV DPT EURO V DPT
NO2 [g/km NO2 Äquivalent] 0,65 0,92 2,28 0,75 4,25 0,57 2,83 0,3

Environmental zones – NO2 emission factors passenger cars
Vehicle emission factors NO2 [IFEU etc.]
NO2 Emissionsfaktoren für Diesel Pkw
<EURO I Euro I EURO II
EURO IIIEURO IV
EURO IV CDPF
EURO 5
EURO 6
0,000
0,050
0,100
0,150
0,200
0,250
NO
2 in
g/k
m
NO2-Emissionsfaktoren Otto-Pkw
<EURO I Euro I
EURO II EURO IIIEURO IV
0,000
0,050
0,100
0,150
0,200
0,250
NO
2 in
g/k
m
passenger cars gasoline<EURO I Euro I EURO II EURO III EURO IV
mean [g/km NO2 Äquivalent] 0,045 0,034 0,010 0,003 0,001
Emission badge passenger cars diesel Emission standard <EURO I Euro I EURO II EURO III EURO IV EURO IV CDPF EURO 5 EURO 6
mean [g/km NO2 Äquivalent] 0,110 0,105 0,110 0,159 0,140 0,195 0,100 0,020

Environmental zones
Environmental zones – restriction criteria
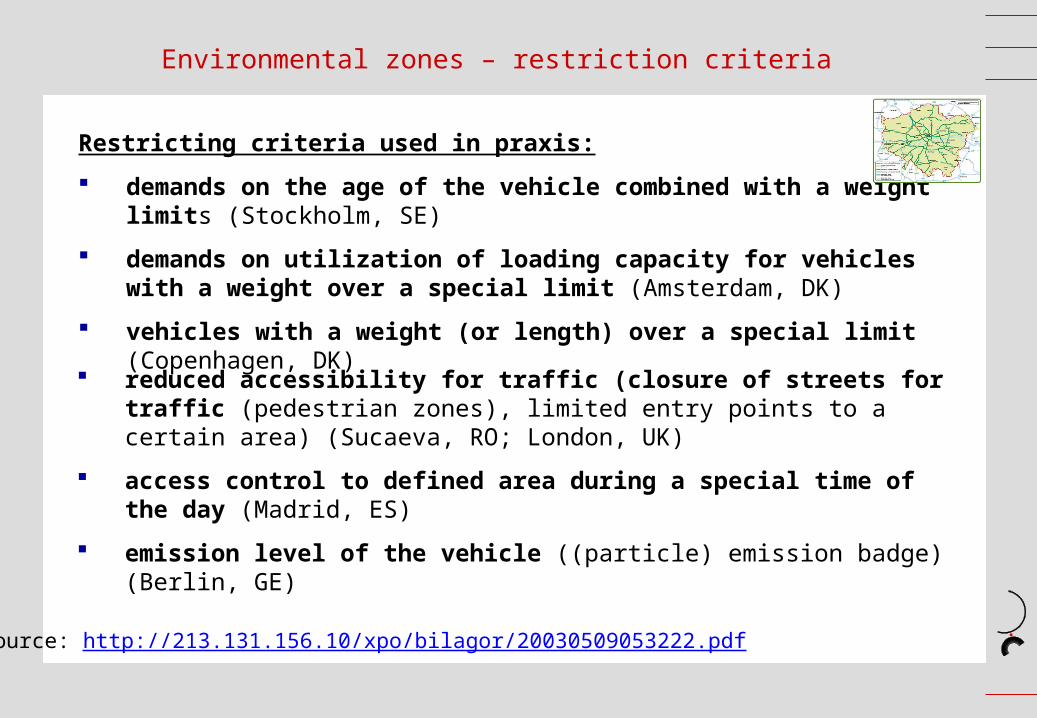
Restricting criteria used in praxis:
demands on the age of the vehicle combined with a weight limits (Stockholm, SE)
demands on utilization of loading capacity for vehicles with a weight over a special limit (Amsterdam, DK)
vehicles with a weight (or length) over a special limit (Copenhagen, DK)
Source: http://213.131.156.10/xpo/bilagor/20030509053222.pdf
reduced accessibility for traffic (closure of streets for traffic (pedestrian zones), limited entry points to a certain area) (Sucaeva, RO; London, UK)
access control to defined area during a special time of the day (Madrid, ES)
emission level of the vehicle ((particle) emission badge) (Berlin, GE)
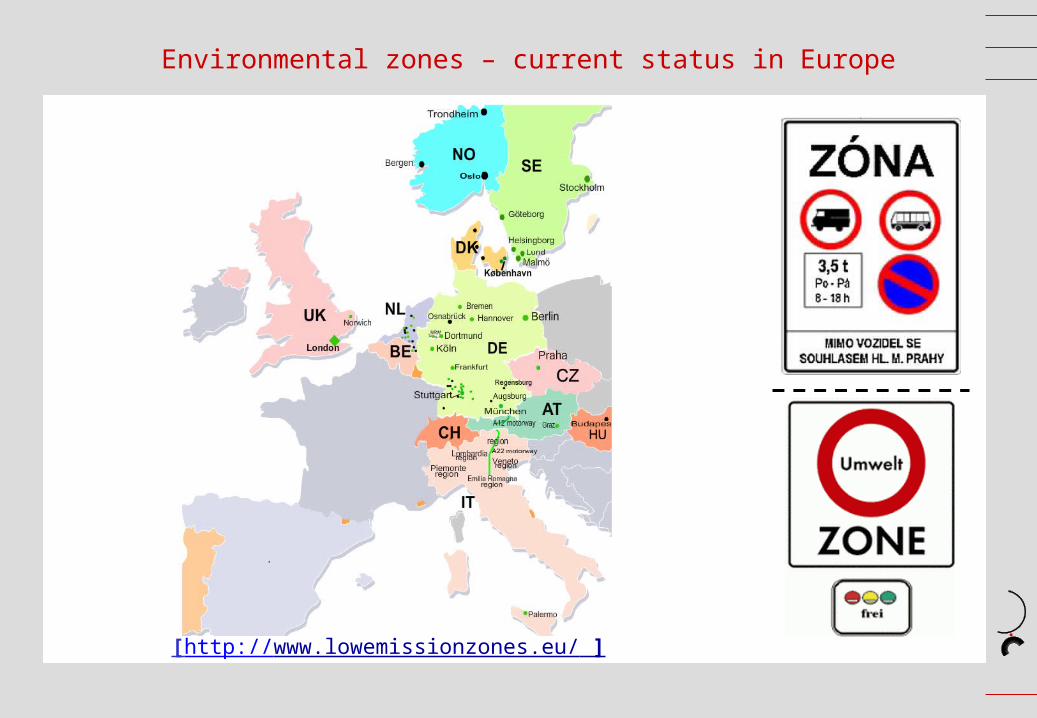
Environmental zones – current status in Europe
[http://www.lowemissionzones.eu/ ]

Environmental zones – current status in Europe
typ of restriction country example townsnumber of towns start date
1 weight (7,5t) Austria motorway (Tyrol) 1 20072 weight (3,5t) Czech Republic Praha 1 2008
3 weight (3,5t) DenmarkAalborg, Frederiksberg, Arhus, Copenhagen... 5 2008 - 2010
4 weight (3,5t) NetherlandsAmsterdam, Eindhoven, Maastricht, Rotterdam ... 19 as from 2007
5 weight (3,5t) Norway Bergen, Oslo, Trondheim 3 as from 2010
6 weight (3,5t) SwedenStockholm, Malmö, Gothenburg, Lund, 4 2007
7 weight (3,5t/5t) United Kingdom London, Norwich 2 2008
8 Emissions badge GermanyBerlin, Bochum, Cologne, Hannover, Munich,... 39 as from 2008
9 Emissions badge ItalyBozen, Veneto, Piemonte, Lombardia, Emilia-Romagna 6 2007
total number 80
Low Emission Zones in Europe

Example Berlin
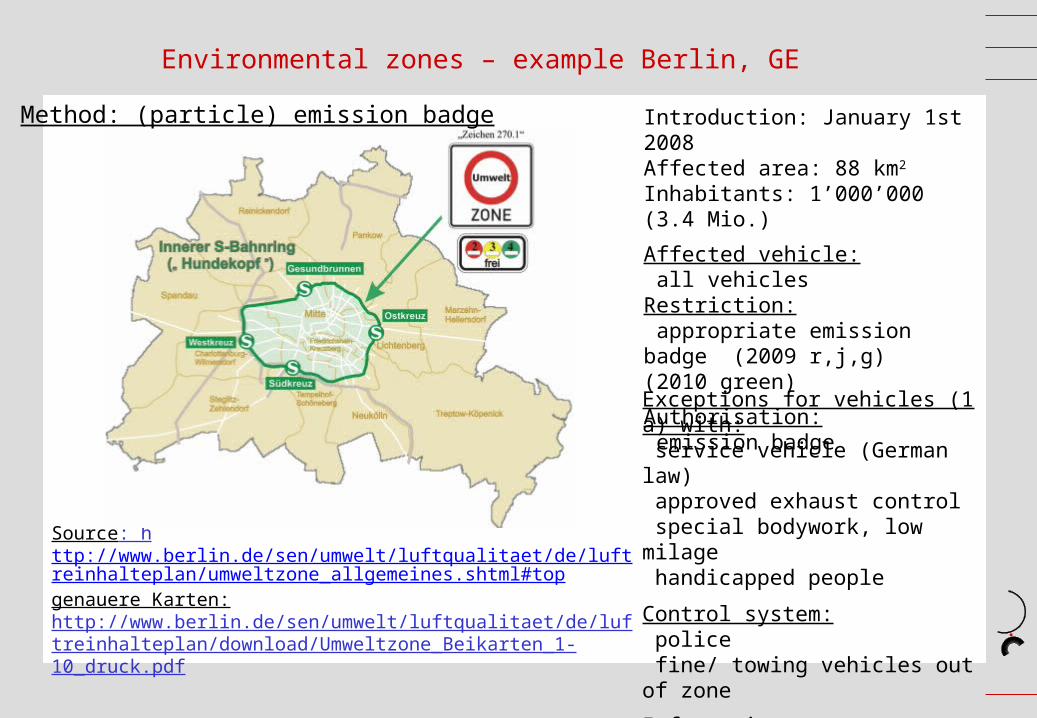
Environmental zones – example Berlin, GE
Source: http://www.berlin.de/sen/umwelt/luftqualitaet/de/luftreinhalteplan/umweltzone_allgemeines.shtml#topgenauere Karten: http://www.berlin.de/sen/umwelt/luftqualitaet/de/luftreinhalteplan/download/Umweltzone_Beikarten_1-10_druck.pdf
Method: (particle) emission badge Introduction: January 1st 2008 Affected area: 88 km2 Inhabitants: 1’000’000 (3.4 Mio.)
Affected vehicle: all vehicles Restriction: appropriate emission badge (2009 r,j,g) (2010 green)
Authorisation: emission badge
Exceptions for vehicles (1 a) with: service vehicle (German law) approved exhaust control special bodywork, low milage handicapped people
Control system: police fine/ towing vehicles out of zone
Information: brochures, media, internet

Environmental zones – example Berlin, GE
Germany: standardised government regulations for driving bans
four emission standard classes (marking by according badges)
(particle) emission badge
Emission group 1 2 3 4
badge/ sticker no badge
Euro 2 or Euro 3 or Euro 4 or
Euro 1 + DPT
Euro 2 + DPT Euro 3 + DPT
requirements for gasoline vehicles
without controled catalyst
with controlled catalyst (Euro 1 or
better)
requirements for diesel vehicles
Euro 1 or worse

Environmental zones – example Berlin, GE
Results: reduction of traffic volume?

Environmental zones – example Berlin, GE
passenger cars
duty vehicles (HDV+LDV)
LEZ
LEZ
veh
icle
s w
ith
em
issi
on
bad
ge
Results: no significant reduction of traffic volume no shifts of traffic avoidance of traffic (whole city) changes in vehicle fleet?

Environmental zones – example Berlin, GE
passenger cars duty vehicles (HDV+LDV)
vehicles without emission badge
Results: no significant reduction of traffic volume no shifts of traffic avoidance of traffic (whole city) significant changes in vehicle fleet

Environmental zones – example Berlin, GE
Results: no significant reduction of traffic volume no shifts of traffic avoidance of traffic (whole city) significant changes in vehicle fleet changes in vehicle exhaust gas emissions
diesel particles
-24%
NOx
-14%

Environmental zones – example Berlin, GE
Results:
no significant reduction of traffic volume
no shifts of traffic
avoidance of traffic (whole city)
significant changes in vehicle fleet
changes in vehicle exhaust gas emissions
improvements of air quality
PM10
annual average -3%
local PM emissions 8%
-4 days of limit value exceedance NOx
annual average -10% NO2
no reductions (probably increase)

Example Copenhagen

Environmental zones – example Copenhagen, DK
Source:http://www.regione.emilia-romagna.it/wcm/ERMES/Canali/trasporti/logistica_merci/pubblicazione_44_2005_quadreni_vol7/City_Ports_vol7_ingl.pdf
Method: % of utilised maximum loading capacity Area: inner city centre 1km2
Inhabitants: 6’000 (1’153’615)Costs: 27’000 EuroAffected vehicle: HDV >2.5 t (3500 per day)Restriction: (loading and unloading)Monday – Friday 8 pm – 12 pmMin. 60% utilised loading capacity
Authorisation: green City Goods certificationControl system, fines: police parking fine 510 DKR withdraw of certificateInformation:newsletter to transport association, letter to inhabitants, magazine article, meetings, internet, information plate at perking meters…

Example London

Environmental zones – example London, UK
Source: http://www.tfl.gov.uk/roadusers/lez/german.aspx
Method: Restriction by vehicle emission levels Affected area: most of Greater London (>1500 km2)
Affected vehicle:HDV, buses, coaches, LDV, vans, minibuses
Restriction: 2008 EURO III, 2012 EURO IV 2010 vans, minibuses EURO III
Authorisation: registration in vehicle register
Charge for non compliant vehicles: £200/day (HGV, buses, coaches) £100/day (vans and minibuses)
Enforcement (Penalty Charge):£1,000 (HDV, buses & coaches)£500 (LDVs & minibuses)
Control system: camera detection and checks against register

Environmental zones – example London, UK
Source: Transport for London, Steve Kearns

Planning and assessing environmental zones
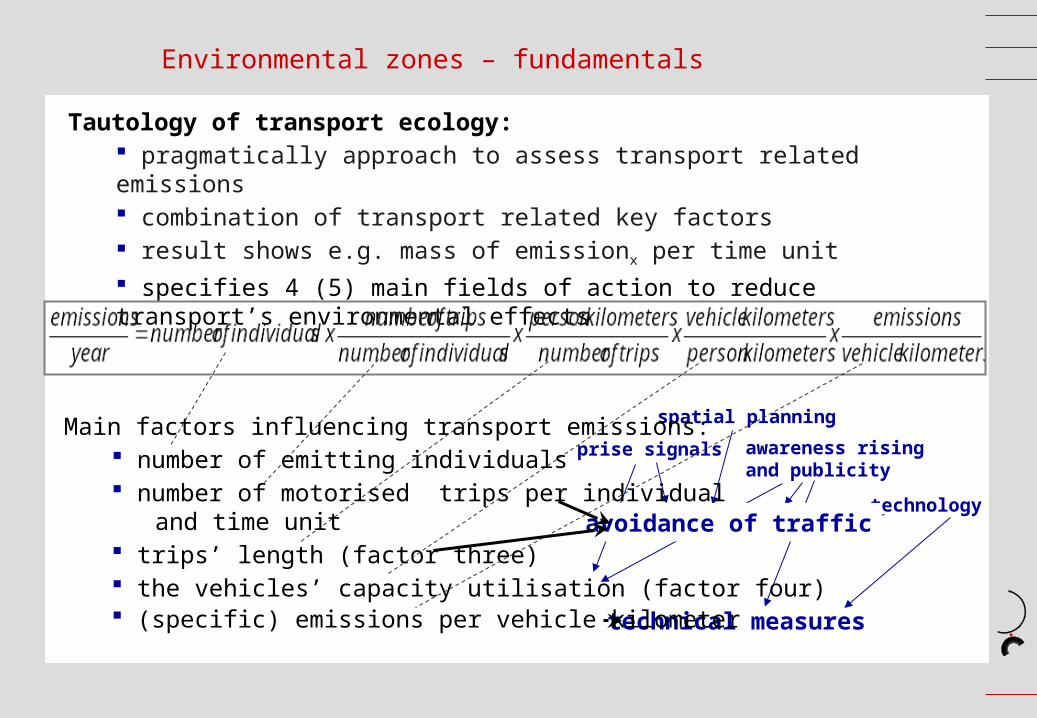
Environmental zones – fundamentals
Tautology of transport ecology: pragmatically approach to assess transport related emissions combination of transport related key factors result shows e.g. mass of emissionx per time unit specifies 4 (5) main fields of action to reduce transport’s environmental effects
technical measures
spatial planning
awareness risingand publicity
prise signals
technologyavoidance of traffic
Main factors influencing transport emissions: number of emitting individuals number of motorised trips per individual and time unit trips’ length (factor three) the vehicles’ capacity utilisation (factor four) (specific) emissions per vehicle kilometer

Environmental zones – determining factors
The efficiency of environmental zones is mainly defined by:
their spatial extend,
their positioning in the transport network
number, mileage and emission level of effected vehicles,
number and type of exceptions,
applied control and enforcement and
accompanying measures.

Environmental zones – implementation steps
Steps to ensure successful implementation

Environmental zones – the first step
Assess real pollutant immission levels and compare to limit values
screening
identification of probable hot spots (all sources)
gauging
preliminary measuring method (fast interim results)
standardised measuring method (time reference, sample preparation, dilution, position, used equipment)
modelling (emissions, immissions, defined scenarios and time horizons)
define / check:
target area
responsible authorities and stakeholders
existing and coming target and limit values
climatic and geographic conditions
data availability and need of research

Environmental zones – the second step
Identify the share of local and regional / supra-regional emission sources
Include all regional and local sources:
stationary (industry, private households, power plants, construction …)
linear/ non-stationary (road transport, off-road transport, agriculture …)
natural sources (sea salt, dust)
Include pollutant entry from distant sources (trajectory)
differentiate spatially (rural, urban, roadside, district)
differentiate by components (NOx, NO2, PM10, PM2,5, BC …. )

Environmental zones – the third step
Quantify the share of transport related sources
composition and mileage of the local fleet
share of vehicle categories
transit traffic
differentiate to road categories
real driving differs from test procedures
deficits in real life data availability (emission factors,
traffic situation, fleet, road surface, resuspension)
emission factors
include exhaust emissions, resuspension and abrasion
vehicle categories
exhaust gas treatment system
traffic situation
consider emission trends and future fleet/ fuel development

Environmental zones – the third step
Vergleich von Emissionsfaktoren auf der Grundlage empirisch ermittelter Verkehrssituationen mit Emissionsfaktoren, welche durch verschiedene Programme bestimmt wurden
(für 108 untersuchte Dresdner Straßenabschnitte)
0
0,5
1
1,5
2
2,5
3
0 10 20 30 40 50 60 70 80 90 100 110
M essw ertnum m er
HC
- E
FA
[g
/km
]
gemessen
ISIS
Mobilev
tracing
Comparison of real emission factors (read squares) based on vehicle tracing and program based standard emission factors of MOBILEV (green triangles) and ISIS (blue squares).

Environmental zones – the fourth step
Analyse the current situation
key factors to include are:
structure, capacity and utilisation of the road network,
current traffic relations (wells, destinations and inter-relations),
traffic volumes,
traffic flow,
status and potentials of alternatives to IMT (walking, cycling, PT, car sharing …)
legal situation and responsibilities
Based on this data:
develop possible scenarios (restricting criteria, spatial extend, positioning …)
anticipate dynamic effects and avoiding reactions (shift of destinations, circumnavigation …)
utilise optimisation potentials (TL setting, coordination …)
implement / prepare supportive measures (PT, park and ride, parking management …..)

Environmental zones – the fifth step
Political decision process
identify stakeholders (EU legislative, national legislative, public authorities, NGO’s, residents, lobby groups, researchers ...)
involve all stakeholders right from the beginning
design a transparent participative process (moderation, rules of interaction …)
present a clear status report (current situation, further developments)
present adequate options (good preparation, focus on the advantages)
be informed and refer to existing experiences
schedule loops and sufficient time
consider further local targets and regional specialities
Define:
type of zone, size, positioning, boundaries, fines, enforcement, regulation of exemptions, future steps (tightening, scheduling)
costs, financing, responsibilities, schedule, allocation of fines

Environmental zones – the sixth step
Awareness raising and publicity
address all stakeholders/ target groups
involve adequate multipliers
use target group specific media
act well prepared and persistent
align with decision makers right from the beginning
Societal acceptance for low emission zones strongly depends on pre-implementation publicity!
present aims and need of action traceable
refer to existing experiences
act integrative (do not segregate, use change in perspective)
focus on advantages
define affected vehicles and identifying features

Environmental zones – the seventh step
Implementation and enforcement
identify entry points and main access routs to the affected area
install signs, and control systems
equip / support enforcement (legal framework, staff, instruction / training)
install feedback to publicity
supply adequate information (native language, other languages)
internet, tourist information, city authorities, police, stakeholders, embassies
Used groups of control system:
administrative permissions
restrictions marked by road signs
physical automatic systems
pay systems

Environmental zones – the eights step
Impact assessment and adoptions
before – after comparison
consider changed framework (fuel prices, economic conditions, changes of road network / capacity, PT offer, buying incentives …)
keep differing time scale of effects / changes in mind
identify induced changes in spatial structure
observe relocation of traffic, modal shift, vehicle fleet, changed destinations
include surrounding area in your investigation
identify social exclusion
identify and learn from dynamic reactions of persons / groups concerned

Lessons learnt

Environmental zones – note!
anticipate dynamic effects (shifts of emissions, traffic, spatial structure)
design zone of sufficient spatial extent and proper position
publicity defines societal acceptance / start very early
step by step is better than nothing (size and affected vehicles)
Learn from good examples and adapt to your local framework.
base modelling on real data (traffic situation, fleet, emission factors, surface)
consider abrasion and resuspension properly
check against possible legal conflicts
Does legal situation allow this type of restrictions?
Are aimed emission reductions correspondent to the vehicles affected?
ensure access
implement supportive alternatives (PT, services, car sharing…)
exceptions
ensure strict and efficient enforcement

Environmental zones – key factors of success
Embed your environmental zone in a long term orientated overall concept including e.g.:
spatial planning,
mixed functions,
short distances,
promotion of cycling, walking, PT,
awareness rising,
push and pull measures ...

Environmental zones – main side effects
An additional effect of low emission zones is the accelerated fleet modernisation and thus a reduction of road traffic emissions.
Side effects:
possible shift of traffic and emissions to surrounding road network
possible rise of overall emissions due to:
usage of alternate routs around the zone
shift of destinations
avoidance of traffic

Environmental zones – boundaries and limitations
older vehicles cause higher emissions per km but have lower annual mileage
nearly no effect on abrasion and resuspension
transport sources for NO2, noise, PM10, NMHC might differ
fleet modernisation is a mid term effect (mileage reductions are to prefer)
additional bypasses cause increasing overall mileage
emission reductions of isolated environmental zones are usually not sufficient to meet air quality limits
Emission reductions and side effects strongly depends on spatial extent and on the regulations regarding the vehicles affected by the entry restrictions.
Not to act would be inhumane!
Further information
Links & Sources:
• Low Emission Zones in Europe http://www.lowemissionzones.eu/
• Low Emission Zones in Germany http://osiris.uba.de/Website/umweltzonen/start.htm
• Information Portal on the environmental badge in Germany http://www.umwelt-plakette.de/int_england.php?
• Department for Transport, GB http://www.dft.gov.uk/pgr/roads/tpm/clearzones/
• Transport for London / Low Emission Zone http://www.tfl.gov.uk/roadusers/lez/default.aspx

Practical part of the training


