Page 1
Embedded system design and implementation of standard auto-calibrated measurement chain
M. NADI, C. MARGO, M. KOUIDER, J. PRADO, and D. KOURTICHE
Laboratoire d’Instrumentation Electronique de Nancy ; Nancy University ; [email protected]
Abstract
This paper presents the design and the implementation of a standard auto-calibration system,
to correct measurement chain and ensure its accuracy. The adopted solution consists in
designing a reconfigurable instrumentation based on the use of a programmable analog circuit
(FPAA), allowing the automation of various test and adjustment operations. The measurement
chain transfer curve is periodically corrected using the progressive polynomial calibration
method, ensuring systematic correction of each taken measurement. The hardware/software
implementation of the system was carried out in an embedded configuration based on a FPGA
platform. The obtained results highlight adaptability of the proposed calibration method at
various sensors kinds as well as the implementation simplicity, and shows how the measuring
accuracy can be considerably improved.
Keywords: Calibration, Reconfigurable systems, FPAA/FPGA, Linearization.
1 Introduction
The role of measurement instrumentation is mainly confined to analog signal acquisition,
digital conversion, and transmission via a simple connection towards an intelligent processing
unit. The measurement chain transfer function may vary during the real time process, thus
requiring periodically various calibration and adjustment operations. The classic procedure
for calibration of sensors implies human interventions, which results in a high exploitation
cost and unavailability of measurement during maintenance [1]. The instrumentation and
metrology evolve more and more towards the autonomy and the supervision of the acquired
information reliability. The optimization of measurement chain performances is then essential
for real time system or/and difficult to access systems.
In this paper we define and implement a measurement system with auto-calibration capability,
associating a programmable electronic instrumentation and a software calibration method.
The main idea is to carry out various auto-test and auto-correction operations, in order to
guarantee the necessary measurement accuracy, overcome the inaccessibility problem and
reduce the relative cost. The developed measurement chain is based on the use of a
programmable analog circuit (FPAA), which is completely reconfigurable and being able to
interface various sensors kinds. The measurement chain transfer curve is periodically
21
INTERNATIONAL JOURNAL ON SMART SENSING AND INTELLIGENT SYSTEMS, VOL. 1, NO. 1, MARCH 2008
Page 2
corrected using the progressive polynomial calibration method, allowing after calculation of
various calibration coefficients to systematically correct in real time each taken measurement.
A test bench was realized, and we present experimental results relating to the system applied
to two various sensors (a pressure sensor and a strain gauge). The results prove the
effectiveness of the proposed auto-calibration method, and shows well how the measuring
accuracy can be considerably improved.
2 Auto-calibration system
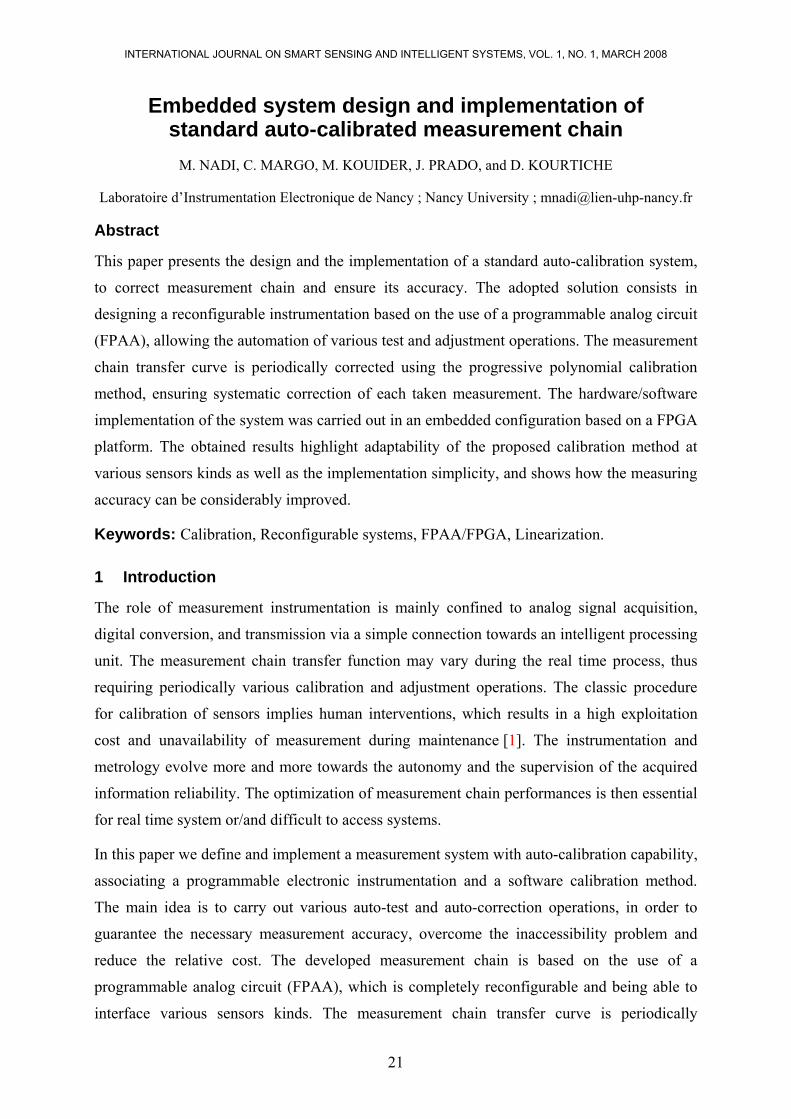
The calibration of the measurement chain is performed first by carrying out a calibration step,
which must be realized in order to correct its current response referring to its original
response (figure 1). The measurement chain is subjected to various tests employing N
calibration inputs x. These tests are performed in a controlled environment, in order to take
into account the effect of the main influence input z (temperature, moisture...). The
measurement chain response F(x) related to inputs (x,z) is compared with its reference
response G(x) (supposed linear). According to the evaluated difference between these two
responses, the correction coefficients ai are calculated, in order to decrease the calibration
error. The measurement accuracy relates to the calibration inputs, the test conditions as well
the adopted correction method. Once the measurement system is calibrated, it passes directly
to the measurement step.
)1(),),(),((),( iazxGFxfzxHy ==
The data y represents the output measurement systematically corrected in real time, using
measurements of the input x influenced by input z and calibration parameters already obtained
previously in the calibration step. The correction results can be examined perfectly by the
observation of the error curve E(x)=H(x,z)-G(x) and its evolution. If several aberrant values
are detected, or if a considerable distance of the corrected transfer curve compared to the
reference curve is observed, a new calibration step will be necessary. It is also possible to
perform the measurement chain calibration in a periodic way, according to the application
specificity and the hardware which composes it.
22
M. NADI ET., AL., EMBEDDED SYSTEM DESIGN AND IMPLEMENTATION OFSTANDARD AUTO-CALIBRATED MEASUREMENT CHAIN
Page 3
Figure 1 : Reconfigurable measurement chain calibration.
In case of persistent anomaly in the measurement chain response, the calibration loses its
meaning and a maintenance intervention becomes essential.
The measurement errors correction consists in, correcting the systematic error initially and
then the residual random error [2] [3]. We combine in this method two complementary
techniques allowing each one the correction of various measurement errors kinds. First, a
hardware adjustment technique consists in intervening on the measurement chain level, by
adjusting the values of its components, in order to find its initial accuracy. For that, it is
necessary to choose hardware instrumentation configurable by software. In complement, a
polynomial progressive calibration technique allows using a reduced number of calibration
data, to calculate calibration coefficients forming the new interpolation function which will
represent the corrected measurement function.
2.1 Measurement chain adjustment
We have designed our reconfigurable measurement chain based on an FPAA circuit (Field
Programmable Analog Array) ispPAC30® [4], employed like universal signal conditioner,
supporting several sensor/transducer kinds. This circuit has a great flexibility by the dynamic
capacity of reconfiguration of its amplification gain, interconnections, reference voltages and
analog functions.
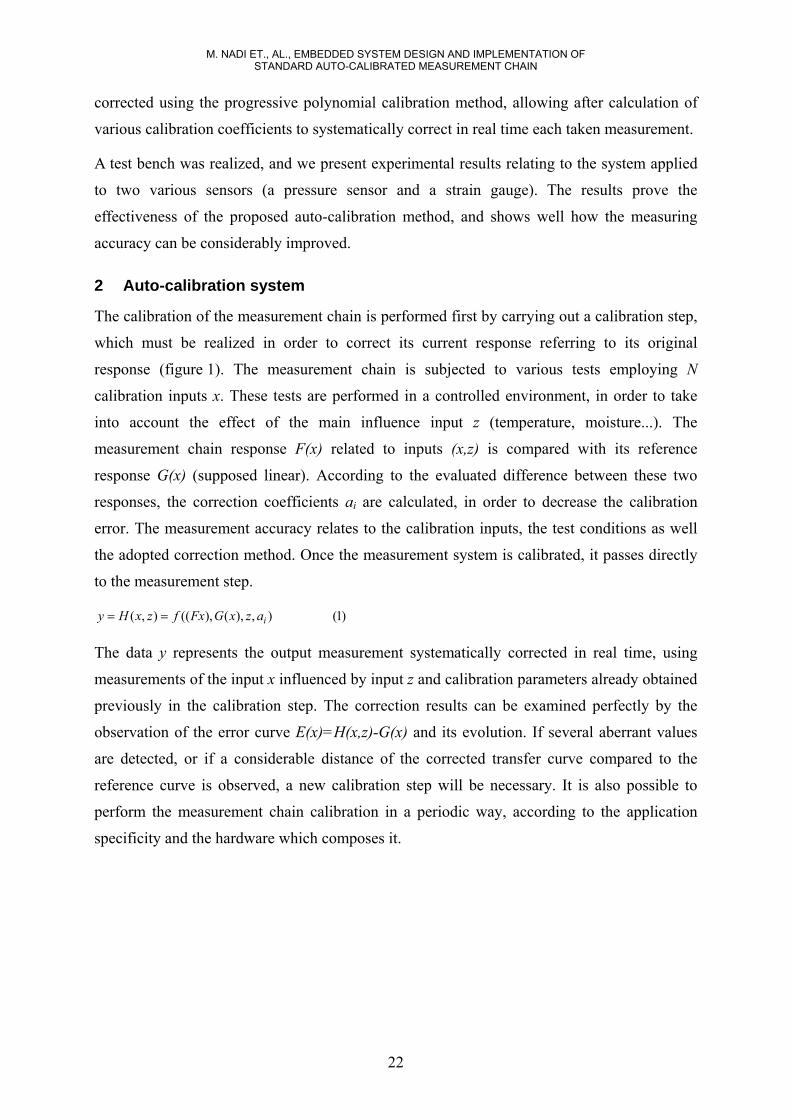
The programmable reconfiguration of the measurement chain through SPI interface of the
FPAA circuit makes easy its auto-calibration. Thus test and correction routines are performed
in autonomous way [5]. As shown in figure 2, the adjustment of the measurement chain
makes possible the offset error correction, the gain drift compensation, and the cut-off
frequencies filtering adjustment. Obviously, this solution allows a significant reduction of the
realization and calibration cost of such a measurement chain.
23
INTERNATIONAL JOURNAL ON SMART SENSING AND INTELLIGENT SYSTEMS, VOL. 1, NO. 1, MARCH 2008
Page 4
Figure 2 : Measurement chain adjustment.
2.2 Correction of Measurement
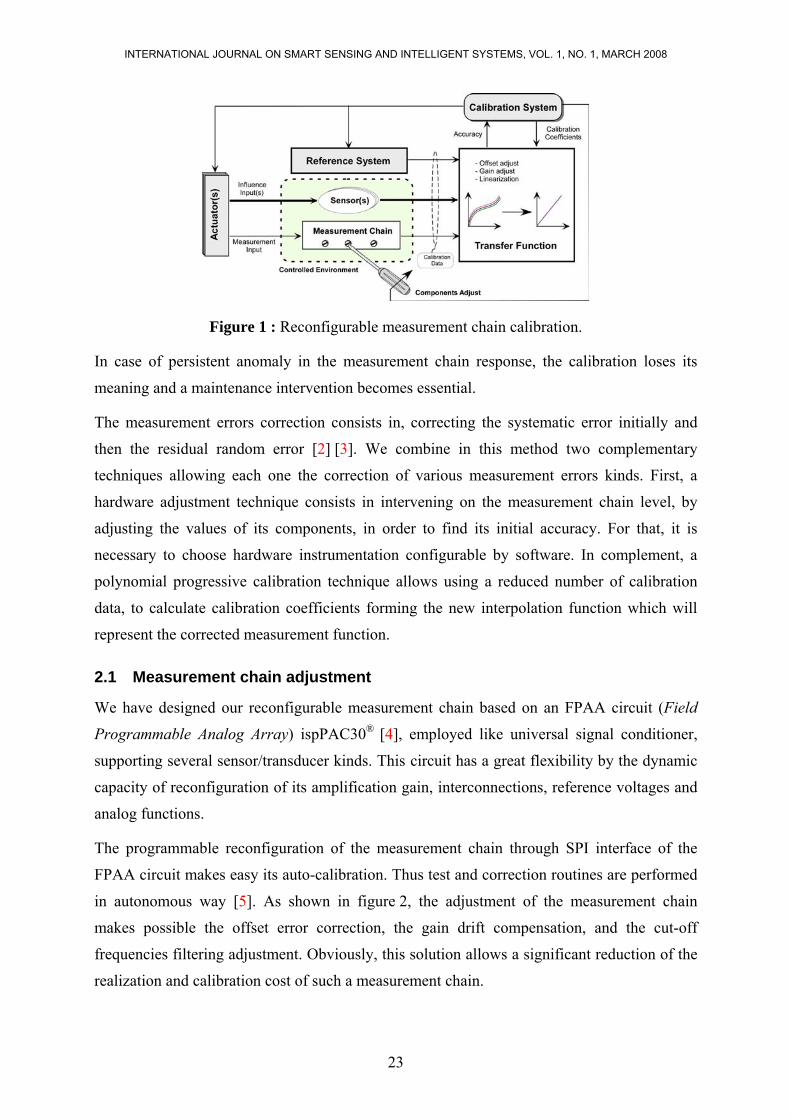
The measurement chain curve could present combination of errors (offset error, gain error,
linearity error and cross-sensitivity error). To correct these errors, we have adopted the
progressive polynomial calibration method, explained graphically in figure 3. The incremental
steps of correction explain the way to obtaining the polynomial correction curve, which
approaches the desired linear curve. In fact, to each calibration step the corrected transfer
curve tends towards the desired transfer curve, hence the label polynomial progressive
calibration.
Figure 3: Polynomial progressive calibration method.
This method consists in using one calibration measurement (xi,yi) to calculate a calibration
coefficient ai of the interpolation function h(x). The correction is applied immediately to
correct the measurement chain output f(x). Each additional correction step uses another
calibration measurement to perform a progressive correction of the measurement curve, the
24
M. NADI ET., AL., EMBEDDED SYSTEM DESIGN AND IMPLEMENTATION OFSTANDARD AUTO-CALIBRATED MEASUREMENT CHAIN
Page 5
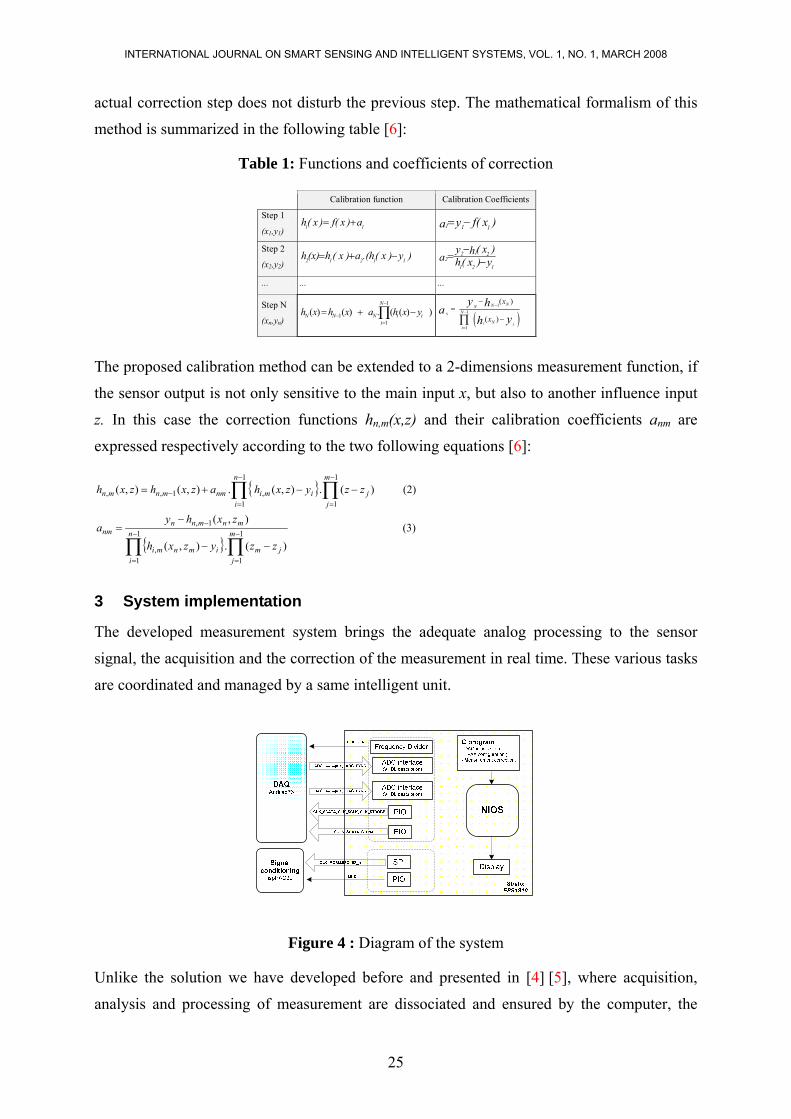
actual correction step does not disturb the previous step. The mathematical formalism of this
method is summarized in the following table [6]:
Table 1: Functions and coefficients of correction
Calibration function Calibration Coefficients
Step 1
(x1,y1) 11 a)x(f)x(h += )x(fya 111 −=
Step 2
(x2,y2) )y)x(h.(a)x(h)x(h 11212 −+=
121
2122 y)x(h
)x(hya −
−=
... ... ...
Step N
(xn,yn)
1
11
( ) ( ) . ( ( ) )N
N N N i ii
h x h x a h x y−
−=
= + −∏ ( )1
1
1
( )
( )N
NNNN
Ni ii
x
x
y hayh
−−
=
−=
−∏
The proposed calibration method can be extended to a 2-dimensions measurement function, if
the sensor output is not only sensitive to the main input x, but also to another influence input
z. In this case the correction functions hn,m(x,z) and their calibration coefficients anm are
expressed respectively according to the two following equations [6]:
(3)
)(.),(
),(
(2))(.),(.),(),(
1
1
1
1,
1,
1
1
1
1,1,,
∏∏
∏∏
−
=
−
=
−
−
=
−
=−
−−
−=
−−+=
m
jjm
n
iimnmi
mnmnnnm
m
jj
n
iiminmmnmn
zzyzxh
zxhya
zzyzxhazxhzxh
3 System implementation
The developed measurement system brings the adequate analog processing to the sensor
signal, the acquisition and the correction of the measurement in real time. These various tasks
are coordinated and managed by a same intelligent unit.
Figure 4 : Diagram of the system
Unlike the solution we have developed before and presented in [4] [5], where acquisition,
analysis and processing of measurement are dissociated and ensured by the computer, the
25
INTERNATIONAL JOURNAL ON SMART SENSING AND INTELLIGENT SYSTEMS, VOL. 1, NO. 1, MARCH 2008
Page 6
embedded solution we propose exploit directly the data using the Stratix-EP1S10 platform
from ALTERA, it is composed of a FPGA which can integrate one or more heart of completely
customized microprocessor. This solution is really economic and reliable since only one
component is necessary, moreover the joint hardware/software design is allowed and made
with less time. In addition, the design descriptions in advanced languages such VHDL and C
allow simple modification and adaptation.
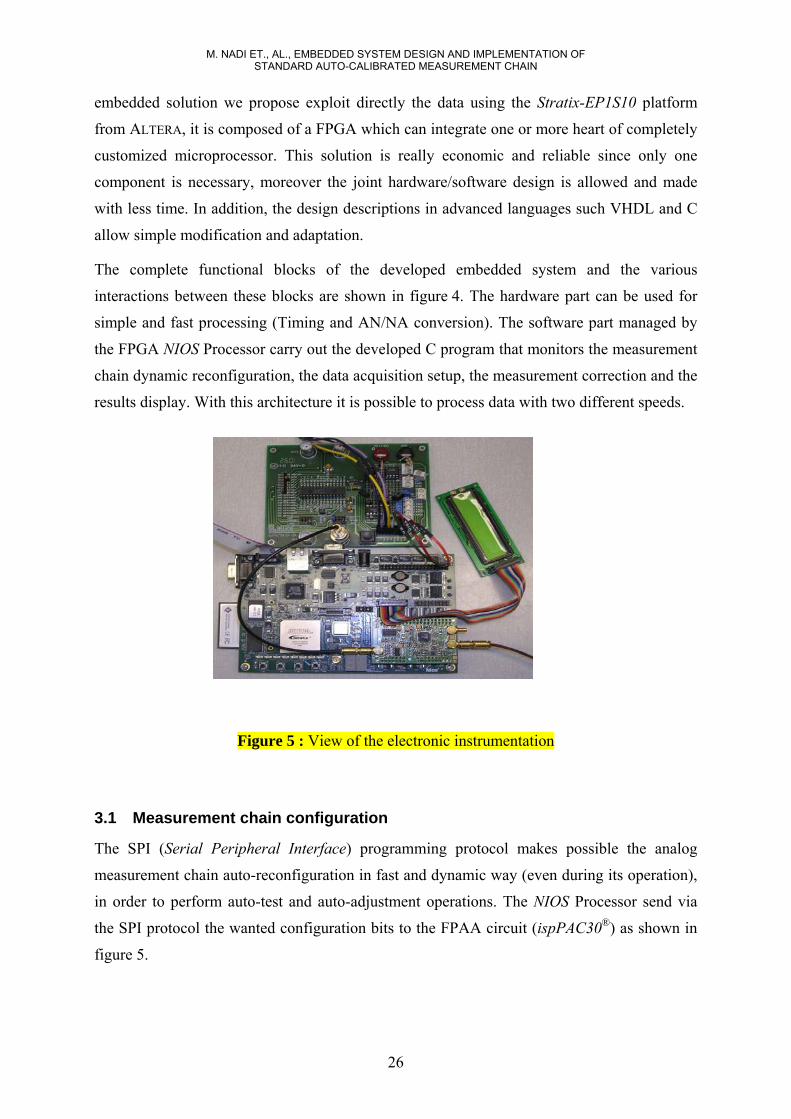
The complete functional blocks of the developed embedded system and the various
interactions between these blocks are shown in figure 4. The hardware part can be used for
simple and fast processing (Timing and AN/NA conversion). The software part managed by
the FPGA NIOS Processor carry out the developed C program that monitors the measurement
chain dynamic reconfiguration, the data acquisition setup, the measurement correction and the
results display. With this architecture it is possible to process data with two different speeds.
Figure 5 : View of the electronic instrumentation
3.1 Measurement chain configuration
The SPI (Serial Peripheral Interface) programming protocol makes possible the analog
measurement chain auto-reconfiguration in fast and dynamic way (even during its operation),
in order to perform auto-test and auto-adjustment operations. The NIOS Processor send via
the SPI protocol the wanted configuration bits to the FPAA circuit (ispPAC30®) as shown in
figure 5.
26
M. NADI ET., AL., EMBEDDED SYSTEM DESIGN AND IMPLEMENTATION OFSTANDARD AUTO-CALIBRATED MEASUREMENT CHAIN
Page 7
Figure 6 : SPI communication protocol.
3.2 Data acquisition setup
We have employed the data acquisition board andilab76 from ANDIMEDES, to digitize the
analog measurement signal. The NIOS Processor carries out a C program in order to setup the
data acquisition board through (PIO) interface. We have also written a software module in
VHDL language, to allow detection and demultiplexing of the conversion word (2x6 bits).
The management of the timing clock is performed with hardware blocks.
3.3 Measurement Correction
Algorithms of the 1-dimension and 2-dimensions calibration method described in §2.2 are
software implemented on C program, that calculates the various calibration coefficients
relating to the desired correction order. These coefficients are then immediately used to
perform the real time measurement to eliminate the various errors types.
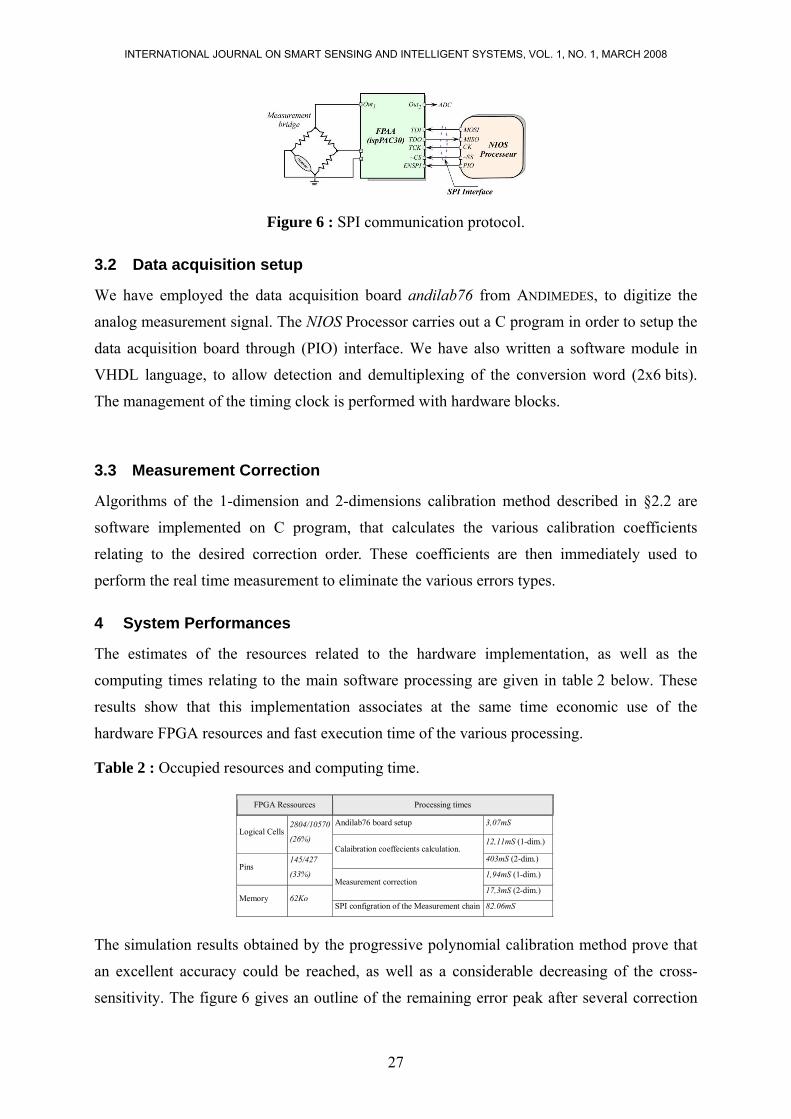
4 System Performances
The estimates of the resources related to the hardware implementation, as well as the
computing times relating to the main software processing are given in table 2 below. These
results show that this implementation associates at the same time economic use of the
hardware FPGA resources and fast execution time of the various processing.
Table 2 : Occupied resources and computing time.
FPGA Ressources Processing times
Andilab76 board setup 3,07mS Logical Cells
2804/10570
(26%) 12,11mS (1-dim.) Calaibration coeffecients calculation.
403mS (2-dim.) Pins
145/427
(33%) 1,94mS (1-dim.) Measurement correction
17,3mS (2-dim.) Memory 62Ko
SPI configration of the Measurement chain 82.06mS
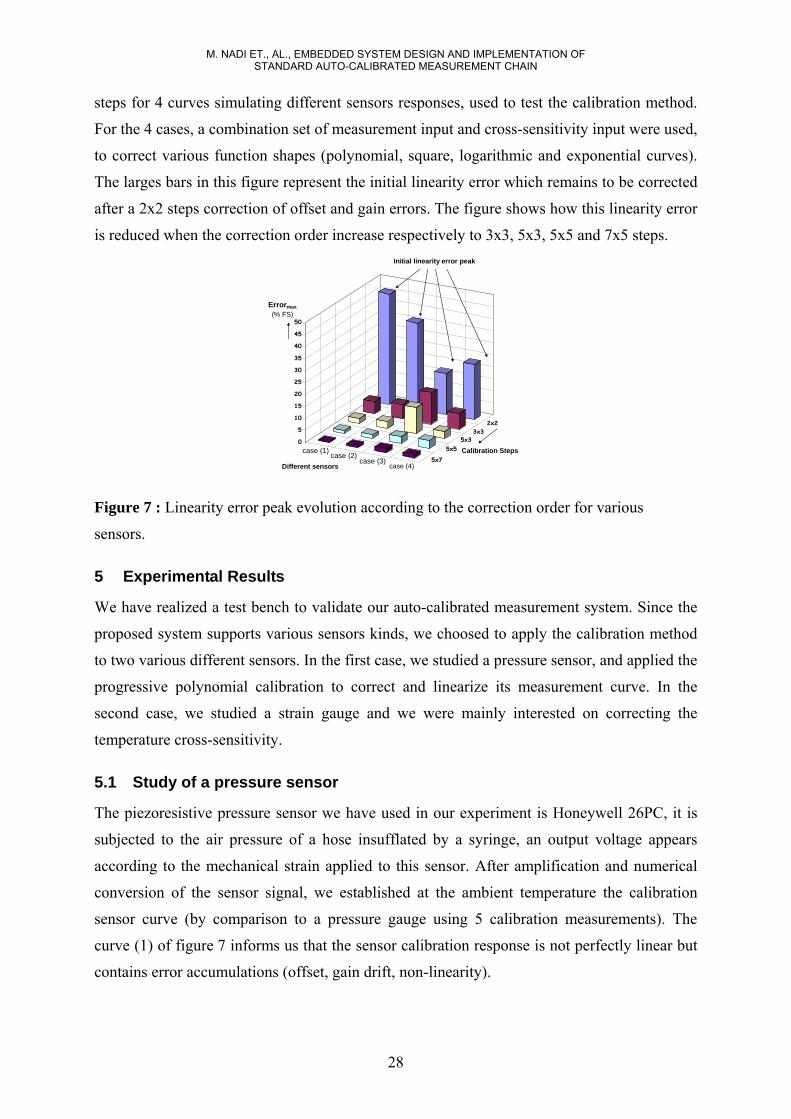
The simulation results obtained by the progressive polynomial calibration method prove that
an excellent accuracy could be reached, as well as a considerable decreasing of the cross-
sensitivity. The figure 6 gives an outline of the remaining error peak after several correction
27
INTERNATIONAL JOURNAL ON SMART SENSING AND INTELLIGENT SYSTEMS, VOL. 1, NO. 1, MARCH 2008
Page 8
steps for 4 curves simulating different sensors responses, used to test the calibration method.
For the 4 cases, a combination set of measurement input and cross-sensitivity input were used,
to correct various function shapes (polynomial, square, logarithmic and exponential curves).
The larges bars in this figure represent the initial linearity error which remains to be corrected
after a 2x2 steps correction of offset and gain errors. The figure shows how this linearity error
is reduced when the correction order increase respectively to 3x3, 5x3, 5x5 and 7x5 steps.
0
5
10
15
20
25
30
35
40
45
50
Initial linearity error peak
Errormax (% FS)
case (3) case (2)
case (4)
3x3 5x3
5x5 5x7
Calibration Steps
Different sensors
case (1)
2x2
Figure 7 : Linearity error peak evolution according to the correction order for various
sensors.
5 Experimental Results
We have realized a test bench to validate our auto-calibrated measurement system. Since the
proposed system supports various sensors kinds, we choosed to apply the calibration method
to two various different sensors. In the first case, we studied a pressure sensor, and applied the
progressive polynomial calibration to correct and linearize its measurement curve. In the
second case, we studied a strain gauge and we were mainly interested on correcting the
temperature cross-sensitivity.
5.1 Study of a pressure sensor
The piezoresistive pressure sensor we have used in our experiment is Honeywell 26PC, it is
subjected to the air pressure of a hose insufflated by a syringe, an output voltage appears
according to the mechanical strain applied to this sensor. After amplification and numerical
conversion of the sensor signal, we established at the ambient temperature the calibration
sensor curve (by comparison to a pressure gauge using 5 calibration measurements). The
curve (1) of figure 7 informs us that the sensor calibration response is not perfectly linear but
contains error accumulations (offset, gain drift, non-linearity).
28
M. NADI ET., AL., EMBEDDED SYSTEM DESIGN AND IMPLEMENTATION OFSTANDARD AUTO-CALIBRATED MEASUREMENT CHAIN
Page 9
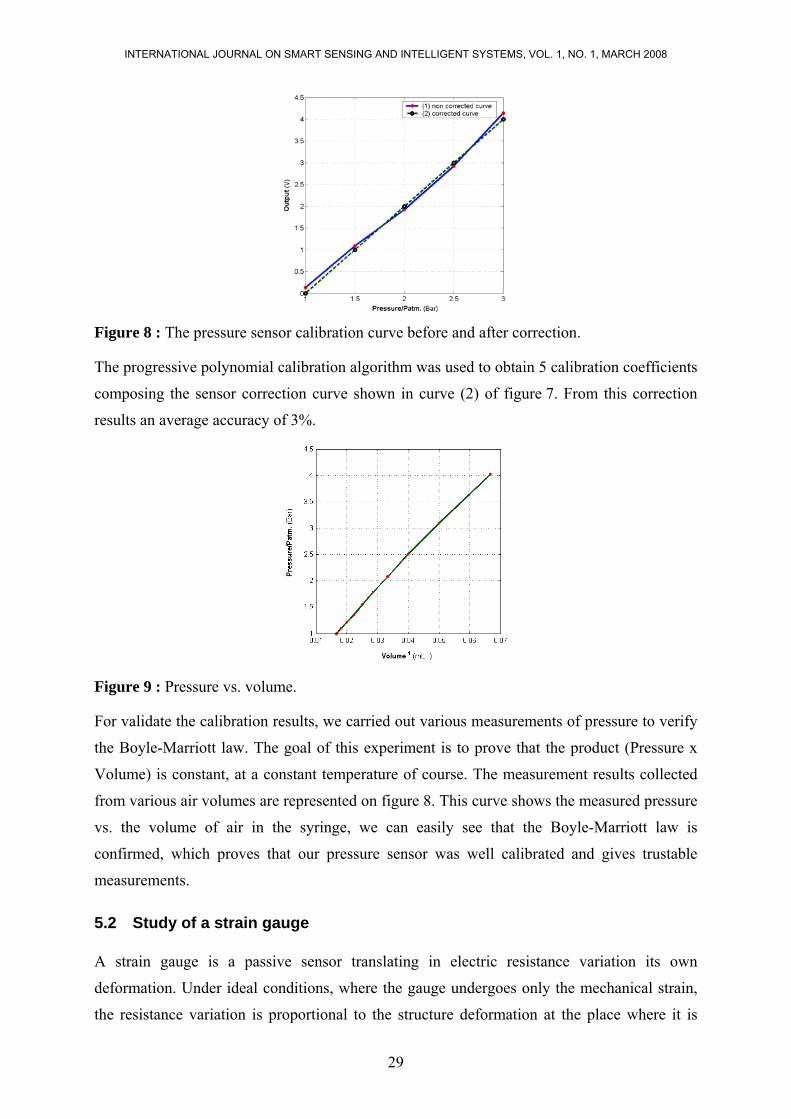
Figure 8 : The pressure sensor calibration curve before and after correction.
The progressive polynomial calibration algorithm was used to obtain 5 calibration coefficients
composing the sensor correction curve shown in curve (2) of figure 7. From this correction
results an average accuracy of 3%.
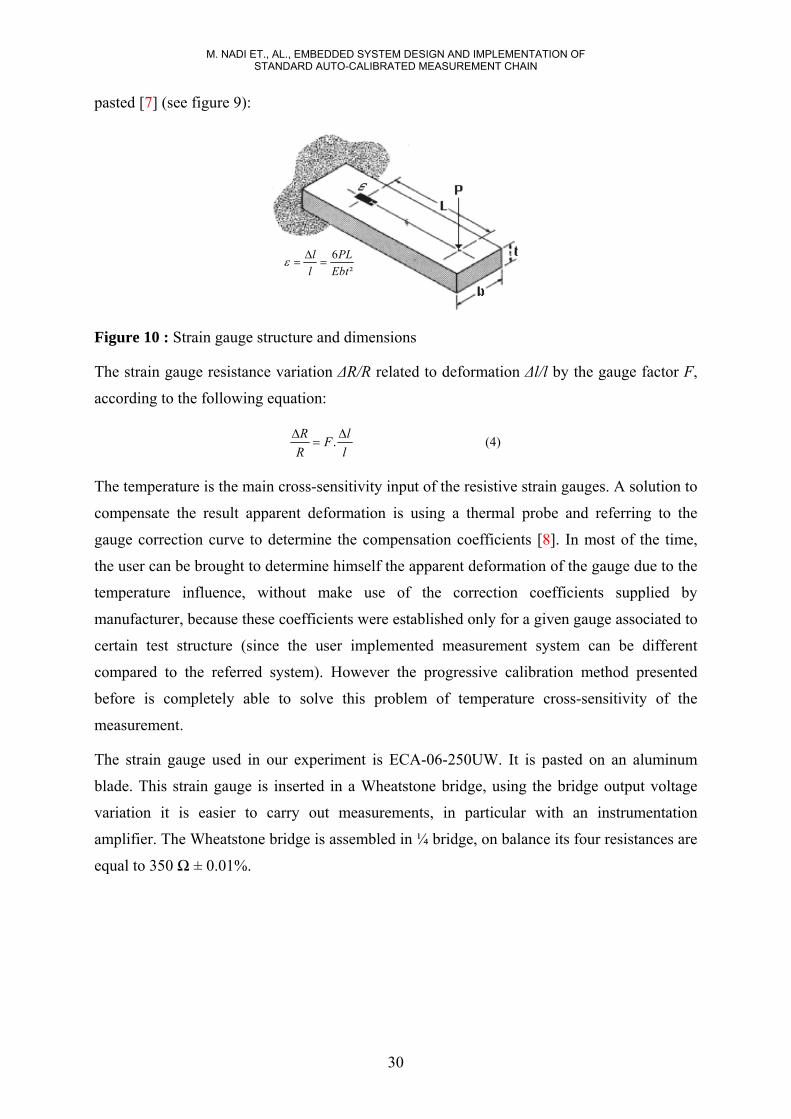
Figure 9 : Pressure vs. volume.
For validate the calibration results, we carried out various measurements of pressure to verify
the Boyle-Marriott law. The goal of this experiment is to prove that the product (Pressure x
Volume) is constant, at a constant temperature of course. The measurement results collected
from various air volumes are represented on figure 8. This curve shows the measured pressure
vs. the volume of air in the syringe, we can easily see that the Boyle-Marriott law is
confirmed, which proves that our pressure sensor was well calibrated and gives trustable
measurements.
5.2 Study of a strain gauge
A strain gauge is a passive sensor translating in electric resistance variation its own
deformation. Under ideal conditions, where the gauge undergoes only the mechanical strain,
the resistance variation is proportional to the structure deformation at the place where it is
29
INTERNATIONAL JOURNAL ON SMART SENSING AND INTELLIGENT SYSTEMS, VOL. 1, NO. 1, MARCH 2008
Page 10
pasted [7] (see figure 9):
²6Ebt
PLll=
Δ=ε
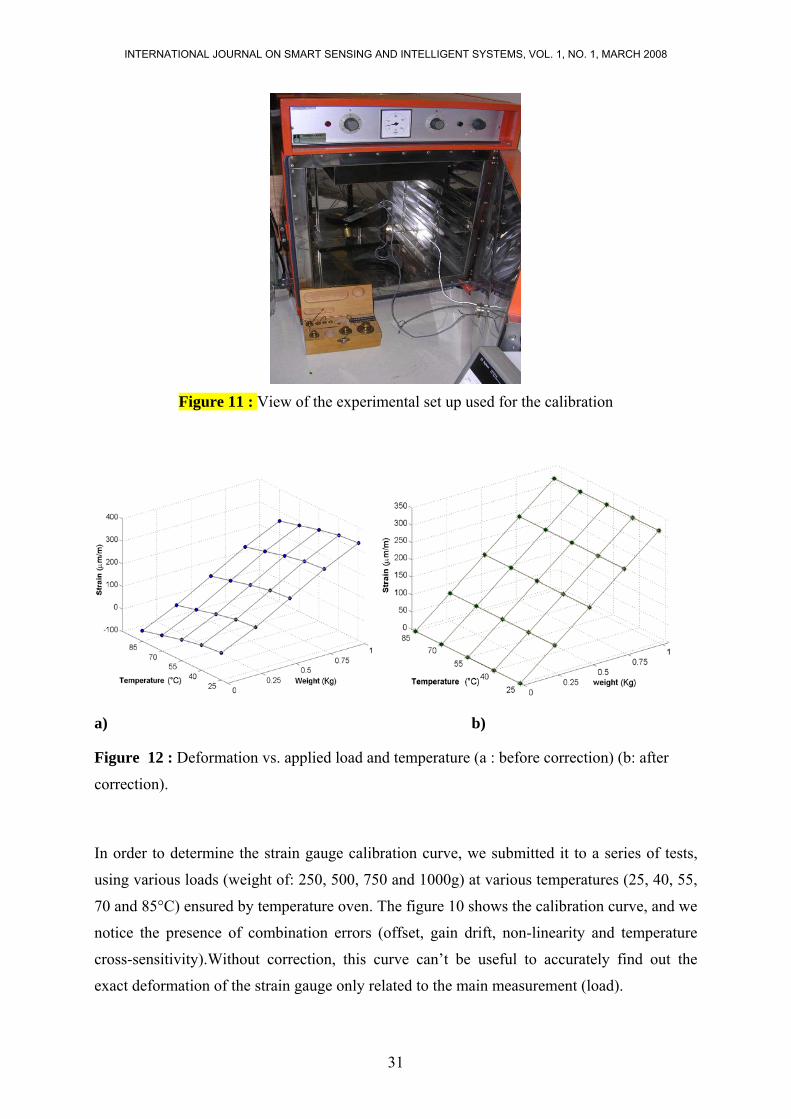
Figure 10 : Strain gauge structure and dimensions
The strain gauge resistance variation ΔR/R related to deformation Δl/l by the gauge factor F,
according to the following equation:
(4).llF
RR Δ=
Δ
The temperature is the main cross-sensitivity input of the resistive strain gauges. A solution to
compensate the result apparent deformation is using a thermal probe and referring to the
gauge correction curve to determine the compensation coefficients [8]. In most of the time,
the user can be brought to determine himself the apparent deformation of the gauge due to the
temperature influence, without make use of the correction coefficients supplied by
manufacturer, because these coefficients were established only for a given gauge associated to
certain test structure (since the user implemented measurement system can be different
compared to the referred system). However the progressive calibration method presented
before is completely able to solve this problem of temperature cross-sensitivity of the
measurement.
The strain gauge used in our experiment is ECA-06-250UW. It is pasted on an aluminum
blade. This strain gauge is inserted in a Wheatstone bridge, using the bridge output voltage
variation it is easier to carry out measurements, in particular with an instrumentation
amplifier. The Wheatstone bridge is assembled in ¼ bridge, on balance its four resistances are
equal to 350 Ω ± 0.01%.
30
M. NADI ET., AL., EMBEDDED SYSTEM DESIGN AND IMPLEMENTATION OFSTANDARD AUTO-CALIBRATED MEASUREMENT CHAIN
Page 11
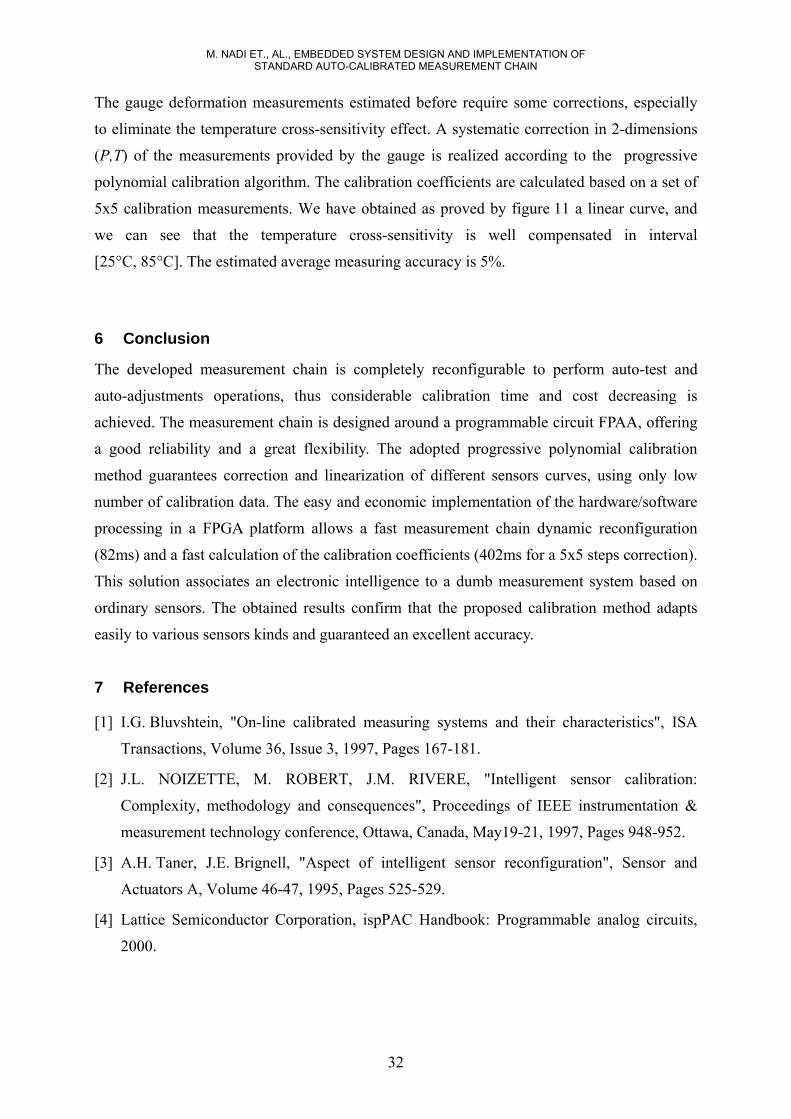
Figure 11 : View of the experimental set up used for the calibration
a) b)
Figure 12 : Deformation vs. applied load and temperature (a : before correction) (b: after
correction).
In order to determine the strain gauge calibration curve, we submitted it to a series of tests,
using various loads (weight of: 250, 500, 750 and 1000g) at various temperatures (25, 40, 55,
70 and 85°C) ensured by temperature oven. The figure 10 shows the calibration curve, and we
notice the presence of combination errors (offset, gain drift, non-linearity and temperature
cross-sensitivity).Without correction, this curve can’t be useful to accurately find out the
exact deformation of the strain gauge only related to the main measurement (load).
31
INTERNATIONAL JOURNAL ON SMART SENSING AND INTELLIGENT SYSTEMS, VOL. 1, NO. 1, MARCH 2008
Page 12
The gauge deformation measurements estimated before require some corrections, especially
to eliminate the temperature cross-sensitivity effect. A systematic correction in 2-dimensions
(P,T) of the measurements provided by the gauge is realized according to the progressive
polynomial calibration algorithm. The calibration coefficients are calculated based on a set of
5x5 calibration measurements. We have obtained as proved by figure 11 a linear curve, and
we can see that the temperature cross-sensitivity is well compensated in interval
[25°C, 85°C]. The estimated average measuring accuracy is 5%.
6 Conclusion
The developed measurement chain is completely reconfigurable to perform auto-test and
auto-adjustments operations, thus considerable calibration time and cost decreasing is
achieved. The measurement chain is designed around a programmable circuit FPAA, offering
a good reliability and a great flexibility. The adopted progressive polynomial calibration
method guarantees correction and linearization of different sensors curves, using only low
number of calibration data. The easy and economic implementation of the hardware/software
processing in a FPGA platform allows a fast measurement chain dynamic reconfiguration
(82ms) and a fast calculation of the calibration coefficients (402ms for a 5x5 steps correction).
This solution associates an electronic intelligence to a dumb measurement system based on
ordinary sensors. The obtained results confirm that the proposed calibration method adapts
easily to various sensors kinds and guaranteed an excellent accuracy.
7 References
[1] I.G. Bluvshtein, "On-line calibrated measuring systems and their characteristics", ISA
Transactions, Volume 36, Issue 3, 1997, Pages 167-181.
[2] J.L. NOIZETTE, M. ROBERT, J.M. RIVERE, "Intelligent sensor calibration:
Complexity, methodology and consequences", Proceedings of IEEE instrumentation &
measurement technology conference, Ottawa, Canada, May19-21, 1997, Pages 948-952.
[3] A.H. Taner, J.E. Brignell, "Aspect of intelligent sensor reconfiguration", Sensor and
Actuators A, Volume 46-47, 1995, Pages 525-529.
[4] Lattice Semiconductor Corporation, ispPAC Handbook: Programmable analog circuits,
2000.
32
M. NADI ET., AL., EMBEDDED SYSTEM DESIGN AND IMPLEMENTATION OFSTANDARD AUTO-CALIBRATED MEASUREMENT CHAIN
Page 13
[5] M. KOUIDER, M. NADI, D. KOURTICHE, "Sensors Auto-calibration Method Using
Programmable Interface Circuit Front-end", Sensors, Volume 36, Issue 3, 2003, Pages
490-497.
[6] G.v.d. Horn, J.H. Huijsing, Integrated smart sensors: Design and calibration, Klumer
Academic Publisher, 1998.
[7] J. Fraden, Handbook of modern sensors: physics, designs and applications, American
Institute of Physics, 1996.
[8] Technical note TN-504, « Strain Gage Thermal Output and Gage Factor Variation with
Temperature ».
33
INTERNATIONAL JOURNAL ON SMART SENSING AND INTELLIGENT SYSTEMS, VOL. 1, NO. 1, MARCH 2008