38
© DECHEMA/IEA/ICCA 2013 Energy and GHG Reductions in the Chemical Industry via Catalytic Processes: ANNEXES INTERNATIONAL COUNCIL OF CHEMICAL ASSOCIATIONS
© DECHEMA/IEA/ICCA 2013
Energy and GHG Reductions in the
Chemical Industry via Catalytic
Processes:
ANNEXES
INTERNATIONAL
COUNCIL OF
CHEMICAL
ASSOCIATIONS
2
Table of content Introductory Remark ............................................................................................................................... 3
Annex 1: Data Approach and Assumptions ............................................................................................ 3
Development of process-specific production volumes in the chemical and petrochemical sector ... 3
Energy consumption and GHG emissions ........................................................................................... 3
Boundary conditions for the DECHEMA model .................................................................................. 6
Annex 2: Process routes for propylene oxide ....................................................................................... 11
Annex 3: Theoretical potential ............................................................................................................. 11
Annex 4: Improvement options ............................................................................................................ 13
Processes & Products ........................................................................................................................ 13
Incremental improvement ................................................................................................................ 14
BPT deployment ................................................................................................................................ 14
Emerging Technologies ..................................................................................................................... 15
Gamechangers .................................................................................................................................. 16
SECs, GHG emissions and improvement factors ............................................................................... 17
Annex 5: Hydrogen option .................................................................................................................... 21
Annex 6: Biomass based process routes ............................................................................................... 23
Considered routes ............................................................................................................................. 23
Assumptions for energy consumption of biomass-based HVC production ...................................... 27
Annex 7: Refineries ............................................................................................................................... 28
Catalytic process steps in refineries .................................................................................................. 28
Annex 8. Description of IEA Scenarios .................................................................................................. 29
Annex 9. Research needs ...................................................................................................................... 32
Improve feedstock efficiency ............................................................................................................ 32
Fuels from gas and coal..................................................................................................................... 33
New routes to polymers ................................................................................................................... 33
Hydrogen production ........................................................................................................................ 34
Biomass as chemical feedstock ......................................................................................................... 35
Annex 11. Workshop Participants ......................................................................................................... 35
3
Introductory Remark The annexes to the roadmap “Energy and GHG Reductions in the Chemical Industry via Catalytic
Processes” contain supplementary material and more detailed technical information and data not
included in the core roadmap in order to keep the volume of the document reasonable. All annexes
are referenced in the core roadmap. Main target audience for the annexes are the scientific-
technical stakeholders interested in gaining a deeper understanding in the approaches, assumptions
and basic data used for the DECHEMA or IEA modelling work.
Annex 1: Data Approach and Assumptions
Development of process-specific production volumes in the chemical and
petrochemical sector Data on process and country specific production volumes expressed in kt/yr covering 2010-2030 was
supplied by SRI (IHS) and CMAI. Missing data was extrapolated from existing values. Linear
extrapolation was applied to cover the period beyond 2030. Country-specific data was grouped into
regional data.
The existing chemical plants will during their lifetime experience constant optimization efforts
(incremental improvement) but may also reach a point where they are no longer competitive and
are either decommissioned or substantially retrofitted to the then state-of-the-art. Additionally, new
production volume might be commissioned. The lifecycle of a chemical plant was modelled as a
function of improvement, decommissioning rate and implementation rate of best practice
technology.
Energy consumption and GHG emissions Current state-of-the-art and best practice energy consumption and GHG emission values were
derived by critical evaluation of publically available data sources, process-specific values supplied by
SRI and licensors and verified by discussions with industrial experts. The energy intensity of a process
is expressed as GJ per t of product and excludes the respective energy contents of feedstock and
products unless otherwise stated1. For a given process, the average energy intensity of currently
existing plants is expressed as specific energy consumption (SEC) and its current best practice
technology (BPT). Both values are subject to incremental improvement due to ongoing optimization
efforts. Energy intensity of new and retrofitted production is expressed as linear combination of SEC
and BPT values.
GHG emissions are reported as CO2 equivalents per ton of product. In this study, the CO2-eq includes
carbon dioxide, methane, and nitrous oxide. The fluorinated gases (sulphur hexafluoride, HFCs, and
PFCs) are not included because they do not occur as emissions of the processes regarded here.
As for energy intensity, GHG emissions are subject to incremental improvements and best practise
technologies exist, that represent the current benchmark. However, some of the chemical processes
1 Please note the different definitions of SEC for comparing existing processes with emerging or game changer
routes. This is explained in the section “Boundary conditions for the DECHEMA model” of Annex 1.
4
regarded in this study co-produce a greenhouse gas in conjunction with the intended product. These
emissions cannot be avoided as long as the process is based on this specific chemical reaction. The
following section provides a more detailed discussion on the different types of GHG emissions and
their relative impact.
Greenhouse gas emission intensity
The chemical sector is one of the most prominent industrial emitters of greenhouse gases. In
contrast to the energy sector however, greenhouse gas emissions do not only occur due to the
burning of fossil fuels. There are different reasons for GHG emissions which have been taken into
account in the modelling. They are outlined below:
1. Some chemical processes emit greenhouse gases by the very nature of the chemical reaction
they are based on. These processes co-produce a greenhouse gas together with the intended
product. These emissions cannot be avoided as long as the process is based on this specific chemical
reaction. The most prominent process in this category is the production of ammonia used as a
precursor for fertilizer production. The hydrogen used in the ammonia production is most efficiently
generated by steam reforming of natural gas complemented with a water gas shift reaction. This
process chain releases a certain stoichiometric amount of CO2 as a co-product of the amount of H2
produced. This stoichiometrically produced CO2 amounts to more than half of the overall CO2
emissions of the ammonia production. The actual amount only depends on the feedstock used for
the hydrogen generation. Natural gas is the favoured feedstock with about 1 t CO2 per t NH3
produced, while coal based ammonia produces nearly 2 t CO2 per t NH3. It is worth noting that
switching all coal-based ammonia production to gas-based production would have a major impact
on the overall GHG balance. However, unless hydrogen is supplied by renewable carbon neutral
sources, the amount of CO2 produced by this process chain based on natural gas represents an
absolute lower limit for the GHG emissions from ammonia production, independent on any
improvement made in the area of energy efficiency. In case of ammonia, some of the CO2 emitted is
captured and subsequently used for the production of urea. It is eventually released into the
atmosphere when used as fertilizer. However, these considerations are beyond the battery limits of
the current study.
2. Another source of GHG emissions unique to the chemical sector are GHGs caused by non-
selectivity of chemical reactions. Most prominently, non-selectivity occurs in partial oxidation
processes, which are notoriously difficult to control to an extend that avoids further oxidation of the
intended product. Examples are the production of CO2 in ethylene oxide plants or HCN as an
unintended by-product in the production of acrylonitrile. The extent of non-selectivity strongly
depends strongly on specific process conditions. Catalysis steers the chemical reaction towards a
specific outcome and generally allows for less drastic and easier controllable process conditions. It
has therefore a significant impact on the amount of GHGs emitted by processes suffering from
competing reactions. GHG-emissions caused by non-selectivity are also independent to any
improvements in the area of energy efficiency. However, they are subject to improvements in the
area of process design and catalysis. While GHG emissions based on non-selectivity might be
reduced, they might not always be completely avoidable. Other examples caused by imperfect
5
reaction control are: N2O emissions by nitric acid plants or by adipic acid plants (unlike CO2, N2O can
be decomposed catalytically to nitrogen and oxygen).
Both GHG produced by the chemical reaction and by non-selectivity are localized and relatively pure
streams of the respective gas. In case of CO2 these processes represent an opportunity for CCU or
CCS.
3. As in other sectors, GHGs are emitted in the chemical sector as function of the energy
requirements for heat and power. In both cases, fossil fuels are generally burned, sometimes within
the chemical reactor. These emissions can be reduced by minimizing the energy requirements for a
given process. Chemical reactions are subject to absolute thermodynamic energy limitations that
may cause a minimum energy required for a given process. This minimum energy is beyond
optimization and energy efficiency efforts. It is the minimum energetic price to be paid in order to
obtain a certain product. That said the chemical industry has strongly been optimizing its energy use.
Large potentials are accessed by efficient heat integration with exchange of heat between several
processes at a given site. Consideration of integrated sites is beyond the scope of this study;
however it significantly reduces the overall energy requirement and accordingly GHG emissions of
the chemical sector compared to the single process perspective assumed in this roadmap.
4. Finally, the chemical sector is also the producer of some of the most potent GHGs, notably
refrigerants. These GHG as chemical products are outside the battery limit of this study since they
are not emitted by the chemical industry. Generally, they form part of a product sold to the
consumer (e.g. a fridge) and are released at the end of the lifetime if proper recycling procedures are
not adhered to. Strictly speaking, urea also falls into this category, since its CO2 is released when
used as fertilizer in the agricultural sector. These effects are not taken into account in this study.
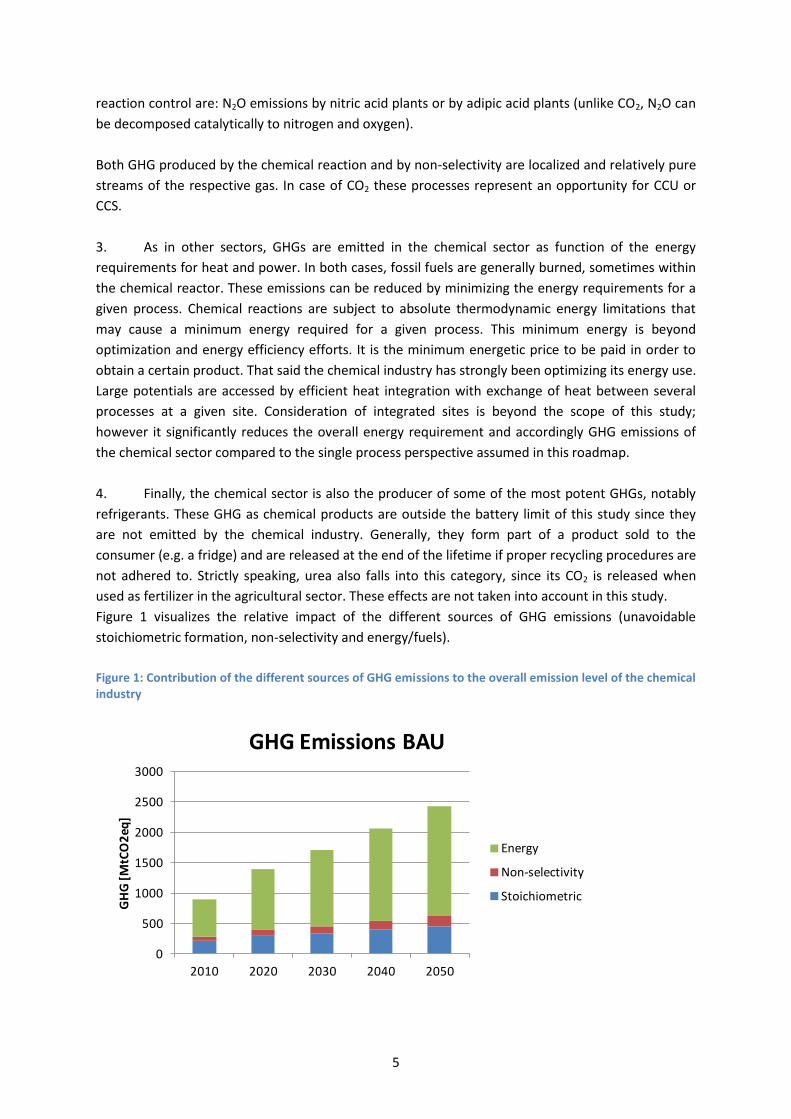
Figure 1 visualizes the relative impact of the different sources of GHG emissions (unavoidable
stoichiometric formation, non-selectivity and energy/fuels).
Figure 1: Contribution of the different sources of GHG emissions to the overall emission level of the chemical industry
0
500
1000
1500
2000
2500
3000
2010 2020 2030 2040 2050
GH
G [
MtC
O2
eq]
GHG Emissions BAU
Energy
Non-selectivity
Stoichiometric
6
Boundary conditions for the DECHEMA model The process system boundaries for energy consumption and GHG emissions in this roadmap strictly
follow a fence to fence approach from precursor feedstock to product unless stated otherwise. For
instance, ethylene oxide (EO) production starts from ethylene as feedstock, the ethylene production
is not included in the EO process. This way double counting of energy consumptions is avoided.
The energy consumption of a process reported as Specific Energy Consumption (SEC) includes
direct energy use (fuel, steam) and indirect energy use (electricity) for the process. Unless stated
otherwise, the energy equivalent of feedstock transformed to the target product is not included in
the SEC. Hence the SEC is defined as energy required in the process to transform the feedstock to
the product without taking the energy content of the feed into account. This energy difference
contains the thermodynamic difference between feedstock and product as well as any energy
required for downstream separation and purification or any energy requirements imposed by the
imperfections of the overall process (which is the main target of the model). The implicit assumption
for this SEC definition is, that the main process technology does not change dramatically, especially
with respect to feedstock applied. A given processes which use gas as a feedstock might gain
importance relative to one that use naphtha for example; however a given individual plant built for a
specific process is not expected to undergo a change to a different feedstock. This SEC definition
therefore applies to the numbers given for the current status of the 18 products investigated, as well
as for all calculations referring to incremental improvement, conservative and optimistic BPT
scenarios relative to the BAU scenario.
It is important to state that the situation changes, if an existing process is replaced by an alternative
process scheme. The notion of improvement of existing technologies with “constant” feed is no
longer valid for the scenarios dealing with emerging technologies and gamechangers (hydrogen and
biomass). New synthetic pathways add a perturbation into the existing value chains of the chemical
industry by requiring e.g. the production of a new feedstock compared to the existing reference
process. The aim of the scenarios was to quantify the energy and GHG differences by essentially
replacing the existing process with a new one, including its specific different feed preparation. As a
consequence, a different definition of SEC was used for comparing current processes with emerging
technologies and game changer processes and feedstock production has been included in the SEC to
allow for a fair comparison of the energy consumption of such alternative process routes. The
specific implications are explained in the section on Emerging Technologies in Annex 4 as well as in
Annex 5 and Annex 6.
The SECs for different processes originate from different sources. SRI (IHS) provided data from their
Process Economic Reports, based on representative flow sheets and typical plant designs and
equipment. The SECs were then confirmed by literature sources, where available. Another source
were the responses to the questionnaires on the top 40 energy consuming catalytically relevant
industrial processes sent to chemical manufacturers. 92 reports on individual processes were
received from 28 companies; 73 of those reports included energy data for defined processes. The
reported SECs usually reflected the specific circumstances (feedstocks, regional distribution of
production sites etc.) of plants operated by the process owners providing the report. The reports
were therefore used for validation only, unless several reports for the same process were available.
Finally estimates on average energy consumptions and BPT levels for various processes have been
provided by licensors.
7
GHG emissions include direct process emissions as CO2 equivalents, direct utilities emissions (fuel)
and indirect emissions from the production of the amount of electricity required for the process
(MWh/t -> tCO2/t). The latter is based on regional energy mix used for electricity generation (IEA).
Emissions were again provided by SRI, chemical manufacturers and licensors, and supported by
available publications, such as Weiss et. al. (Weiss, 2008).
For multi-product processes, the ISO 90040 weight allocation to high value chemicals (HVC) has
been used to avoid double counting of energy use or the allocation of the total energy consumption
to one product only. For example, it would be biased to allocate all energy consumption of ethylene
production from Naphtha Cracking to ethylene, as Naphtha cracking also results in a number of
other products. Typically, Naptha cracking results in 29-34 wt.% ethylene, 13-16 wt.% propylene, 4-5
wt.% butadiene, 10-16% aromatics and C4+. Per ton ethylene 0.887 tons of other HVC are produced.
Accordingly, the SEC for Naphtha cracking is expressed as GJ/tHVC and GHG emissions as tCO2-eq
/tHVC.
8
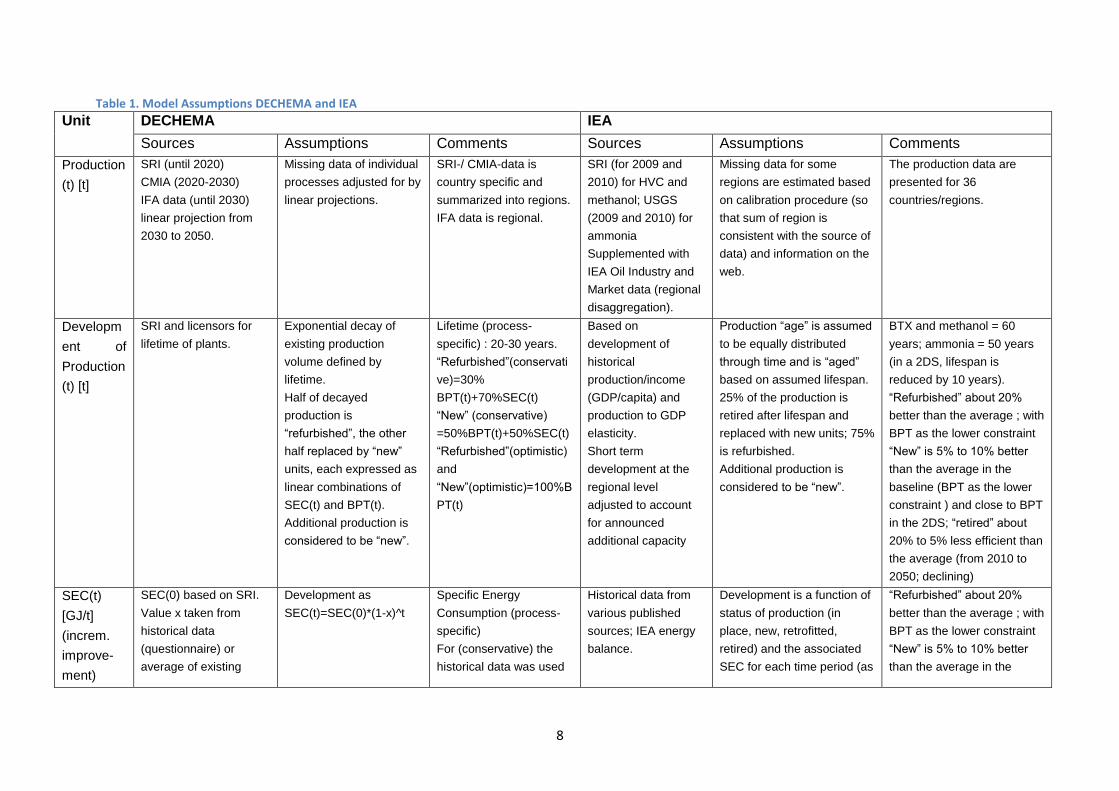
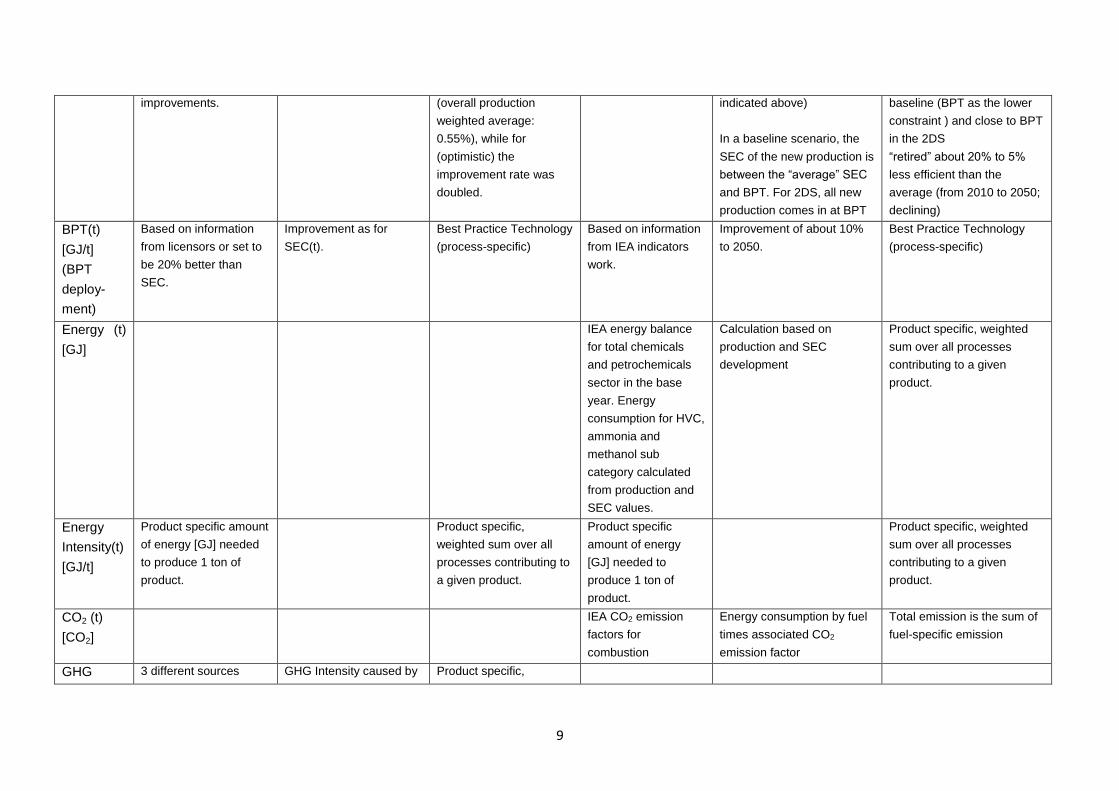
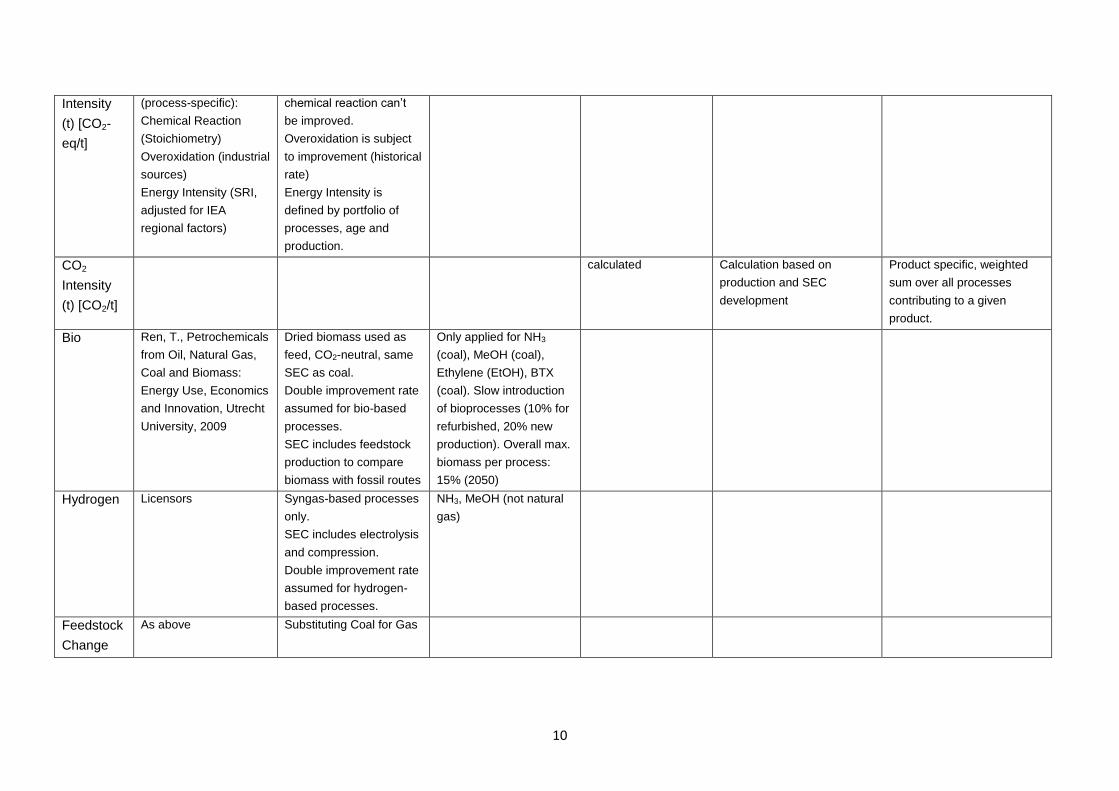
Table 1. Model Assumptions DECHEMA and IEA
Unit DECHEMA IEA
Sources Assumptions Comments Sources Assumptions Comments
Production
(t) [t]
SRI (until 2020)
CMIA (2020-2030)
IFA data (until 2030)
linear projection from
2030 to 2050.
Missing data of individual
processes adjusted for by
linear projections.
SRI-/ CMIA-data is
country specific and
summarized into regions.
IFA data is regional.
SRI (for 2009 and
2010) for HVC and
methanol; USGS
(2009 and 2010) for
ammonia
Supplemented with
IEA Oil Industry and
Market data (regional
disaggregation).
Missing data for some
regions are estimated based
on calibration procedure (so
that sum of region is
consistent with the source of
data) and information on the
web.
The production data are
presented for 36
countries/regions.
Developm
ent of
Production
(t) [t]
SRI and licensors for
lifetime of plants.
Exponential decay of
existing production
volume defined by
lifetime.
Half of decayed
production is
“refurbished”, the other
half replaced by “new”
units, each expressed as
linear combinations of
SEC(t) and BPT(t).
Additional production is
considered to be “new”.
Lifetime (process-
specific) : 20-30 years.
“Refurbished”(conservati
ve)=30%
BPT(t)+70%SEC(t)
“New” (conservative)
=50%BPT(t)+50%SEC(t)
“Refurbished”(optimistic)
and
“New”(optimistic)=100%B
PT(t)
Based on
development of
historical
production/income
(GDP/capita) and
production to GDP
elasticity.
Short term
development at the
regional level
adjusted to account
for announced
additional capacity
Production “age” is assumed
to be equally distributed
through time and is “aged”
based on assumed lifespan.
25% of the production is
retired after lifespan and
replaced with new units; 75%
is refurbished.
Additional production is
considered to be “new”.
BTX and methanol = 60
years; ammonia = 50 years
(in a 2DS, lifespan is
reduced by 10 years).
“Refurbished” about 20%
better than the average ; with
BPT as the lower constraint
“New” is 5% to 10% better
than the average in the
baseline (BPT as the lower
constraint ) and close to BPT
in the 2DS; “retired” about
20% to 5% less efficient than
the average (from 2010 to
2050; declining)
SEC(t)
[GJ/t]
(increm.
improve-
ment)
SEC(0) based on SRI.
Value x taken from
historical data
(questionnaire) or
average of existing
Development as
SEC(t)=SEC(0)*(1-x)^t
Specific Energy
Consumption (process-
specific)
For (conservative) the
historical data was used
Historical data from
various published
sources; IEA energy
balance.
Development is a function of
status of production (in
place, new, retrofitted,
retired) and the associated
SEC for each time period (as
“Refurbished” about 20%
better than the average ; with
BPT as the lower constraint
“New” is 5% to 10% better
than the average in the
9
improvements. (overall production
weighted average:
0.55%), while for
(optimistic) the
improvement rate was
doubled.
indicated above)
In a baseline scenario, the
SEC of the new production is
between the “average” SEC
and BPT. For 2DS, all new
production comes in at BPT
baseline (BPT as the lower
constraint ) and close to BPT
in the 2DS
“retired” about 20% to 5%
less efficient than the
average (from 2010 to 2050;
declining)
BPT(t)
[GJ/t]
(BPT
deploy-
ment)
Based on information
from licensors or set to
be 20% better than
SEC.
Improvement as for
SEC(t).
Best Practice Technology
(process-specific)
Based on information
from IEA indicators
work.
Improvement of about 10%
to 2050.
Best Practice Technology
(process-specific)
Energy (t)
[GJ]
IEA energy balance
for total chemicals
and petrochemicals
sector in the base
year. Energy
consumption for HVC,
ammonia and
methanol sub
category calculated
from production and
SEC values.
Calculation based on
production and SEC
development
Product specific, weighted
sum over all processes
contributing to a given
product.
Energy
Intensity(t)
[GJ/t]
Product specific amount
of energy [GJ] needed
to produce 1 ton of
product.
Product specific,
weighted sum over all
processes contributing to
a given product.
Product specific
amount of energy
[GJ] needed to
produce 1 ton of
product.
Product specific, weighted
sum over all processes
contributing to a given
product.
CO2 (t)
[CO2]
IEA CO2 emission
factors for
combustion
Energy consumption by fuel
times associated CO2
emission factor
Total emission is the sum of
fuel-specific emission
GHG 3 different sources GHG Intensity caused by Product specific,
10
Intensity
(t) [CO2-
eq/t]
(process-specific):
Chemical Reaction
(Stoichiometry)
Overoxidation (industrial
sources)
Energy Intensity (SRI,
adjusted for IEA
regional factors)
chemical reaction can’t
be improved.
Overoxidation is subject
to improvement (historical
rate)
Energy Intensity is
defined by portfolio of
processes, age and
production.
CO2
Intensity
(t) [CO2/t]
calculated Calculation based on
production and SEC
development
Product specific, weighted
sum over all processes
contributing to a given
product.
Bio Ren, T., Petrochemicals
from Oil, Natural Gas,
Coal and Biomass:
Energy Use, Economics
and Innovation, Utrecht
University, 2009
Dried biomass used as
feed, CO2-neutral, same
SEC as coal.
Double improvement rate
assumed for bio-based
processes.
SEC includes feedstock
production to compare
biomass with fossil routes
Only applied for NH3
(coal), MeOH (coal),
Ethylene (EtOH), BTX
(coal). Slow introduction
of bioprocesses (10% for
refurbished, 20% new
production). Overall max.
biomass per process:
15% (2050)
Hydrogen Licensors Syngas-based processes
only.
SEC includes electrolysis
and compression.
Double improvement rate
assumed for hydrogen-
based processes.
NH3, MeOH (not natural
gas)
Feedstock
Change
As above Substituting Coal for Gas
11
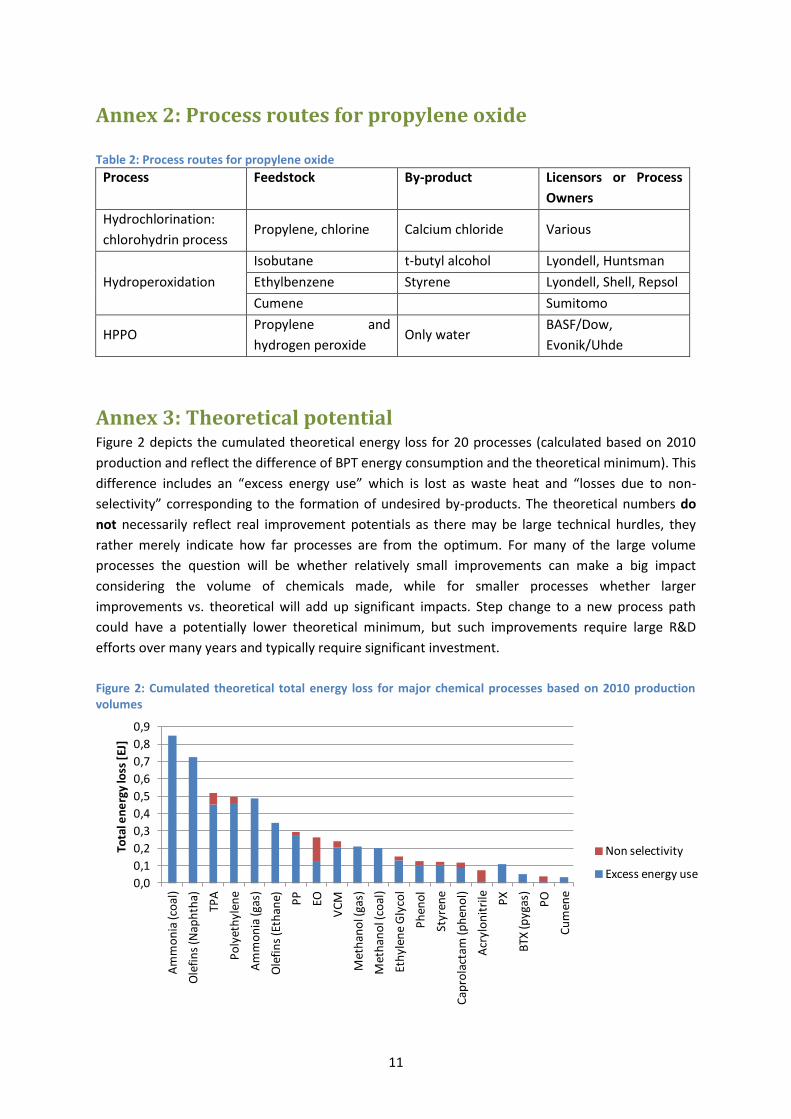
Annex 2: Process routes for propylene oxide
Table 2: Process routes for propylene oxide
Process Feedstock By-product Licensors or Process
Owners
Hydrochlorination:
chlorohydrin process Propylene, chlorine Calcium chloride Various
Hydroperoxidation
Isobutane t-butyl alcohol Lyondell, Huntsman
Ethylbenzene Styrene Lyondell, Shell, Repsol
Cumene Sumitomo
HPPO Propylene and
hydrogen peroxide Only water
BASF/Dow,
Evonik/Uhde
Annex 3: Theoretical potential Figure 2 depicts the cumulated theoretical energy loss for 20 processes (calculated based on 2010
production and reflect the difference of BPT energy consumption and the theoretical minimum). This
difference includes an “excess energy use” which is lost as waste heat and “losses due to non-
selectivity” corresponding to the formation of undesired by-products. The theoretical numbers do
not necessarily reflect real improvement potentials as there may be large technical hurdles, they
rather merely indicate how far processes are from the optimum. For many of the large volume
processes the question will be whether relatively small improvements can make a big impact
considering the volume of chemicals made, while for smaller processes whether larger
improvements vs. theoretical will add up significant impacts. Step change to a new process path
could have a potentially lower theoretical minimum, but such improvements require large R&D
efforts over many years and typically require significant investment.
Figure 2: Cumulated theoretical total energy loss for major chemical processes based on 2010 production volumes
0,0
0,1
0,2
0,3
0,4
0,5
0,6
0,7
0,8
0,9
Am
mo
nia
(co
al)
Ole
fin
s (N
aph
tha)
TPA
Po
lyet
hyl
ene
Am
mo
nia
(gas
)
Ole
fin
s (E
than
e) PP
EO
VC
M
Met
han
ol (
gas)
Met
han
ol (
coal
)
Eth
ylen
e G
lyco
l
Ph
eno
l
Styr
ene
Cap
rola
ctam
(ph
eno
l)
Acr
ylo
nit
rile PX
BTX
(pyg
as)
PO
Cu
men
e
Tota
l en
erg
y lo
ss [
EJ]
Non selectivity
Excess energy use
12
(Neelis, 2007) et al. have investigated the theoretical energy saving potential of various
petrochemical processes by analysing the energy inputs into the respective process and comparing
this cumulated process energy use with the theoretical energy use given by the heat of the
stoichiometric reaction. The difference represents the “excess energy use” which is lost as waste
heat in their model. A second type of loss is referred to as “losses due to non-selectivity”, i.e. the
conversion of raw material not into the desired product but into low-value by-products or CO2 (in
case of total oxidation). The very simple model of Neelis adopted here only includes the reactor
section of the process, which results in even negative theoretical energy consumption for
exothermic processes (net energy providing reactions). Product separation and purification steps are
disregarded, but these downstream operations always consume large amounts of energy. In
addition, the model disregards the re-use of waste heat, which is common practise in the usually
highly heat-integrated large petrochemical plants. Nevertheless this analysis provides general
directions for potential energy savings. Losses due to non-selectivity are generally observed for
oxidation processes (acrylonitrile, ethylene oxide, propylene oxide, terephthalic acid). Non-
selectivity losses are a direct measure of catalyst selectivity and can be overcome by more selective
catalysts. For example, according to (Neelis, 2007) 18 mass% of the ethylene fed into the EO
production is still burned rather than converted to EO, despite long term catalyst development work.
This example shows that these processes still allow for substantial improvements enabled by
catalysis. For the excess energy use the impact of catalysis is difficult to determine2, other process
improvements and improved heat integration can dominate.
Table 3 shows the current SECs of average and best practise plants compared to the theoretical
minimum for a number of selected processes
Table 3: Specific energy consumption of average plants, best practise technology plants and theoretical minimum
Process
Avrg. SEC [GJ/t] BPT SEC [GJ/t] Theor. Minimum
[GJ/t]
Ammonia (from coal, partial oxidation) 27.92 22.00 8.1
Ammonia (from natural gas, steam ref.) 15.38 7.2-9.0 5.8
Ethylene (from naphtha) 16.5* 12.0 8 (5*)
Propylene (from naphtha) 16.5* 12.0 5*
MeOH (from methane via syngas) 13.9 9.0-10.0 5.12
Acrylonitrile (from propylene) 15.5 12.9 -10.3
* per t high value chemicals (HVC)
2 Effects are even contradictory: exergy-wise an exothermic reaction should be operated at high temperatures,
whereas conversion is higher at low temperatures, and vice-versa for endothermic reactions.
13
Annex 4: Improvement options
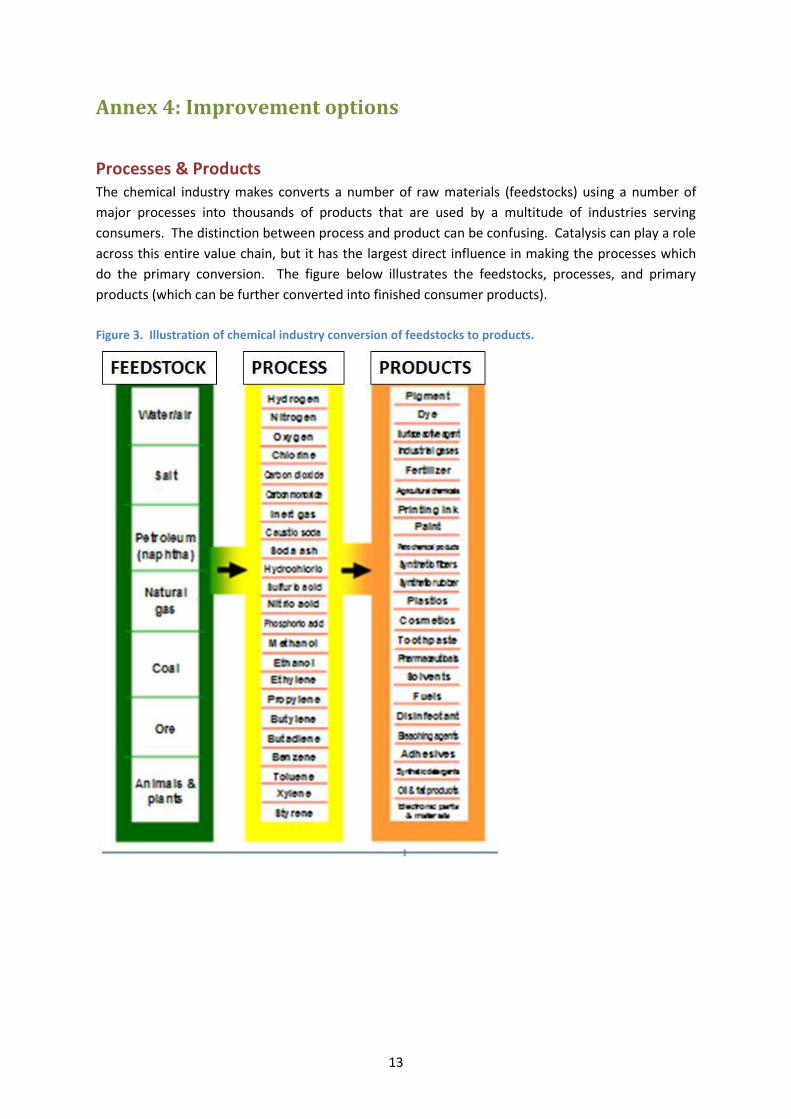
Processes & Products The chemical industry makes converts a number of raw materials (feedstocks) using a number of
major processes into thousands of products that are used by a multitude of industries serving
consumers. The distinction between process and product can be confusing. Catalysis can play a role
across this entire value chain, but it has the largest direct influence in making the processes which
do the primary conversion. The figure below illustrates the feedstocks, processes, and primary
products (which can be further converted into finished consumer products).
Figure 3. Illustration of chemical industry conversion of feedstocks to products.
14
Incremental improvement Higher catalyst selectivity means that more of the target product and less by-products are formed.
For example, the selectivity of ethylene oxide catalysts increased from 70% in the 1960s, 80% in
2000 (Lange, 2001) to close to 90% today3. The ultimate goal for all chemical processes is to form the
target product at 100% selectivity, but even if this is not achieved, higher selectivity means less
energy demand for separation/purification operations, less recycle streams , less GHG and other
process emissions, reduced waste treatment and hence improved overall energy efficiency and
emission levels of the whole process. In most cases a new catalyst is implemented together with
other process improvements and catalyst and reactor form an entity. It is therefore more
meaningful to discuss improvements of catalytic processes rather than catalyst improvements only,
as the isolated impact of a catalyst is difficult or even impossible to quantify. Hence, incremental
improvements in this study include the combined impact of catalyst and other process technology
advances.
BPT deployment The following example shall illustrate what is meant by BPT. The average natural gas based ammonia
plant performs at 15.4 GJ/t NH3 (feedstock excluded). The 2009 benchmark report of the
International Fertilizer Association (Association, December 2009), quantifies the top quartile of
natural gas based ammonia plants in the year 2008 in the range of 28 to 33 GJ/t NH3.Excluding
feedstock the corresponding SEC for BPT ammonia plants is in the range of 7.5 to 12 GJ/t NH3.
Corresponding CO2 emissions for BPT level plants are at 1.5 to 1.6 t/t NH3. A BPT type ammonia plant
is the SAFCO IV plant in Al Jubail, Saudi Arabia, based on the “Uhde Dual Pressure Process” with a
single-train capacity of 3300 t. The SEC of this type of plants is in the range of 7.5 to 10 GJ/ t NH3
depending on local conditions. This range already shows that it is difficult to attribute one fixed SEC
for a given plant type. Moreover, a given process route can have various process configurations.
Ammonia synthesis from natural gas via syngas typically involves seven different catalytic reaction
steps (eight including gas purification). It is therefore obvious that the BPT is not represented by a
single type of technology, but by a range of process configurations belonging to the top 10% of
plants performing at highest energy efficiency. As the highest efficiency is only achievable under
optimal local circumstances and for the largest, highly energy-integrated installations, numbers on
the BPT option in this report are based on the medium value of the SEC range, in the case of
ammonia 11 GJ/t NH3.
3 Several recent patents (e.g. US 6,368,998;WO 2006/102189; US 6,717,001; WO 2004/078736; WO
2007/123932; US 6,511,938; WO 2005/039757) report EO an initial selectivity in the range from 82 to 90%.
Shell commercial catalyst S-882 (which contains rhenium promoter) is reported to have a theoretical initial EO
selectivity of 93% (US 6,717,001).
15
Assumptions for BPT deployment in the DECHEMA model
It is assumed that new plants are predominately erected using the best practice technology, i.e.
having a SEC similar to the most energy efficient plant today. In the BPT optimistic scenario all
new built plants are assumed to have an SEC at BPT level; for the BPT conservative scenario new
plants are assumed to have an SEC, which corresponds to 50 % to the average SEC level and to
50 % to the BPT level.
Both, the average SEC and the BPT improve over time. It is assumed that existing plants are
steadily improved and that the best performing plants are also subject to incremental
improvements. For both cases, the incremental improvement factors have been applied.
At some point in time, plants reach their end of lifetime and are decommissioned. As the real
age distribution and lifetime of production plants worldwide is unknown, a lifetime of 20 years
(30 years for highly capital intensive plants such as crackers and refinery plants) has been
assumed. For installed production capacities, an exponential decay has been assumed within the
plant lifetime
Half of the decommissioned plants get retrofitted while the other half gets replaced by new
plants. For old capacities being replaced the same assumptions have been made as for new
capacities (see above). Retrofitted plants have energy values assigned to them as linear
combinations of current SEC and BPT values. In the BPT optimistic scenario retrofitted plants are
assumed to have an SEC at BPT level, for the BPT conservative scenario retrofitted plants
combine 70% average SEC with 30% BPT.
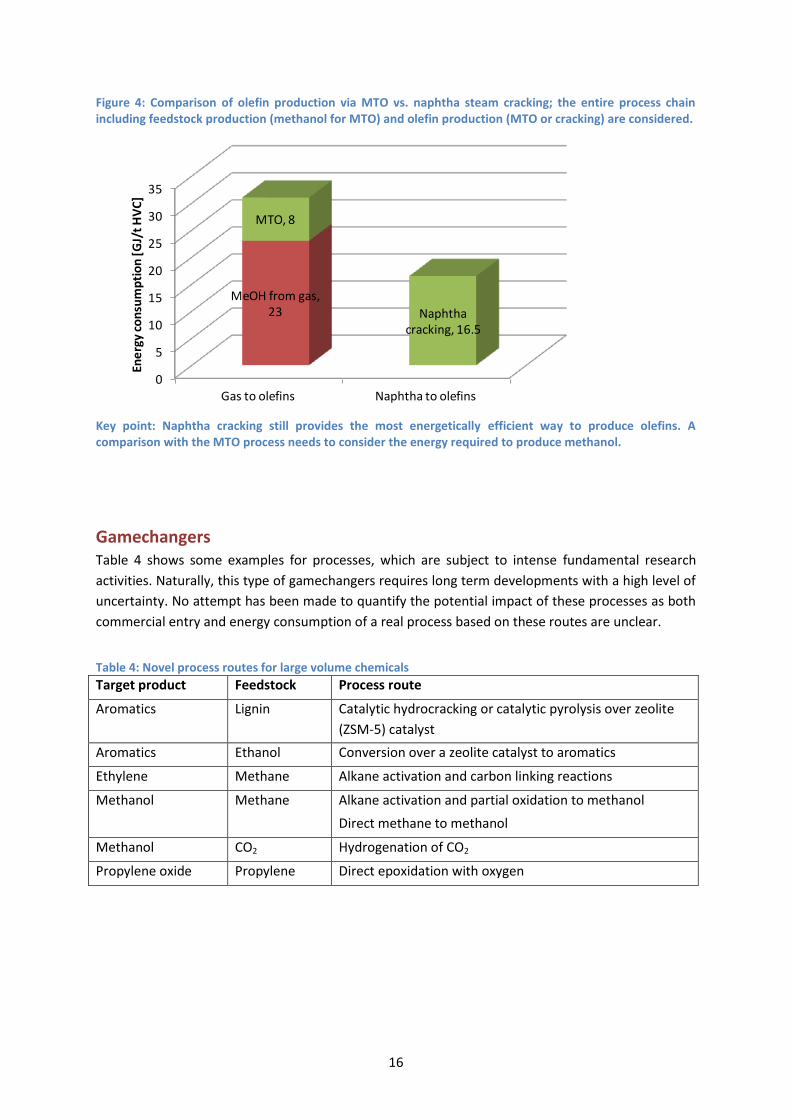
Emerging Technologies Olefin production via methanol
The “methanol-to-olefin process” (MTO)4 circumvents steam cracking of naphtha or ethane and
allows producing olefins from gas or coal instead of oil. For a meaningful comparison of the SEC of
this route with conventional naphtha steam cracking, it is necessary to include the production of the
required methanol as feedstock for the MTO process in the battery limit for the olefin production5.
The average SEC of naphtha steam cracking is in the range of 14 to 17 GJ/t HVC (Ren, 2009). For
MTO technologies, the SEC is in the range of 5 to 8 GJ/t HVC (Ren, 2009). The methanol production
for providing the feedstock of the MTO process requires additional 23 GJ/t HVC. Hence, methanol
production clearly dominates the energy consumption for the gas based route via methanol and
MTO, and nearly 200% of the energy for steam cracking is required for this process. This is shown in
Figure 4, in which the entire process chain is depicted. More efficient methanol synthesis and more
selective catalysts for the MTO process will improve the SEC of the entire process chain, but it is
questionable if the SEC of naphtha cracking will be reached any time soon. However, if methanol is
produced with renewable hydrogen, as described below, substantial GHG savings can be achieved.
4 The MTO process includes the dehydration of methanol to first dimethylether and then further via shape
selective transformation to olefins using ZSM or SAPO catalysts (see for example (Yuen et al. 1994). Usually the process is combined with an olefin cracking process of higher olefins produced. 5 See discussion of SEC definition in Annex 1, section on Boundary conditions for the DECHEMA model.
16
Figure 4: Comparison of olefin production via MTO vs. naphtha steam cracking; the entire process chain including feedstock production (methanol for MTO) and olefin production (MTO or cracking) are considered.
Key point: Naphtha cracking still provides the most energetically efficient way to produce olefins. A comparison with the MTO process needs to consider the energy required to produce methanol.
Gamechangers Table 4 shows some examples for processes, which are subject to intense fundamental research
activities. Naturally, this type of gamechangers requires long term developments with a high level of
uncertainty. No attempt has been made to quantify the potential impact of these processes as both
commercial entry and energy consumption of a real process based on these routes are unclear.
Table 4: Novel process routes for large volume chemicals
Target product Feedstock Process route
Aromatics Lignin Catalytic hydrocracking or catalytic pyrolysis over zeolite
(ZSM-5) catalyst
Aromatics Ethanol Conversion over a zeolite catalyst to aromatics
Ethylene Methane Alkane activation and carbon linking reactions
Methanol Methane Alkane activation and partial oxidation to methanol
Direct methane to methanol
Methanol CO2 Hydrogenation of CO2
Propylene oxide Propylene Direct epoxidation with oxygen
0
5
10
15
20
25
30
35
Gas to olefins Naphtha to olefins
MeOH from gas, 23
MTO, 8
Naphtha cracking, 16.5
Ene
rgy
con
sum
pti
on
[G
J/t
HV
C]
17
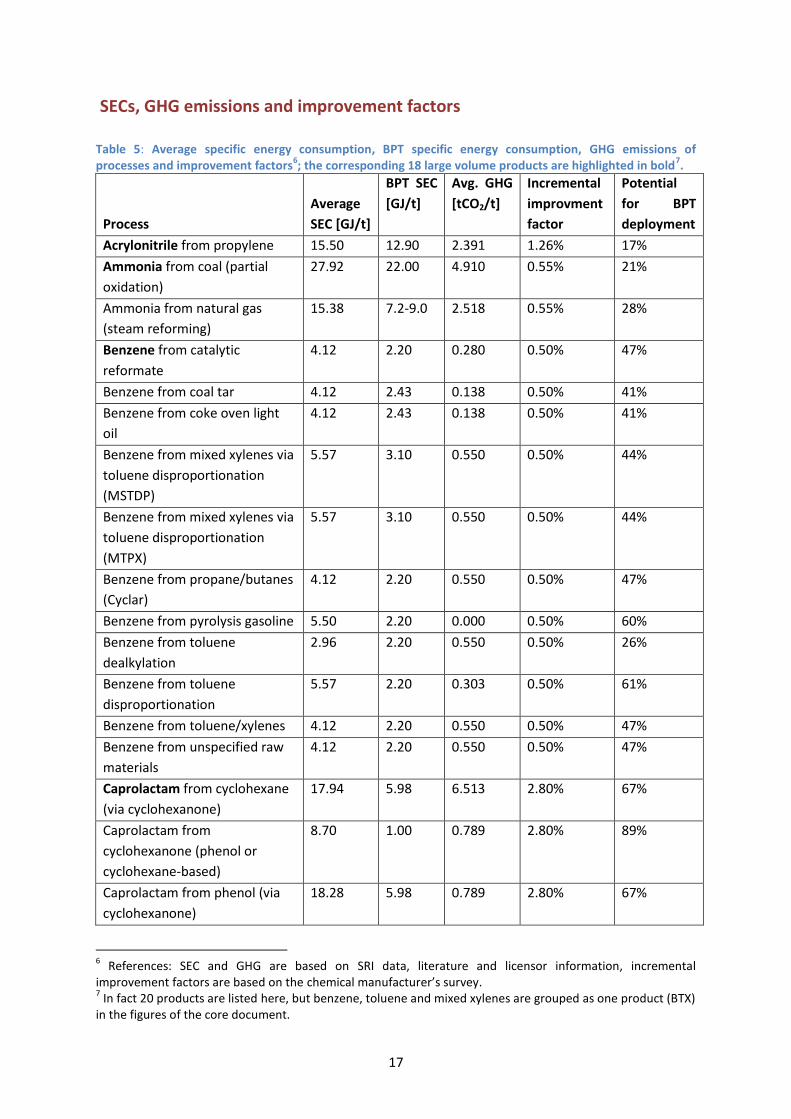
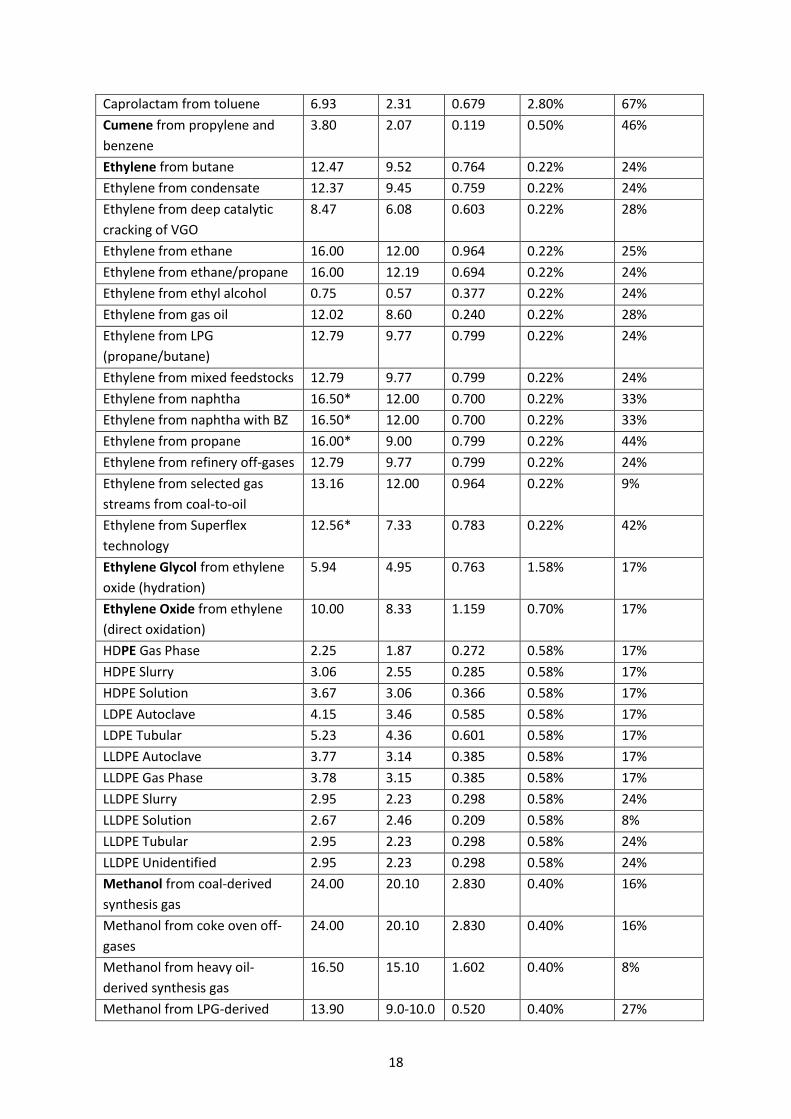
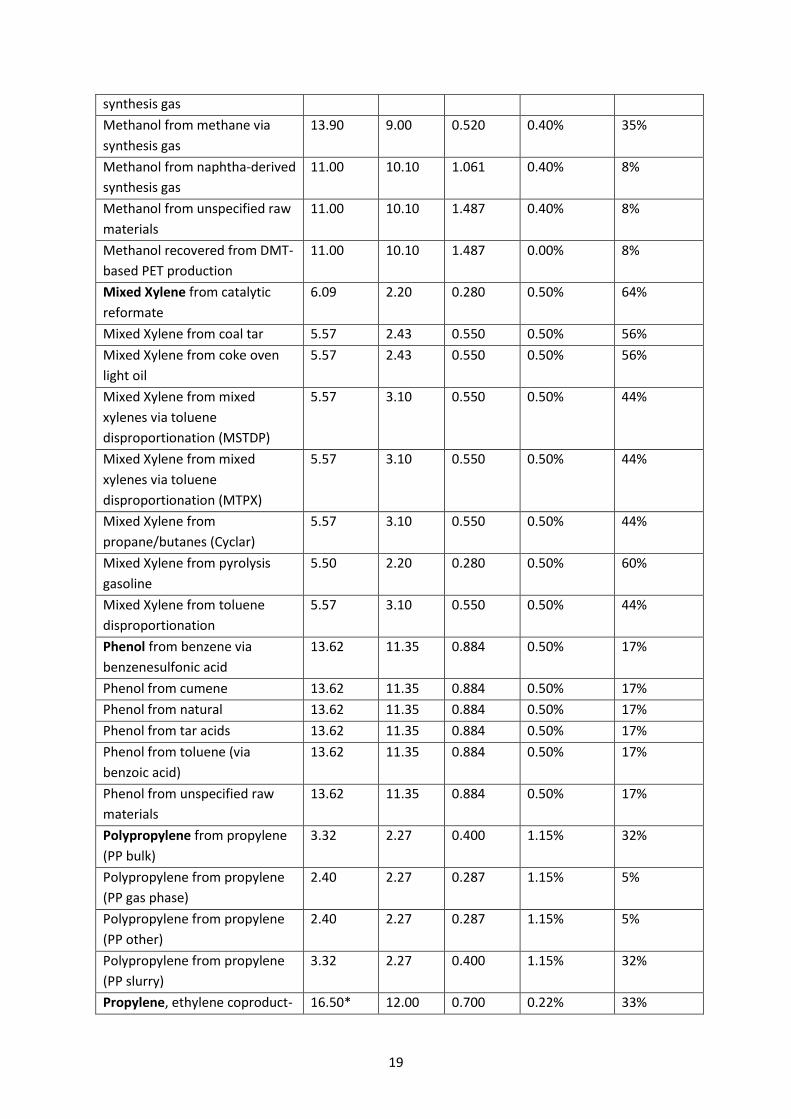
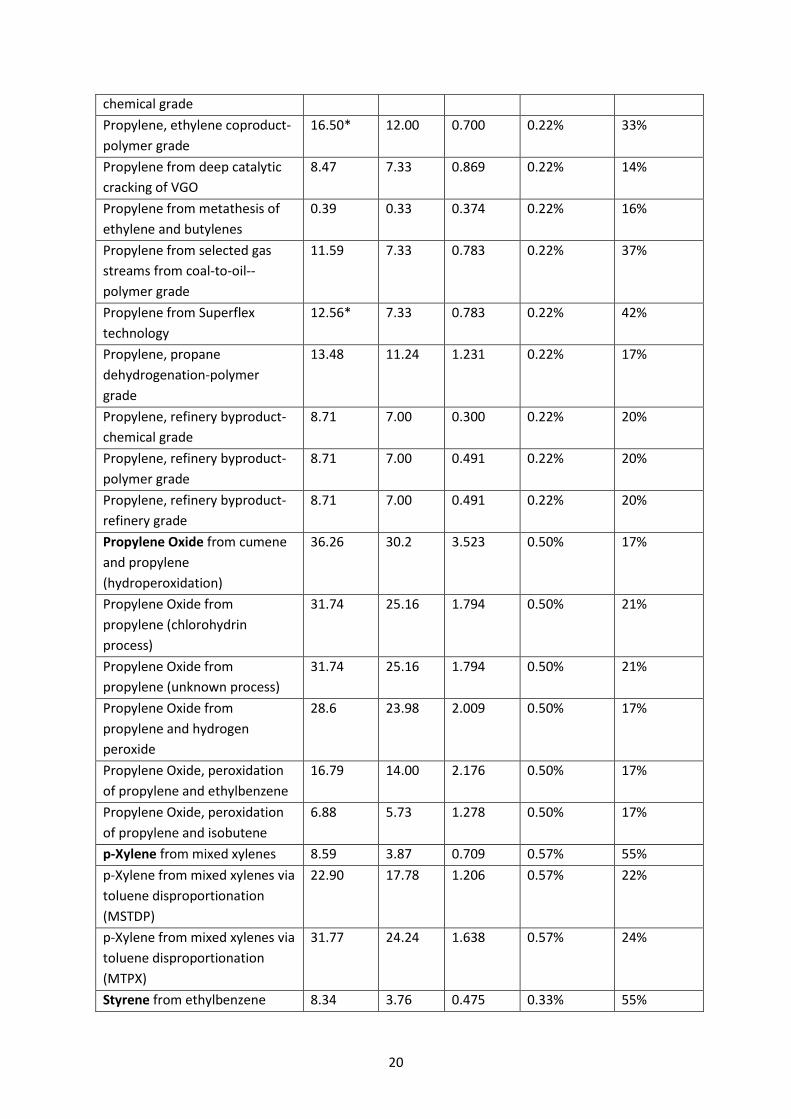
SECs, GHG emissions and improvement factors
Table 5: Average specific energy consumption, BPT specific energy consumption, GHG emissions of processes and improvement factors
6; the corresponding 18 large volume products are highlighted in bold
7.
Process
Average
SEC [GJ/t]
BPT SEC
[GJ/t]
Avg. GHG
[tCO2/t]
Incremental
improvment
factor
Potential
for BPT
deployment
Acrylonitrile from propylene 15.50 12.90 2.391 1.26% 17%
Ammonia from coal (partial
oxidation)
27.92 22.00 4.910 0.55% 21%
Ammonia from natural gas
(steam reforming)
15.38 7.2-9.0 2.518 0.55% 28%
Benzene from catalytic
reformate
4.12 2.20 0.280 0.50% 47%
Benzene from coal tar 4.12 2.43 0.138 0.50% 41%
Benzene from coke oven light
oil
4.12 2.43 0.138 0.50% 41%
Benzene from mixed xylenes via
toluene disproportionation
(MSTDP)
5.57 3.10 0.550 0.50% 44%
Benzene from mixed xylenes via
toluene disproportionation
(MTPX)
5.57 3.10 0.550 0.50% 44%
Benzene from propane/butanes
(Cyclar)
4.12 2.20 0.550 0.50% 47%
Benzene from pyrolysis gasoline 5.50 2.20 0.000 0.50% 60%
Benzene from toluene
dealkylation
2.96 2.20 0.550 0.50% 26%
Benzene from toluene
disproportionation
5.57 2.20 0.303 0.50% 61%
Benzene from toluene/xylenes 4.12 2.20 0.550 0.50% 47%
Benzene from unspecified raw
materials
4.12 2.20 0.550 0.50% 47%
Caprolactam from cyclohexane
(via cyclohexanone)
17.94 5.98 6.513 2.80% 67%
Caprolactam from
cyclohexanone (phenol or
cyclohexane-based)
8.70 1.00 0.789 2.80% 89%
Caprolactam from phenol (via
cyclohexanone)
18.28 5.98 0.789 2.80% 67%
6 References: SEC and GHG are based on SRI data, literature and licensor information, incremental
improvement factors are based on the chemical manufacturer’s survey. 7 In fact 20 products are listed here, but benzene, toluene and mixed xylenes are grouped as one product (BTX)
in the figures of the core document.
18
Caprolactam from toluene 6.93 2.31 0.679 2.80% 67%
Cumene from propylene and
benzene
3.80 2.07 0.119 0.50% 46%
Ethylene from butane 12.47 9.52 0.764 0.22% 24%
Ethylene from condensate 12.37 9.45 0.759 0.22% 24%
Ethylene from deep catalytic
cracking of VGO
8.47 6.08 0.603 0.22% 28%
Ethylene from ethane 16.00 12.00 0.964 0.22% 25%
Ethylene from ethane/propane 16.00 12.19 0.694 0.22% 24%
Ethylene from ethyl alcohol 0.75 0.57 0.377 0.22% 24%
Ethylene from gas oil 12.02 8.60 0.240 0.22% 28%
Ethylene from LPG
(propane/butane)
12.79 9.77 0.799 0.22% 24%
Ethylene from mixed feedstocks 12.79 9.77 0.799 0.22% 24%
Ethylene from naphtha 16.50* 12.00 0.700 0.22% 33%
Ethylene from naphtha with BZ 16.50* 12.00 0.700 0.22% 33%
Ethylene from propane 16.00* 9.00 0.799 0.22% 44%
Ethylene from refinery off-gases 12.79 9.77 0.799 0.22% 24%
Ethylene from selected gas
streams from coal-to-oil
13.16 12.00 0.964 0.22% 9%
Ethylene from Superflex
technology
12.56* 7.33 0.783 0.22% 42%
Ethylene Glycol from ethylene
oxide (hydration)
5.94 4.95 0.763 1.58% 17%
Ethylene Oxide from ethylene
(direct oxidation)
10.00 8.33 1.159 0.70% 17%
HDPE Gas Phase 2.25 1.87 0.272 0.58% 17%
HDPE Slurry 3.06 2.55 0.285 0.58% 17%
HDPE Solution 3.67 3.06 0.366 0.58% 17%
LDPE Autoclave 4.15 3.46 0.585 0.58% 17%
LDPE Tubular 5.23 4.36 0.601 0.58% 17%
LLDPE Autoclave 3.77 3.14 0.385 0.58% 17%
LLDPE Gas Phase 3.78 3.15 0.385 0.58% 17%
LLDPE Slurry 2.95 2.23 0.298 0.58% 24%
LLDPE Solution 2.67 2.46 0.209 0.58% 8%
LLDPE Tubular 2.95 2.23 0.298 0.58% 24%
LLDPE Unidentified 2.95 2.23 0.298 0.58% 24%
Methanol from coal-derived
synthesis gas
24.00 20.10 2.830 0.40% 16%
Methanol from coke oven off-
gases
24.00 20.10 2.830 0.40% 16%
Methanol from heavy oil-
derived synthesis gas
16.50 15.10 1.602 0.40% 8%
Methanol from LPG-derived 13.90 9.0-10.0 0.520 0.40% 27%
19
synthesis gas
Methanol from methane via
synthesis gas
13.90 9.00 0.520 0.40% 35%
Methanol from naphtha-derived
synthesis gas
11.00 10.10 1.061 0.40% 8%
Methanol from unspecified raw
materials
11.00 10.10 1.487 0.40% 8%
Methanol recovered from DMT-
based PET production
11.00 10.10 1.487 0.00% 8%
Mixed Xylene from catalytic
reformate
6.09 2.20 0.280 0.50% 64%
Mixed Xylene from coal tar 5.57 2.43 0.550 0.50% 56%
Mixed Xylene from coke oven
light oil
5.57 2.43 0.550 0.50% 56%
Mixed Xylene from mixed
xylenes via toluene
disproportionation (MSTDP)
5.57 3.10 0.550 0.50% 44%
Mixed Xylene from mixed
xylenes via toluene
disproportionation (MTPX)
5.57 3.10 0.550 0.50% 44%
Mixed Xylene from
propane/butanes (Cyclar)
5.57 3.10 0.550 0.50% 44%
Mixed Xylene from pyrolysis
gasoline
5.50 2.20 0.280 0.50% 60%
Mixed Xylene from toluene
disproportionation
5.57 3.10 0.550 0.50% 44%
Phenol from benzene via
benzenesulfonic acid
13.62 11.35 0.884 0.50% 17%
Phenol from cumene 13.62 11.35 0.884 0.50% 17%
Phenol from natural 13.62 11.35 0.884 0.50% 17%
Phenol from tar acids 13.62 11.35 0.884 0.50% 17%
Phenol from toluene (via
benzoic acid)
13.62 11.35 0.884 0.50% 17%
Phenol from unspecified raw
materials
13.62 11.35 0.884 0.50% 17%
Polypropylene from propylene
(PP bulk)
3.32 2.27 0.400 1.15% 32%
Polypropylene from propylene
(PP gas phase)
2.40 2.27 0.287 1.15% 5%
Polypropylene from propylene
(PP other)
2.40 2.27 0.287 1.15% 5%
Polypropylene from propylene
(PP slurry)
3.32 2.27 0.400 1.15% 32%
Propylene, ethylene coproduct- 16.50* 12.00 0.700 0.22% 33%
20
chemical grade
Propylene, ethylene coproduct-
polymer grade
16.50* 12.00 0.700 0.22% 33%
Propylene from deep catalytic
cracking of VGO
8.47 7.33 0.869 0.22% 14%
Propylene from metathesis of
ethylene and butylenes
0.39 0.33 0.374 0.22% 16%
Propylene from selected gas
streams from coal-to-oil--
polymer grade
11.59 7.33 0.783 0.22% 37%
Propylene from Superflex
technology
12.56* 7.33 0.783 0.22% 42%
Propylene, propane
dehydrogenation-polymer
grade
13.48 11.24 1.231 0.22% 17%
Propylene, refinery byproduct-
chemical grade
8.71 7.00 0.300 0.22% 20%
Propylene, refinery byproduct-
polymer grade
8.71 7.00 0.491 0.22% 20%
Propylene, refinery byproduct-
refinery grade
8.71 7.00 0.491 0.22% 20%
Propylene Oxide from cumene
and propylene
(hydroperoxidation)
36.26 30.2 3.523 0.50% 17%
Propylene Oxide from
propylene (chlorohydrin
process)
31.74 25.16 1.794 0.50% 21%
Propylene Oxide from
propylene (unknown process)
31.74 25.16 1.794 0.50% 21%
Propylene Oxide from
propylene and hydrogen
peroxide
28.6 23.98 2.009 0.50% 17%
Propylene Oxide, peroxidation
of propylene and ethylbenzene
16.79 14.00 2.176 0.50% 17%
Propylene Oxide, peroxidation
of propylene and isobutene
6.88 5.73 1.278 0.50% 17%
p-Xylene from mixed xylenes 8.59 3.87 0.709 0.57% 55%
p-Xylene from mixed xylenes via
toluene disproportionation
(MSTDP)
22.90 17.78 1.206 0.57% 22%
p-Xylene from mixed xylenes via
toluene disproportionation
(MTPX)
31.77 24.24 1.638 0.57% 24%
Styrene from ethylbenzene 8.34 3.76 0.475 0.33% 55%
21
(catalytic dehydrogenation)
Styrene from pyrolysis gasoline 8.34 3.76 0.475 0.33% 55%
Styrene peroxidation of
propylene and ethylbenzene
16.79 14.00 2.192 0.33% 17%
Terephthalic Acid (TPA) from p-
xylene
7.27 5.68 0.875 1.40% 22%
Toluene from catalytic
reformate
2.43 2.20 0.280 0.50% 9%
Toluene from coal tar 2.43 2.20 0.280 0.50% 9%
Toluene from coke-oven light oil 2.43 2.20 0.280 0.50% 9%
Toluene from propane/butanes
(Cyclar)
5.50 3.10 0.550 0.50% 44%
Toluene from pyrolysis gasoline 5.50 2.20 0.550 0.50% 60%
Toluene from unspecified raw
materials
5.50 2.20 0.550 0.50% 60%
Vinyl Chloride Monomer (VCM)
from ethylene and ethylene
dichloride
5.75 4.79 0.445 0.59% 17%
Vinyl Chloride Monomer (VCM)
from ethylene dichloride
(pyrolysis)
7.53 6.27 0.493 0.59% 17%
*per t HVC (see discussion on energy allocation for multi-product processes in Annex 1)
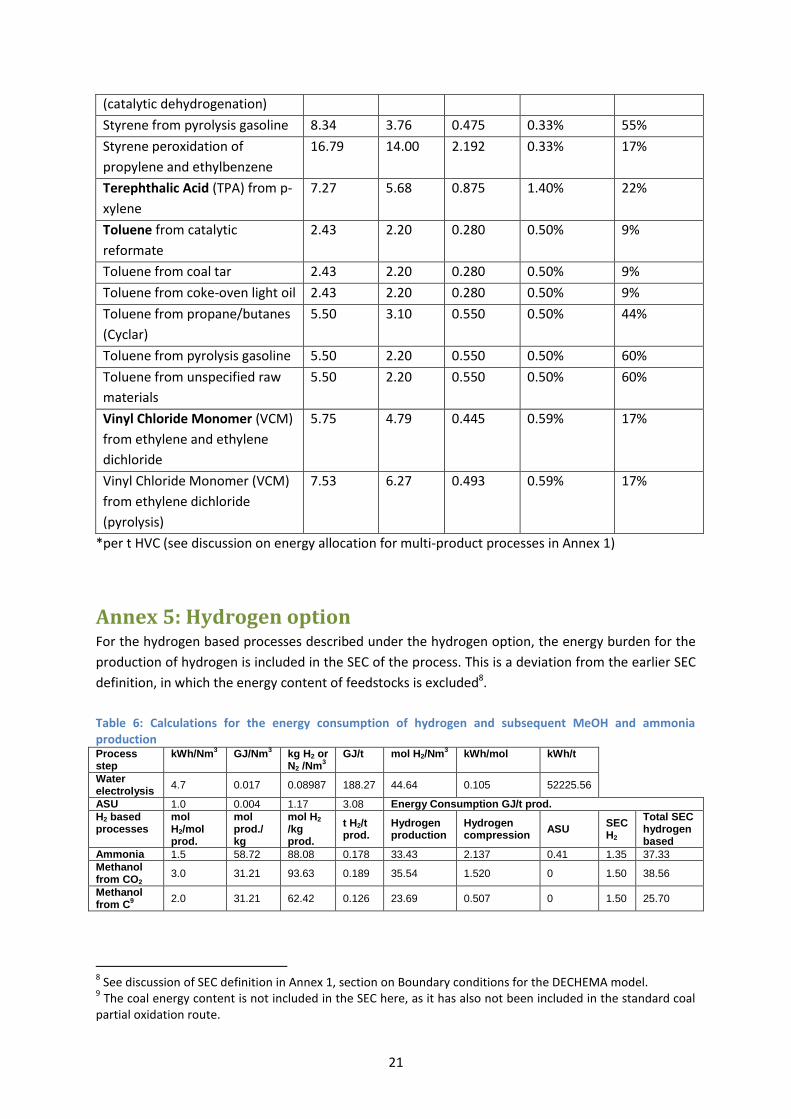
Annex 5: Hydrogen option For the hydrogen based processes described under the hydrogen option, the energy burden for the
production of hydrogen is included in the SEC of the process. This is a deviation from the earlier SEC
definition, in which the energy content of feedstocks is excluded8.
Table 6: Calculations for the energy consumption of hydrogen and subsequent MeOH and ammonia production Process step
kWh/Nm3 GJ/Nm
3 kg H2 or
N2 /Nm3
GJ/t mol H2/Nm3 kWh/mol kWh/t
Water electrolysis
4.7 0.017 0.08987 188.27 44.64 0.105 52225.56
ASU 1.0 0.004 1.17 3.08 Energy Consumption GJ/t prod.
H2 based processes
mol H2/mol prod.
mol prod./ kg
mol H2 /kg prod.
t H2/t prod.
Hydrogen production
Hydrogen compression
ASU SEC H2
Total SEC hydrogen based
Ammonia 1.5 58.72 88.08 0.178 33.43 2.137 0.41 1.35 37.33
Methanol from CO2
3.0 31.21 93.63 0.189 35.54 1.520 0 1.50 38.56
Methanol from C
9
2.0 31.21 62.42 0.126 23.69 0.507 0 1.50 25.70
8 See discussion of SEC definition in Annex 1, section on Boundary conditions for the DECHEMA model.
9 The coal energy content is not included in the SEC here, as it has also not been included in the standard coal
partial oxidation route.
22
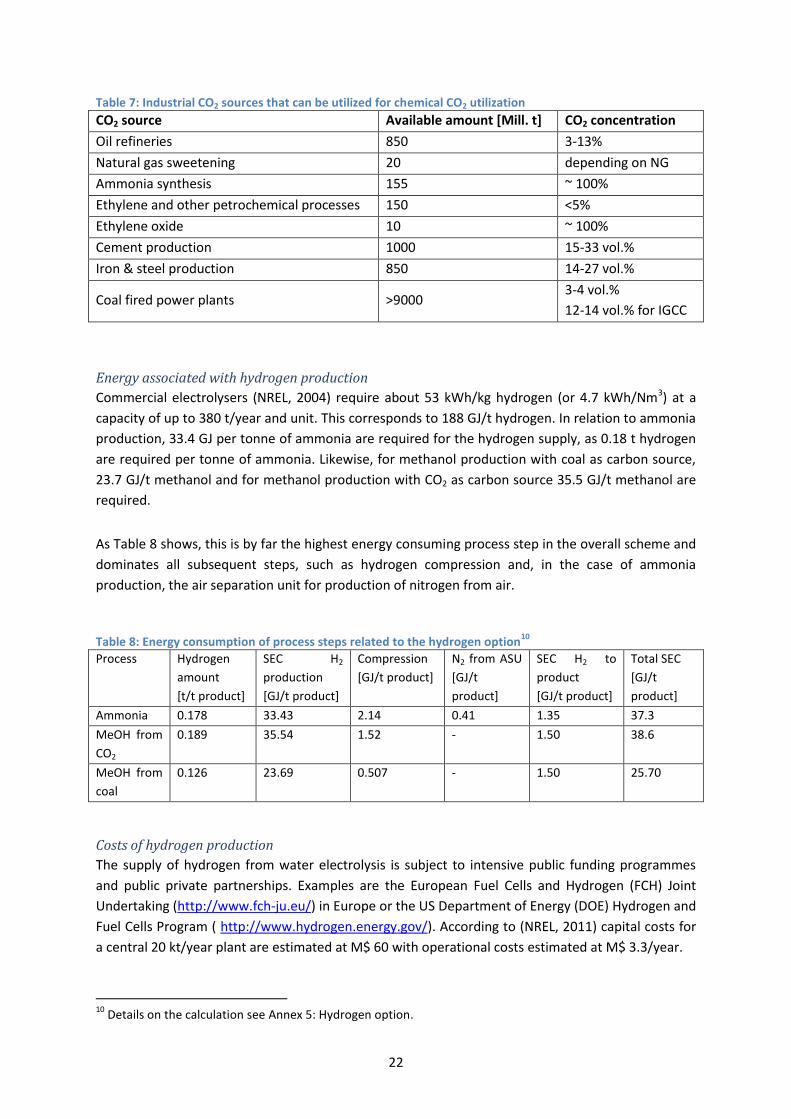
Table 7: Industrial CO2 sources that can be utilized for chemical CO2 utilization
CO2 source Available amount [Mill. t] CO2 concentration
Oil refineries 850 3-13%
Natural gas sweetening 20 depending on NG
Ammonia synthesis 155 ~ 100%
Ethylene and other petrochemical processes 150 <5%
Ethylene oxide 10 ~ 100%
Cement production 1000 15-33 vol.%
Iron & steel production 850 14-27 vol.%
Coal fired power plants >9000 3-4 vol.%
12-14 vol.% for IGCC
Energy associated with hydrogen production
Commercial electrolysers (NREL, 2004) require about 53 kWh/kg hydrogen (or 4.7 kWh/Nm3) at a
capacity of up to 380 t/year and unit. This corresponds to 188 GJ/t hydrogen. In relation to ammonia
production, 33.4 GJ per tonne of ammonia are required for the hydrogen supply, as 0.18 t hydrogen
are required per tonne of ammonia. Likewise, for methanol production with coal as carbon source,
23.7 GJ/t methanol and for methanol production with CO2 as carbon source 35.5 GJ/t methanol are
required.
As Table 8 shows, this is by far the highest energy consuming process step in the overall scheme and
dominates all subsequent steps, such as hydrogen compression and, in the case of ammonia
production, the air separation unit for production of nitrogen from air.
Table 8: Energy consumption of process steps related to the hydrogen option
10
Process Hydrogen
amount
[t/t product]
SEC H2
production
[GJ/t product]
Compression
[GJ/t product]
N2 from ASU
[GJ/t
product]
SEC H2 to
product
[GJ/t product]
Total SEC
[GJ/t
product]
Ammonia 0.178 33.43 2.14 0.41 1.35 37.3
MeOH from
CO2
0.189 35.54 1.52 - 1.50 38.6
MeOH from
coal
0.126 23.69 0.507 - 1.50 25.70
Costs of hydrogen production
The supply of hydrogen from water electrolysis is subject to intensive public funding programmes
and public private partnerships. Examples are the European Fuel Cells and Hydrogen (FCH) Joint
Undertaking (http://www.fch-ju.eu/) in Europe or the US Department of Energy (DOE) Hydrogen and
Fuel Cells Program ( http://www.hydrogen.energy.gov/). According to (NREL, 2011) capital costs for
a central 20 kt/year plant are estimated at M$ 60 with operational costs estimated at M$ 3.3/year.
10
Details on the calculation see Annex 5: Hydrogen option.
23
IEA (IEA, 2007) compared hydrogen costs and sensitivity to energy prices of different technologies,
i.e. coal/biomass gasification, natural gas steam reforming and electrolysis. For a price of 35$ per
MWh electricity, hydrogen can be produced via electrolysis at 3.6 $/kg, whereas steam reforming of
natural gas at 6 to 9 $ /GJ NG results in hydrogen costs of 1.2 to 1.8 $/kg. Hence costs for hydrogen
from electrolysis are roughly twice of those from gas steam reforming. Benner et al. (Benner, 2012)
estimated costs for future hydrogen based ammonia production compared to conventional natural
gas based ammonia production. They conclude investment costs of a centralised water electrolysis
plant to be one third of the investment costs of a conventional natural gas based plant of equivalent
production capacity. Total specific production costs for ammonia based on estimated power
production costs for hydropower and wind power in 2050 given in recent reports of SRREN and
EWEA were estimated to be competitive for cheap hydropower, but to require a surcharge between
€ 0–175/tonne NH3 in case of hydropower and € 350-500/tonne NH3 in case of wind-power based
production. For the scenario of 30% ammonia and methanol production to be based on hydrogen in
2050 (see Figure 10 of the roadmap) 2.4 EJ energy would be required, of which 1,16 EJ or roughly
318 TWh would be supplied as electricity from renewable sources11.
Annex 6: Biomass based process routes
Considered routes The following routes are considered as part of the biomass gamechanger option:
1. Lignocellulosic biomass gasification and subsequent methanol synthesis, followed by an
MTO process to olefins
2. Direct fermentation of sugar/starch rich biomass (e.g. sugar cane, sugar beet or maize
starch) to ethanol, subsequent dehydration to ethylene, evtl. followed by polyethylene synthesis.
Different bioethanol routes are well described and either operated on industrial scale or close to
commercial entry. For the other routes investigated, sufficient data is available by design studies and
demonstration and pilot plant operation to provide a realistic assessment. Related routes such as
hydrolysis of lignocellulosic biomass and subsequent fermentation to ethanol or biomass gasification
and syngas fermentation to ethanol are not considered here, as these routes are still predominately
determinded by R&D activities and limited data is available on potential energy consumption on
commercial scale.
Database
A number of studies and papers are dedicated to biomass routes to ethylene, propylene or
polyethylene as final products. Ren (Ren, 2009) analysed the energy consumption and GHG
emissions of sugar-cane based ethylene production and biomass based methanol with subsequent
olefin production with napthta steam cracking. The well-to-wheel report (Edwards, 2011) describes
different processes for producing, transporting and manufacturing of fuels and the respective energy
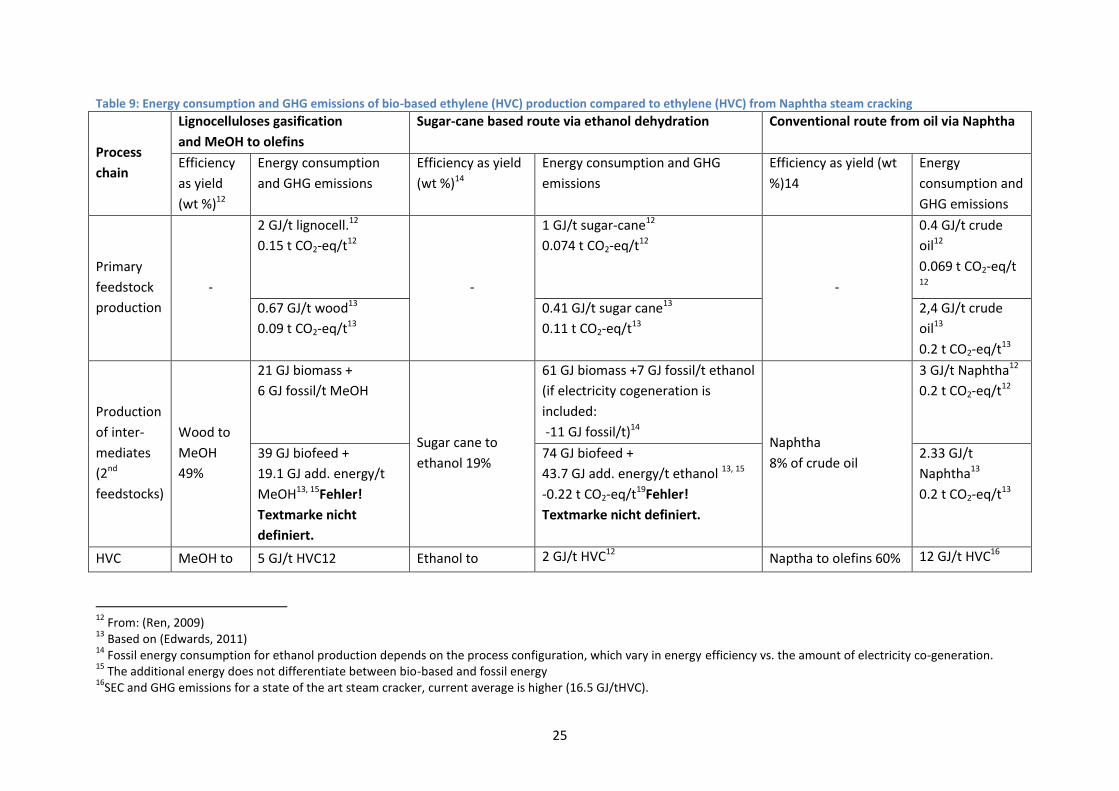
and GHG balances for the various routes. Table 9 lists the different numbers from these studies and
11
This assumes that hydrogen production, nitrogen separation by the ASU and gas compression would be electrically based, whereas the final reaction step of ammonia or methanol synthesis are still based on fossil fuels (compare Table 8).
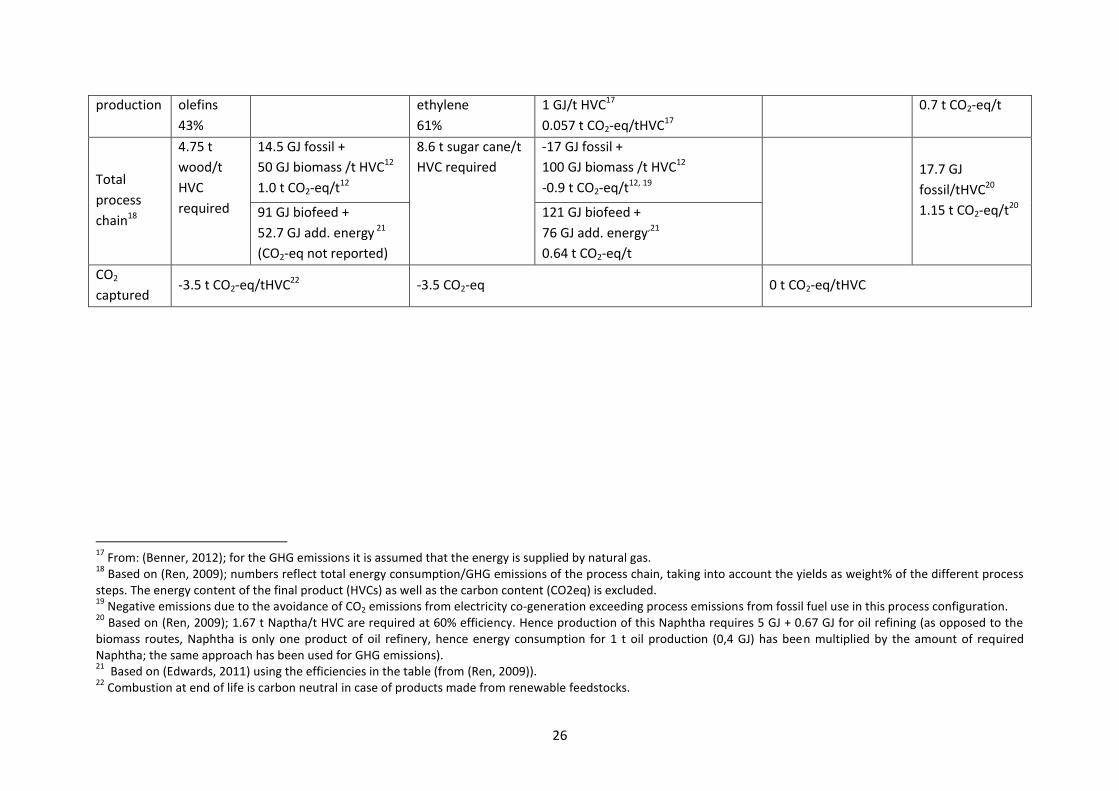
24
supplementing data from other studies. The row entitled “Total process chain” in the table provides
the cumulated numbers for the entire process chain from primary feedstock production to the
olefins as product.
Comparison of a biomass route with a fossil fuel based process also has to be done for the respective
entire process chains, as the energy use in production of the respective primary feedstocks (biomass,
oil, gas, coal), secondary feedstocks and intermediates (e.g. naphtha for fossil based ethylene,
ethanol for biomass based ethylene) are largely different for the compared routes. Comparison of
only the last reaction step in the respective processes would result in a biased picture on energy
consumption (see similar discussion in the methanol to olefin chapter and (Ren, 2009) for a more
detailed analysis). This is a deviation from the SEC definition, as already described in the emerging
technologies section of Annex 4 and the hydrogen option in Annex 5. For further explanation please
refer to the discussion of SEC definition in Annex 1, section on “Boundary conditions for the
DECHEMA model”.
25
Table 9: Energy consumption and GHG emissions of bio-based ethylene (HVC) production compared to ethylene (HVC) from Naphtha steam cracking
Process
chain
Lignocelluloses gasification
and MeOH to olefins
Sugar-cane based route via ethanol dehydration Conventional route from oil via Naphtha
Efficiency
as yield
(wt %)12
Energy consumption
and GHG emissions
Efficiency as yield
(wt %)14
Energy consumption and GHG
emissions
Efficiency as yield (wt
%)14
Energy
consumption and
GHG emissions
Primary
feedstock
production
-
2 GJ/t lignocell.12
0.15 t CO2-eq/t12
-
1 GJ/t sugar-cane12
0.074 t CO2-eq/t12
-
0.4 GJ/t crude
oil12
0.069 t CO2-eq/t 12
0.67 GJ/t wood13
0.09 t CO2-eq/t13
0.41 GJ/t sugar cane13
0.11 t CO2-eq/t13
2,4 GJ/t crude
oil13
0.2 t CO2-eq/t13
Production
of inter-
mediates
(2nd
feedstocks)
Wood to
MeOH
49%
21 GJ biomass +
6 GJ fossil/t MeOH
Sugar cane to
ethanol 19%
61 GJ biomass +7 GJ fossil/t ethanol
(if electricity cogeneration is
included:
-11 GJ fossil/t)14 Naphtha
8% of crude oil
3 GJ/t Naphtha12
0.2 t CO2-eq/t12
39 GJ biofeed +
19.1 GJ add. energy/t
MeOH13, 15Fehler!
Textmarke nicht
definiert.
74 GJ biofeed +
43.7 GJ add. energy/t ethanol 13, 15
-0.22 t CO2-eq/t19Fehler!
Textmarke nicht definiert.
2.33 GJ/t
Naphtha13
0.2 t CO2-eq/t13
HVC MeOH to 5 GJ/t HVC12 Ethanol to 2 GJ/t HVC12 Naptha to olefins 60% 12 GJ/t HVC16
12
From: (Ren, 2009) 13
Based on (Edwards, 2011) 14
Fossil energy consumption for ethanol production depends on the process configuration, which vary in energy efficiency vs. the amount of electricity co-generation. 15
The additional energy does not differentiate between bio-based and fossil energy 16
SEC and GHG emissions for a state of the art steam cracker, current average is higher (16.5 GJ/tHVC).
26
production olefins
43%
ethylene
61%
1 GJ/t HVC17
0.057 t CO2-eq/tHVC17
0.7 t CO2-eq/t
Total
process
chain18
4.75 t
wood/t
HVC
required
14.5 GJ fossil +
50 GJ biomass /t HVC12
1.0 t CO2-eq/t12
8.6 t sugar cane/t
HVC required
-17 GJ fossil +
100 GJ biomass /t HVC12
-0.9 t CO2-eq/t12, 19
17.7 GJ
fossil/tHVC20
1.15 t CO2-eq/t20
91 GJ biofeed +
52.7 GJ add. energy 21
(CO2-eq not reported)
121 GJ biofeed +
76 GJ add. energy,21
0.64 t CO2-eq/t
CO2
captured -3.5 t CO2-eq/tHVC22 -3.5 CO2-eq 0 t CO2-eq/tHVC
17
From: (Benner, 2012); for the GHG emissions it is assumed that the energy is supplied by natural gas. 18
Based on (Ren, 2009); numbers reflect total energy consumption/GHG emissions of the process chain, taking into account the yields as weight% of the different process steps. The energy content of the final product (HVCs) as well as the carbon content (CO2eq) is excluded. 19
Negative emissions due to the avoidance of CO2 emissions from electricity co-generation exceeding process emissions from fossil fuel use in this process configuration. 20
Based on (Ren, 2009); 1.67 t Naptha/t HVC are required at 60% efficiency. Hence production of this Naphtha requires 5 GJ + 0.67 GJ for oil refining (as opposed to the biomass routes, Naphtha is only one product of oil refinery, hence energy consumption for 1 t oil production (0,4 GJ) has been multiplied by the amount of required Naphtha; the same approach has been used for GHG emissions). 21
Based on (Edwards, 2011) using the efficiencies in the table (from (Ren, 2009)). 22
Combustion at end of life is carbon neutral in case of products made from renewable feedstocks.
27
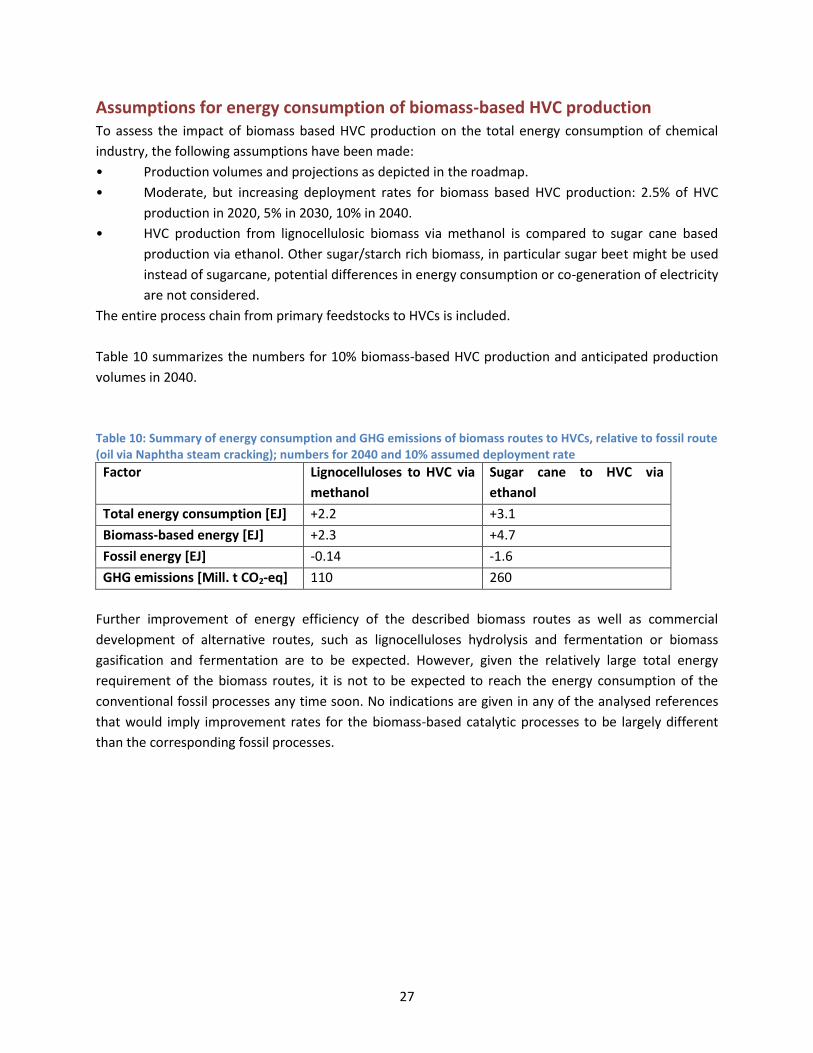
Assumptions for energy consumption of biomass-based HVC production To assess the impact of biomass based HVC production on the total energy consumption of chemical
industry, the following assumptions have been made:
• Production volumes and projections as depicted in the roadmap.
• Moderate, but increasing deployment rates for biomass based HVC production: 2.5% of HVC
production in 2020, 5% in 2030, 10% in 2040.
• HVC production from lignocellulosic biomass via methanol is compared to sugar cane based
production via ethanol. Other sugar/starch rich biomass, in particular sugar beet might be used
instead of sugarcane, potential differences in energy consumption or co-generation of electricity
are not considered.
The entire process chain from primary feedstocks to HVCs is included.
Table 10 summarizes the numbers for 10% biomass-based HVC production and anticipated production
volumes in 2040.
Table 10: Summary of energy consumption and GHG emissions of biomass routes to HVCs, relative to fossil route (oil via Naphtha steam cracking); numbers for 2040 and 10% assumed deployment rate
Factor Lignocelluloses to HVC via
methanol
Sugar cane to HVC via
ethanol
Total energy consumption [EJ] +2.2 +3.1
Biomass-based energy [EJ] +2.3 +4.7
Fossil energy [EJ] -0.14 -1.6
GHG emissions [Mill. t CO2-eq] 110 260
Further improvement of energy efficiency of the described biomass routes as well as commercial
development of alternative routes, such as lignocelluloses hydrolysis and fermentation or biomass
gasification and fermentation are to be expected. However, given the relatively large total energy
requirement of the biomass routes, it is not to be expected to reach the energy consumption of the
conventional fossil processes any time soon. No indications are given in any of the analysed references
that would imply improvement rates for the biomass-based catalytic processes to be largely different
than the corresponding fossil processes.

28
Annex 7: Refineries Assessing the Refining sector for energy and GHG reductions is much more difficult than the Chemicals
sector. The variety of feeds in refinery units that change on a regular basis make these estimates very
difficult. The feed changes are economically driven and the catalysts change based on the feeds. The
SECs of catalytic refinery steps in Table 11 and the refinery cuts in Table 12 of this Annex are therefore
indicative only.
Overall, the same outcomes are applicable to the refining sector as was gleaned from the Chemicals
work: namely
1.) Constant improvement in catalytic processes ( FCC, Reforming, Hydrocracking) are essential to
reduce energy consumption in refining processes.
2.) Game changers such as bio-based feeds for liquid fuels conserves fossil fuels
3.) Game changers such as processing of heavy bitumen ( tar sands) to synthetic oil and it’s treatment
before traditional refining operations will see greater application which brings along higher energy
consumption and GHG emissions. There is a need for further R&D to develop catalytic improvements to
convert heavy oils into refinery ready feedstocks.
Table 11 shows the specific energy consumption for the catalytic processes for US refineries. The table
shows that BPT level plants consume 20 to 30% less energy than the average refinery. The listed
theoretical minimum represents the thermodynamic minimum energy requirement –which will not be
achievable in practise. Instead, a practical operational limit of 30% or higher above theoretical is
assumed.
Table 11: Specific energy consumption of catalytic process steps in US oil refineries
Energy consumption [GJ/bbl] FCC Reforming Hydrotreating
avg SEC US Refineries 0.19 0.28 0.086 SEC of BPT level plant 0.14 0.21 0.06 theoretical minimumFehler! extmarke nicht definiert.
0.04 0.083 0.03
Practical operational limit 0.1 0.16 0.04
Source: (Energetics Incorporated, 2006)
Catalytic process steps in refineries Catalytic cracking in refineries is one of the most important existing technical processes. In order to use
the major part of crude oil as gasoline, diesel and fuel oil, catalytic cracking is required to cut the long
chain hydrocarbons of crude oil into smaller hydrocarbons. Fluid catalytic cracking (FCC) is the most
important conversion process used in petroleum refineries. This process uses acidic zeolites as catalyst
and produces a high yield of gasoline and LPG, while hydrocracking is a major source of jet fuel, diesel,
naphtha, and LPG. One estimates that the introduction of zeolite catalysts for FCC replacing former
amorphous alumosilicates saves 400 million barrels of crude oil per year (Blauwhoff, 1999).
29
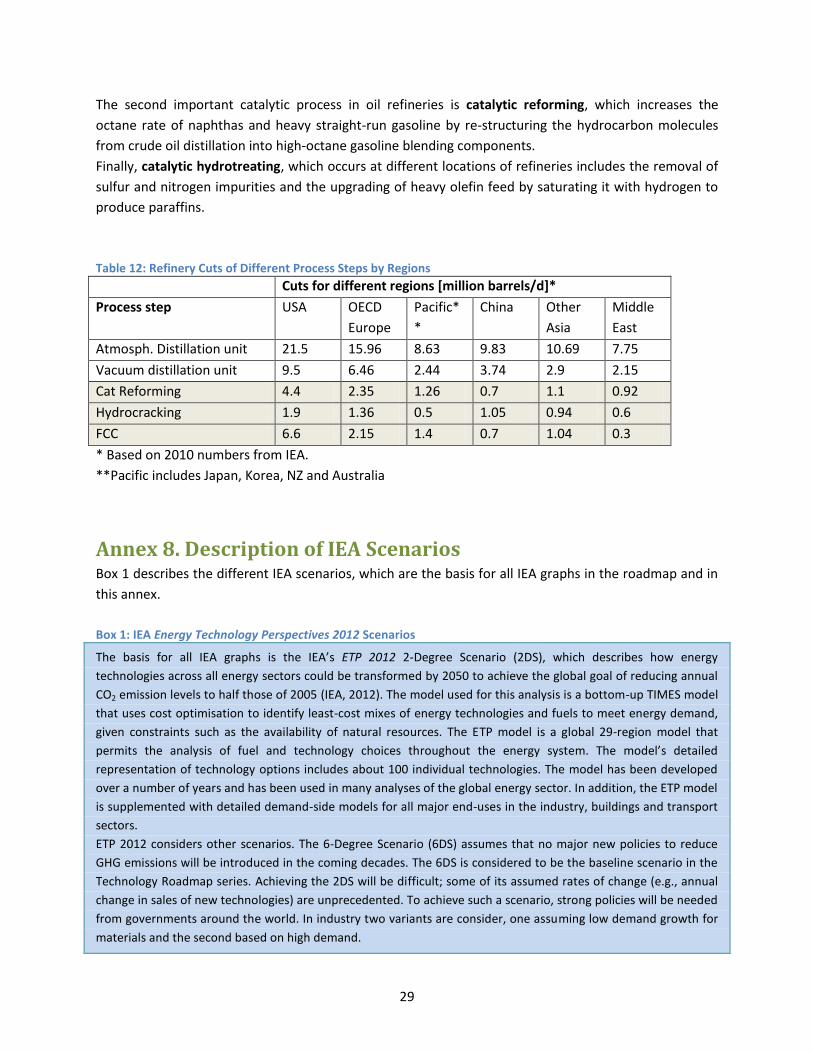
The second important catalytic process in oil refineries is catalytic reforming, which increases the
octane rate of naphthas and heavy straight-run gasoline by re-structuring the hydrocarbon molecules
from crude oil distillation into high-octane gasoline blending components.
Finally, catalytic hydrotreating, which occurs at different locations of refineries includes the removal of
sulfur and nitrogen impurities and the upgrading of heavy olefin feed by saturating it with hydrogen to
produce paraffins.
Table 12: Refinery Cuts of Different Process Steps by Regions
Cuts for different regions [million barrels/d]*
Process step USA OECD
Europe
Pacific*
*
China Other
Asia
Middle
East
Atmosph. Distillation unit 21.5 15.96 8.63 9.83 10.69 7.75
Vacuum distillation unit 9.5 6.46 2.44 3.74 2.9 2.15
Cat Reforming 4.4 2.35 1.26 0.7 1.1 0.92
Hydrocracking 1.9 1.36 0.5 1.05 0.94 0.6
FCC 6.6 2.15 1.4 0.7 1.04 0.3
* Based on 2010 numbers from IEA.
**Pacific includes Japan, Korea, NZ and Australia
Annex 8. Description of IEA Scenarios Box 1 describes the different IEA scenarios, which are the basis for all IEA graphs in the roadmap and in
this annex.
Box 1: IEA Energy Technology Perspectives 2012 Scenarios
The basis for all IEA graphs is the IEA’s ETP 2012 2-Degree Scenario (2DS), which describes how energy
technologies across all energy sectors could be transformed by 2050 to achieve the global goal of reducing annual
CO2 emission levels to half those of 2005 (IEA, 2012). The model used for this analysis is a bottom-up TIMES model
that uses cost optimisation to identify least-cost mixes of energy technologies and fuels to meet energy demand,
given constraints such as the availability of natural resources. The ETP model is a global 29-region model that
permits the analysis of fuel and technology choices throughout the energy system. The model’s detailed
representation of technology options includes about 100 individual technologies. The model has been developed
over a number of years and has been used in many analyses of the global energy sector. In addition, the ETP model
is supplemented with detailed demand-side models for all major end-uses in the industry, buildings and transport
sectors.
ETP 2012 considers other scenarios. The 6-Degree Scenario (6DS) assumes that no major new policies to reduce
GHG emissions will be introduced in the coming decades. The 6DS is considered to be the baseline scenario in the
Technology Roadmap series. Achieving the 2DS will be difficult; some of its assumed rates of change (e.g., annual
change in sales of new technologies) are unprecedented. To achieve such a scenario, strong policies will be needed
from governments around the world. In industry two variants are consider, one assuming low demand growth for
materials and the second based on high demand.
30
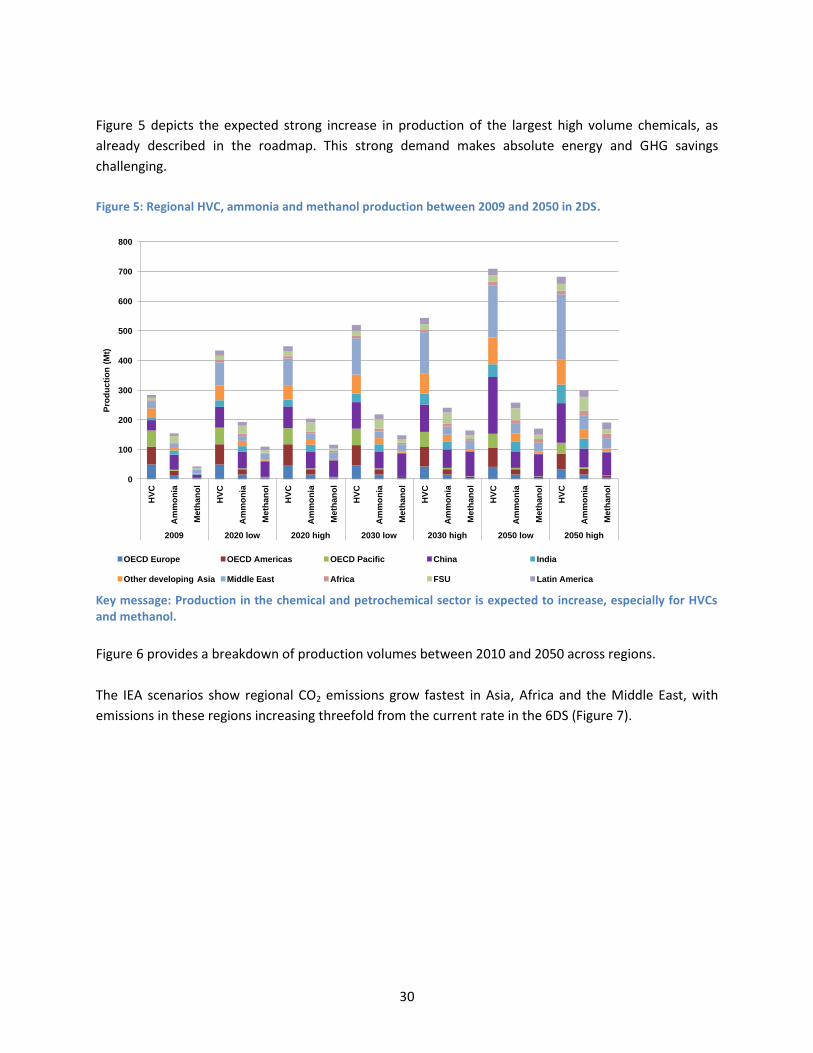
Figure 5 depicts the expected strong increase in production of the largest high volume chemicals, as
already described in the roadmap. This strong demand makes absolute energy and GHG savings
challenging.
Figure 5: Regional HVC, ammonia and methanol production between 2009 and 2050 in 2DS.
Key message: Production in the chemical and petrochemical sector is expected to increase, especially for HVCs and methanol.
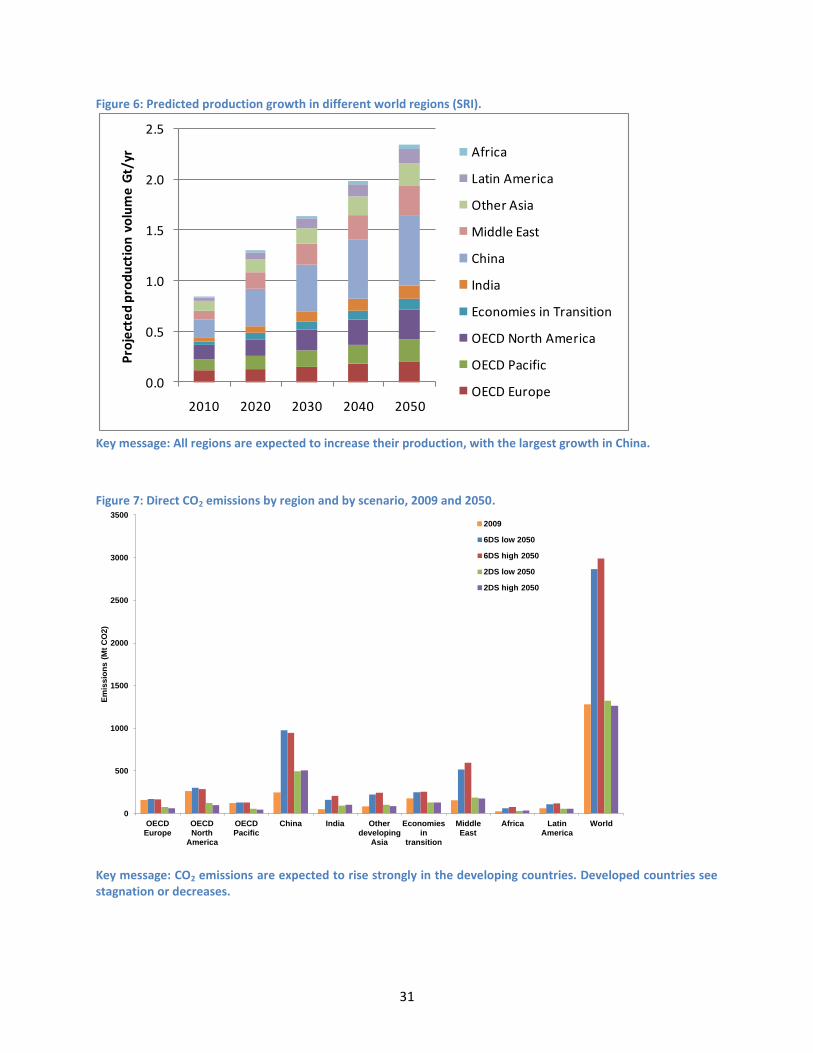
Figure 6 provides a breakdown of production volumes between 2010 and 2050 across regions.
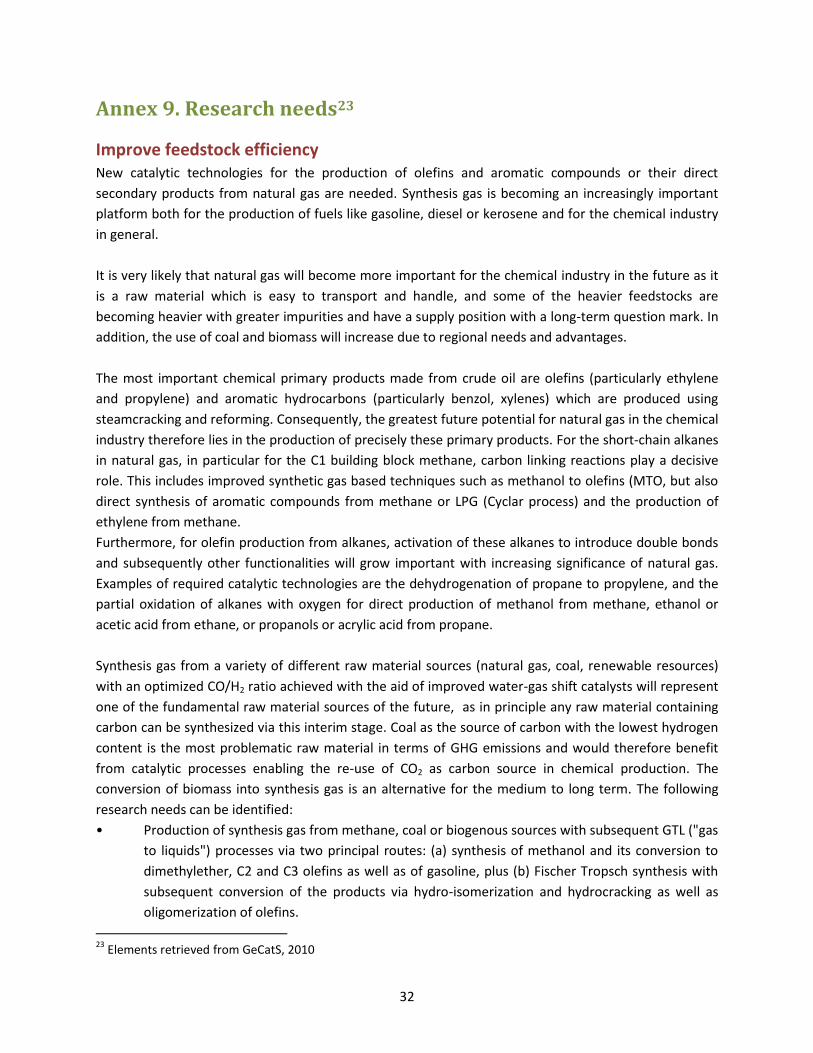
The IEA scenarios show regional CO2 emissions grow fastest in Asia, Africa and the Middle East, with
emissions in these regions increasing threefold from the current rate in the 6DS (Figure 7).
0
100
200
300
400
500
600
700
800
HV
C
Am
mo
nia
Me
tha
no
l
HV
C
Am
mo
nia
Meth
an
ol
HV
C
Am
mo
nia
Meth
an
ol
HV
C
Am
mo
nia
Meth
an
ol
HV
C
Am
mo
nia
Meth
an
ol
HV
C
Am
mo
nia
Meth
an
ol
HV
C
Am
mo
nia
Meth
an
ol
2009 2020 low 2020 high 2030 low 2030 high 2050 low 2050 high
Pro
du
cti
on
(M
t)
OECD Europe OECD Americas OECD Pacific China India
Other developing Asia Middle East Africa FSU Latin America
31
Figure 6: Predicted production growth in different world regions (SRI).
Key message: All regions are expected to increase their production, with the largest growth in China.
Figure 7: Direct CO2 emissions by region and by scenario, 2009 and 2050.
Key message: CO2 emissions are expected to rise strongly in the developing countries. Developed countries see stagnation or decreases.
0.0
0.5
1.0
1.5
2.0
2.5
2010 2020 2030 2040 2050
Pro
ject
ed
pro
du
ctio
n v
olu
me
Gt/
yr Africa
Latin America
Other Asia
Middle East
China
India
Economies in Transition
OECD North America
OECD Pacific
OECD Europe
0
500
1000
1500
2000
2500
3000
3500
OECD Europe
OECD North
America
OECD Pacific
China India Other developing
Asia
Economies in
transition
Middle East
Africa Latin America
World
Em
issio
ns (
Mt
CO
2)
2009
6DS low 2050
6DS high 2050
2DS low 2050
2DS high 2050
32
Annex 9. Research needs23
Improve feedstock efficiency New catalytic technologies for the production of olefins and aromatic compounds or their direct
secondary products from natural gas are needed. Synthesis gas is becoming an increasingly important
platform both for the production of fuels like gasoline, diesel or kerosene and for the chemical industry
in general.
It is very likely that natural gas will become more important for the chemical industry in the future as it
is a raw material which is easy to transport and handle, and some of the heavier feedstocks are
becoming heavier with greater impurities and have a supply position with a long-term question mark. In
addition, the use of coal and biomass will increase due to regional needs and advantages.
The most important chemical primary products made from crude oil are olefins (particularly ethylene
and propylene) and aromatic hydrocarbons (particularly benzol, xylenes) which are produced using
steamcracking and reforming. Consequently, the greatest future potential for natural gas in the chemical
industry therefore lies in the production of precisely these primary products. For the short-chain alkanes
in natural gas, in particular for the C1 building block methane, carbon linking reactions play a decisive
role. This includes improved synthetic gas based techniques such as methanol to olefins (MTO, but also
direct synthesis of aromatic compounds from methane or LPG (Cyclar process) and the production of
ethylene from methane.
Furthermore, for olefin production from alkanes, activation of these alkanes to introduce double bonds
and subsequently other functionalities will grow important with increasing significance of natural gas.
Examples of required catalytic technologies are the dehydrogenation of propane to propylene, and the
partial oxidation of alkanes with oxygen for direct production of methanol from methane, ethanol or
acetic acid from ethane, or propanols or acrylic acid from propane.
Synthesis gas from a variety of different raw material sources (natural gas, coal, renewable resources)
with an optimized CO/H2 ratio achieved with the aid of improved water-gas shift catalysts will represent
one of the fundamental raw material sources of the future, as in principle any raw material containing
carbon can be synthesized via this interim stage. Coal as the source of carbon with the lowest hydrogen
content is the most problematic raw material in terms of GHG emissions and would therefore benefit
from catalytic processes enabling the re-use of CO2 as carbon source in chemical production. The
conversion of biomass into synthesis gas is an alternative for the medium to long term. The following
research needs can be identified:
• Production of synthesis gas from methane, coal or biogenous sources with subsequent GTL ("gas
to liquids") processes via two principal routes: (a) synthesis of methanol and its conversion to
dimethylether, C2 and C3 olefins as well as of gasoline, plus (b) Fischer Tropsch synthesis with
subsequent conversion of the products via hydro-isomerization and hydrocracking as well as
oligomerization of olefins.
23
Elements retrieved from GeCatS, 2010
33
• Continuous optimization of already established methods on the basis of synthesis gas (oxo
synthesis, acetic acid, Fischer-Tropsch).
• Optimization of catalyst activity, selectivity and lifetime in gas-to-chemicals processes, with
more selective process control in the process in order to avoid broad product distributions.
• The development of highly selective, direct synthesis gas conversion processes into end
products like hydrocarbons or oxygenates.
• New catalysts for conversion of synthesis gas to ethanol and higher alcohols.
• Further development of methanol synthesis catalysts with performance criteria which are
carefully selected to match the origin of the synthesis gas (coal, gas, biomass).
• Improved control of the water-gas shift activity in order to avoid the production of CO2 and the
resulting methanation.
In terms of chemical CO2 utilization the following research areas shall be mentioned:
• Photocatalytic or electrocatalytic activation modeled on natural processes.
• Synthesis of products with high added value, in which CO2 remains in the product as a C1
building block (for example polycarbonates, polyurethane)
• Hydrogenation of CO2 with hydrogen from regenerative sources.
Fuels from gas and coal It can be expected that the bulk of fuels for mobile applications will continue to be based on
hydrocarbons. The proportion of compounds containing oxygen in the fuel pool will increase slightly, as
on the one hand biogenous carbon sources are being developed and on the other hand a certain
concentration of oxygen in the fuel has a positive effect in terms of combustion properties. Alongside
conventional fuels from fossil sources, there will be regionally varying proportions of biogenous fuels
based on renewable raw materials, such as biodiesel or ethanol.
New routes to polymers More energy-efficient methods for monomer production and polymerization will be the central topics of
catalytic and process engineering research and development.
Related to the above mentioned gas based routes to olefins is the subsequent production of polymers.
Polymers are generally made up of simple chemical monomers, with the olefins (ethylene, propylene,
butylene, butadiene and octane) being key monomer building blocks, which are polymerized into
corresponding specialized, high-performance materials using catalytic methods.
Olefins are currently still primarily produced from fossil raw materials (crude oil). In the future, natural
gas (see above) and renewable raw materials will also become more important.
Research efforts are required on new techniques and catalysts for the production of monomer building
blocks on the basis of new raw materials (e.g. methane -> synthesis gas -> methanol -> olefins). Here,
top priority goes to the improvement of zeolite-based MTO catalysts (methanol-to-olefins). Alongside
methanol as a C1 source, it makes sense to develop more efficient synthesis routes to higher alcohols
(propanol, butanol), so that these products can then be converted into olefins via catalytic dehydration.
34
The primary objectives of catalyst development are: improvement of the mechanical stability of
powdery and formed catalyst types, optimization of resistance to catalyst poisons and better control of
product distribution and hence more efficient and therefore more sustainable utilization and recycling
of raw materials.
Concerning biomass-based routes, research on processes and biocatalytic systems for the
saccharification of lignocellulose into bioethanol as a raw material for ethylene should be strengthened.
Subsequently, single-step processes for the conversion of ethylene, preferably regenerative ethylene,
into propylene, e.g. via catalytic "one-pot" combination of ethylene dimerization/isomerization/
metathesis into C3 monomer could be envisioned.
Hydrogen production R&D is required on hydrogen production from cultivated biomass or from the exploitation of secondary
materials via autothermic reforming, the improvement of water electrolysis processes, both in terms of
the electrocatalysts and in terms of process control and long-term efforts on photocatalytic water
cleavage with new catalyst systems
State-of-the-art processes for hydrogen production include steam reforming and/or the partial oxidation
of natural gas or other fossil carbon sources. For the production of large volume products such as
ammonia and methanol this syngas production is integral part of the process.
Alternatively, production of synthesis gas is possible from biomass or waste materials via the
modification of classic reforming. Here, the variable composition of the raw materials represents a
particular challenge in terms of the robustness of the catalysts.
The process of electrolytic cleavage of water is technically already possible with energy efficiencies
around 70 %. Optimized processes need to be found for non-stationary operating conditions when using
regenerative energy sources. Today, nickel is used predominantly as the catalyst; platinum would be
better in terms of energy efficiency but is too expensive. Cheaper electrode materials with a similarly
low overvoltage to platinum could help to bring about significant progress here. In addition, it is also
important to test and optimize new process variants, such as high-pressure electrolysis or gas phase
electrolysis.
Photocatalytic water cleavage processes are still a long way off commercially viable space-time yields,
regardless of whether they are based on solid catalysts or biochemical/biomimetic systems. The
situation is similar for the (to date) undervalued alternatives of homogeneous or biocatalytic methods.
In the area of biocatalysis, past work has focused particularly on discovering the fundamental
biochemical principles and regulatory processes for microorganisms which can be used to produce
hydrogen or fix nitrogen. As in all cases these enzymes carry a complex metal cofactor in their active
center and also display a pronounced oxygen intolerance, to date they have been used only rarely in
biotechnology applications. Finally, some initial progress has been made with approaches to produce
hydrogen in electrochemical cells by converting CO2 into synthesis gas. All of these techniques are still in
an early stage of fundamental research, but they all have the potential to revolutionize hydrogen
production in the long term.
35
Biomass as chemical feedstock Efficient use of biomass as feedstock requires innovative value chains on the basis of carbohydrates
instead of hydrocarbons and defunctionalization instead of functionalization as the synthesis strategy
Consequent biomass utilization as chemical feedstock requires substantial R&D effort in catalysis. To
avoid competition with food production, the use of lignocellulosic biomass with the three components
cellulose, hemicellulose and lignin gains importance. Starting from cellulose and hemicellulose, it is
possible to generate family trees for the chemical reaction processes into chemical resources and
materials. The study “Top Value Added Chemicals from Biomass” published by the US Department of
Energy contains a list of 12 possible platform chemicals.
Lignin on the other hand contains various aromatic building blocks and hence could represent an
important source of aromatic compounds. The main tasks for catalysis are the depolymerization of these
biomass components and the defunctionalisation, as cellulose, carbohydrates and other biogenic
compounds contain too many functional groups, which need to be selectively decomposed. In addition
most of the biomass-based processes require aqueous systems and hence catalysts which are stable in
water.
In addition to the development of efficient solutions for individual reaction steps the industrial-scale
implementation of biomass-based processes requires that a large proportion of the biogenous starting
materials is converted into usable end products and does not remain unused as a waste stream. This
refers to the concept of biorefineries, in which sufficient value is created in the individual process
streams.
These examples already show that a huge amount of fundamental R&D is required to explore these new
synthetic strategies and to ultimately facilitate commercial processes.
Annex 11. Workshop Participants
Catalyst Subject Matter Experts, Paris, September 7-9, 2011
Ekkehard Schwab, BASF
Don Roche, Shell
Garry Meima, Dow Chemical
Laxmi Narasimhan, Shell
Luc Martens, Exxonmobil
Jesper Nerlov, Haldor Topsoe Jean-Luc Dubois, Arkema
Julia Reinaud, ClimateWorks- Inst. for Industrial Productivity
Robson Peguin, Braskem
Jigar Shah, ClimateWorks- Inst. for Industrial Productivity
Andrew Ward, Sabic Rudy Parton, DSM Armin Liebens, Solvay Shinichiro Tawaki, Mitsui Chemicals
36
Policymakers, Brussels, January 23, 2012
Achim Boenke, EU Commission José Moya, EU Commission/ Institute for Energy
Chetna Khosla, ACCRE/ DOE Giuseppe Astarita, Italian Chemical Federation Chiara Di Mambro, EU Commission/DG Climate Seung Hoon Oh, SK Innovation
Christian Egenhofer, CEPS Aaris Pofantis, EIB Joachim Ehrenberg, EU Commission/DG Enterprise Julia Reinaud, Institute for Industrial Productivity Kanji Iwata, NEDO Phillip Troppmann, EU Commission/ DG Enterprise &
Industry
Emerging Country, Beijing, May 8, 2012
Ulf Auerbach, Evonik Cheng Peng, ChemChina
Zhang Baohua, Sinopec Ningke Peng, Dow
Bernd, Evonik China Zhai Qi, CBCSD
Yibing Ma Beryl, AICM Li Qian, CPCIF
Zhu Binbin, NPCPI Ji Qing, CBCSD Xiao Bo, Shaanxi Yanchang Petro. Group Wang Qingyang, Beijing Coreteam Eng. &Tech.
Co.Ltd
Naomi Bokhee, KOCIC Yin Quan, Sinochem Shenyang Chem. Res. Inst.
Dongmei Chen, IIP network Yunfeng Ren, China Chem Reporter
Richard Chen, Dow Chem. Ed Rightor, Dow Chem.
Dongmei Chen, IIP network Don Roche, Shell
Tina Chen, Wacker Li Shousheng, CPCIF
Lynn Chen, Air Product Sun Shubo, CCIN
Jerry Chung, Evonik Group He Shu'e, Chem. Eng. Co., Ltd.
Longpeng Cui, Sinopec Chen Sihai, Changzhou Tech. Dev.Co., Ltd.
Yin Deqiang, CNFIA Liu Siming, NPCPI
Huang Dunqi, CBCSD Cecilia Tam, IEA
Zong Fan, CPCIF Lei Ting, Shaanxi Yanchang Petro. Group
Xue Fei, IGEA Thibaud Voita, IPEEC
Chen Fenglin, CNCC Peter von Zumbusch, AICM
Pang Guanglian, CPCIF Margaret Wang, CPCIF
Cao Guangwei, Sinopec Lily Wang, Celanese
Karen Guo, Dow Chem. Li Wei, Nankai University
Jean Guy, Rhodia Feng Weili, CPCIF-ITV
Jian Haifeng, CNOOC Sun Weishan, CPCIF
37
Yan Haisheng, Sinochem Shenyang Chem. Res. Inst. Zhang Wenlei, CCAIA
Betty He, Novozymes Li Xiangyu, CBCSD
Jessica He, Wacker Shi Xianping, NPCPI
Jiangling Hong, Energy Foundation Jin Xiaogui, CNFIA
Zhou Hongda, CPCIF Fang Xiaohua, CCECTA
Qin Hongqi, Sinochem Quanzhou PetroChem. Chen Xiaoping, BYC
Shan Hongqing, Sinopec Jin Xiaoqui, China Nitrogen Fertilizer Ind. Assoc.
Mune Iwamoto, Mitsui Chem.s Wang Xiaoxue, Information Morning
Bernd Jaeger, Evonik Zhang Xin, CCAIA
Ji Jianjun, CNCC Huo Xiufeng, Changzhou Tech. Dev. Co., Ltd. Tuo Jianliang, Evonik China Wang Xiujuan, China Petro. and Chem. Industry
Magazine Luo Jianming, Central Rhine Environ. Eng. Tech. Co., Ltd.
Karin Xu, Merck
Yu Jing, China National Petro. Chem. Planning Inst.
Sun Yang, CPCIF
He Jing, CNCET John Yang, Wacker
Yang Jingwu, Sabic Gong Yanling, CNCIC
Zhang Jiushun, Sinopec Yang Yanxiang, PetroChina Petro. and Chem. Res. Inst.
Man Juan, CNCET Wang Yanyi, CNFIA
Zhao Jun Gui, CPCIF Zhou YinFei, Wilson Eng.
Zhao Jungui, CPCIF Li Yingjiang, CNCET
Gu Junran, CCPIT Huo Yinkun, Changzhou Tech. Dev. Co., Ltd.
Naomi Bokhee Kim, KOCIC Katsuyoshi Yokomitsu, JCIA
Zhan Kun, CBCSD Zhou Yong, Chinese Academy of Sci
Jean-Guy Le-Helloco, Rhodia Li Yongliang, CPCIF
Phoebe Li, Celanese Han Yongsheng, Chinese Academy of Science
Chen Liang, Shaanxi Yanchang Petro. Group Moto Yoshikiyo, JCIA
Jiang Lichuan, CSIA Li Youngliang, CPCIF
Ye Lijun, NPCPI Eric Yu, Shell
Liu Lili, China Chem Ind News Yongmiao Yu, IIP network
Ho-Sang Lim, Hanwha Chem. Wang Yu, CPCIF
Hosang Lim, Hanwha Chem. Hou Yu, IGEA
Pang Liping, CCIN Eric Yu, Shell
Yale Liu, BASF Yongmiao Yu, IIP network
Jiang Lixiang, Shenhua Group Corporation Ltd. Zhang Yu, CCIN Cui Longpeng, Sinopec Corp. Res. Inst. of Petro. Proc.
Qi Yu'e, CSIA
Matt Lu, AICM Ren Yunfeng, CNCIC
Beryl Ma, AICM Richard Zhang, Clariant

38
Russel Mills, Dow Chem. Cao Zhangao, CNFIA
Wang Min, NPCPI Anne Zhao, Dow
Zhang Mingsen, Sinopec Zhou Zhaocheng, CBCSD
Alan Morin, Dow Chem. Li Zhenyu, Petrochem. Res. Inst.
Zhang Mosi, China Energy News Yu Zhiyong, Long iT
Ji-Min Park, Hanwha Chem. Hongda Zhou, CPCIF
Helen Pei, Ashland Raymond Zhou, PPG
Zhang Peichao, CCAIA
Ningke Peng, Dow Chem.
Cheng Peng, CNCC


