ENERGY AUDIT AT R- ENERGY AUDIT AT R- INFRA DAHANU INFRA DAHANU THERMAL POWER STATION THERMAL POWER STATION (250 X 2 MW UNIT) (250 X 2 MW UNIT) CENTRAL POWER RESEARCH INSTITUTE, CENTRAL POWER RESEARCH INSTITUTE, BANGALORE-560080 BANGALORE-560080
Transcript
ENERGY AUDIT AT R-ENERGY AUDIT AT R-INFRA DAHANUINFRA DAHANU
THERMAL POWER STATION THERMAL POWER STATION (250 X 2 MW UNIT)(250 X 2 MW UNIT)
CENTRAL POWER RESEARCH CENTRAL POWER RESEARCH INSTITUTE, BANGALORE-560080INSTITUTE, BANGALORE-560080
MERC CONTRACT TO CPRIMERC CONTRACT TO CPRI
INVESTIGATION INTO PERFORMANCE OF INVESTIGATION INTO PERFORMANCE OF DTPS R-INFDTPS R-INF
PERIOD: 2 MONTHS FROM 22.01.2010PERIOD: 2 MONTHS FROM 22.01.2010 TOR: RATING OF THE UNITS TOR: RATING OF THE UNITS
PERMISSIBLILITY OF MW OVERLOADING OF PERMISSIBLILITY OF MW OVERLOADING OF THE UNIT ABOVE THE MCR VALUETHE UNIT ABOVE THE MCR VALUE
DE-RATING/UP-RATING OF THE UNITSDE-RATING/UP-RATING OF THE UNITSFACT FINDING OF UNIT CAPACITY & HISTORYFACT FINDING OF UNIT CAPACITY & HISTORYTESTS ON UNITS & CONSTRAINTSTESTS ON UNITS & CONSTRAINTS
DESIGN CAPACITY/ DESIGN CAPACITY/ RATING OF DTPSRATING OF DTPS
INSTALLED DURING BSES PERIOD 1995INSTALLED DURING BSES PERIOD 1995 TAKEN OVER BY R-INFRA IN 2003TAKEN OVER BY R-INFRA IN 2003 NO MAJOR CHANGE IN HARDWARE SINCENO MAJOR CHANGE IN HARDWARE SINCE IDENTICAL TO OVER 25 250 MW UNITS INSTALLED ALL IDENTICAL TO OVER 25 250 MW UNITS INSTALLED ALL
OVER INDIA INCLUDING PARLI, PARAS & TATA OVER INDIA INCLUDING PARLI, PARAS & TATA TROMBAY. TROMBAY.
SAME DESIGN REPLICATED IN ALL UNITS. THEY ARE OF SAME DESIGN REPLICATED IN ALL UNITS. THEY ARE OF STAND 250 MW DESIGN OF BHEL STAND 250 MW DESIGN OF BHEL
PG TEST, INSTALLATION MANUALS, NAME PLATES, PG TEST, INSTALLATION MANUALS, NAME PLATES, CAPACITY TESTS OF EQUIPMENT AND C & I INDICATE CAPACITY TESTS OF EQUIPMENT AND C & I INDICATE UNITS ARE OF 250 MW CAPACITY.UNITS ARE OF 250 MW CAPACITY.
Continuous peak plant load dutyContinuous peak plant load duty (over (over and above the 100 % unit MCR rating) and above the 100 % unit MCR rating) is denoted equipment wise as follows:is denoted equipment wise as follows:
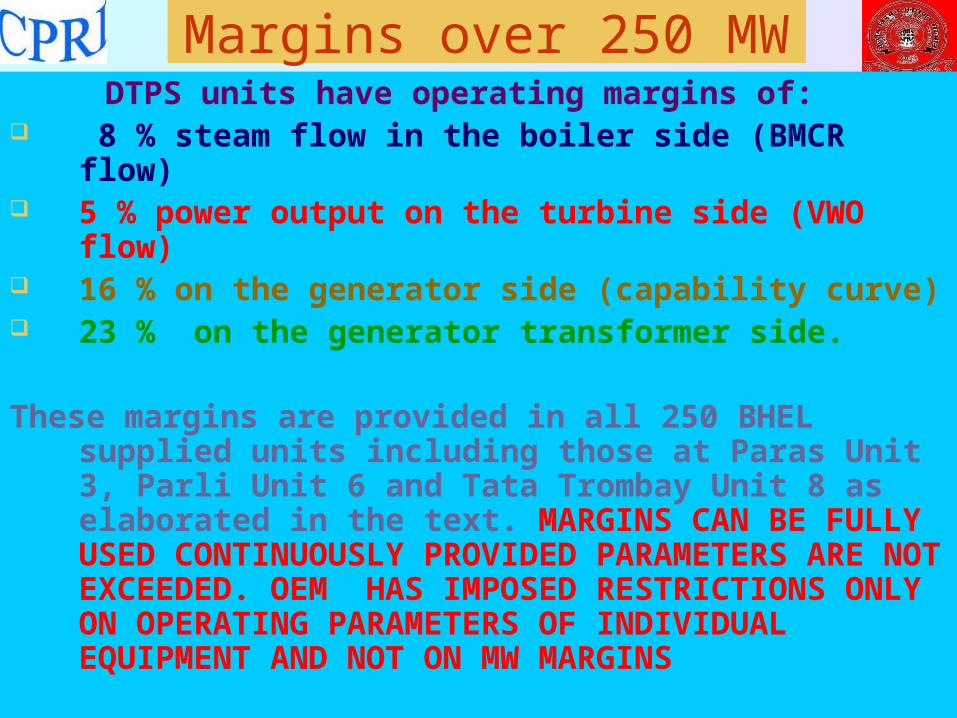
Margins over 250 MW DTPS units have operating margins of: 8 % steam flow in the boiler side (BMCR flow) 5 % power output on the turbine side (VWO
flow) 16 % on the generator side (capability curve) 23 % on the generator transformer side. These margins are provided in all 250 BHEL
supplied units including those at Paras Unit 3, Parli Unit 6 and Tata Trombay Unit 8 as elaborated in the text. MARGINS CAN BE FULLY USED CONTINUOUSLY PROVIDED PARAMETERS ARE NOT EXCEEDED. OEM HAS IMPOSED RESTRICTIONS ONLY ON OPERATING PARAMETERS OF INDIVIDUAL EQUIPMENT AND NOT ON MW MARGINS
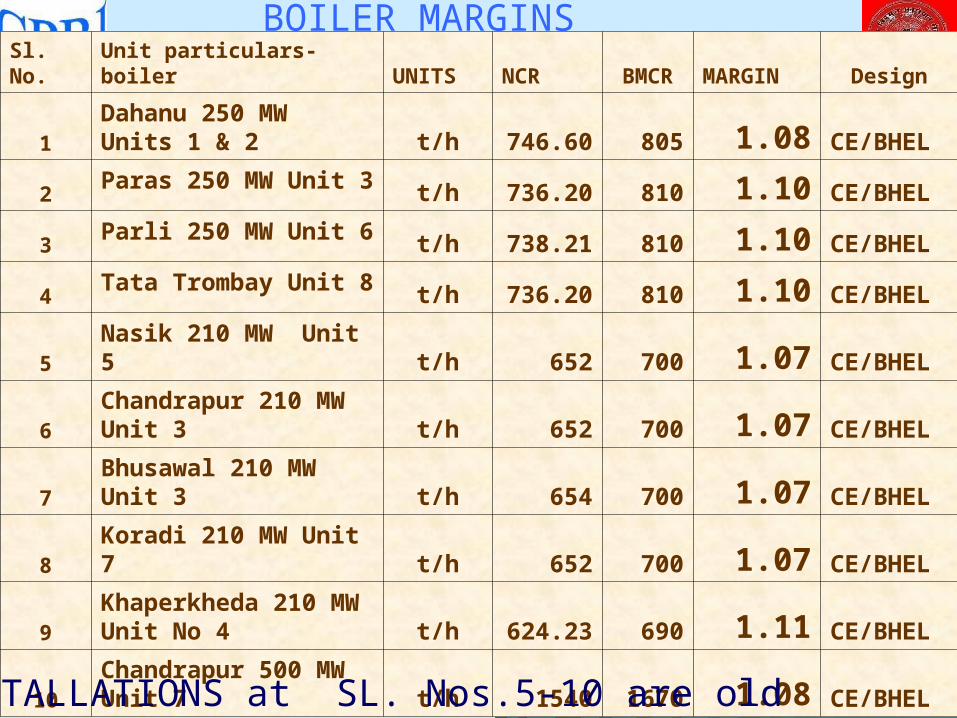
Sl. No. Unit particulars-boiler UNITS NCR BMCR MARGIN Design
1Dahanu 250 MW Units 1 & 2 t/h
746.60 805 1.08 CE/BHEL
2Paras 250 MW Unit 3 t/h
736.20 810 1.10 CE/BHEL
3Parli 250 MW Unit 6
t/h738.2
1 810 1.10 CE/BHEL
4Tata Trombay Unit 8 t/h
736.20 810 1.10 CE/BHEL
5Nasik 210 MW Unit 5 t/h 652 700 1.07 CE/BHEL
6Chandrapur 210 MW Unit 3 t/h 652 700 1.07 CE/BHEL
7Bhusawal 210 MW Unit 3 t/h 654 700 1.07 CE/BHEL
8Koradi 210 MW Unit 7 t/h 652 700 1.07 CE/BHEL
9Khaperkheda 210 MW Unit No 4 t/h
624.23 690 1.11 CE/BHEL
10Chandrapur 500 MW Unit 7 t/h 1540 1670 1.08 CE/BHEL
BOILER MARGINS
INSTALLATIONS at SL. Nos.5-10 are old
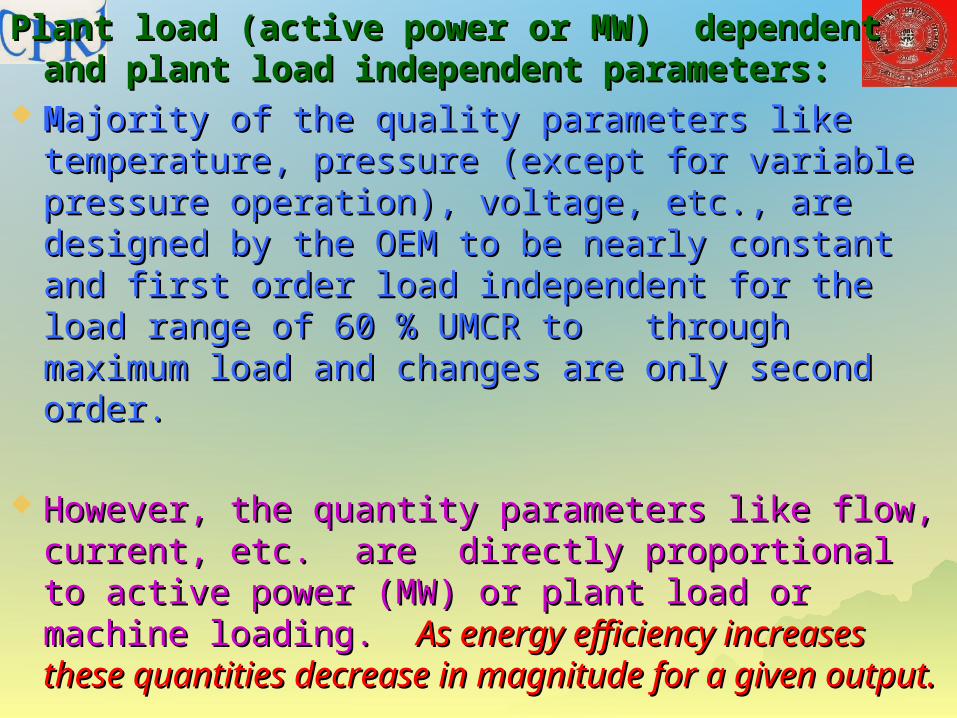
Plant load (active power or MW) dependent Plant load (active power or MW) dependent and plant load independent parameters:and plant load independent parameters:
MMajority of the quality parameters like ajority of the quality parameters like temperature, pressure (except for variable temperature, pressure (except for variable pressure operation), voltage, etc., are designed pressure operation), voltage, etc., are designed by the OEM to be nearly constant and first by the OEM to be nearly constant and first order load independent for the load range of 60 order load independent for the load range of 60 % UMCR to through maximum load and % UMCR to through maximum load and changes are only second order. changes are only second order.
However, the quantity parameters like flow, However, the quantity parameters like flow, current, etc. are directly proportional to active current, etc. are directly proportional to active power (MW) or plant load or machine loading. power (MW) or plant load or machine loading. As energy efficiency increases these quantities As energy efficiency increases these quantities decrease in magnitude for a given output.decrease in magnitude for a given output.
Continuous peak parameter: Continuous peak parameter: purposefully set for achieving the purposefully set for achieving the maximum performance or output from maximum performance or output from the machine.the machine.
Peak parameters for limited periodsPeak parameters for limited periods: : time limits in s /min /h in one excursion time limits in s /min /h in one excursion as well as total time in the lifetime of the as well as total time in the lifetime of the equipment. Occurs because of system equipment. Occurs because of system operational transients or constraints or operational transients or constraints or faults or system mismatch.faults or system mismatch.
OEM DEFINITION OF: OEM DEFINITION OF: CONTINUOUS PEAK CONTINUOUS PEAK LIMITED TIME PEAK PARAMETERSLIMITED TIME PEAK PARAMETERS
Sl. No.
Particulars at 100 %
BMCR
conditions
Units
Dahanu 250 MW
Paras 250 MW
Parli 250 MW Unit 6
Nasik 210 MW Unit 5
Chandrapur 210 MW Unit 3
Bhusawal 210 MW Unit 3
Koradi 210 MW Unit 7
Khaperkheda 210 MW Unit No 4
Chandrapur 500 MW Unit 7
1 Design
coal GCV
kcal/kg
3700
3400 3400 5000 4445 5100 5000 3500 3500
2 Annual
average
GCV
kcal/kg
3966
3652 3608 3422 3170 3235 3642 3354 3170
3 Total heat to
boiler
Mcal/h
599.4
611.7 527.34 536533.
4531.42
527.5
515.55
1215.9
4 Total fuel quantity
t/h 162 179.9 155.1 107.2 120 104.2105.
5147.
3347.4
5 Restriction
on BMCR to GCV
% less No No No Yes No Yes Yes No No
Variation of Steaming rate with boiler efficiency at constant coal consumption and constant GCV
740
750
760
770
780
790
800
810
80 82 84 86 88 90
Boiler efficiency, %
Ste
amin
g ra
te, t
/h
SIMULATED FROM ACTUAL DATASIMULATED FROM ACTUAL DATA
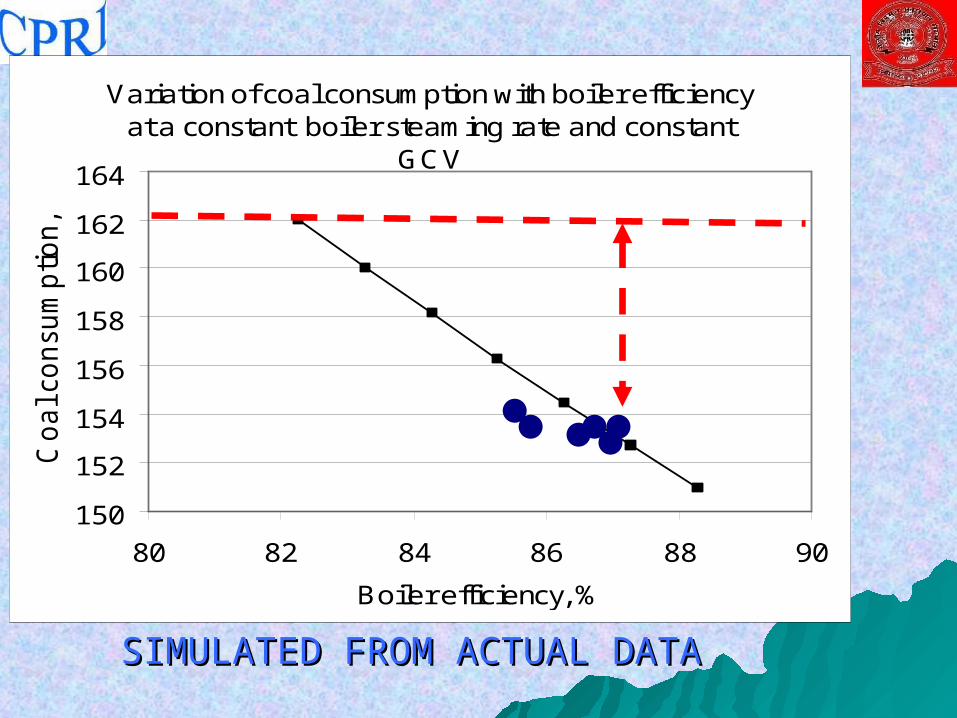
Variation of coal consumption with boiler efficiency at a constant boiler steaming rate and constant
GCV
150
152
154
156
158
160
162
164
80 82 84 86 88 90
Boiler efficiency, %
Co
al co
nsu
mp
tio
n, t/h
SIMULATED FROM ACTUAL DATASIMULATED FROM ACTUAL DATA
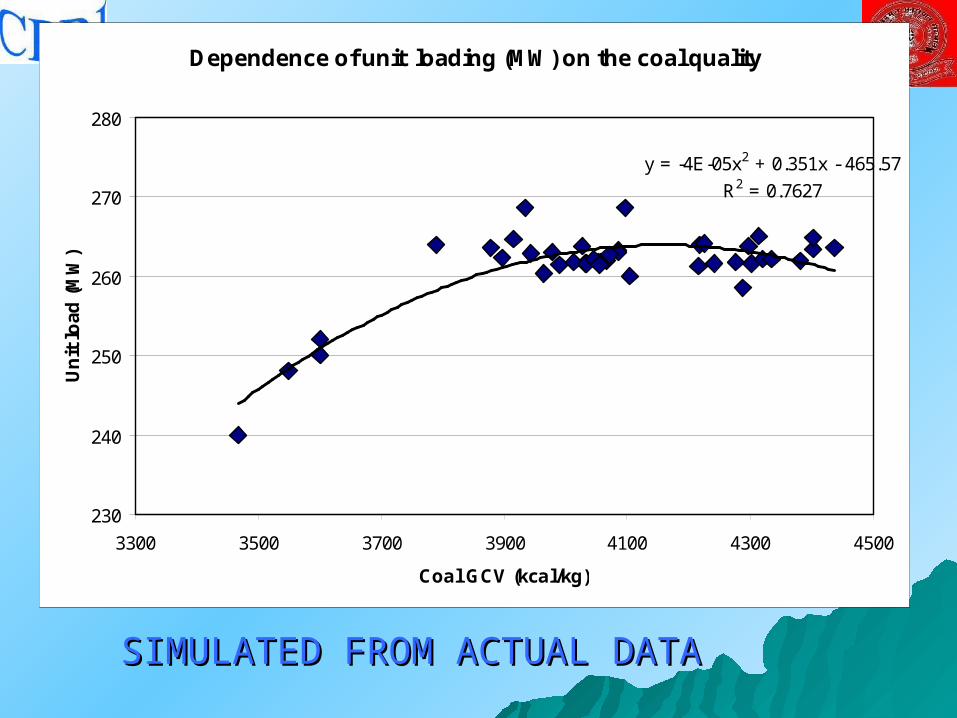
Dependence of unit loading (MW) on the coal quality
y = -4E-05x2 + 0.351x - 465.57
R2 = 0.7627
230
240
250
260
270
280
3300 3500 3700 3900 4100 4300 4500
Coal GCV (kcal/kg)
Un
it l
oad
(M
W)
SIMULATED FROM ACTUAL DATASIMULATED FROM ACTUAL DATA
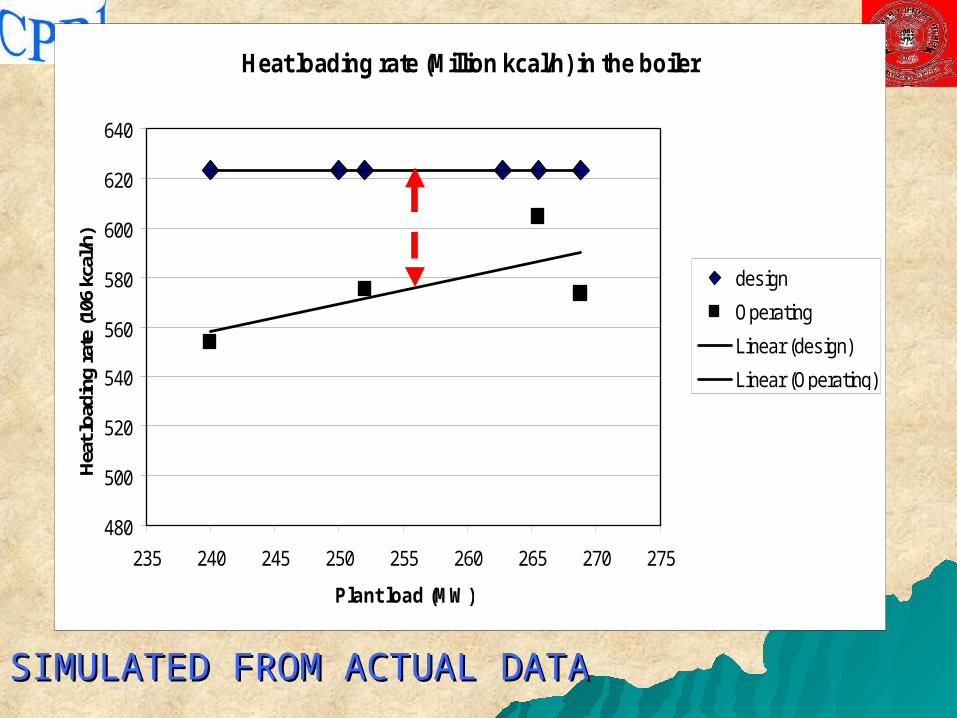
Heat loading rate (Million kcal/h) in the boiler
480
500
520
540
560
580
600
620
640
235 240 245 250 255 260 265 270 275
Plant load (MW)
Hea
t loa
ding
rat
e (1
06 k
cal/h
)
design
Operating
Linear (design)
Linear (Operating)
SIMULATED FROM ACTUAL DATASIMULATED FROM ACTUAL DATA
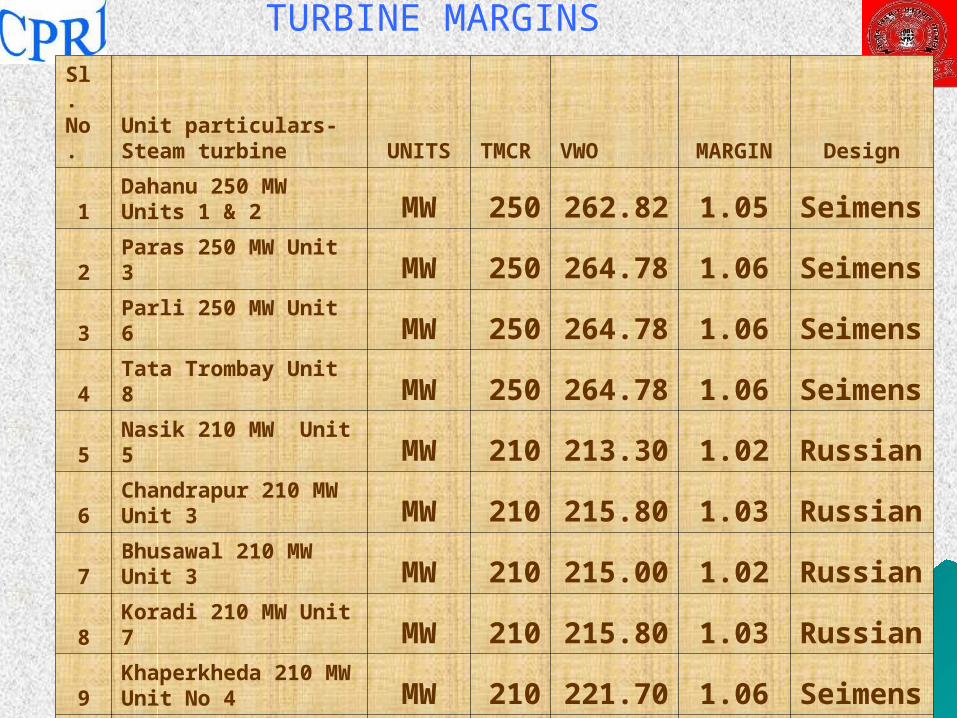
Sl. No.
Unit particulars-Steam turbine UNITS
TMCR VWO
MARGIN Design
1
Dahanu 250 MW Units 1 & 2
MW 250262.8
2 1.05 Seimens
2
Paras 250 MW Unit 3
MW 250264.7
8 1.06 Seimens
3
Parli 250 MW Unit 6
MW 250264.7
8 1.06 Seimens
4
Tata Trombay Unit 8
MW 250264.7
8 1.06 Seimens
5
Nasik 210 MW Unit 5
MW 210213.3
0 1.02 Russian
6
Chandrapur 210 MW Unit 3
MW 210215.8
0 1.03 Russian
7
Bhusawal 210 MW Unit 3
MW 210215.0
0 1.02 Russian
8
Koradi 210 MW Unit 7
MW 210215.8
0 1.03 Russian
9
Khaperkheda 210 MW Unit No 4
MW 210221.7
0 1.06 Seimens
10Chandrapur 500 MW Unit 7 MW 500 524.40 1.05 Siemens
TURBINE MARGINS
Sl. No.
Unit particulars - Steam turbine UNITS
TMCR VWO MARGIN
1
Hitachi
MW210 222.00 1.06
2
Mitsubishi
MW210 222.00 1.06
3
Siemens
MW210 221.70 1.06
4
Russian
MW210 215.60 1.03
TURBINE MARGINS
Variation of steam input with turbine heat rate at constant power output
735
740
745
750
755
760
765
1920 1940 1960 1980 2000
Turbine heat rate, kcal/kWh
Ste
am
inp
ut t
o tu
rbin
e,
t/h
SIMULATED FROM ACTUAL DATASIMULATED FROM ACTUAL DATA
VWO: 800 t/h
Variation of power output with turbine heat rate at constant steam input to turbine
254
256
258
260
262
264
1920 1940 1960 1980 2000
Turbine heat rate, kcal/kWh
Po
we
r o
utp
ut, M
W
SIMULATED FROM ACTUAL DATASIMULATED FROM ACTUAL DATA
VWO: 800 t/h
TURBINESTURBINESDTPS has be able to maintain good MW load ability
on the machine within the OEM margins and without exceeding any OEM parameter limits by:
Maintaining high turbine efficiency (turbine heat rate deviates from design by only 4.4 kcal/kWh)
Strictly maintaining water quality parameters as per OEM guidelines
Minimizing auxiliary stack, vent and gland sealing steam requirements in the turbine.
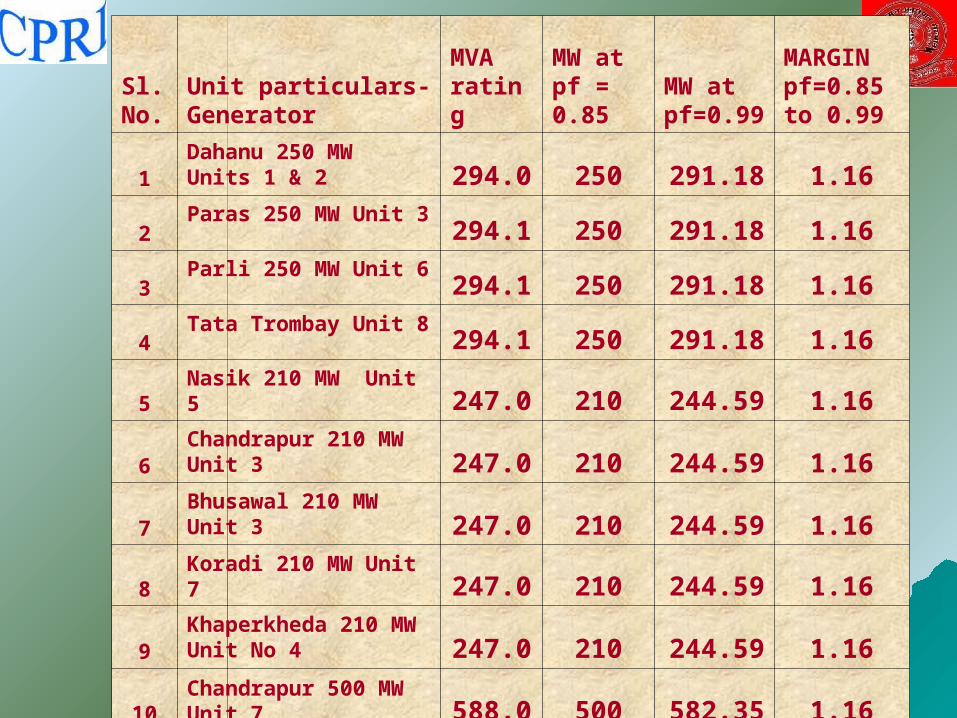
Sl. No.
Unit particulars-Generator
MVA rating
MW at pf = 0.85
MW at pf=0.99
MARGIN pf=0.85 to 0.99
1
Dahanu 250 MW Units 1 & 2
294.0 250
291.18 1.16
2
Paras 250 MW Unit 3
294.1 250
291.18 1.16
3
Parli 250 MW Unit 6 294.1 250
291.18 1.16
4
Tata Trombay Unit 8
294.1 250
291.18 1.16
5
Nasik 210 MW Unit 5
247.0 210
244.59 1.16
6
Chandrapur 210 MW Unit 3
247.0 210
244.59 1.16
7
Bhusawal 210 MW Unit 3
247.0 210
244.59 1.16
8
Koradi 210 MW Unit 7
247.0 210
244.59 1.16
9
Khaperkheda 210 MW Unit No 4
247.0 210
244.59 1.16
10Chandrapur 500 MW Unit 7
588.0 500
582.35 1.16
TESTS ON UNITS TESTS ON UNITS
Maximum load- 265.5 MW: 2292.7Maximum load- 265.5 MW: 2292.7kcal/kWhkcal/kWh
MAXIMUM LOAD REACHED WAS 240 MWMAXIMUM LOAD REACHED WAS 240 MWDesign: 2230.60 Design: 2230.60 kcal/kWhkcal/kWh
Achieved: 2293 Achieved: 2293 kcal/kWhkcal/kWh
EVEN AT 268 MW NO PARAMETER HAS EVEN AT 268 MW NO PARAMETER HAS EXCEEDED OEM LIMITS ; DTPS CONTROL EXCEEDED OEM LIMITS ; DTPS CONTROL SET POINTS ARE BELOW OEM LIMITSSET POINTS ARE BELOW OEM LIMITS
Loadability
Combining all the margins provided by the OEM, R-Infra has been able to load the unit to 268 MW against the design value of 250 MW.
Maintaining this load is not harming the life of the unit as the DTPS has ensured that all parameters are kept within OEM limits.
High loadability is made possible by high energy High loadability is made possible by high energy efficiency or low unit heat rate which enables the efficiency or low unit heat rate which enables the parameters not to exceed their limits.parameters not to exceed their limits.
OEM MANUALS DO NOT SPECIFIC ANY UPPER LIMITS ON MW LOADING OR MW OVERLOADING ABOVE 100 % UMCR RATING, OEM MANUAL SPECIFIES CONTINUOUS AND LIMITED TIME LIMITS ON OPERATING PARAMETERS OF B, T,G,GT, ETC.
Remaining life Units 1 & 2 have been commissioned in Jan and
March 1995 and have completed 15 years of service and nearly 1,20,000 operating hours.
Acceleration of life expenditure takes place due to parameter excursions into the limited-time-overload-regime for long periods, due to frequent cyclic loading, due to frequent transients with high ramping rates. Scrutiny of operation and parameters indicates that the DTPS has avoided operation in these life limiting regimes thereby preserving the longevity of their assets. The cyclic operations are far lower than their design values.
RemainingRemainingLife Life (h, years)(h, years)
Real time years Real time years
We are hereWe are here
ӨӨ <45<45˚̊
GoodGoodӨӨ > 45˚ > 45˚poorpoor
ӨӨ=45˚=45˚NormalNormal
Remaining life Considering a total engineering life of 35 years
of service or 3,00,000 operating hours the physical (actual) life expenditure of both units is expected to be 40 %. Except for generator, where the life expenditure is 50 % (remaining life= 50 % or 14 years), the remaining life of other components matches roughly with the physical life expenditure.
This indicates that acceleration of life has not taken place. The low degradation rate coupled with the high loading on the plant also leads to the conclusion that the equipment are healthy and factors in the nature of non-repairable damage are not present. UNHEALTHY EQUIPMENT CANNOT BE LOADED AT ALL
Degradation
The CPRI test TG HR is showing a degradation rate of 0.13 %/year. The degradation is 2.0 % of the DHR
LOW LEVEL OF DEGRADATION INDICATES THAT THE EQUIPMENT ARE HEALTHY AND NO NEGATIVE EFFECTS OF MW LOADING BEYOND 100 % UMCR
Up-rating/de-rating The maximum load on Unit 1 was 268.7 MW and
on Unit 2 was 266.0 MW in 2009 & in 2010. Up-rating or de-rating of the unit has been studied and it is concluded that the unit capacity is 250 MW and the present maximum plant loading of 268 MW is sustainable only because of high boiler, turbine and generator efficiency; and external factors like coal quality being 600 kcal/kg higher and high power factor of 0.99. The sustainability may not be long lasting.
The PG test by OEM is for 250 MW, these units are identical to several 250 MW units, grid code 2005 stipulates a margin over the 100 % UMCR rating. Considering these facts it is concluded that the up-rating of 250 MW to 260 or 265 MW may not be sustainable in terms of availability as well as loadability in the future.
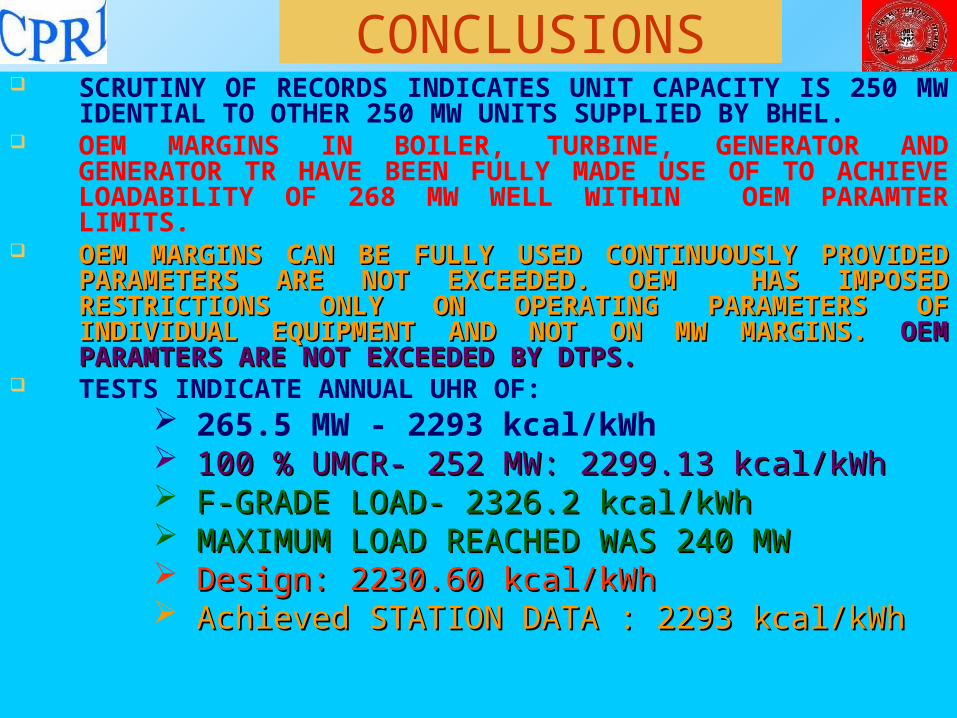
CONCLUSIONS SCRUTINY OF RECORDS INDICATES UNIT CAPACITY IS 250
MW IDENTIAL TO OTHER 250 MW UNITS SUPPLIED BY BHEL.
OEM MARGINS IN BOILER, TURBINE, GENERATOR AND GENERATOR TR HAVE BEEN FULLY MADE USE OF TO ACHIEVE LOADABILITY OF 268 MW WELL WITHIN OEM PARAMTER LIMITS.
OEM MARGINS CAN BE FULLY USED CONTINUOUSLY OEM MARGINS CAN BE FULLY USED CONTINUOUSLY PROVIDED PARAMETERS ARE NOT EXCEEDED. OEM HAS PROVIDED PARAMETERS ARE NOT EXCEEDED. OEM HAS IMPOSED RESTRICTIONS ONLY ON OPERATING IMPOSED RESTRICTIONS ONLY ON OPERATING PARAMETERS OF INDIVIDUAL EQUIPMENT AND NOT ON PARAMETERS OF INDIVIDUAL EQUIPMENT AND NOT ON MW MARGINS. MW MARGINS. OEM PARAMTERSOEM PARAMTERS ARE NOT EXCEEDED BY ARE NOT EXCEEDED BY DTPS.DTPS.
TESTS INDICATE ANNUAL UHR OF: 265.5 MW - 2293 kcal/kWh 100 % UMCR- 252 MW: 2299.13 kcal/kWh100 % UMCR- 252 MW: 2299.13 kcal/kWh F-GRADE LOAD- 2326.2 kcal/kWhF-GRADE LOAD- 2326.2 kcal/kWh MAXIMUM LOAD REACHED WAS 240 MWMAXIMUM LOAD REACHED WAS 240 MW Design: 2230.60 kcal/kWhDesign: 2230.60 kcal/kWh Achieved STATION DATA : 2293 kcal/kWhAchieved STATION DATA : 2293 kcal/kWh
CONCLUSIONS UPRATING OF THE UNIT HAS BEEN STUDIED.
SINCE THE UNIT IS OF 250 MW STANDARD DESIGN OF BHEL, THE MARGINS ARE BEING UTILIZED BY ENERGY EFFICIENCY IMPROVEMENTS, HIGHER GCV OF COAL AND HIGH POWER FACTOR. THESE CIRCUMSTANCES MAY NOT BE SUSTAINABLE ALL THROUGH THE LIFE OF THE UNIT.
GENERATORS AND GTS ARE QUITE HEALTHY AND NORMAL. REMAINING LIFE IS ALSO GOOD. NO IMMEDIATE RISK FOR 16-20 khours AS PER THE RLA REPORTS OF ABB & ERDA. CONSIDERING THE CRITICALITY OF LOAD HANDLED BY DTPS AND CONSIDERING THAT THERE ARE NO SPARES WITH OTHER MEMBERS OF MAHARASHTRA GRID FOR 250 MW THESE CAN BE CONSIDERED.