Energy Policy Update How Might Pending Policies Affect Electric Rates Scott J. Anders Energy Policy Initiatives Center University of San Diego School of Law San Diego Chapter of IEEE September 24, 2009
Transcript
Energy Policy Update How Might Pending Policies Affect Electric Rates
Scott J. Anders Energy Policy Initiatives Center
University of San Diego School of Law
San Diego Chapter of IEEE September 24, 2009
www.sandiego.edu/epic
Presentation Overview
EPIC Overview
Greenhouse Gas Emissions
Key Energy Policy Issues
San Diego Rates Project and Results
www.sandiego.edu/epic
About EPIC
Academic and Research Center • University of San Diego School of Law
EPIC Mission
ON-ROAD TRANSPORTATION
46%
ELECTRICITY 25%
NATURAL GAS END USES
9%
CIVIL AVIATION 5%
INDUSTRIAL PROCESSES AND
PRODUCTS 5%
OTHER FUELS/OTHER
4%
OFF-ROAD EQUIPMENT AND
VEHICLES 4% WASTE
2%
AGRICULTURE/FORESTRY/LAND
USE 2% RAIL
1% WATER-BORNE NAVIGATION
0.4%
www.sandiego.edu/epic
GHG Emissions in San Diego County 2006
GHG Emissions in San Diego County 2006
The Vast Majority of GHGs in SD County are from…
Buildings
Car & Trucks
#1 #2
GHG Inventory Project Results
Greenhouse Gas Reduction Policies in California • AB 32 – Global Warming Solutions Act of 2006
- Goal: 1990 levels by 2020 • Executive Order S-3-05
- 20% renewable content by 2010 - SDG&E at ~8% in 2009
• Pending Legislation - SB 14
– 33% by 2020 • Implementation Issues
- Regulatory Process - Transmission - Contract Failure
• Potential Solution - Feed-in tariff
– SB 32 pending Governor’s Actions
www.sandiego.edu/epic
CA Energy Policy Overview
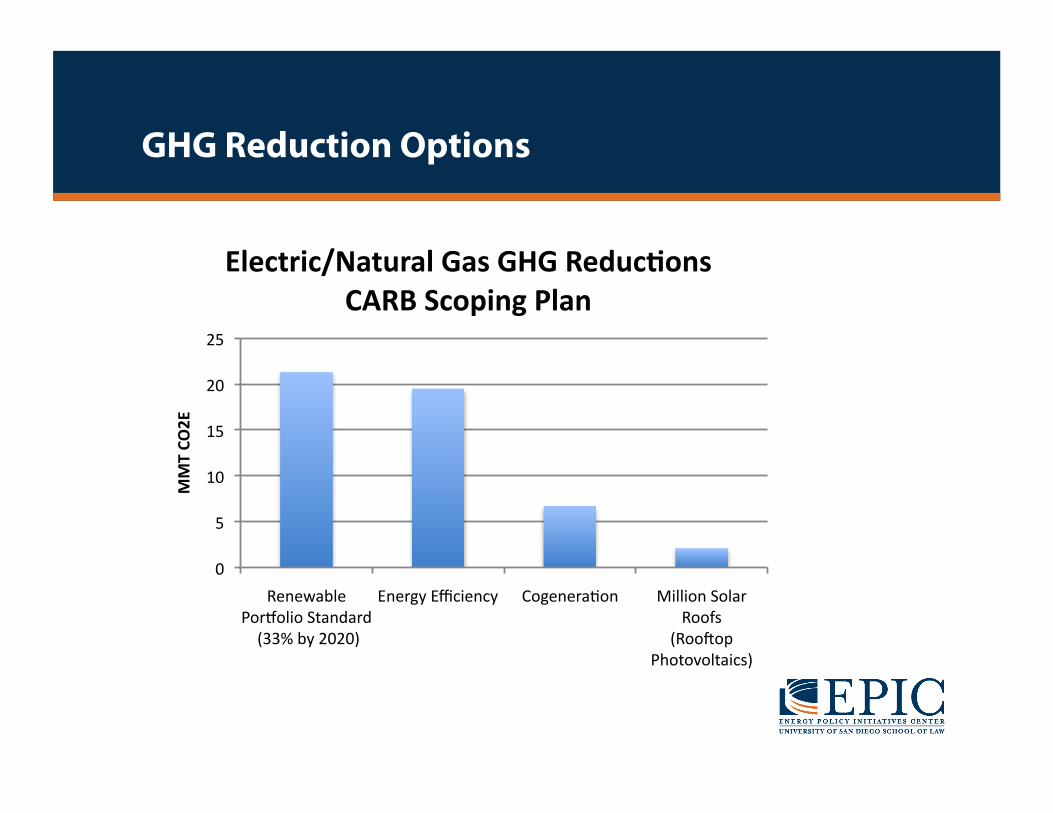
Renewable Portfolio Standards • Implications for Rates
- Cost of generation - Cost of transmission - Need for firming - Reduced GHG exposure
www.sandiego.edu/epic
CA Energy Policy Overview
Energy Efficiency • California’s Long Term Energy Efficiency Strategic Plan
- 25% of existing homes reduce energy 70% below 2008 levels - 75% of existing homes reduce energy 30% below 2008 levels - 100% of multifamily reduce energy use by 40% below 2008 levels - All new homes net zero energy by 2020 - All new commercial buildings net zero energy by 2030
• CPUC Efficiency Funding - $3.1 billion over 3 years - Residential retrofit program
– 20% in 130,000 homes by 2012
• CPUC Efficiency Goals for Utilities
www.sandiego.edu/epic
CA Energy Policy Overview
www.sandiego.edu/epic
SDG&E Electric Efficiency Target: 6% Reduction by 2020
SDG&E Nat. Gas Efficiency Target: 9% Reduction by 2020
California Solar Initiative • Implications for Rates
- Cost of solar incentives - Cost of net metering (cost shift?) - Potential positive system benefits - Capacity factor of generation - Reduced consumption (kWh), demand (kW)
www.sandiego.edu/epic
CA Energy Policy Overview
Smart Grid • 2007 Energy Independence and Security Act
- Title XIII
• CPUC Rulemaking on Smart Grid (ongoing)
• CPUC Rulemaking on Electric Vehicle Rates (new)
• American Recovery and Reinvestment Act (Stimulus)
Project Background • California is currently considering a range of policies to reduce greenhouse gas emissions in the electricity sector
• Costs of individual programs are known, but it is difficult to evaluate the combined impact on utility customers
• Each utility produces a rate forecast, but the analysis and modeling is not available for public review
• USD hired 3 well-known consultants (E3, MRW, and JBS) to develop a publicly available, transparent rate forecast tool to better inform the public process and decision-making on the range of policies being considered
San Diego Rate Projection Model
Inputs and Levers
Module 1
Base Forecasts
Energy
Demand # Customers
Fuel Costs
Demand Side
EE, DR, CSI PHEV
CHP
Supply Side
Contracts Ownership
Retirements
RPS Share
Revenue Requirement
Module 2
Revenue Req.
Generation Utility owned
Market purchases
Contract / QF
DWR
Non-Generation
Distribution
Transmission
Nuclear Decom.
CTC PPP
Rates by Class
Module 3
Allocations to Class
Marginal cost basis
Calibrated to current
Retail Rates
Residential
Res w/ Care
Small Com. <20kW Medium/Large C/I
Ag
StLt
Sensitivity Assumptions
Policy ‘Levers’ Change
Assumptions
CA Energy Policy Overview
Sensitivity Assumptions • Energy Sales • Demand • Number of Customers • Fuel Costs
www.sandiego.edu/epic
San Diego Rate Projection Model
Policy Levers • Energy Efficiency • Plug-in Hybrid Electric Vehicles • CA Solar Initiative • Combined Heat and Power • Demand Response • Carbon Market • Renewable Portfolio Standard • Plant Retirement
www.sandiego.edu/epic
San Diego Rate Projection Model
Base Case Assumptions • Load Growth
- Residential – 1.6%/yr - Small comm. – 1.5% - Med/Large Comm & ind – 1.2%
• Achieve recently filed energy efficiency and demand response goals • 20% RPS • CA Solar Initiative through 2016 at current pace • Electric vehicle forecast based on TIAX study (~30K vehicles by 2020) • No new CHP incentives; SGIP expires in 2011 • CO2 $25/tonne • Retirement of key contracts
- SONGS – 2022 - Encina – 2015 - South Bay - 2012
• Revenue Requirement escalates at recent historical rates