Page 1
Enhancement of Municipal Wastewater Biosolids Drying
through Interfacial Energy Modifying Amendments
to Promote Uniform Agglomeration
– Bench Scale Testing
by
Sarah Stine
A Thesis
Submitted to the Faculty
of the
WORCESTER POLYTECHNIC INSTITUTE
In partial fulfillment of the requirements for the
Degree of Master of Science
in
Environmental Engineering
December 2018
Page 2
ii
Table of Contents:
Abstract ........................................................................................................................................... 1
Introduction ..................................................................................................................................... 2
Background ..................................................................................................................................... 4
Wastewater Solids ....................................................................................................................... 4
Regulating Land Application of Biosolids .................................................................................. 4
Processes for Heat Drying Biosolids ........................................................................................... 8
Fertilizer Sizing and Blending................................................................................................... 13
Polyelectrolytes for Coagulation and Dewatering .................................................................... 14
Previously Completed Research................................................................................................ 16
Methods and Materials .................................................................................................................. 20
Development of the Bench Scale System ................................................................................. 20
Drying with Amendments ......................................................................................................... 26
Results and Discussion ................................................................................................................. 28
Drying with Amendments ......................................................................................................... 28
Mixing time ............................................................................................................................... 32
Sample Variability..................................................................................................................... 33
Conclusions and Future Work ...................................................................................................... 35
References ..................................................................................................................................... 36
Appendix #1 .................................................................................................................................. 39
Page 3
iii
List of Tables:
Table 1 - Massachusetts DEP Methods for Pathogen Reduction ................................................... 6
Table 2 - Pollutant Limits and average concentrations in Bay State Fertilizer .............................. 6
Table 3 - Polyelectrolyte Characteristics ...................................................................................... 14
Table 4 - Sieve Size Gradations .................................................................................................... 26
Table 5 - Percentage of Fines by Mixing Time, amended and unamended. ................................. 32
Table 6 - Uniformity Index and Size Guide Number ................................................................... 33
Table 7 - Size Distribution of Recycle Sample Material ............................................................. 34
List of Figures:
Figure 1 - Wastewater Treatment Process Overview ..................................................................... 9
Figure 2 - Biosolids Drying Process Diagram .............................................................................. 10
Figure 3 - Single Pass Rotary Drum Dryer ................................................................................... 11
Figure 4 - Newer style Triple Pass Rotary Drum Dryer ............................................................... 11
Figure 5 - Charge Neutralization .................................................................................................. 15
Figure 6 - Polymer Bridging ......................................................................................................... 15
Figure 7 - Electrostatic Patch ........................................................................................................ 16
Figure 8 - Impact of Polyelectrolytes on Zeta Potential of Biosolids in Solution ........................ 18
Figure 9 - Impact of Polyelectrolytes on Biosolids Particle Size in Solution (Zhang, 2018) ....... 19
Figure 10 - Bench Scale Mixer ..................................................................................................... 22
Figure 11 - Buchi Rotavapor used as bench-scale dryer............................................................... 23
Figure 12 - Drying Time in Rotavapor vs Percent Solids after Drying ........................................ 24
Figure 13 - Sieves for Pellet Size Analysis ................................................................................... 25
Figure 14 – PDADMAC Amendment Dosage Trials; Pellet Size Distribution............................ 29
Figure 15 - Photos of Pellets Dried with PDADMAC at Varying Concentrations ...................... 29
Figure 16 - No Amendment vs PDADMAC 0.015 mg/mg – July, August, October ................... 30
Figure 17 - PAM Amendment Trials ............................................................................................ 31
Figure 18 - Photos of Pellets Dried with PAM ............................................................................. 31
Page 4
iv
Acknowledgements and thanks:
I would like to thank Wenwen Yao for lab assistance, Helin Zhang for all her work on
biosolids research and time spent introducing me to her work, NEFCO for assistance with
samples and several insightful conversations, and the Center for Advanced Research in Drying
for funding this work.
A special thanks to my advisor, Professor John Bergendahl, for his extensive support,
advice and encouragement.
Page 5
1
Abstract
Biosolids Drying is the process of producing a fertilizer product for beneficial reuse from
solids produced during municipal wastewater treatment. The drying of biosolids involves the
evaporation of water to stabilize the material and produce a product for beneficial use. Thermal
energy needs to be transferred to the biosolids to evaporate the water and heat the solids. Energy
can be provided by combustion of fuels, re-use of waste heat or solar radiation (WEF, 2014).
The most common technology for biosolids drying in the United States utilizes rotary drum
dryers. In these systems, fines and crushed oversized pellets produced during the drying system
are mixed with dewatered biosolids upstream of the dryer to create a 55% - 65% dry biosolid in
the form of pellets. Reducing the percentage of fines generated during the drying process can
potentially reduce the amount of energy required for drying.
In earlier research completed by Zhang (2018) it was shown that energy modifying
amendments, specifically cationic polyelectrolytes, can reduce the zeta potential of biosolids in
solution and possibly promote aggregation of the fines. One of the tested amendments,
polydiallyldimethylammonium chloride (PDADMAC), was also shown to increase the particle
size of the biosolids in solution. In this work, a bench scale drying system was designed and
developed to apply the polyelectrolyte amendments to biosolids during the mixing phase, and to
gauge the impact on the pellet size distribution and the percentage of fines generated after
drying. It was shown that PDADMAC, which is a high charge density cationic polyelectrolyte,
had a measurable, though inconsistent, impact on pellet size when applied during the mixing
phase. This work also highlights the varying characteristics of biosolids and the recycled
biosolids produced during the drying process. Both PDADMAC, and polyallyamine, another
cationic polyelectrolyte, when applied to biosolids during the mixing phase limited the increase
in fines production as the mixing time was increased prior to drying.
Page 6
2
Introduction
Wastewater treatment is one of the most important elements of protecting the
environment, and this is especially true as population densities increase. The main goal of
wastewater treatment is to remove harmful constituents from the water before it is released back
into the environment. However an equally important and potentially more challenging aspect of
wastewater treatment is solids handling. There are several options for handling solids, including
landfilling, incineration and land application. Solids generated during wastewater treatment and
treated with the intent of re-use are called biosolids. Land application of biosolids can take
several forms based on the treatment of the biosolids prior to application; typically dewatering or
drying.
Biosolids Drying is the process of producing fertilizer for beneficial reuse from solids in
the municipal wastewater stream. If regulations for pollutant limits and pathogen reduction are
met, the dried biosolids can be classified as “Class A” and applied to gardens, agricultural fields
and any other place fertilizers are used, without restriction. The biosolids drying process is
energy intensive; fundamentally all types of biosolids drying involve the evaporation of water.
Thermal energy needs to be transferred to the biosolids both to evaporate the water and heat the
solids. Energy can be provided by combustion of fuels, re-use of waste heat or solar radiation.
Drying reduces both the weight and volume of biosolids to be processed and disposed. This is
particularly important for urban areas where the end product needs to be transported considerable
distances to agricultural or open areas.
There are several technologies available for biosolids drying. In the United States, the
most prevalent is direct drying using Rotary Drum Dryers. In this drying process, sludge is
dewatered to approximately 25% solids, then mixed with already dry recycled product in a mixer
called the pugmill. The recycled material fed into the pugmill with the dewatered “cake”, is
previously dried material considered too large or too fine. The biosolids take the form of pellets
in the pugmill and are then transported to the dryer where they are transported through the dryer
by hot air. A uniform pellet size is required both to ensure the product does not clump during
transportation and in order for the end product fertilizer to be marketable both as an individual
fertilizer and for blending with other fertilizers.
Page 7
3
Drying biosolids generated during the municipal wastewater treatment process to
generate Class A fertilizer has gained traction and become more prominent over the past 20
years. Notably the Great Lakes Water Authority serving the metro Detroit area recently built the
largest Biosolids Drying Facility in North America; the facility was put into use in 2015. As
more communities around the country update their sludge handling processes, Biosolids Drying
is an option that will be considered and often implemented. Any energy requirement reduction
in the drying process can have an impact on the overall energy required to handle biosolids in a
beneficial and environmentally friendly way. Reducing the amount of dried product recycled to
the pugmill could potentially decrease the overall energy required for drying and allow for
smaller equipment sizing during design and construction. The goal of this study was to
determine an amendment which can be added during the pugmill mixing stage of the drying
process to promote uniform agglomeration of biosolids pellets and in turn, reduce the percentage
of fines produced when drying biosolids for fertilizer production.
Page 8
4
Background
Wastewater Solids
The solids content in sludge produced during municipal wastewater treatment typically
contains from 2% to 8% solids. This sludge can consist of primary sludge from primary
treatment settling and waste activated sludge from secondary biological treatment. The solids in
wastewater sludge can vary significantly depending on the influent to the treatment facility and
the types of treatment technologies utilized. The main components making up the solids include
microorganisms, organic fibers, inorganic colloids and extracellular polymeric substances (EPS).
Biologically activated, or “waste activated”, sludge is typically composed of 40 % - 60% EPS
(Wei et al. 2018 and Christensen et al. 2015). The extracellular polymeric substances are made
up of proteins, humic substances, polysaccharides, nucleic acids and lipids. EPS components of
sludge and specifically sludge flocs are negatively charged; Raynaud et al. (2012) found the
charge density of the EPS in waste activated sludge to be -1.06 meq/gram. Other studies have
found the charge density to be in the range of -0.2 to -1.0 meq/gram (Christensen et al., 2015).
Regulating Land Application of Biosolids
Land application of biosolids in the United States is regulated by the EPA Part 503
Biosolids Rule. The Part 503 rule has differing levels of maximum pollutant concentrations and
pathogen reduction requirements based on the intended end use of the biosolids (EPA, 1994).
Exceptional Quality Biosolids, or EQ Biosolids, are defined by the EPA are those applied in bulk
to agricultural fields and sold as bagged fertilizer to the public. In order to be characterized as
Exceptional Quality, biosolids must meet low-pollutant concentration requirements and Class A
pathogen reduction (EPA, 1994). Class B biosolids are typically dewatered sludge which can be
land applied with greater restrictions, typically to fields not currently producing food for human
consumption.
Subpart D of the EPA’s part 503 rule addresses pathogen reduction and reduction of
vector attraction. Pathogens are defined as organisms, including bacteria, viruses and parasites
that can cause disease. Vectors are insects, rodents and other organisms that can spread disease
by carrying pathogens. Based on the levels of pathogen and vector attraction reduction a
Page 9
5
biosolid will be classified by the EPA as Class A or Class B. Pathogen reduction requirements
can be met by either using known/established technologies and meeting baseline pathogen
testing requirements, or by using unknown technologies and meeting more stringent pathogen
testing requirements. Known technologies which typically achieve the pathogen and vector
attraction requirements in order to be classified as Class A include alkaline stabilization,
composting and heat drying.
All biosolids, regardless of treatment technology used must meet the following pathogen
reduction requirement in order to be classified as Class A (EPA, 1994):
1) The density of fecal coliform in the biosolids must be less than 1,000
most probable numbers per gram total solids; or
2) The density of Salmonella sp. bacteria in the biosolids must be less than 3
most probable numbers per 4 grams of total solids.
The Code of Massachusetts Regulations Title 310 CMR 32 regulates the production, sale
or distribution and use of biosolids for land application in the state of Massachusetts. Title 310 is
a compilation of regulations from the Department of Environmental Protection. Part 32 of 310
CMR is titled, “Land application of sludge and septage”. For land application of biosolids the
MassDEP classifies the sludge or biosolids as Type I, II or III. Biosolids classified as Type I
may be sold and distributed without any further approval from the Mass DEP; they may be used
for growing any type of vegetation and can be “in direct contact with the edible portion of the
crop” (MassDEP, 2016).
Any sludge or septage to be land applied in Massachusetts must be stabilized; in order for
a sludge or biosolid to be deemed Type I it must be stabilized by one of the methods listed in
column 2 of Table 1 and also meet 310 CMR 32 pollutant concentration requirements. Several
of the MassDEP pollutant requirements are more stringent than the EPA Part 503 requirements,
see Table 2. One of the stabilization methods identified by the MassDEP for Type I generation
is heat drying, which is defined by 310 CMR 32 (similarly to the EPA’s part 503 rule) as, “A
process in which a dewatered sludge cake is dried by direct or indirect contact with hot gases,
and the moisture content is reduced to 10% or lower. Sludge particles shall reach temperatures
well in excess of 80°C, or the wet bulb temperature of the gas stream in contact with the sludge
at the point where it leaves the dryer shall be in excess of 80°C.” (MassDEP, 2016)
Page 10
6
Table 1 - Massachusetts DEP Methods for Pathogen Reduction
Stabilization Methods
Types II and III Biosolids
Stabilization Methods
Type I Biosolids
Aerobic Digestion High Temperature Composting
Air Drying Heat Drying
Anaerobic Digestion Heat Treatment
Low Temperature Composting Thermophilic Aerobic Digestion
Lime Stabilization Electron Radiation *
Gamma Ray Irradiation *
Pasteurization *
Adapted from 310 CMR 32, Appendix A.
Notes: Type II and III are differentiated by pollutant concentrations.
*Electron Radiation, Gamma Ray Irradiation and Pasteurization also require a treatment
process from column 1.
Table 2 - Pollutant Limits and average concentrations in Bay State Fertilizer
Pollutant / Metal
Considered
a Plant
Nutrient
EPA Part 503
Limit for EQ
Biosolids (mg/kg)
Massachusetts
DEP 310 CMR 32
(mg/kg)
Bay State
Fertilizer Average
June 2008 (mg/kg)
Arsenic No 41 Not Regulated Not Detected
Cadmium No 39 14 2
Chromium No 1,200 1,000 49
Copper Yes 1,500 1,000 612
Lead No 300 300 171
Mercury No 17 10 2
Molybdenum Yes 75 40 18
Nickel Yes 420 200 25
Selenium No 36 Not Regulated 4
Zinc Yes 2,800 2,500 1,130
Adapted in part from the EPA’s Guide to Part 503 Rule, along with MassDEP 310 CMR 32,
MWRA’s Bay State Fertilizer Marketing Brochure, and University of Missouri’s Soils, Plant
Nutrition and Nutrient Management Gardener Manual
Page 11
7
The Massachusetts Water Resource Authority (MWRA) processes wastewater from
homes and businesses in Boston and 42 other surrounding communities, as far from the city as
Clinton and Framingham. The MWRA’s wastewater treatment plant is located at Deer Island in
Winthop, MA. The WWTP processes wastewater using primary treatment, secondary treatment,
sludge digestion and disinfection. Prior to 1991 digested sludge and scum were recombined with
chlorinated effluent at the end of the treatment process and discharged into Boston Harbor with
the outgoing tide. In 1988, President Bush Sr. stated that Boston harbor was the dirtiest harbor in
America (Allen, 2013). It was a political attack of the Democratic Nominee, Michael Dukakis,
but regardless of politics, something needed to be done to save Boston Harbor.
Biosolids drying for beneficial reuse had been happening for decades in other parts of the
country, most notably Milorganite Fertilizer has been produced from digested sludge by the
Milwaukee Metropolitan Sewerage District since 1926 (MMSD, 2007). In 1988, the MWRA
made the decision to build a Biosolids Drying Facility (BDF) in Quincy, Massachusetts. New
England Fertilizer Company was awarded the contract by the MWRA to design, build and
operate the new facility. In 1991, the Quincy BDF was opened and began producing fertilizer.
Sludge is transported seven miles from Deer Island to the Biosolids Dryer Facility by a pipeline
running under Boston Harbor. The majority of the fertilizer is distributed in bulk, by trucks, to
farms and golf courses around the state. A small portion of the fertilizer is bagged and sold as
Bay State Fertilizer. Bags can be purchased at the front desk of the BDF or at local garden
centers (MWRA, 2018). The fertilizer produced in Quincy meets all EPA and MassDEP
requirements for Exceptional Quality and Type I biosolids; see Table 2 with pollutant levels in
the Bay State Fertilizer.
It is also worth noting that in 2000 a new outfall was put into use, transporting the
disinfected effluent from Deer Island, 9.5 miles into the deep waters of the Massachusetts Bay,
rather than Boston Harbor where it was previously discharged. Initial dilution at the new outfall
is about 100:1, the Boston Harbor outfall had only been achieving initial dilution of 14:1
(MWRA, 2018).
Page 12
8
Processes for Heat Drying Biosolids
There are several heat drying technologies available to convert sludge produced during
wastewater treatment into a dry product for beneficial reuse. Drying methods are characterized
by their primary method of heat transfer. Methods include convection, conduction and radiation
(WEF, 2014). Drying systems are typically called out as “direct drying” (convection) or
“indirect drying” (conduction). In direct drying the biosolids comes into direct contact with hot
air and gases which cause evaporation (EPA, 2006). Direct dryers include rotary drum dryers,
flash dryers, spray dryers and toroidal dryers. Indirect drying systems keep the biosolids
separated from the heating medium by a metal plate, common heating mediums include oil or
steam. Indirect drying includes steam dryers, hollow flight dryers and tray dryers.
Rotary drum drying is the most prevalent method of biosolids drying in the United States.
There are Biosolids Dryer Facilities at Wastewater Treatment Plants around the country using
Rotary Drum Drying. These facilities accept a variety of sludge, including primary sludge,
waste activated sludge and a combination of primary and waste activated sludge. In some cases
the sludge is digested prior to being sent to the Biosolids Dryer Facilities and in some cases it is
not. The MWRA’s Biosolids Dryer Facility in Quincy, processes only digested sludge. Great
Lakes Water Authority (GLWA) recently constructed the largest Biosolids Dryer Facility in
North America in Detroit. The BDF in Detroit processes primary and waste activated sludge in
varying ratios, but does not process any digested sludge. GLWA noted in a presentation for the
Michigan Water Environment Association that they dealt with challenges processing undigested,
unscreened primary sludge due to the fiber contents. GLWA also noted significant seasonal
variability in the dried biosolids (Khan, 2016). Per presentations by NEFCO, to the same
Michigan Water Environment Association, the type of sludge received by a drying facility can
have a significant impact on the drying process and quality of the final product. Primary sludge
has the highest variability and can contain extraneous materials, waste activated sludge has the
best binding properties but can also be the most prone to odors, and digested sludge has the
lowest volatility and produces the best quality pellets (Kyzar, 2016). Figure 1 shows a general
overview of the wastewater treatment process and the stages at which sludge is generated.
Page 13
9
Digested Sludge
Figure 1 - Wastewater Treatment Process Overview
Biosolids dryer facilities are typically set up with multiple equipment “trains” which
allow for flexibility in operations and maintenance. Each train is comprised of a full set of
drying equipment and each train can be operated as a standalone system. The MWRA’s BDF in
Quincy is made up of 6 equipment drying trains and typically processes approximately 160 dry
tons per day, 4 – 5 days per week; bringing the yearly average to 106 dry tons per day (MWRA,
2011). GLWA’s BDF in Detroit is made up of four dryer trains; the equipment is larger and can
process up to 420 dry tons per day (Khan, 2016). The Detroit facility operates 24 hours a day,
365 days a year.
The equipment setup at most Biosolids Dryer Facilities is comparable. In particular the
NEFCO operated Quincy and Detroit facilities are very similar; see Figure 2. The process starts
with biosolids entering the dryer facilities as sludge. The first step in each train is dewatering,
typically with centrifuges. Due to centrifuge sizing there are two centrifuges per dryer train.
“Cake”, dewatered to 25% - 35% solids (Kyzar, 2016) generated from the centrifuges is mixed
with recycled dried fertilizer using a pugmill mixer. Recycled material is made up of dried
pellets which were outside of the desired 1-3 mm pellet diameter range (Irujo, 2016). Wet cake
Page 14
10
and dried recycled material are mixed at an approximately 1:1 ratio to generate pellets that are
55% - 65% solids prior to entering the rotary drum dryer (Kyzar, 2016). There are spray headers
located within the pugmill which can add water if the percentage of recycled material is too
great. The pugmill is where the pellet shape and size distribution of the pellets is determined.
The pugmills used in biosolids drying are similar to a twin screw conveyor, however the screw is
made up of paddles rather than a continuous smooth screw. This allows the pugmill to transport
and mix concurrently.
Figure 2 - Biosolids Drying Process Diagram
Note: Based on the drying process at NEFCO’s Detroit, MI facility.
While in the rotary drum dryer, evaporation causes pellets created in the pugmill to
transition from 55 – 65% solids to 95 – 98% solids. The rotary drum dryers are large rotating
drums, with flights to ensure even drying of the biosolids, the dryers in Quincy are single pass,
similar to Figure 3. The rotary drums at NEFCO’s Detroit facility are a newer triple pass style as
shown in Figure 4. Each Dryer in Detroit is 12 feet in diameter and approximately 40 feet long.
The pellets formed in the pugmill are transported through the rotating dryer by a large fan.
Temperatures used during the drying process are not high enough to cause oxidation of the
Page 15
11
organic matter, therefore the organic matter is maintained in the final dry biosolids product
(WEF, 2014). After leaving the dryer, pellets are separated from the air and gas in the dryer
using a cyclone air separator, the solids are then sorted using a three level pellet screener.
Oversized pellets are crushed and then added to the recycle bin, and fines (pellets under 1 mm)
are added directly to the recycle bin. Correctly sized pellets are sent through a cooler and on to
silos for storage before distribution.
Figure 3 - Single Pass Rotary Drum Dryer
Feeco, https://feeco.com/rotary-dryers/
Figure 4 - Newer style Triple Pass Rotary Drum Dryer
KBW Machinery, https://rotarydryer.org/triple-pass-drying
Note: though they are not as clearly shown by the diagram, these dryers do typically have flights
to ensure movement.
Page 16
12
Drying Energy Requirements
Sludge disposal typically accounts for more than half of the cost and energy associated
with the overall treatment of municipal wastewater (Wei et al. 2018). Heat drying is more
energy intensive than other reuse methods such as composting and Class B land application
(EPA, 2006). However, drying typically reduces the volume and weight of biosolids by a ratio
of 1:4 compared with dewatered “cake” which could be land applied as Class B biosolids. In
major urban areas biosolids often need to be transported significant distances in order to be re-
used. The energy required for this transportation is location specific, but can play a major role in
a cost/benefit analysis of the energy required for biosolids drying.
At the most basic level all types of biosolids drying bring about the evaporation of water.
Thermal energy needs to be transferred to the biosolids both to evaporate the water and heat the
solids. In addition to thermal energy required to heat the biosolids, energy is required to operate
all of the equipment required to transport, process and handle the biosolids. Thermal energy
consumption accounts for the majority of energy use in biosolids drying. Theoretically,
evaporation of water requires 970 BTU per pound of water. Drying dewatered cake typically
requires 1,400 – 1,700 BTU per pound of water evaporated (EPA, 2006). Energy can be
provided by combustion of fossil fuels, re-use of waste heat or solar radiation. Lower
temperature dryers, such as belt dryers, are more effectively able to utilize waste heat from
existing plant operations than rotary drum dryers (WEF, 2014).
In 2002, New England Fertilizer Company built the second Biosolids Dryer Facility in
Massachusetts, at the Greater Lawrence Sanitary District’s (GLSD) Wastewater Treatment Plant
in North Andover. The facility produces Class A / Type I biosolids fertilizer which is sold to
local farms, similar to the MWRA’s Quincy facility. A major difference from the plant in
Quincy is the fuel source: the GLSD Biosolids Dryer Facility utilizes digester gas produced at
the WWTP to fuel the rotary drum dryers. Per GLSD (2018), this saves the district $600,000 per
year in operation costs. One of the first biosolids dryer facilities in the country, located at the
Milwaukee Metropolitan Sewer District (MMSD), utilizes waste heat from turbine power
generation to supplement heat to their rotary drum dryers. The entire treatment plant at MMSD
is powered by two turbine generators which were installed in the mid-1970s (MMSD, 2007).
Another alternative fuel source is landfill gas; the fuel for the dryers at the Palm Beach County
Page 17
13
Solid Waste Authority’s Biosolids Dryer Facility, is provided solely by landfill gas, with a
natural gas service in place only as a backup (NEFCO, 2018).
Fertilizer Sizing and Blending
One of the ways to increase the value of fertilizer produced in biosolids drying is to blend
the fertilizer pellets with other types of commercially produced, typically chemical, fertilizers.
Per NEFCO (Irujo, 2016) they have found the ideal pellet size which most fertilizer
manufacturers look for, both for fertilizer application and for blending, is 1 – 3 millimeters in
diameter. In addition to more uniform blending, uniform pellet size contributes to a more
constant fertilizer spreading rate and more consistent absorption by soils (Henderson, 2014).
Until the 1980’s, typical fertilizer size ranged between 1 mm and 4 mm in diameter.
Since that time, quality expectations for fertilizer have changed to a smaller pellet size range and
a somewhat increased average pellet size, typically 2 – 4 mm (Ivell and Nguyen, 2013). The two
standard values used in the fertilizer industry to describe size and uniformity are the Size Guide
Number (SGN) and the Uniformity Index (UI). These descriptors can be found using the
following formulas (Ivell and Nguyen, 2013):
- SGN = d50 x 100
o d50 = medium granular diameter in mm
- UI = d5 / d90 x 100
o d5 = diameter at which 5% of sample by weight is smaller, d90 = diameter at
which 90% by weight are smaller
o A uniformity index of 100 would indicate all pellets are the same size
Trends in the market are moving from typical fertilizers with an SGN of 225 (median
diameter of 2.25 mm) to an SGN value closer to 300 (median diameter of 3.0 mm) and a
uniformity index as high as 50 or 60. Henderson (2014) stated that a Uniformity Index of 30
would be considered questionable quality, a UI of 40, good quality and a UI of 50 or above
excellent quality. A lower UI can result in non-uniform fertilizer spreading and distribution, thus
reducing its quality.
Page 18
14
Polyelectrolytes for Coagulation and Dewatering
Polymers are frequently used in water and wastewater treatment for coagulation and
flocculation. Polymers have several advantages over tradition coagulants, such as alum.
Advantages include lower dose requirements, resulting in less material added to the final volume
of sludge and a smaller increase in the ionic load of the treated water. One of the most
significant disadvantages of polymers for coagulation is the dosage sensitivity (Bolto and
Gregory, 2007). Polymers are commonly used for sludge dewatering; however, depending on
the sludge make up, use of polymers can be limited for dewatering due to their sensitivity to pH
(Wei et al., 2018). Crittenden (2012) noted that there are often many competing reactions in
coagulation systems and reactions sometimes do not proceed as expected.
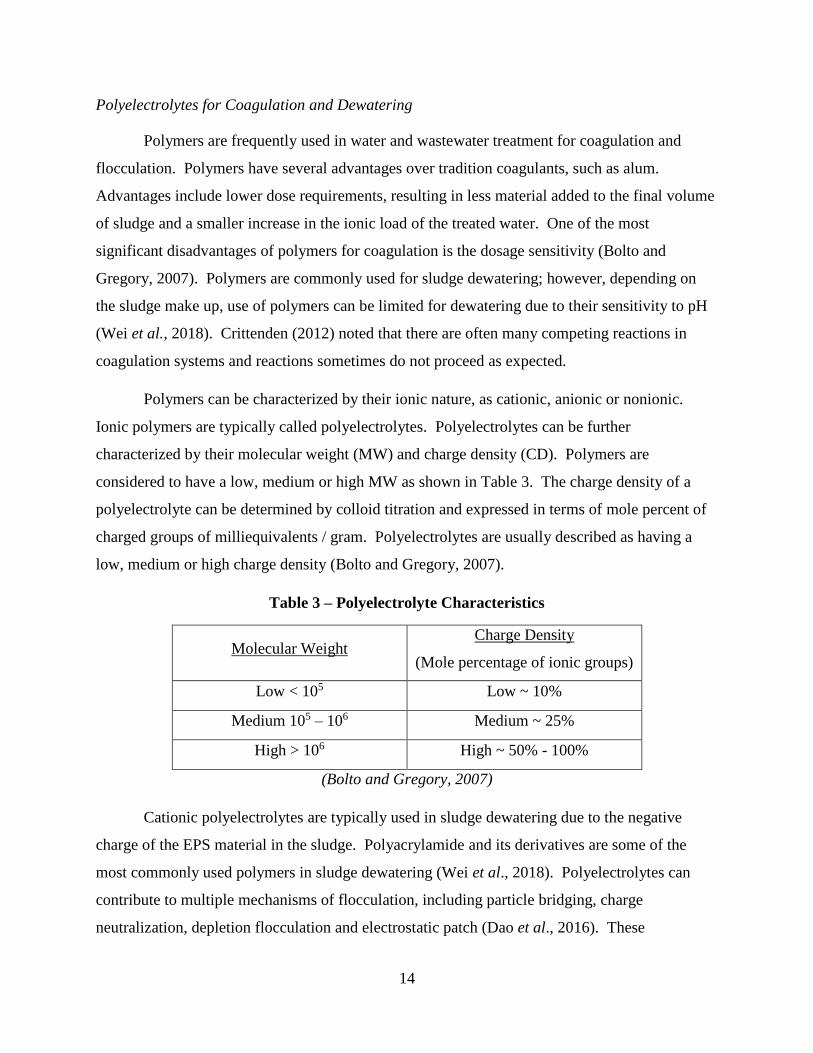
Polymers can be characterized by their ionic nature, as cationic, anionic or nonionic.
Ionic polymers are typically called polyelectrolytes. Polyelectrolytes can be further
characterized by their molecular weight (MW) and charge density (CD). Polymers are
considered to have a low, medium or high MW as shown in Table 3. The charge density of a
polyelectrolyte can be determined by colloid titration and expressed in terms of mole percent of
charged groups of milliequivalents / gram. Polyelectrolytes are usually described as having a
low, medium or high charge density (Bolto and Gregory, 2007).
Table 3 – Polyelectrolyte Characteristics
Molecular Weight Charge Density
(Mole percentage of ionic groups)
Low < 105 Low ~ 10%
Medium 105 – 106 Medium ~ 25%
High > 106 High ~ 50% - 100%
(Bolto and Gregory, 2007)
Cationic polyelectrolytes are typically used in sludge dewatering due to the negative
charge of the EPS material in the sludge. Polyacrylamide and its derivatives are some of the
most commonly used polymers in sludge dewatering (Wei et al., 2018). Polyelectrolytes can
contribute to multiple mechanisms of flocculation, including particle bridging, charge
neutralization, depletion flocculation and electrostatic patch (Dao et al., 2016). These
Page 19
15
mechanisms of coagulation are seen in both water treatment coagulation and sludge dewatering
operations (Wei et al., 2018 and Bolto and Gregory, 2007).
Charge neutralization and bridging are the most prevalent mechanisms of coagulation in
both traditional water treatment and in sludge dewatering, see Figures 5 and 6 (Chen et al, 2005).
Optimum flocculation occurs when particles have been neutralized, or have a zeta potential of
near zero. The zeta potential of a particle describes the electric potential or energy with which a
positively or negatively charged particle will move away from a similarly charged particle and
toward a particle with an opposite charge. Polyelectrolytes with a high charge density tend to
maintain a flat configuration and adsorb to solids in a flat configuration. Due to this tendency, a
polyelectrolyte with a high CD will cause coagulation or dewatering almost wholly by charge
neutralization and electrostatic patch with very little bridging, see Figures 5 and 7 (Bolto and
Gregory, 2007).
Figure 5 - Charge Neutralization
Adapted from Dao et al., 2016
Figure 6 - Polymer Bridging
Adapted from Dao et al., 2016
Page 20
16
Figure 7 - Electrostatic Patch
Adapted from Dao et al., 2016
Charged particles can be destabilized by oppositely charged ions or polymers. When the
amount of polymer that can neutralize the corresponding charge of the particle is adsorbed, the
particle’s zeta potential will be near zero; meaning the particles will not repel each other (low
electrostatic interaction energy) and flocculation or attachment will occur. Particles which are
not being repelled by high electrostatic forces will have a higher probability of being acted on by
Van der Waals attractive forces and therefore coagulation occurs.
Polymers are typically long-chain molecules. Bridging occurs when one end of the chain
adsorbs to a given particle and the other end of the polymer chain adsorbs onto another particle,
connecting the two (or more) particles into a floc. Bridging is most common with non-ionic
polymers and high molecular weight, low charge density polyelectrolytes (Crittenden, 2012).
The electrostatic patch mechanism can occur when a highly charged polyelectrolyte adsorbs onto
a weakly charged particle of opposite charge. If the polyelectrolyte cannot be fully neutralized
by the one particle it will potentially attract a second charged particle in order to be fully
neutralized. The name comes from the fact that a particle would have a small area of positive
charge due to the adsorbed polyelectrolyte (Bolto and Gregory, 2007 and Crittenden, 2012).
Previously Completed Research
Helin Zhang (2018) previously completed research at Worcester Polytechnic Institute to
gauge the impact of amendments on biosolids in solution. Biosolids at the outlet of the pugmill
Page 21
17
at NEFCO’s Quincy facility were collected, dried in an oven, crushed and added to solution.
The zeta potential of the biosolids was then evaluated after the addition of five different
polyelectrolytes. The polyelectrolytes tested include the following –
- Polydiallyldimethylammonium Chloride (PolyDADMAC or PDADMAC)
o Cationic; positively charged
o High charge density; 100 mol%, 6.2 meq/g
(Bolto and Gregory, 2007)
o Medium molecular weight (200,000 – 350,000)
o Linear formula – (C8H16ClN)n
o Density – 1.04 g/mL
o Solution concentration – 20% by weight
o Common use – sludge conditioning in water
treatment (Crittenden, 2012)
- Polyethylene imine (PEI)
o Cationic; positively charged
o Low molecular weight (10,000)
o Linear formula – (CH2CH2NH)n
- Polyallyamine (PAM)
o Cationic; positively charged
o Medium charge density,
o Low molecular weight (17,000)
o Linear formula - [CH2CH(CH2NH2)]n
o Density – 1.02 g/mL
o Solution concentration – 20% by weight
o Common use – primary coagulant in water treatment (Crittenden, 2012)
- Polyethylene oxide
o Non-ionic
o Linear formula - (-CH2CH2O-)n
o High molecular weight (1,000,000)
o Functional group – OH
o Powder form
- Polyacrylic acid
o Anionic
o Linear formula - (C3H4O2)n
Page 22
18
The three cationic polyelectrolytes all reduced the zeta potential, while the anionic and
non-ionic polyelectrolytes did not have an appreciable impact on the zeta potential. This
confirms that the biosolids have a negative surface charge. Zhang (2018) measured the zeta
potential of the particles in solution at increasing polyelectrolyte dosages to determine the dose
required to bring the zeta potential to zero. The results of her work are shown in Figure 8.
Figure 8 – Impact of Polyelectrolytes on Zeta Potential of Biosolids in Solution
(Zhang, 2018)
In the second phase of research completed by Zhang (2018) the three cationic
polyelectrolytes, which successfully lowered the zeta potential, were each added to a solution
with biosolids and the resultant particle size was measured. This work showed that of the three
cationic polyelectrolytes only PDADMAC had a measurable impact on the particle size; with the
addition of PDADMAC the biosolids particle diameter increased by a factor of 4 in 200 minutes.
This indicates when PDADMAC was added to a solution with biosolids flocculation was
occurring. The results of this work are shown in Figure 9.
Page 23
19
Figure 9 – Impact of Polyelectrolytes on Biosolids Particle Size in Solution (Zhang, 2018)
Page 24
20
Methods and Materials
The goal of this research was to reduce fines produced in the biosolids drying process,
potentially reducing the energy required for biosolids drying. A bench scale system to replicate
the main equipment at the “heart” of the Biosolids Dryer Facilities in Quincy, Detroit and many
other facilities was developed and utilized for this purpose.
Development of the Bench Scale System
As described previously, biosolids pellets at NEFCO’s facilities are created in the
pugmill by mixing dewatered biosolids cake and recycled dry biosolids. The pellets are then
dried in a rotary drum dryer. Beyond the pugmill and dryer, there are eight to ten other pieces of
equipment that make up each dryer train, however with regards to pellet size, dryness and
uniformity, the pugmill and dryer are by far the most consequential. To create this “heart” of the
biosolids dryer system at a bench scale, a laboratory sized soil mixer was used to replicate the
pugmill and a Buchi Rotavapor was used to replicate the dryer.
Samples for the bench scale drying system were collected from the MWRA’s Biosolids
Drying Facility in Quincy, MA. As previously noted all sludge processed at the Quincy facility
has been through the digestion process. Samples were collected in clean plastic containers with
screw on lids, with sample sizes ranging from one to three quarts. Samples were collected on
four different occasions; between June 2018 and October 2018. All samples were transported
back to the WPI laboratory after collection and stored in their sealed containers at 4 ͦ C.
Samples collected include the following –
- Dewatered biosolids – “cake”
o Collected from the weight belt conveyor which transfers the cake from the
centrifuge where it is dewatered to the pugmill for mixing with dry biosolids
- Dry biosolids – “recycle”
o Collected from the recycle bin where product from the screener and crusher are
stored before being transferred back to the pugmill
- Mixed biosolids –
Page 25
21
o Collected at the end of the pugmill prior to being fed into the dryer
The first phase of laboratory work involved characterizing the samples along with
determining mixing parameters and cake to recycle ratios. Small amounts of the cake and mixed
biosolids were transferred to small drying tins and the samples were dried in an oven at 100 ͦ C
for 24 hours. The samples dried were approximately 10 – 20 grams each. The two samples of
dried cake were both within a half percent of 26% solids. Three samples of the mixed material
were dried in the oven, the mixed biosolids was determined to be 54% – 56% solids.
The first mixing trials were conducted using a 1:1 volumetric ratio of cake to recycle.
230 mL of recycle material was measured and placed in the mixer, followed by 230 mL of cake.
The size of the clumps of cake varied, the cake was broken up slightly by gloved hand if needed
to obtain a reasonably accurate volume measurement with limited air space without packing into
the beaker for measurement. The standard paddle attachment was used in the mixer (see Figure
10). The following visual observations were noted during mixing: at 30 seconds the material
was generally combined, however large pieces of wet material remained; at 2 minutes the color
distinction between wet and dry had largely disappeared; and at 3 minutes the material appeared
visually to be fully blended. After three minutes of mixing, three small samples were taken from
different areas of the mixer, weighed, dried in the oven at 100 ͦ C for 24 hours and weighed again
to determine both percent solids and mixture uniformity. The samples ranged from 58.3% solids
to 60.2% solids. The percent solids found for the samples with the 1:1 ratio was relatively
consistent, however it was approximately 4% more dry than the mixed biosolids samples from
NEFCO’s Quincy Facility.
Page 26
22
Figure 10 - Bench Scale Mixer
For the second mixing trial the ratio of cake to recycle was modified to 1.2 cake : 1
recycle. This change was made in order to decrease the percent solids in the mixed product prior
to entering the dryer and better replicate the drying process at NEFCO’s Quincy Facility. The
actual volumes mixed were 275 mL cake and 230 mL recycle. Mixing time was increased to 5
minutes to increase uniformity. Similarly to the first mixing trial three samples were taken from
the mixer, weighed and dried for 24 hours in the oven at 100 ͦ C. It was found that the samples
from this mixing trial ranged from 55.1% solids to 59.5% solids. Based on the information
provided from NEFCO that pugmill mix typically ranges from 55% solids to 65% solids and the
testing completed on the pugmill sample taken from the Quincy BDF indicating 54% - 56%
solids, the volumetric ratio of 1.2 cake : 1 recycle was chosen for bench scale drying moving
forward.
The Buchi Rotavapor R-300 consisted of a vacuum pump, cooling coil and tower, hot
water bath and solvent/condensate collection container, as shown in Figure 11. The Rotavapor
has several adjustable operational parameters including vacuum level, bath temperature and
Page 27
23
rotation speed. The Buchi Rotavapor manual recommended several baseline parameters based
on the solvent to be evaporated. The “solvent” to be evaporated in this drying work is largely
water. The recommended parameters for water are a vacuum of 42 mBar and a bath temperature
of 50 ͦ C. The vacuum is determined by the pressure required to boil water at a temperature 20 ͦ C
below the bath temperature. Because the solids being dried have less contact, and therefore less
surface area for heat transfer than a liquid, the initial drying trial was conducted at a pressure
vacuum of 42 mBar, a bath temperature of 60 ͦ C and 20 rotations per minute. A volume of
approximately 250 mL was dried in the Rotavapor for each trial. This allowed the material to
largely be located in the portion of the vessel in contact with the heating bath (see Figure 11).
Figure 11 - Buchi Rotavapor used as bench-scale dryer.
Initial drying trials were run with biosolids without amendment to determine percent
solids after increasing times in the dryer. With the initial settings it took 100 minutes in the
Rotavapor for the mixed biosolids to reach over 90% solids. The goal for percentage solids after
drying is 95% - 98% in order to replicate the pellets dried in a typical Rotary Drum Dryer. For
Page 28
24
the second round of drying trials, the bath temperature was increased to 95 ͦ C, the mixing was
increased to 40 RPM, and the vacuum was unchanged. The mixing speed was increased to
create additional agitation to more accurately duplicate a drum dryer. The second drying trials at
95 ͦ C were able to achieve over 95% solids content within 60 minutes, (see Figure 13). A
temperature of 95 ͦ C, a vacuum of 42 mBar, a speed of 40 RPM and a drying time of 60 minutes
was used for drying trials moving forward.
Figure 12 - Drying Time in Rotavapor vs Percent Solids after Drying
After the mixing ratio and rotavapor drying parameters were established, subsequent
drying trials began. The variables for this study are amendment, amendment dosage and mixing
time. Another unintentional variability is the time of year when the biosolids samples were
collected. Amendments and amendment dosage rates were chosen based on the previously
discussed work by Zhang, 2018, on this topic. During development of the bench scale a period
of 5 minutes was found produce a uniform mixed product. Pellet size distribution was evaluated
for a mixing time of 5 minutes and 10 minutes in this study to evaluate the impact of increased
mixing time.
60%
65%
70%
75%
80%
85%
90%
95%
100%
20 30 40 50 60 70 80 90 100 110
Per
cent
So
lid
aft
er D
ryin
g
Minutes in Rotavap
20 RPM, 60 C
40 RPM, 95 C
Page 29
25
Due to equipment sizing, the amount of biosolids initially placed in the rotavapor for
drying was half of that created during the mixing process. For the initial drying trials with each
amendment, after mixing the cake and recycle for 5 minutes, the amount to be dried was
removed, and the remaining mixture was then mixed for another 5 minutes and dried in the
rotavapor separately. The impact of the additional mixing time on pellet size distribution and
fines generation was evaluated without amendment and for each amendment.
Sieve analysis was completed for the dried samples to provide a pellet size distribution.
8” USA Standard Test Sieves, manufactured by Hogentogler and conforming to ASTM E-11
(standard specifications for test sieves) were used, see Figure 13 and Table 4. All sieves were
washed before and after use with warm water and detergent, using a soft bristled brush to clean
any material caught in the mesh openings. After drying, the fully dried sample was weighed, the
sample was then passed through the set of sieves (shaking manually for 60 seconds). The dried
pellets left on each sieve were weighed and recorded. This information was used to create the
pellet size distributions and calculate the average pellet diameter. The average pellet diameter
was approximated by multiplying the percent by mass solids of each size category by the average
diameter for that mesh size, see Table 4.
Figure 13 - Sieves for Pellet Size Analysis
Page 30
26
Table 4 - Sieve Size Gradations
Mesh Size Diameter Range Average Diameter for
Mesh Size
4 mesh Greater than 4.76 mm Assumed 5 mm
6 mesh 3.36 - 4.76 mm 4.06 mm
8 mesh 2.38 - 3.36 mm 2.87 mm
16 mesh 1.19 - 2.38 mm 1.78 mm
28 mesh 0.62 - 1.19 mm 0.91 mm
Fines Less than 0.62 mm Assumed: 0.30 mm
Drying with Amendments
As discussed in the Background, in previous research Zhang (2018) found that
polydiallyldimethylammonium chloride (PDADMAC) reduced the zeta potential and had a
significant impact on the particle size of biosolids in solution. This amendment was further
evaluated in this research. Another cationic polyelectrolyte amendment, polyallyamine (PAM),
was chosen for the second round of drying trials with amendment.
Polyelectrolytes were applied in solution to the biosolids in the mixer, during active
mixing. The amount of polyelectrolyte solution applied was determined by the amount required
to reduce the zeta potential as found in previous research. The amount of biosolids by mass in
the mixer was found by measuring the biosolids cake and recycle before they were placed in the
mixer. The mass of cake was reduced by 74% in the polyelectrolyte dosage calculations to
account for the water that constitutes the majority of the 26% solids dewatered cake. The mass
of the recycle was reduced by 2% based on the assumption that the dry recycle product is
approximately 98% solids. PDADMAC was procured as a 20% by weight solution from Sigma-
Aldrich (CAS number 26062-79-3) and PAM was procured as a 15% by weight solution from
Polysciences, Inc. (CAS number 30551-89-4).
The polyelectrolytes were applied to the mixture using a small spray bottle. The initial
dosage application was the dosage found by Zhang, 2018 to be effective at lowering the zeta
potential. The amendments were applied starting at time 1:00 of the mixing period and
Page 31
27
concluding by time 2:00. This ensured 3 minutes of mixing time after amendment addition with
the lowest mixing time of 5 minutes. 3 minutes of mixing time was found during bench scale
development to produce a fully mixed product. Spray application was intended to replicate the
spray headers found in pugmills at Biosolids Dryer Facilities which are currently used for water
application if needed.
After the initial dose of polyelectrolyte (0.03 mg/mg PDADMAC) was applied and the
drying trial completed, the dose was determined to have had too significant of an impact (90% of
pellets were oversized). The dose was then reduced to evaluate at varying application rates. The
dose was cut by 50% to 0.015 mg PDADMAC / mg biosolids and the trial was repeated with a 5
minute mixing time and 10 minute mixing time. Each mixture sample was transferred to the
rotavapor vessel and dried for 60 minutes at a temperature of 95 ͦ C, a vacuum of 42 mBar and a
speed of 40 RPM. A sieve analysis was completed to find the size distribution by weight for
each dried sample. After the 0.015 mg/mg trial the PDADMAC dose was reduced further to
evaluate impact of the amendment. A full list of trials can be found in appendix #1.
Page 32
28
Results and Discussion
The goal of this study was to determine an amendment which can be added during the
pugmill mixing stage of the drying process to promote uniform agglomeration of biosolids
pellets and reduce the percentage of fines produced when drying biosolids. Testing determined
that PDADMAC, a cationic polyelectrolyte, had a measurable however inconsistent impact on
the pellet size distribution. Impact of mixing time on biosolids pellet size distribution was
evaluated with and without amendments, showing that increased mixing time reduces the
average pellet diameter. Another unexpected finding in this work was the variability in the
characteristics of the recycle material collected from NEFCO’s Dryer Facility in Quincy.
Drying with Amendments
The first amendment to be applied to the biosolids in bench scale drying was
PDADMAC. The first step was to determine if the amendment had an impact on pellet size
distribution, the second step was to determine an ideal dosage. All of the drying trials with
PDADMAC at varying dosages shown in Figure 14 were run with samples from the same
sample batch collected from the Quincy BDF in July 2018.
The initial dosage of PDADMAC applied to the biosolids during the mixing stage was
0.03 mg PDADMAC / mg biosolids. This is the dose that was found to lower the absolute zeta
potential to near zero which was also the dose used by Zhang (2018) for the particle aggregation
(size) tests. In this research, the initial dose of PDADMAC had a major impact on the pellet
size. The size increased to approximately 25 mm in diameter, which was significantly larger
than the typical 1 mm – 3 mm or 2 mm – 4 mm ranges desired in fertilizer production (see
Figures 14 and 15). During mixing it was noted from visual observations that after spray
application of PDADMAC the biosolids lost the granular pellet form and took on a form similar
to a mass of cookie dough. Trials were then run with PDADMAC doses of 0.015 mg/mg and
0.0087 mg/mg. During these PDADMAC dosage trials, the 0.015 mg/mg dose was found to
increase the overall pellet size from an average diameter of 2 mm to an average diameter of 3
mm. In addition, the mass of fines decreased from 7% to 1%, while the oversized pellets
increased from 1% to 8%.
Page 33
29
Figure 14 – PDADMAC Amendment Dosage Trials; Pellet Size Distribution
All drying trials displayed in this figure were single trials completed with samples collected from
NEFCO’s Quincy Facility in July 2018.
Figure 15 - Photos of Pellets Dried with PDADMAC at Varying Concentrations
0.0%
10.0%
20.0%
30.0%
40.0%
50.0%
60.0%
70.0%
80.0%
90.0%
100.0%
No Amendment
Average Diameter - 2.0
mm
PDADMAC (0.0087
mg/mg)
Average diameter - 1.9
mm
PDADMAC (0.015
mg/mg)
Average Diameter - 3.1
mm
PDADMAC (0.03 mg/mg)
Average Diameter - 25
mm
Per
cent
by W
eight
at M
esh S
ize
Pellet Size Ranges
4 mesh
(greater than 4.76 mm)
6 mesh
(3.36 - 4.76 mm)
8 mesh
(2.38 - 3.36 mm)
16 mesh
(1.19 - 2.38 mm)
28 mesh
(0.62 - 1.19 mm)
Fines
Page 34
30
Based on the trials run with samples collect in July, a dose of 0.015 mg PDADMAC / mg
biosolids was chosen as the dose for further testing. Two additional drying trial runs were
conducted with a dose of 0.015 mg/mg, with samples collected in both August and October. In
drying trials with August 2018 samples, PDADMAC reduced the percentage of fines from 3.7%
to 0.4%, however 70% of the pellets created were oversized, greater than 5 mm in diameter.
This potentially indicates the dosage of polyelectrolyte was too high. In the final drying trials
with samples from October, the 0.015 mg PDADMAC/ mg amendment dose had very little
impact on the pellet size distribution. The pellet size distribution very closely matched the size
with no amendment from the same samples. This points to variability in the biosolids collected
and polyelectrolyte dose sensitivity, see Figure 16. A full list of trials can be found in appendix
#1.
Figure 16 - No Amendment vs PDADMAC 0.015 mg/mg – July, August, October
0.0%
10.0%
20.0%
30.0%
40.0%
50.0%
60.0%
70.0%
80.0%
No AmendmentAverage
Diameter - 2.4mm
PDADMAC (0.015mg/mg)Average
Diameter - 3.4mm
No AmendmentAverage
Diameter - 2.4mm
PDADMAC (0.015mg/mg)Average
Diameter - 4.7mm
No AmendmentAverage
Diameter - 1.9mm
PDADMAC (0.015mg/mg)Average
Diameter - 1.9mm
July Samples August Samples October Samples
Perc
ent
by
Wei
ght
at M
esh
Siz
e
4 mesh(greater than 4.76 mm)
6 mesh(3.36 - 4.76 mm)
8 mesh(2.38 - 3.36 mm)
16 mesh(1.19 - 2.38 mm)
28 mesh(0.62 - 1.19 mm)
Fines
Page 35
31
Polyallyamine (PAM) was another cationic amendment applied to the biosolids during
mixing. A dosage of 0.005 mg PAM / mg biosolids was previously found by Zhang (2018) to
reduce the zeta potential to near zero. PAM was tested on the biosolids samples collected in
August and October. Though the unamended samples from different sample collection dates
resulted in different size distributions, the change caused by application of PAM in both trials
was minimal, see Figure 19.
Figure 17 - PAM Amendment Trials
Figure 18 - Photos of Pellets Dried with PAM
0.00%
10.00%
20.00%
30.00%
40.00%
50.00%
60.00%
70.00%
August Sample
No Amendment
Average Diameter - 2.1 mm
August Sample
PAM (0.005 mg/mg)
Average Diameter - 2.0 mm
October Sample
No Amendment
Average Diameter - 1.5 mm
October Sample
PAM (0.005 mg/mg)
Average Diameter - 1.3 mm
Per
cent
by W
eight
at M
esh S
ize
Pellet Size Ranges
4 mesh
(greater than 4.76 mm)
6 mesh
(3.36 - 4.76 mm)
8 mesh
(2.38 - 3.36 mm)
16 mesh
(1.19 - 2.38 mm)
28 mesh
(0.62 - 1.19 mm)
Fines
Page 36
32
Mixing time
To test the impact of mixing time on biosolids, the particle size distributions were
measured at two different mixing times for each amendment: 5 minutes and 10 minutes.
Compared to the un-amended samples, the amount of fines increased less with PDADMAC and
PAM amendments and the oversized particles decreased with increased mixing time. The
biosolids samples for the different polyelectrolyte and the no amendment trials were collected on
multiple visits to NEFCO in Quincy and had varying characteristics; however, each set of 5
minute and 10 minute mix trials inTable 5 were run with material from biosolids samples
collected the same day. The percent increase in fines from 5 minutes of mixing time to 10
minutes of mixing time was significantly less for all drying trials in which polyelectrolytes were
added during the second minute of mixing.
Table 5 - Percentage of Fines by Mixing Time, amended and unamended.
Drying Trials 5 Minutes Mixing
Percent Fines by
Weight
10 Minutes Mixing
Percent Fines by
Weight
Percent
Increase in
Fines
No Amendment 2.1% 7.1% 238.1%
No Amendment – Second Trial 1.1% 3.8% 241.8%
PDADMAC (0.0087 mg/mg) 3.7% 5.5% 48.6%
PDADMAC (0.015 mg/mg) 0.6% 0.9% 50.0%
PAM (0.005 mg/mg) 3.9% 5.8% 48.7%
Single trial of each row
The Size Guide Number (SGN) and the Uniformity Index (UI) are the fertilizer industry
standard descriptors for fertilizer size and uniformity. These values were calculated for the
samples with no amendment and for samples collected in July 2018 amended with PDADMAC
at a dose of 0.015 mg/mg. The Uniformity Index indicates samples that would be considered
poor in the industry, with a UI below 50. However in a biosolids dryer facility the dry product
would be screened and sorted with the oversized, and the undersized material sent to the recycle
bin. In this case, these numbers simply show the impact of the PDADMAC on the pellet size
distribution.
Page 37
33
Table 6 - Uniformity Index and Size Guide Number
No Amendment
PDADMAC
(0.015 mg/mg)
UI 22.9 30.0
SGN 207 310
Sample Variability
One of the key findings of this work was the significant variability in the results from
samples collected from the Biosolids Dryer Facility in Quincy at different times of the year.
Initial samples were collected in June and July 2018. As trials continued, additional samples
were collected in August and October 2018. There was major variability in the size distribution
of the material collected from the recycle bin at NEFCO, see distribution in Table 7. This
analysis was not completed for recycle samples collected in June or July, however based on
visual observation and drying results, it is assumed the size distribution of the recycle from the
earlier samples fell in between the two distributions.
There are several potential reasons for variability in the recycle biosolids size distribution –
- When a new drying train is put on-line, there is a period when pellets are created before
the temperature of the biosolids can be verified to be above 80°C (as required by EPA
Part 503 Rule and MassDEP 310 CMR 32). During this period all biosolids exiting the
dryer bypass the screener and are sent directly to the recycle bin.
- Seasonal variability in the sludge; seasonal changes have been shown to change the
material composition of sludge at some wastewater treatment plants.
- The crusher takes oversized material and crushes it to approximately 1.5 mm in diameter.
If at any point the crusher was off for a period of time a greater percentage of fines may
be in the recycle bin. (It is not known if this situation occurred prior to any of the
biosolids sample collections.)
Page 38
34
- Based on the size of the recycle bin, dried recycled material can spend between 2 and 5
hours in the bin while the given train is running; this means it is difficult to judge when
an impact to recycle size would be seen at the outlet of the recycle bin.
- When samples were collected in August, the Plant Manager at NEFCO noted that there
had been a power outage earlier in the day. This could indicate a new dryer being put
back on-line and all pellets being sent to the recycle bin.
Table 7 – Size Distribution of Recycle Sample Material
Diameter Range Recycle from August Recycle from October
4 mesh
(greater than 4.76 mm) 0.00% 0.88%
6 mesh
(3.36 - 4.76 mm) 0.40% 4.06%
8 mesh
(2.38 - 3.36 mm) 24.80% 5.12%
16 mesh
(1.19 - 2.38 mm) 70.20% 7.07%
28 mesh
(0.62 - 1.19 mm) 4.40% 60.78%
Fines 0.20% 21.02%
Page 39
35
Conclusions and Future Work
PDADMAC had a noticeable impact on the amount of fines produced and on pellet size
distribution during bench scale biosolids drying, although inconsistent from batch-to-batch.
PAM, which has a lower charge density and lower molecular weight than PDADMAC, did not
have a measurable impact on the pellet size distribution when compared to the drying trials
without amendment. This agrees with previous research indicating the particle size of biosolids
in solution was increased by PDADMAC and not by PAM. The reasons for inconsistent results
from different dosage applications are unknown due to the complexity of the surface chemistry.
But the sensitivity of polymer dosing on the outcomes is thought to be due to the inconsistent
nature of the biosolids. Both of the cationic polyelectrolytes tested in this work limited the
increase in percentage of fines that is typically seen when mixing time is extended.
Additional research would be required to determine if a single dose of polyelectrolyte
could be applied consistently to biosolids without the potential of overdosing and creating
significantly oversized pellets and likely issues within the pugmill. If an effective dose were to
be established an economic feasibility study would need to be completed. The study would need
to analyze the energy savings against the cost of the additional polymer blending equipment and
the cost of the polyelectrolyte.
Page 40
36
References
Allen, G., Dirtiest Harbor in America? Wilmington Town Crier, September 27, 2013
Bolto, B.; Gregory, J., Organic polyelectrolytes in water treatment. Water Research, 2007, 41,
2301-2324
Chen, B.; Lee, S.; Lee, D., Rheological characteristics of the cationic polyelectrolyte flocculated
wastewater sludge. Water Research, 2005, 39, 4429-4435
Christensen, M.L.; Keiding, K.; Nielsen, P.H.; Jorgensen, M.K., Dewatering in biological
wastewater treatment: A review. Water Research, 2015, 82, 14-24
Crittenden, J.C.; Trussell, R.R.; Hand, D.W.; Howe, K.J.; Tchobanoglous, G., Water Treatment
Principles and Design, Third Edition: Chapter 9 Coagulation and Flocculation. 2012, John Wiley
& Sons, Inc.
Dao, V.H.; Cameron, N.R.; Saito, K., Synthesis, properties and performance of organic polymers
employed in flocculation applications. Polymer Chemistry, 2016, 7, 11-25
Degreve, J.; Baeyens, J.; Van de Valden, M.; De Laet, S., Spray-agglomeration of NPK-fertilizer
in a rotating drum granulator. Powder Technology, 2006, 163, 188-195
Drying of Wastewater Solids: Fact Sheet. Water Environmental Federation, Residuals and
Biosolids Committee, Bioenergy Technology Subcommittee, 2014
Feeco International, Feeco Direct Rotary Dryers, 2018, (https://feeco.com/rotary-dryers/)
Khan, M., Great Lakes Water Authority – Biosolids Dryer Facility. Michigan Water
Environment Association, Presentation
Greater Lawrence Sanitary District, Operations. 2018
(http://www.glsd.org/administration/operations/)
Henderson, J., Agronomic Solutions II: Choosing the Right Fertilizer for Your Turf: Methods of
Application. Golf Course Superintendents of America, Presentation 2014
Irujo, M., Building a Sustainable Pelletized Biosolids Marketing Program. MWEA Biosolids
Conference 2014. Presentation.
Ivell, D.; Nguyen, V., The Evolution of Screening Systems for Optimum Granular Fertilizer
Product Quality. Procedia Engineering, 2014, 83, 328-335
KBW Machinery, Product Details: Triple Pass Drum Dryer. 2018, (https://rotarydryer.org/triple-
pass-drum-dryer)
Keane, T., The Boston waterfront has arrived. The Boston Globe, May 11, 2012
Page 41
37
Korpe, S.; Erdogan, B.; Bayram, G.; Ozgen, S.; Uludag, Y.; Bicak, N., Crosslinked DADMAC
polymers as cationic super absorbents. Reactive and Functional Polymers, 2009, 69, 660-665
Kyzar, J. GLWA Owned-NEFCO Operated Biosolids Drying Facility. Biosolids Seminar –
Replanting Detroit 2016, Presentation
Le, T.; Miclet, D.; Heritier, P.; Piron, E.; Chateauneuf, A.; Berducat, M., Morphology
characterization of irregular particles using image analysis: Application to solid inorganic
fertilizers. Computers and Electronics in Agriculture. 2018, 147, 146-157
Lupton, S., Markets of waste and waste-derived fertilizers: An empirical survey. Journal of
Rural Studies, 2017, 55, 83-99
Massachusetts Water Resource Authority, Bay State Fertilizer Marking Brochure.
Massachusetts Water Resource Authority, The Boston Harbor Project: an Environmental Success
Story. 2014
(http://www.mwra.state.ma.us/01news/2008/bhpenvironentalsuccess/bhpenvsuccess.htm)
Massachusetts Water Resource Authority, The Deer Island Sewage Treatment Plant. 2009
(http://www.mwra.state.ma.us/03sewer/html/sewditp.htm)
Massachusetts Water Resource Authority, Recycling Wastewater Sludge into Fertilizer. 2018
(http://www.mwra.state.ma.us/03sewer/html/sewssc.htm)
MassDEP, 310 CMR 32.00: Land Application of Sludge and Septage. 2016
McCauley, A,; Jones, C.; Jacobson, J., Commercial Fertilizers and Soil Amendments. Montana
State University Nutrient Management Module No. 10. May 2009
Mehring, A.L.; White, L.M.; Ross, W.H.; Adams, J.E., Effects of Particle Size on the Properties
and Efficiency of Fertilizers. United States Department of Agriculture, Technical Bulletin No.
485. September 1935
Milwaukee Metropolitan Sewerage District, 2020 Facilities Plan: Description of Treatment
Facilities, 2007
Nathan, M.V., Master Gardener Core Manual. University of Missouri Extension, 2017
(https://extension2.missouri.edu/MG4)
Pesonen, J.; Kuokkanen, V.; Kuokkanen, T.; Illikainen, M., Co-granulation of bio-ash with
sewage sludge and lime for fertilizer use. Journal of Environmental Chemical Engineering,
2016, 4, 4817-4821
Page 42
38
Pradel, M.; Aissani, L.; Villot, J.; Baudez, J.C., From waste to added value product: towards a
paradigm shift in the life cycle assessment applied to wastewater sludge – a review. Cleaner
Production, 2016, 131, 60-75
Raynaud, M.; Vaxelaire, J.; Olivier, J.; Dieude-Fauvel, E.; Baudez, J.C., Compression
dewatering of municipal activated sludge: Effects of salt and pH. Water Research, 2012, 46 (14)
4448-4456
Sperry, J. M.; Peirce, J. J., Ion Exchange and Surface Charge on Montmorillonite Clay. Water
Environment Research, 1999, 71 (3), 316-322
Traunfeld, J; Nibali, E., Soil Amendments and Fertilizers, University of Maryland Extension,
2013, HG 42
U.S. EPA, Biosolids Technology Fact Sheet; Heat Drying. September 2006
U.S. EPA Office of Wastewater Management, A Plain English Guide to the EPA Part 503
Biosolids Rule. 1994
U.S. EPA Office of Water, Biosolids Recycling: Beneficial Technology for A Better
Environment. 1994
U.S. EPA Region VIII, Biosolids Management Handbook, 1995
Wang, H.; Hu, H.; Wang, H.; Zeng, R., Impact of dosing order of the coagulant and flocculant on
sludge dewatering performance during the conditioning process. Science of the Total
Environment, 2018, 643, 1065-1073
Wei, H.; Gao, B.; Ren, J.; Li, A.; Yang, H., Coagulation/flocculation in dewatering of sludge: A
review. Water Research, 2018, 143, 608-631
Yu, J.; Wang, D.; Ge, X.; Yan, M.; Yang, M., Flocculation of kaolin particles by two typical
polyelectrolytes: A comparative study on the kinetics and floc structures. Colloids and Surfaces,
2006, 290, 288-294
Zhang, H., Enhancement of municipal wastewater biosolids drying through interfacial energy
modifying amendments to promote uniform agglomeration. Worcester Polytechnic Institute
Master’s Thesis, 2018
Page 43
39
Appendix #1
Trial Variables Resulting Pellet Size Distribution
Amendment Dosage Mix Time Samples Collected
4 mesh (greater
than 4.76 mm)
6 mesh (3.36 - 4.76
mm)
8 mesh (2.38 - 3.36
mm)
16 mesh (1.19 - 2.38
mm)
28 mesh (0.62 - 1.19
mm) Fines
None NA 5 Minutes July 1.1% 12.0% 31.0% 39.7% 14.4% 2.1%
None NA 10 Minutes July 0.7% 11.5% 26.5% 28.4% 25.8% 7.1%
PDADMAC 0.015 mg/mg 5 Minutes July 46.3% 26.4% 14.7% 9.7% 2.3% 0.6%
PDADMAC 0.015 mg/mg 10 Minutes July 8.0% 36.0% 27.8% 22.1% 5.3% 0.9%
PDADMAC 0.03 mg/mg 5 Minutes July 94.8% 1.5% 1.6% 1.4% 0.4% 0.3%
PDADMAC 0.0087 mg/mg 5 Minutes July 1.8% 11.5% 26.0% 31.6% 25.2% 3.7%
PDADMAC 0.0087 mg/mg 10 Mintues July 0.0% 10.9% 22.0% 31.1% 30.5% 5.5%
None NA 5 Minutes August 14.92% 27.57% 30.13% 26.47% 0.20% 1.10%
None NA 10 Minutes August 0.00% 4.58% 29.61% 58.74% 3.16% 3.76%
PAM 0.005 mg/mg 5 Minutes August 2.30% 7.00% 24.48% 55.48% 7.64% 3.93%
PAM 0.005 mg/mg 10 Minutes August 0.42% 3.91% 24.48% 55.18% 10.11% 5.79%
PDADMAC 0.015 mg/mg 10 Minutes August 73.28% 7.14% 8.37% 9.85% 0.86% 0.37%
None NA 10 Minutes October 2.30% 8.06% 9.32% 13.82% 55.18% 10.99%
PDADMAC 0.015 mg/mg 10 Minutes October 2.45% 7.35% 7.21% 18.64% 53.47% 10.20%
PAM 0.005 mg/mg 10 Minutes October 1.71% 6.04% 6.96% 10.72% 55.64% 18.93%