34
Ensuring Childcare Sufficiency and Improving Information Meeting the requirements of the Childcare Act (2006)
| Date post: | 14-Dec-2015 |
| Category: |
Documents |
| Upload: | trenton-spittle |
| View: | 214 times |
| Download: | 0 times |

Ensuring Childcare Sufficiency
andImproving Information
Meeting the requirements of the Childcare Act (2006)

John Abraham
Head of Child & Family Programmes Children's Strategy Division
Welsh Assembly Government

Shaping Childcare in your Area
David Dallimore
Director, Melyn Consulting

Childcare Sufficiency
The Childcare Act 2006 Section 22
Places a duty on local authorities in Wales to secure, as far as reasonably practicable, sufficient childcare to meet the requirements of parents in the area who require childcare in order to work or to undertake training or education or to prepare for work.

Childcare Sufficiency Assessment
The Childcare Act 2006 Section 27
• Undertake a Childcare Sufficiency Assessment and review annually
• Secure sufficient childcare to meet the needs of working parents, and those seeking work
- Disabled children
- Welsh speaking provision

Childcare Supply
What childcare is currently available?
CSSIW data
CIS
Survey of childcare providers
Childcare Demand
What unmet demand is there for
childcare?
Parent Survey
Focus groups
Interviews with parents
Consultation with employers
Interviews with stakeholders
Vacancy rates
Local Context
What are the local social
and economic conditions that
affect childcare?
Child Population Statistics
Family Characteristics
Working Patterns
Family Incomes
Childcare Sufficiency Assessment

Childcare Sufficiency Assessment
• Establishing current levels of childcare supply
• Identifying gaps in childcare supply
• Assessing childcare demand
• Putting into local context and using local knowledge

Childcare Sufficiency Assessment
Draft Sufficiency AssessmentAnalysing the childcare market
Identifying gaps in provision
Making recommendations
ConsultationStakeholders EYDCP
Parents & Carers
Children & Young People
Providers Employers
Final Sufficiency Assessment Report
as part of the Children & Young People’s Plan

Case Study: Neath Port Talbot

Case Study: Neath Port Talbot
Took into account current levels of childcare, vacancies in existing provision, changing demand as reported by childcare providers and parents views
• Gaps in childcare supply for pre-school childcare in a number of areas
• Gaps in childcare for school aged children – especially for holiday care
• Information barriers
• Sustainability issues

• Development priorities
• Funding requirements
• Priorities for Information Services
• Identification of areas for joined-up working
• Workforce Development Strategy
Childcare Sufficiency Assessment

Managing Childcare Data
Tony Baxter & Martin Creasey
Tribal
Listening to Parents
Emma Knights
Chief Executive, Daycare Trust

Research Techniques
David Dallimore
Director, Melyn Consulting

Meaningless statistics are up 6.5 percent from last year

Quantitative research
• Involves information or data in the form of numbers
• Allows us to measure or to quantify things
• Respondents don’t necessarily give numbers as answers - answers are analysed as numbers
• Examples: Paper-based surveys; interviews; internet surveys; telephone surveys; street surveys

Qualitative research
• Helps us flesh out the story and develop a deeper understanding of an issue
• Often contrasted to quantitative research
• Together they give us the ‘bigger picture’
• Good examples of qualitative research are face-to-face interviews, focus groups and site visits

Research
• Identify clearly your aims for the research
• Review existing information / literature
• Select questions that are relevant, concise and efficient
Your greatest enemy in survey research may well be poor response rate.
Clear and concise questionnaires can help get the best response.

Research
Sample Sizes• Comprehensive Sample• Random Sample
Swansea: Children aged 0 to 14 = 37,500Average family size = 1.8Number of families = 20,833
Sample:
95% confidence level
Interval Sample size
+/- 10 96
+/- 8 150
+/- 6 263
+/- 4 583
+/- 2 2,153
www.nao.org.uk/publications/Samplingguide.pdf

Research
Interpretation
Patient: Will I survive this risky operation?
Surgeon: Yes, I'm absolutely sure that you will survive the operation.
Patient: How can you be so sure?
Surgeon: Well, 9 out of 10 patients die in this operation, and yesterday my ninth patient died.
(probability and statistical independence)

Research
Interpretation
A total of 4,000 cans of drink are opened around the world every second.
Ten babies are conceived around the world every second.
Therefore, each time you open a drink, you stand a 1 in 400 chance of becoming pregnant.
(Correlations)

Improving Information
Phyllis Mathews and Alma Belles
Wrexham Children’s Information Bureau

Childcare in Wales
David Dallimore
Director, Melyn Consulting

2006 2007Difference
06-07
Childminders 11,628 12,026 3.4%
Full Daycare 18,074 19,548 8.2%
Sessional Daycare 17,291 17,164 -0.7%
Out of School Care 18,852 18,172 -3.6%
Creche 1,345 1,187 -11.7%
All Childcare 69,196 70,104 1.3%
Childcare in Wales

Childcare in Wales
2006 2007Difference
06-07
Childminders 2,338 2,424 3.7%
Full Daycare 464 500 7.8%
Sessional Daycare 817 806 -1.3%
Out of School Care 560 556 -0.7%
Creche 77 66 -14.3%
All Settings 6,262 6,359 1.5%
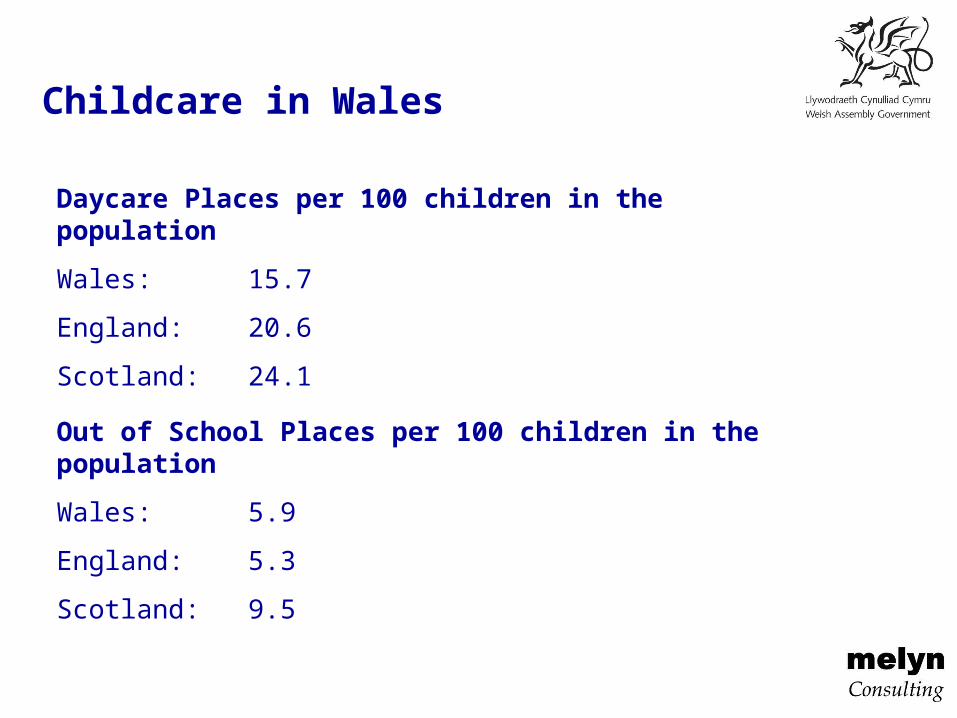
Childcare in Wales
Daycare Places per 100 children in the population
Wales: 15.7
England: 20.6
Scotland: 24.1
Out of School Places per 100 children in the population
Wales: 5.9
England: 5.3
Scotland: 9.5

0.0 5.0 10.0 15.0 20.0 25.0
Blaenau Gwent
Bridgend
Caerphilly
Cardiff
Carmarthenshire
Ceredigion
Conwy
Denbighshire
Flintshire
Gwynedd
Merthyr Tydfil
Monmouthshire
Neath Port Talbot
Newport
Pembrokeshire
Powys
Rhondda, Cynon, Taff
Swansea
Torfaen
Vale of Glamorgan
Wrexham
Ynys Mon
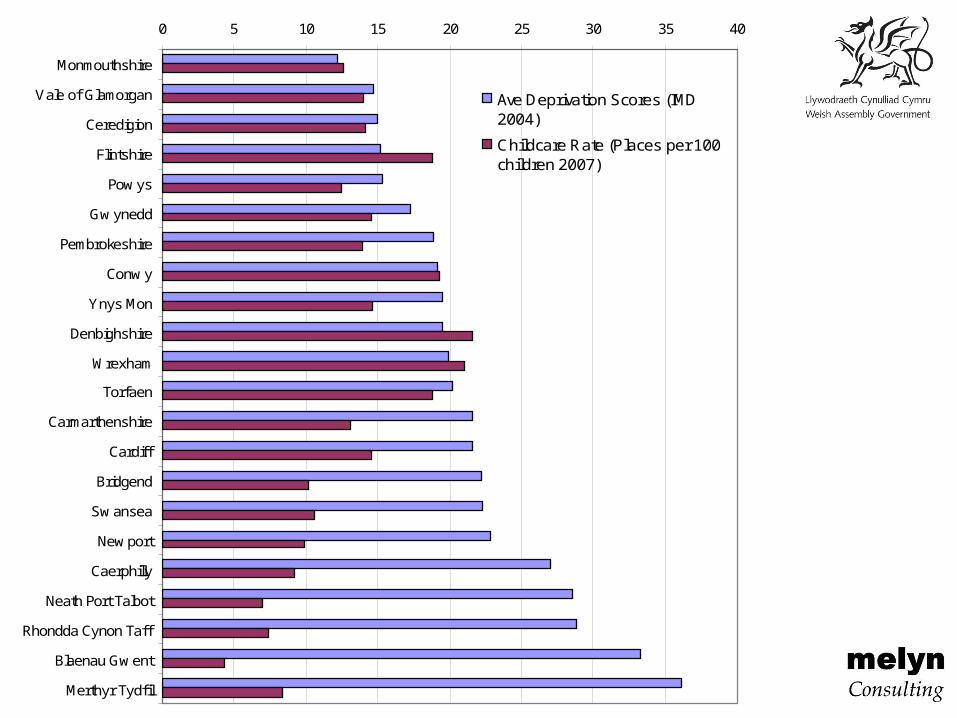
0 5 10 15 20 25 30 35 40
Monmouthshire
Vale of Glamorgan
Ceredigion
Flintshire
Powys
Gwynedd
Pembrokeshire
Conwy
Ynys Mon
Denbighshire
Wrexham
Torfaen
Carmarthenshire
Cardiff
Bridgend
Swansea
Newport
Caerphilly
Neath Port Talbot
Rhondda Cynon Taff
Blaenau Gwent
Merthyr Tydfil
Ave Deprivation Scores (IMD2004)
Childcare Rate (Places per 100children 2007)

Case Study: Glynneath
Local Context:
Children = 16.8% of population (17.7%)
Population Trend = -6.6% (-1.6%)
Welsh Language = 15% (12%)
Children in LP families = 25% (26%)
Workless families = 26% (26%)
High income families = 14% (13%)
Working women = 41% (45%)
Deprivation Index = 10 out of 19
LOW DEMAND
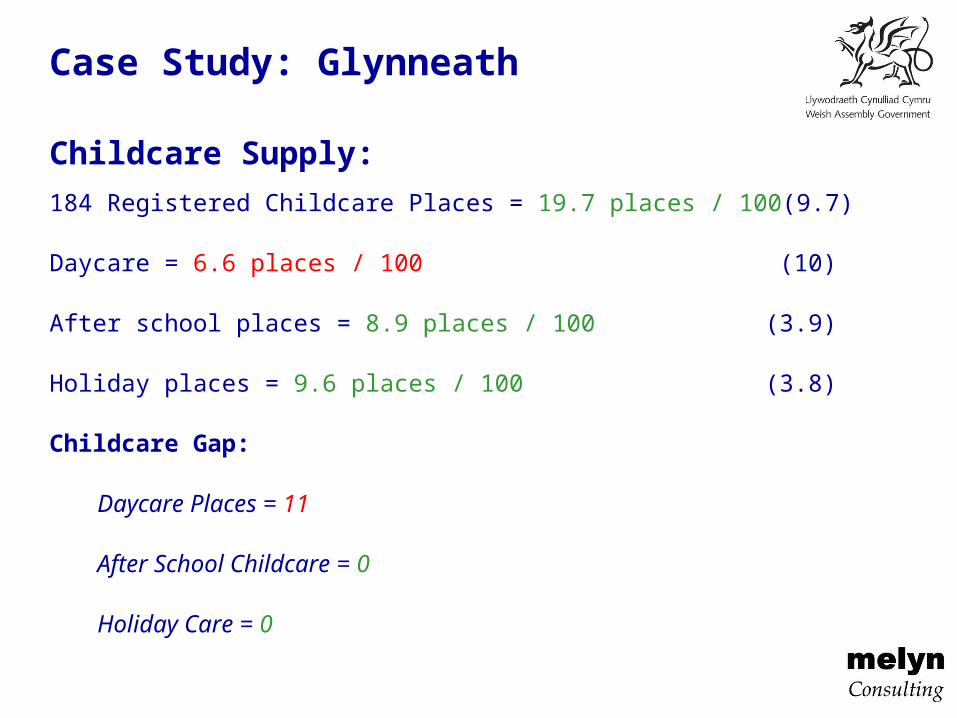
Case Study: Glynneath
Childcare Supply:
184 Registered Childcare Places = 19.7 places / 100 (9.7)
Daycare = 6.6 places / 100 (10)
After school places = 8.9 places / 100 (3.9)
Holiday places = 9.6 places / 100 (3.8)
Childcare Gap:
Daycare Places = 11
After School Childcare = 0
Holiday Care = 0

Case Study: Glynneath
Childcare Demand:
Vacant Places = 37% (17%)
Providers reporting increased demand = 33% (30%)
Providers reporting decreasing demand = 0% (0%)

Case Study: Glynneath
Parental Demand:Agree Disagree
Satisfaction with current childcare 85% 15%
Good choice of childcare 47% 53%
Quality of childcare is high 78% 22%
Available where I need it 63% 37%
Available when I need it 65% 35%
Affordable to me 58% 42%
Meets my child’s specific needs 69% 31%
Language choice 71% 29%

Case Study: Glynneath
Parental Demand:
"I'd say childcare is adequate in this area"
"The local creche [day nursery] do have Welsh speaking staff, which is good because I was looking for somewhere bilingual".
"There is at least one childminder in the area, but she's usually full. It would be good if there were more childminders".
"There aren’t many childminders here".
"There is a breakfast club and after school club at the local primary school, but no holiday club. The Council run a holiday club at the lesiure centre in town which a lot of parents use".
"I didn't think there was a good level of choice. The local day nursery didn't take under 2's when I was looking.”
Case Study: Glynneath
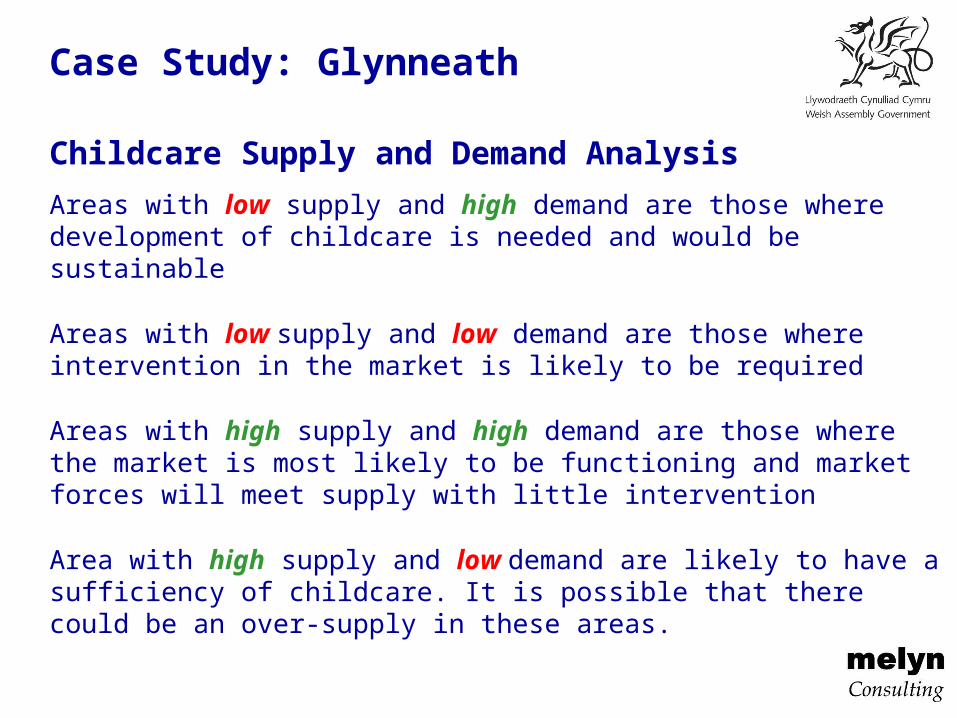
Childcare Supply and Demand Analysis
Areas with low supply and high demand are those where development of childcare is needed and would be sustainable
Areas with low supply and low demand are those where intervention in the market is likely to be required
Areas with high supply and high demand are those where the market is most likely to be functioning and market forces will meet supply with little intervention
Area with high supply and low demand are likely to have a sufficiency of childcare. It is possible that there could be an over-supply in these areas.


