16
Entering Foreign Markets in the Software Industry - The BECH Index 2013 Whitepaper from TBK Consult Author Hans Peter Bech, M.Sc. (econ)
| Date post: | 23-Mar-2016 |
| Category: |
Documents |
| Upload: | tbk-consult |
| View: | 218 times |
| Download: | 1 times |
Entering Foreign Markets in the Software Industry - The BECH Index 2013
Whitepaper from TBK Consult
AuthorHans Peter Bech, M.Sc. (econ)

© Hans Peter Bech 2014
First edition
Unless otherwise indicated, Hans Peter Bech copyrights all materials on these pages. All rights reserved. No part of these pages, either text or images may be used for any purpose other than personal use. Therefore, reproduction, modification, storage in a retrieval system or retransmission, in any form or by any means, electronic, mechanical or otherwise, for reasons other than personal use, is strictly prohibited without prior written permission.The Business Model Canvas Framework is made available by Business Model Foundry GmbH, Kalkbreitestrasse 71, CH-8003 Zürich, SwitzerlandThe copyright of other frameworks and information sources mentioned on this whitepaper belong to the proprietor.
Published by TBK Publishing® (a division of TBK Consult Holding ApS)Denmark
CVR: DK31935741www.tbkpublishing.com
ISBN: 978-87-93116-12-2TBK-WIPA-021
3
Entering Foreign Markets in the Software Industry - The BECH Index 2013w
ww
.tb
kco
nsu
lt.c
om
Table of contents:
Target audience 4
Abstract 4
Author 4
Acknowledgements 4
Grow fast or die slow 5
How? 5
Where? 6
Table 1: The BECH Index for the major markets 2011-13 7
Table 2: The BECH Index for the Americas 2011-13 8
Table 3: The BECH Index for The European Union 2011-13 9
Table 4: The BECH Index for The Rest of Europe 2011-13 10
Table 5: The BECH Index for The Middle East 2011-13 11
Table 6: The BECH Index for Africa 2011-13 11
Table 7: The BECH Index for Asia Pacific 2011-13 13
About the author 16
4
Entering Foreign Markets in the Software Industry - The BECH Index 2013w
ww
.tb
kco
nsu
lt.c
om
The target audience for this whitepaper is the board of directors, the CEO and the sales and marketing executives of B2B software driven companies1 with ambitions for achieving global market leadership.
This whitepaper presents an estimation of the relative demand capacity for B2B software and software related services worldwide. This estimation is called “The BECH Index.”
TBK Consult calculates the BECH index annually based on data published by The Central Intelligence Agency (CIA).
The CIA2 is an independent agency responsible for providing national security intelligence to senior US policymakers.
The CIA is separated into four basic components:
x the National Clandestine Service x the Directorate of Intelligence x the Directorate of Science & Technology x the Directorate of Support
They carry out “the intelligence cycle,” the process of collecting, analyzing, and disseminating intelligence information to top US government offcials.
Hans Peter Bech, M.Sc. (econ.)
Design and lay-out: Sordako Oü, Tallinn, Estonia,www.kompot.ee
Proof reading: Emma Crabtree, [email protected]
1 Independent Software Vendors (ISVs)
2 Source: https://www.cia.gov/about-cia/todays-cia/index.html
Targeted audience
Abstract
Author
Acknowledgements
5
Entering Foreign Markets in the Software Industry - The BECH Index 2013w
ww
.tb
kco
nsu
lt.c
om
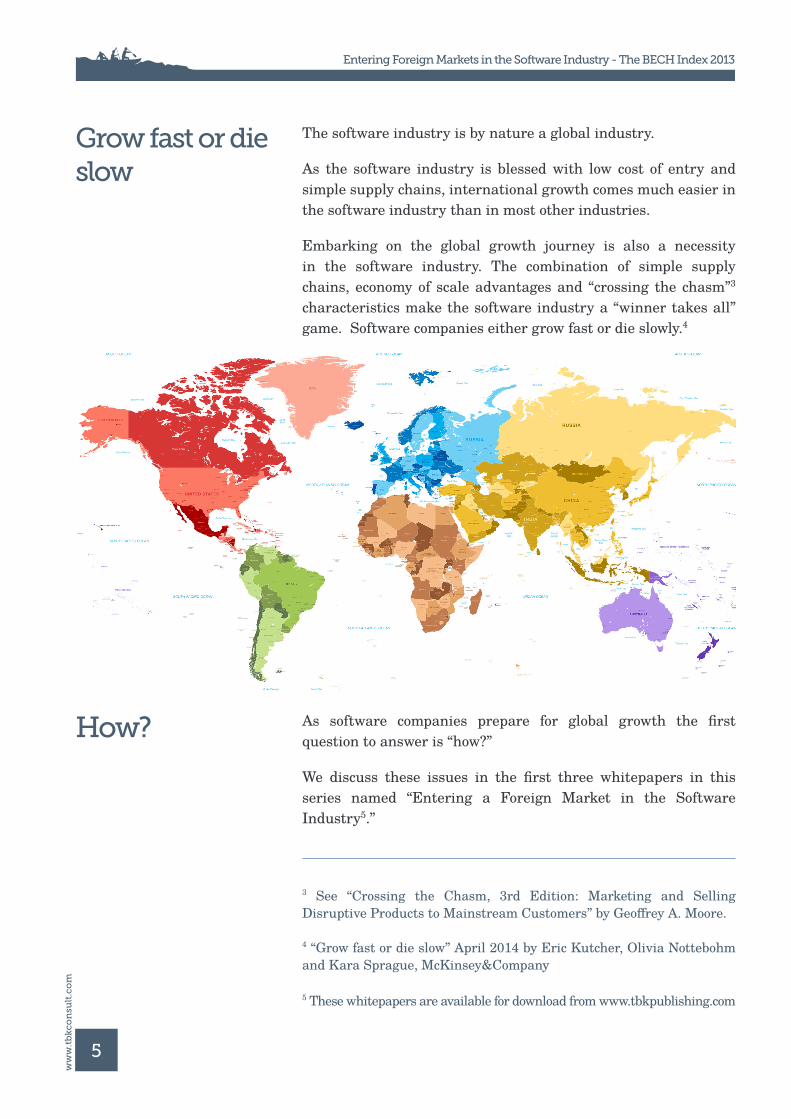
The software industry is by nature a global industry.
As the software industry is blessed with low cost of entry and simple supply chains, international growth comes much easier in the software industry than in most other industries.
Embarking on the global growth journey is also a necessity in the software industry. The combination of simple supply chains, economy of scale advantages and “crossing the chasm”3
characteristics make the software industry a “winner takes all” game. Software companies either grow fast or die slowly.4
As software companies prepare for global growth the first question to answer is “how?”
We discuss these issues in the first three whitepapers in this series named “Entering a Foreign Market in the Software Industry5.”
3 See “Crossing the Chasm, 3rd Edition: Marketing and Selling Disruptive Products to Mainstream Customers” by Geoffrey A. Moore.
4 “Grow fast or die slow” April 2014 by Eric Kutcher, Olivia Nottebohm and Kara Sprague, McKinsey&Company
5 These whitepapers are available for download from www.tbkpublishing.com
Grow fast or die slow
How?
6
Entering Foreign Markets in the Software Industry - The BECH Index 2013w
ww
.tb
kco
nsu
lt.c
om
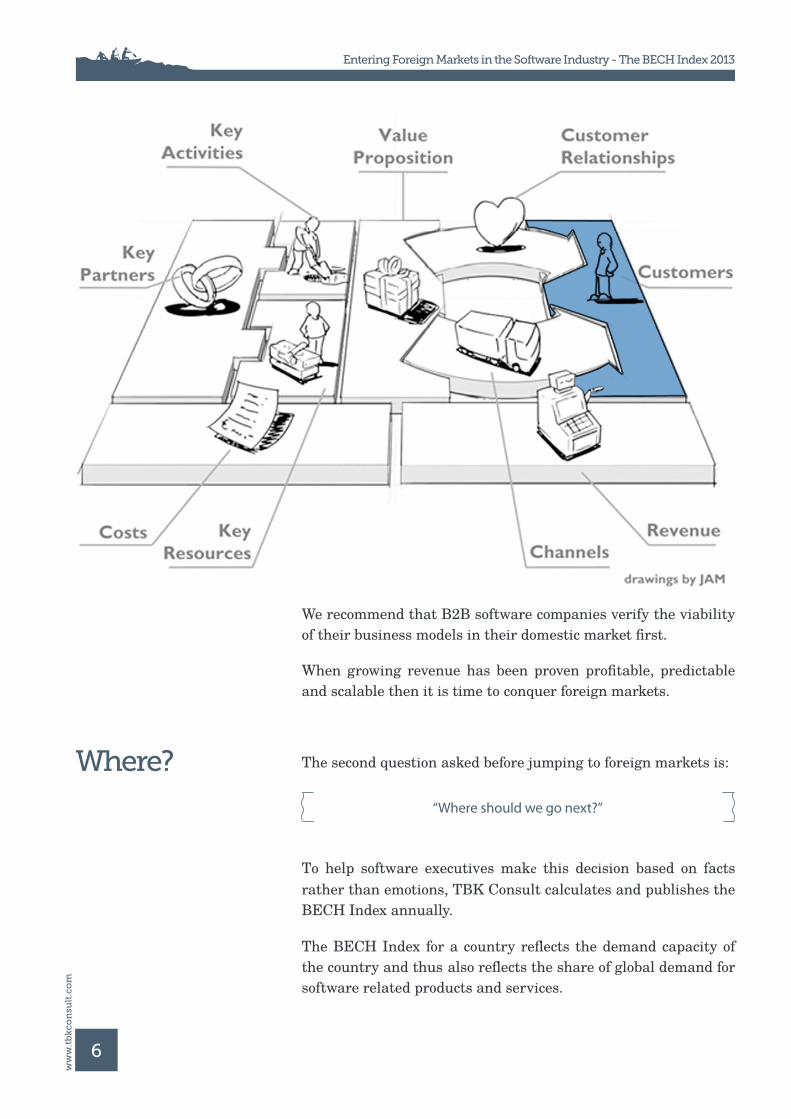
We recommend that B2B software companies verify the viability of their business models in their domestic market first.
When growing revenue has been proven profitable, predictable and scalable then it is time to conquer foreign markets.
The second question asked before jumping to foreign markets is:
To help software executives make this decision based on facts rather than emotions, TBK Consult calculates and publishes the BECH Index annually.
The BECH Index for a country reflects the demand capacity of the country and thus also reflects the share of global demand for software related products and services.
Where?
“Where should we go next?”
7
Entering Foreign Markets in the Software Industry - The BECH Index 2013w
ww
.tb
kco
nsu
lt.c
om
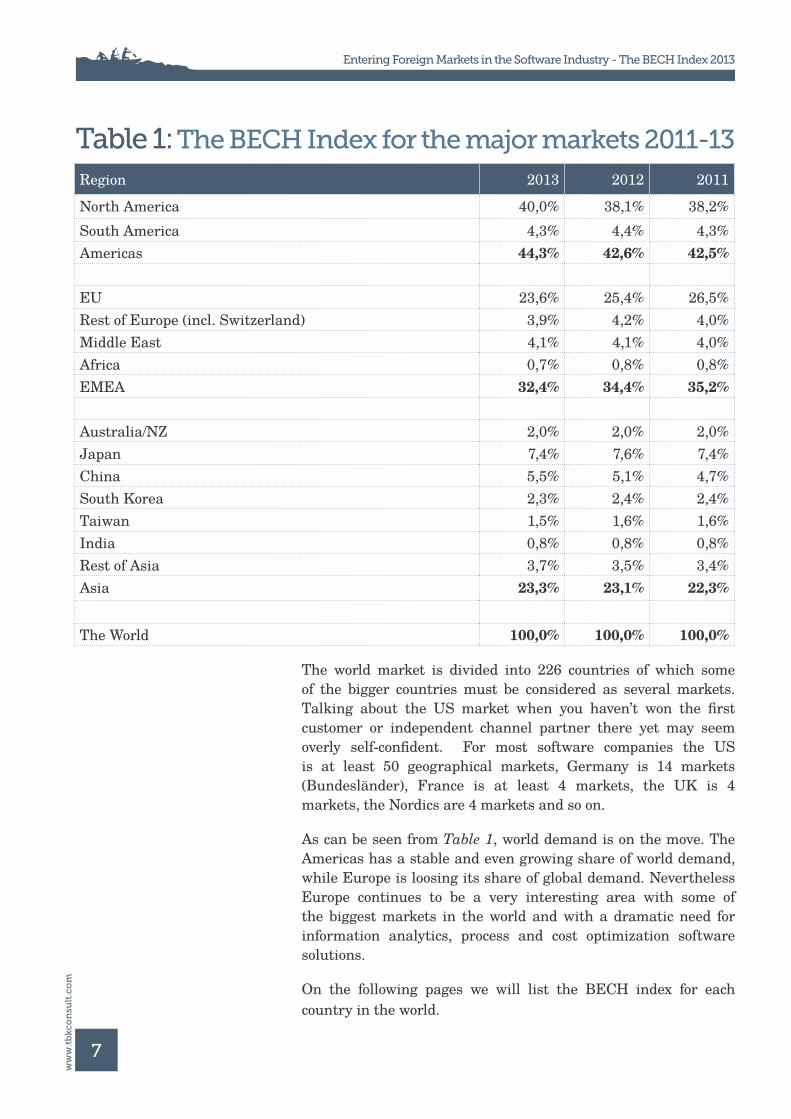
Region 2013 2012 2011
North America 40,0% 38,1% 38,2%South America 4,3% 4,4% 4,3%Americas 44,3% 42,6% 42,5%
EU 23,6% 25,4% 26,5%Rest of Europe (incl. Switzerland) 3,9% 4,2% 4,0%Middle East 4,1% 4,1% 4,0%Africa 0,7% 0,8% 0,8%EMEA 32,4% 34,4% 35,2%
Australia/NZ 2,0% 2,0% 2,0%Japan 7,4% 7,6% 7,4%China 5,5% 5,1% 4,7%South Korea 2,3% 2,4% 2,4%Taiwan 1,5% 1,6% 1,6%India 0,8% 0,8% 0,8%Rest of Asia 3,7% 3,5% 3,4%Asia 23,3% 23,1% 22,3%
The World 100,0% 100,0% 100,0%
Table 1: The BECH Index for the major markets 2011-13
The world market is divided into 226 countries of which some of the bigger countries must be considered as several markets. Talking about the US market when you haven’t won the first customer or independent channel partner there yet may seem overly self-confident. For most software companies the US is at least 50 geographical markets, Germany is 14 markets (Bundesländer), France is at least 4 markets, the UK is 4 markets, the Nordics are 4 markets and so on.
As can be seen from Table 1, world demand is on the move. The Americas has a stable and even growing share of world demand, while Europe is loosing its share of global demand. Nevertheless Europe continues to be a very interesting area with some of the biggest markets in the world and with a dramatic need for information analytics, process and cost optimization software solutions.
On the following pages we will list the BECH index for each country in the world.
8
Entering Foreign Markets in the Software Industry - The BECH Index 2013w
ww
.tb
kco
nsu
lt.c
om
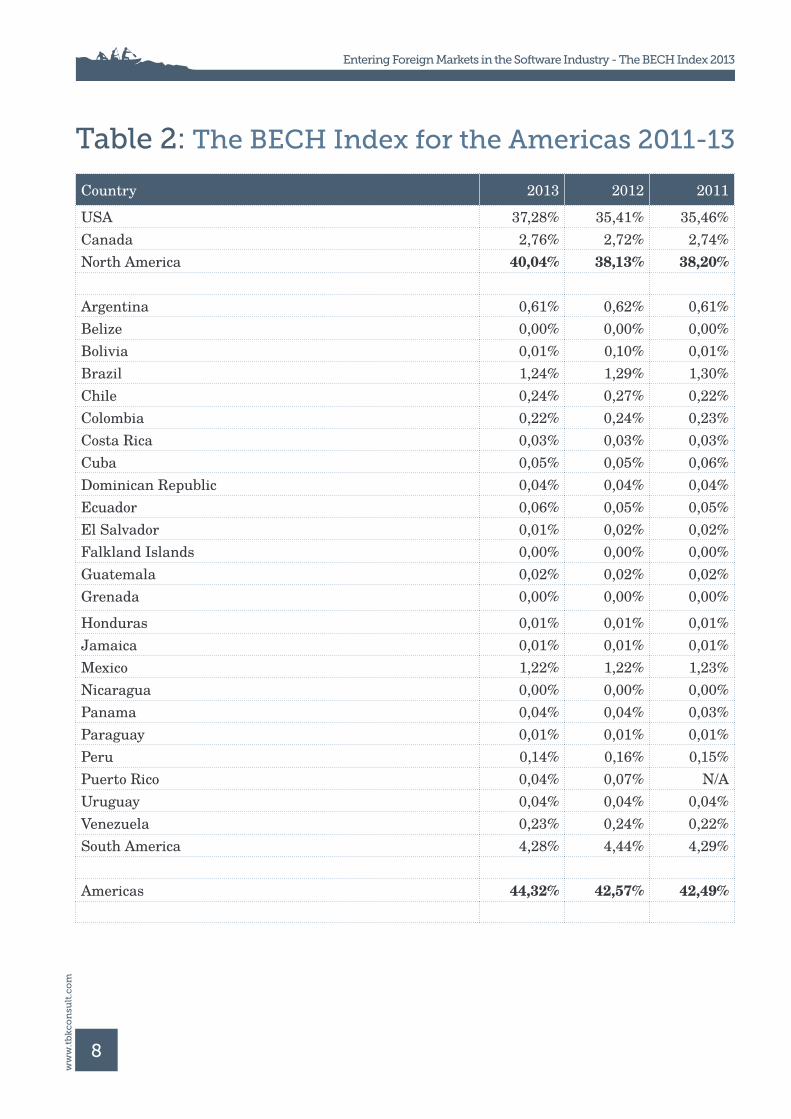
Country 2013 2012 2011
USA 37,28% 35,41% 35,46%Canada 2,76% 2,72% 2,74%North America 40,04% 38,13% 38,20%
Argentina 0,61% 0,62% 0,61%Belize 0,00% 0,00% 0,00%Bolivia 0,01% 0,10% 0,01%Brazil 1,24% 1,29% 1,30%Chile 0,24% 0,27% 0,22%Colombia 0,22% 0,24% 0,23%Costa Rica 0,03% 0,03% 0,03%Cuba 0,05% 0,05% 0,06%Dominican Republic 0,04% 0,04% 0,04%Ecuador 0,06% 0,05% 0,05%El Salvador 0,01% 0,02% 0,02%Falkland Islands 0,00% 0,00% 0,00%Guatemala 0,02% 0,02% 0,02%Grenada 0,00% 0,00% 0,00%Honduras 0,01% 0,01% 0,01%Jamaica 0,01% 0,01% 0,01%Mexico 1,22% 1,22% 1,23%Nicaragua 0,00% 0,00% 0,00%Panama 0,04% 0,04% 0,03%Paraguay 0,01% 0,01% 0,01%Peru 0,14% 0,16% 0,15%Puerto Rico 0,04% 0,07% N/AUruguay 0,04% 0,04% 0,04%Venezuela 0,23% 0,24% 0,22%South America 4,28% 4,44% 4,29%
Americas 44,32% 42,57% 42,49%
Table 2: The BECH Index for the Americas 2011-13
9
Entering Foreign Markets in the Software Industry - The BECH Index 2013w
ww
.tb
kco
nsu
lt.c
om
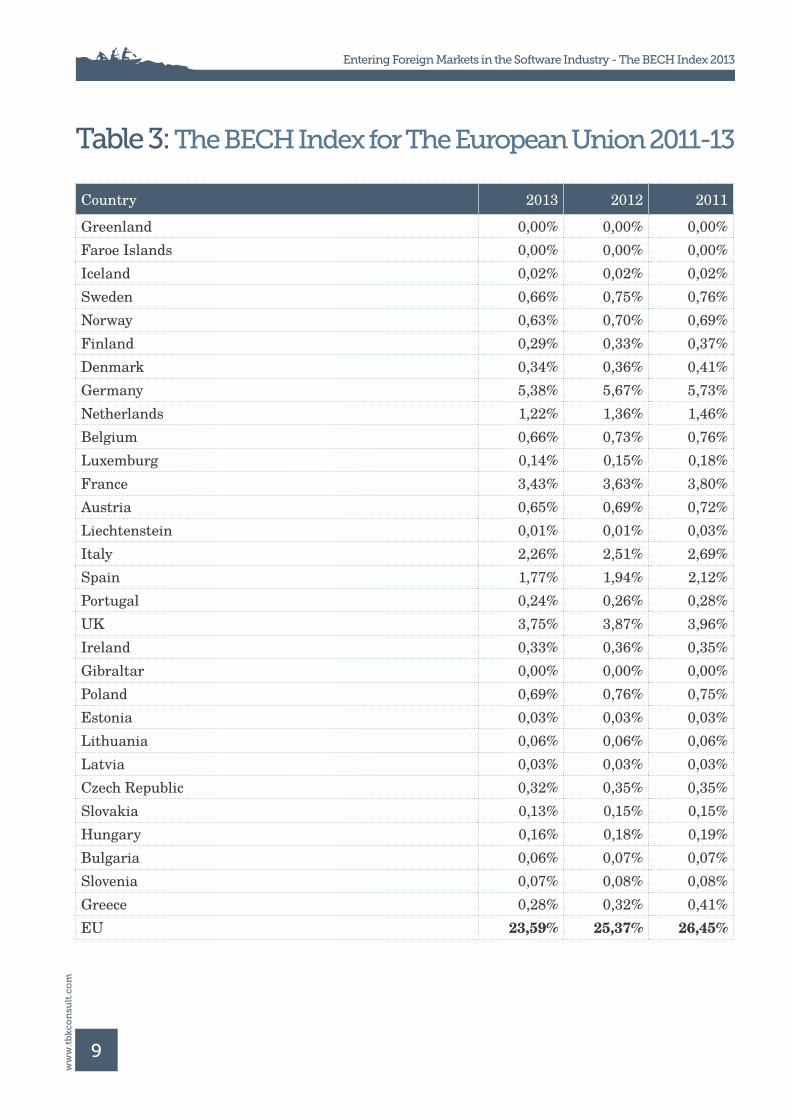
Country 2013 2012 2011
Greenland 0,00% 0,00% 0,00%Faroe Islands 0,00% 0,00% 0,00%Iceland 0,02% 0,02% 0,02%Sweden 0,66% 0,75% 0,76%Norway 0,63% 0,70% 0,69%Finland 0,29% 0,33% 0,37%Denmark 0,34% 0,36% 0,41%Germany 5,38% 5,67% 5,73%Netherlands 1,22% 1,36% 1,46%Belgium 0,66% 0,73% 0,76%Luxemburg 0,14% 0,15% 0,18%France 3,43% 3,63% 3,80%Austria 0,65% 0,69% 0,72%Liechtenstein 0,01% 0,01% 0,03%Italy 2,26% 2,51% 2,69%Spain 1,77% 1,94% 2,12%Portugal 0,24% 0,26% 0,28%UK 3,75% 3,87% 3,96%Ireland 0,33% 0,36% 0,35%Gibraltar 0,00% 0,00% 0,00%Poland 0,69% 0,76% 0,75%Estonia 0,03% 0,03% 0,03%Lithuania 0,06% 0,06% 0,06%Latvia 0,03% 0,03% 0,03%Czech Republic 0,32% 0,35% 0,35%Slovakia 0,13% 0,15% 0,15%Hungary 0,16% 0,18% 0,19%Bulgaria 0,06% 0,07% 0,07%Slovenia 0,07% 0,08% 0,08%Greece 0,28% 0,32% 0,41%EU 23,59% 25,37% 26,45%
Table 3: The BECH Index for The European Union 2011-13
10
Entering Foreign Markets in the Software Industry - The BECH Index 2013w
ww
.tb
kco
nsu
lt.c
om
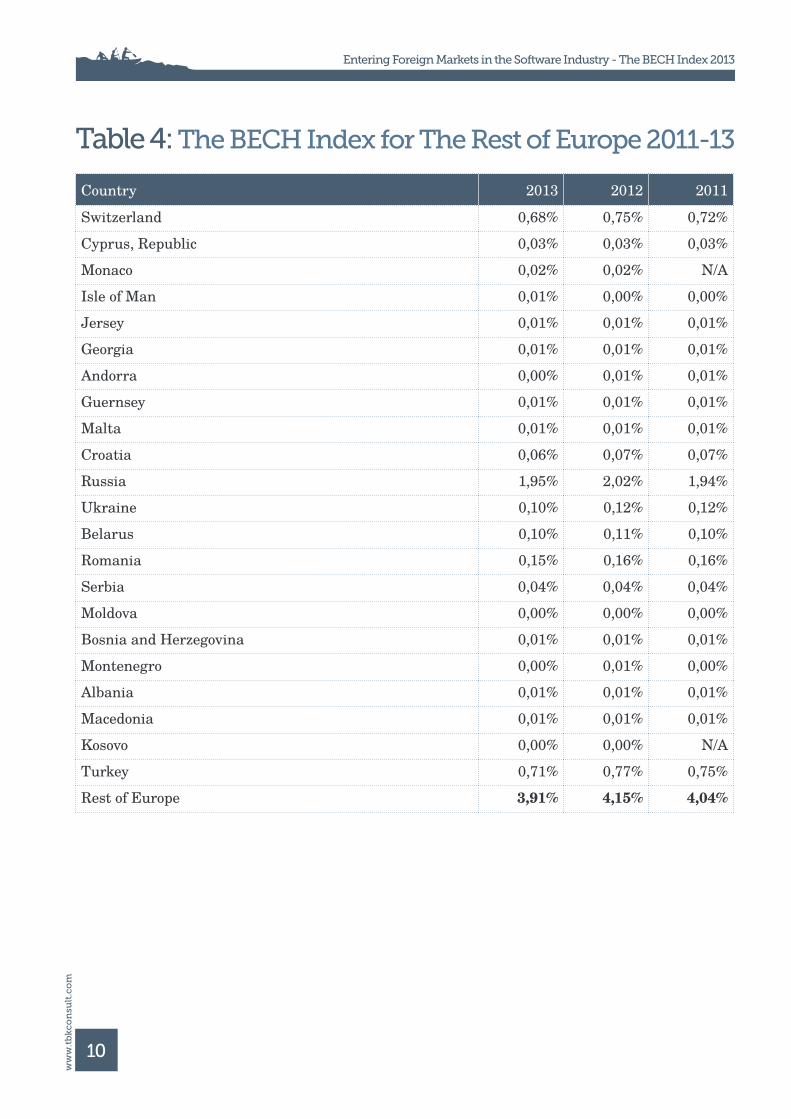
Country 2013 2012 2011
Switzerland 0,68% 0,75% 0,72%Cyprus, Republic 0,03% 0,03% 0,03%Monaco 0,02% 0,02% N/AIsle of Man 0,01% 0,00% 0,00%Jersey 0,01% 0,01% 0,01%Georgia 0,01% 0,01% 0,01%Andorra 0,00% 0,01% 0,01%Guernsey 0,01% 0,01% 0,01%Malta 0,01% 0,01% 0,01%Croatia 0,06% 0,07% 0,07%Russia 1,95% 2,02% 1,94%Ukraine 0,10% 0,12% 0,12%Belarus 0,10% 0,11% 0,10%Romania 0,15% 0,16% 0,16%Serbia 0,04% 0,04% 0,04%Moldova 0,00% 0,00% 0,00%Bosnia and Herzegovina 0,01% 0,01% 0,01%Montenegro 0,00% 0,01% 0,00%Albania 0,01% 0,01% 0,01%Macedonia 0,01% 0,01% 0,01%Kosovo 0,00% 0,00% N/ATurkey 0,71% 0,77% 0,75%Rest of Europe 3,91% 4,15% 4,04%
Table 4: The BECH Index for The Rest of Europe 2011-13
11
Entering Foreign Markets in the Software Industry - The BECH Index 2013w
ww
.tb
kco
nsu
lt.c
om
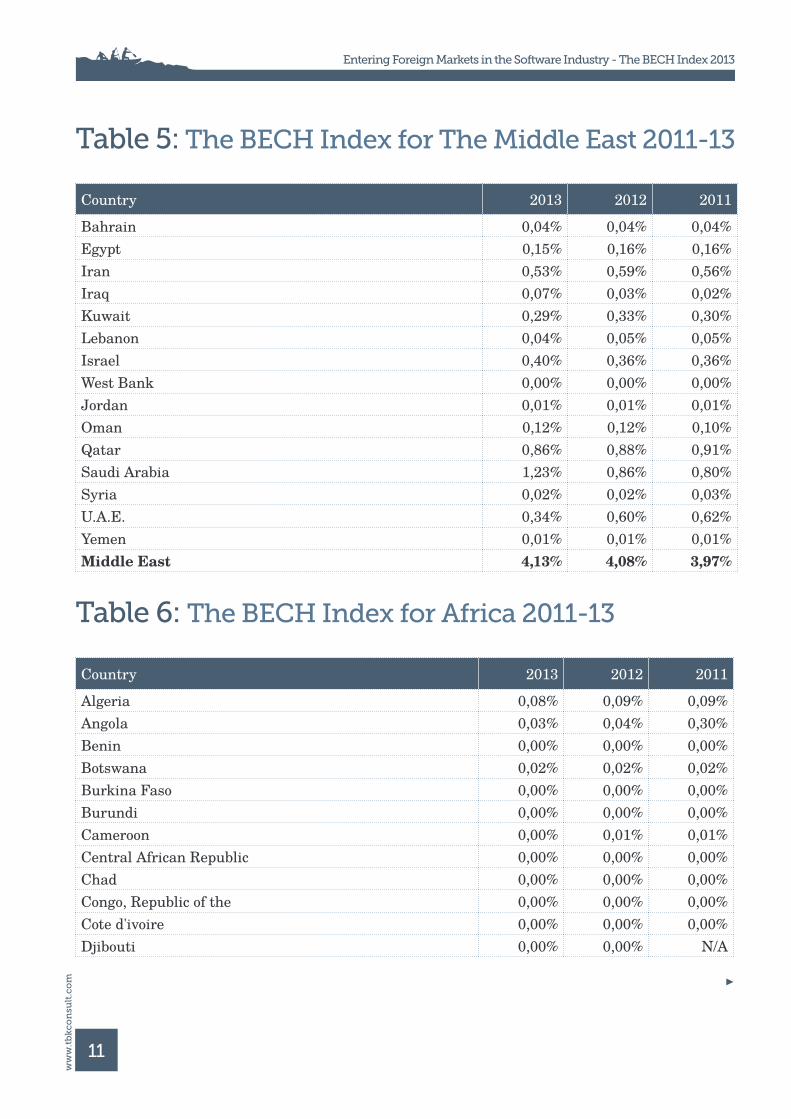
Country 2013 2012 2011
Bahrain 0,04% 0,04% 0,04%Egypt 0,15% 0,16% 0,16%Iran 0,53% 0,59% 0,56%Iraq 0,07% 0,03% 0,02%Kuwait 0,29% 0,33% 0,30%Lebanon 0,04% 0,05% 0,05%Israel 0,40% 0,36% 0,36%West Bank 0,00% 0,00% 0,00%Jordan 0,01% 0,01% 0,01%Oman 0,12% 0,12% 0,10%Qatar 0,86% 0,88% 0,91%Saudi Arabia 1,23% 0,86% 0,80%Syria 0,02% 0,02% 0,03%U.A.E. 0,34% 0,60% 0,62%Yemen 0,01% 0,01% 0,01%Middle East 4,13% 4,08% 3,97%
Table 5: The BECH Index for The Middle East 2011-13
Table 6: The BECH Index for Africa 2011-13
Country 2013 2012 2011
Algeria 0,08% 0,09% 0,09%Angola 0,03% 0,04% 0,30%Benin 0,00% 0,00% 0,00%Botswana 0,02% 0,02% 0,02%Burkina Faso 0,00% 0,00% 0,00%Burundi 0,00% 0,00% 0,00%Cameroon 0,00% 0,01% 0,01%Central African Republic 0,00% 0,00% 0,00%Chad 0,00% 0,00% 0,00%Congo, Republic of the 0,00% 0,00% 0,00%Cote d'ivoire 0,00% 0,00% 0,00%Djibouti 0,00% 0,00% N/A
12
Entering Foreign Markets in the Software Industry - The BECH Index 2013w
ww
.tb
kco
nsu
lt.c
om
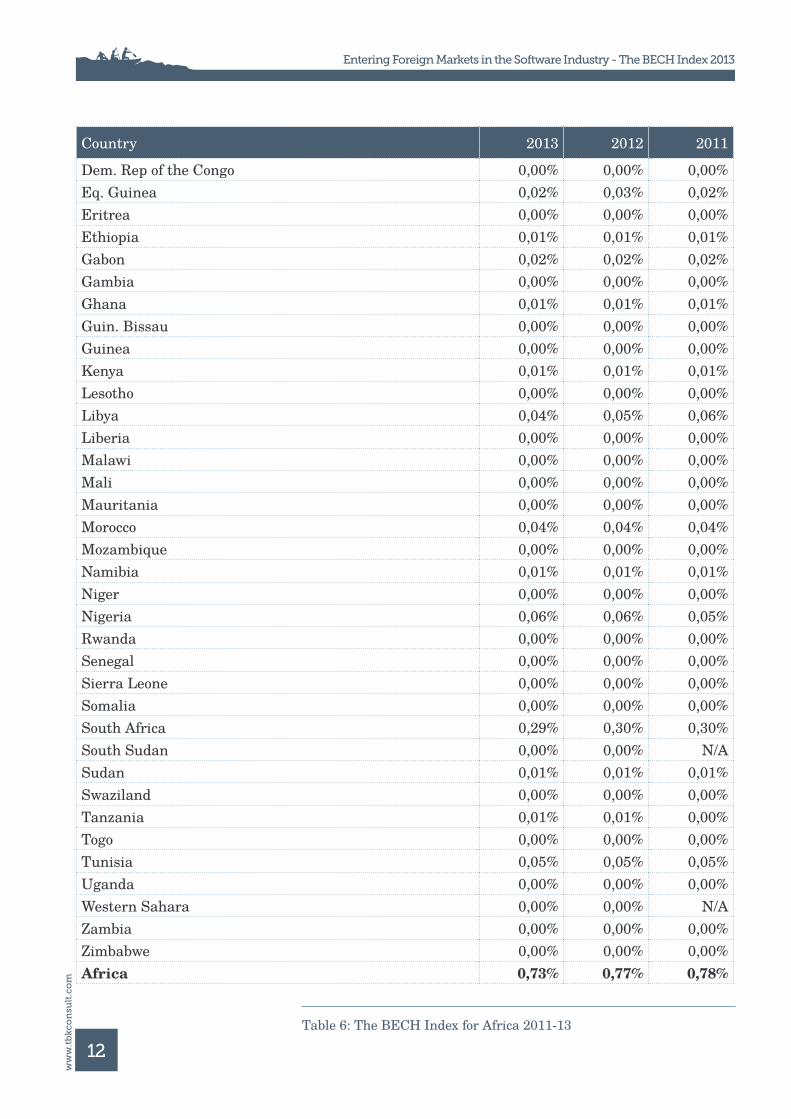
Country 2013 2012 2011
Dem. Rep of the Congo 0,00% 0,00% 0,00%Eq. Guinea 0,02% 0,03% 0,02%Eritrea 0,00% 0,00% 0,00%Ethiopia 0,01% 0,01% 0,01%Gabon 0,02% 0,02% 0,02%Gambia 0,00% 0,00% 0,00%Ghana 0,01% 0,01% 0,01%Guin. Bissau 0,00% 0,00% 0,00%Guinea 0,00% 0,00% 0,00%Kenya 0,01% 0,01% 0,01%Lesotho 0,00% 0,00% 0,00%Libya 0,04% 0,05% 0,06%Liberia 0,00% 0,00% 0,00%Malawi 0,00% 0,00% 0,00%Mali 0,00% 0,00% 0,00%Mauritania 0,00% 0,00% 0,00%Morocco 0,04% 0,04% 0,04%Mozambique 0,00% 0,00% 0,00%Namibia 0,01% 0,01% 0,01%Niger 0,00% 0,00% 0,00%Nigeria 0,06% 0,06% 0,05%Rwanda 0,00% 0,00% 0,00%Senegal 0,00% 0,00% 0,00%Sierra Leone 0,00% 0,00% 0,00%Somalia 0,00% 0,00% 0,00%South Africa 0,29% 0,30% 0,30%South Sudan 0,00% 0,00% N/ASudan 0,01% 0,01% 0,01%Swaziland 0,00% 0,00% 0,00%Tanzania 0,01% 0,01% 0,00%Togo 0,00% 0,00% 0,00%Tunisia 0,05% 0,05% 0,05%Uganda 0,00% 0,00% 0,00%Western Sahara 0,00% 0,00% N/AZambia 0,00% 0,00% 0,00%Zimbabwe 0,00% 0,00% 0,00%Africa 0,73% 0,77% 0,78%
Table 6: The BECH Index for Africa 2011-13
13
Entering Foreign Markets in the Software Industry - The BECH Index 2013w
ww
.tb
kco
nsu
lt.c
om
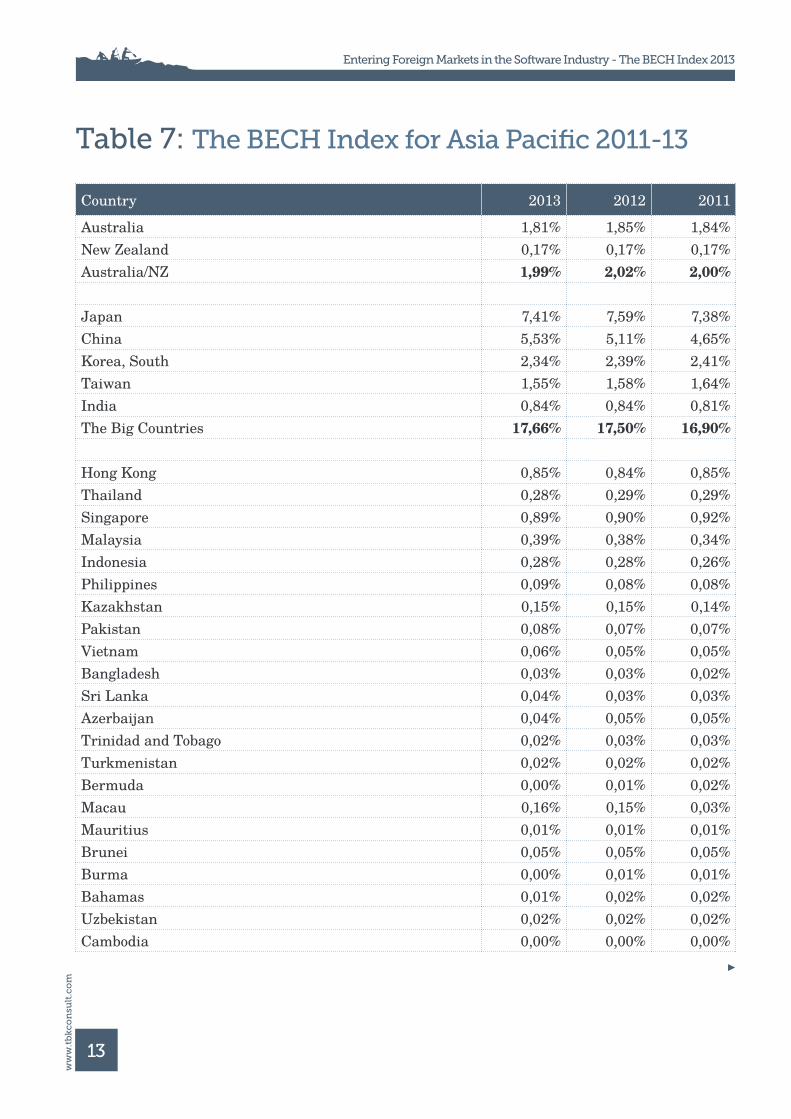
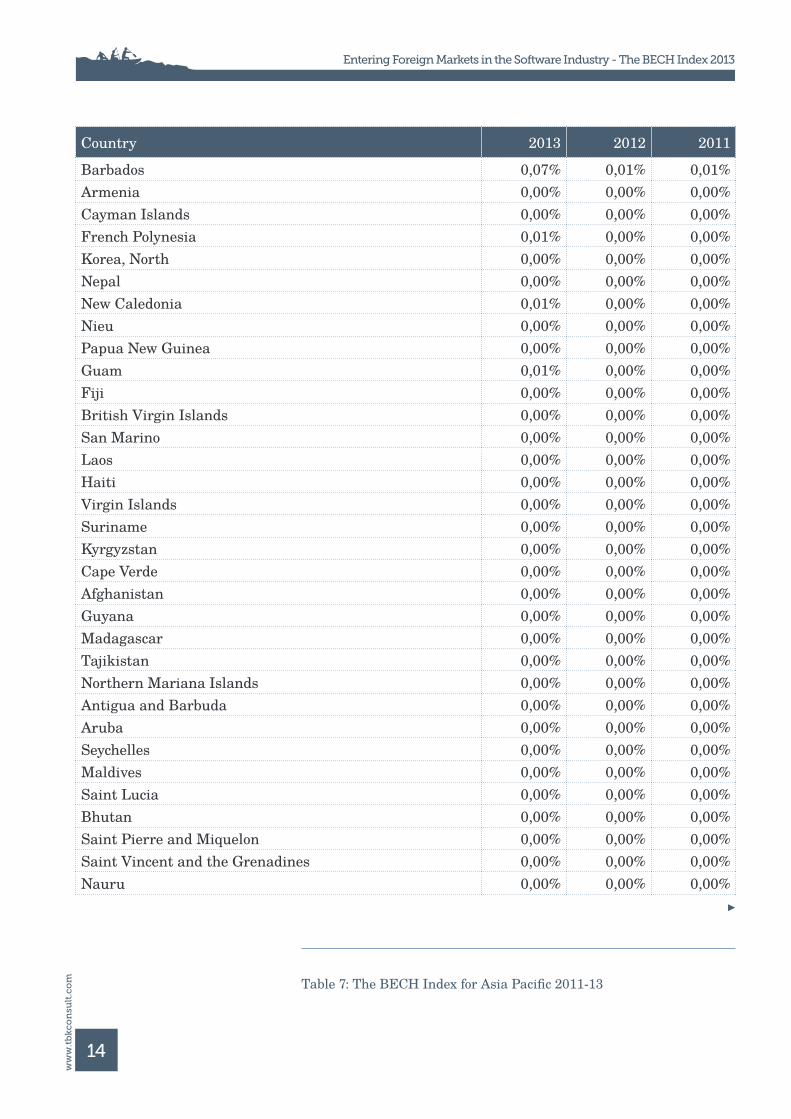
Table 7: The BECH Index for Asia Pacific 2011-13
Country 2013 2012 2011
Australia 1,81% 1,85% 1,84%New Zealand 0,17% 0,17% 0,17%Australia/NZ 1,99% 2,02% 2,00%
Japan 7,41% 7,59% 7,38%China 5,53% 5,11% 4,65%Korea, South 2,34% 2,39% 2,41%Taiwan 1,55% 1,58% 1,64%India 0,84% 0,84% 0,81%The Big Countries 17,66% 17,50% 16,90%
Hong Kong 0,85% 0,84% 0,85%Thailand 0,28% 0,29% 0,29%Singapore 0,89% 0,90% 0,92%Malaysia 0,39% 0,38% 0,34%Indonesia 0,28% 0,28% 0,26%Philippines 0,09% 0,08% 0,08%Kazakhstan 0,15% 0,15% 0,14%Pakistan 0,08% 0,07% 0,07%Vietnam 0,06% 0,05% 0,05%Bangladesh 0,03% 0,03% 0,02%Sri Lanka 0,04% 0,03% 0,03%Azerbaijan 0,04% 0,05% 0,05%Trinidad and Tobago 0,02% 0,03% 0,03%Turkmenistan 0,02% 0,02% 0,02%Bermuda 0,00% 0,01% 0,02%Macau 0,16% 0,15% 0,03%Mauritius 0,01% 0,01% 0,01%Brunei 0,05% 0,05% 0,05%Burma 0,00% 0,01% 0,01%Bahamas 0,01% 0,02% 0,02%Uzbekistan 0,02% 0,02% 0,02%Cambodia 0,00% 0,00% 0,00%
14
Entering Foreign Markets in the Software Industry - The BECH Index 2013w
ww
.tb
kco
nsu
lt.c
om
Country 2013 2012 2011
Barbados 0,07% 0,01% 0,01%Armenia 0,00% 0,00% 0,00%Cayman Islands 0,00% 0,00% 0,00%French Polynesia 0,01% 0,00% 0,00%Korea, North 0,00% 0,00% 0,00%Nepal 0,00% 0,00% 0,00%New Caledonia 0,01% 0,00% 0,00%Nieu 0,00% 0,00% 0,00%Papua New Guinea 0,00% 0,00% 0,00%Guam 0,01% 0,00% 0,00%Fiji 0,00% 0,00% 0,00%British Virgin Islands 0,00% 0,00% 0,00%San Marino 0,00% 0,00% 0,00%Laos 0,00% 0,00% 0,00%Haiti 0,00% 0,00% 0,00%Virgin Islands 0,00% 0,00% 0,00%Suriname 0,00% 0,00% 0,00%Kyrgyzstan 0,00% 0,00% 0,00%Cape Verde 0,00% 0,00% 0,00%Afghanistan 0,00% 0,00% 0,00%Guyana 0,00% 0,00% 0,00%Madagascar 0,00% 0,00% 0,00%Tajikistan 0,00% 0,00% 0,00%Northern Mariana Islands 0,00% 0,00% 0,00%Antigua and Barbuda 0,00% 0,00% 0,00%Aruba 0,00% 0,00% 0,00%Seychelles 0,00% 0,00% 0,00%Maldives 0,00% 0,00% 0,00%Saint Lucia 0,00% 0,00% 0,00%Bhutan 0,00% 0,00% 0,00%Saint Pierre and Miquelon 0,00% 0,00% 0,00%Saint Vincent and the Grenadines 0,00% 0,00% 0,00%Nauru 0,00% 0,00% 0,00%
Table 7: The BECH Index for Asia Pacific 2011-13
15
Entering Foreign Markets in the Software Industry - The BECH Index 2013w
ww
.tb
kco
nsu
lt.c
om
Country 2013 2012 2011
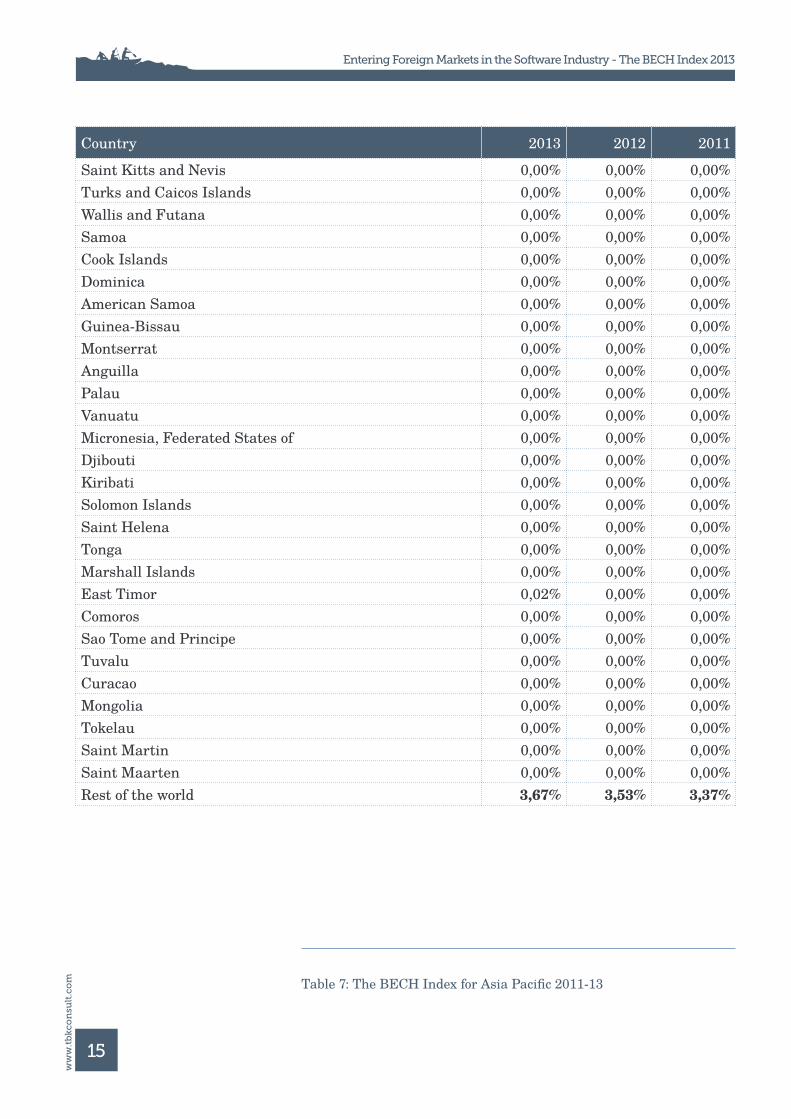
Saint Kitts and Nevis 0,00% 0,00% 0,00%Turks and Caicos Islands 0,00% 0,00% 0,00%Wallis and Futana 0,00% 0,00% 0,00%Samoa 0,00% 0,00% 0,00%Cook Islands 0,00% 0,00% 0,00%Dominica 0,00% 0,00% 0,00%American Samoa 0,00% 0,00% 0,00%Guinea-Bissau 0,00% 0,00% 0,00%Montserrat 0,00% 0,00% 0,00%Anguilla 0,00% 0,00% 0,00%Palau 0,00% 0,00% 0,00%Vanuatu 0,00% 0,00% 0,00%Micronesia, Federated States of 0,00% 0,00% 0,00%Djibouti 0,00% 0,00% 0,00%Kiribati 0,00% 0,00% 0,00%Solomon Islands 0,00% 0,00% 0,00%Saint Helena 0,00% 0,00% 0,00%Tonga 0,00% 0,00% 0,00%Marshall Islands 0,00% 0,00% 0,00%East Timor 0,02% 0,00% 0,00%Comoros 0,00% 0,00% 0,00%Sao Tome and Principe 0,00% 0,00% 0,00%Tuvalu 0,00% 0,00% 0,00%Curacao 0,00% 0,00% 0,00%Mongolia 0,00% 0,00% 0,00%Tokelau 0,00% 0,00% 0,00%Saint Martin 0,00% 0,00% 0,00%Saint Maarten 0,00% 0,00% 0,00%Rest of the world 3,67% 3,53% 3,37%
Table 7: The BECH Index for Asia Pacific 2011-13

16
Entering Foreign Markets in the Software Industry - The BECH Index 2013w
ww
.tb
kco
nsu
lt.c
om
About the authorHans Peter Bech has been engaged with international sales and marketing operations in the software industry for more than 30 years.
Hans Peter was instrumental in building the international business platforms for companies such as Dataco (now Intel), Mercante, Dansk Data Elektronik (now CSC), RE Technology (now Barco), and Damgaard/Navision (now Microsoft).
As a management consultant Hans Peter has been providing consulting on internationalization to companies such as Microsoft, Danfoss, Proekspert, Jeeves Information Systems, eMailSignature, SoftScan (now Symatec), Netop, EG A/S, CSC Scandihealth and Secunia.
Hans Peter is an advisor to IMMIB, the Turkish ICT Exporters Association. He also lectures in internationalization at the Sabanci University in Istanbul, Turkey.
Hans Peter is the author of several whitepapers on internationalization in the software industry and he frequently writes articles on the subject.
He started his career as a management consultant in 2003 and founded TBK Consult in 2007. Since then he has built the company to its present position with 25 senior consultants in 16 countries.
Hans Peter oversees the development of TBK Consult as well as performs management consulting assignments for selected clients.
Hans Peter holds a M.Sc. in macroeconomics and political science from the University of Copenhagen. He speaks Danish, English and German and is a certified ValuePerform, ValuePartner and Business Model Generation consultant.
More about Hans Peter Bech
TBK-WIPA-021


