Page 1
©CSIRO 2016 ©CSIRO 2016Environ. Chem. 2016, 13, 21-33 doi:10.1071/EN14229_AC
Page 1 of 30
Supplementary material
Environmental effects on arsenosugars and arsenolipids in Ectocarpus (Phaeophyta)
Ásta H. Pétursdóttir,A,B,C,D
Kyle Fletcher,B Helga Gunnlaugsdóttir,
C Eva Krupp,
A Frithjof C. Küpper
B
and Jörg FeldmannA,D
ATESLA – Trace Element Speciation Laboratory, Department of Chemistry, University of Aberdeen,
Aberdeen, AB24 3UE, Scotland, UK.
BOceanlab, University of Aberdeen, Newburgh, AB41 6AA, UK.
CMatis, Food Safety, Environment and Genetics Department, Vinlandsleid 12,
IS-113 Reykjavik, Iceland.
DCorresponding authors. Email: [email protected] ; [email protected]
Instrumental parameters
Table S1. Instrumental parameters for ICP-MS and ESIMS
Column Agilent Eclipse, XBD-C18; 4.8 mm × 150 mm
Column temperature 30 °C
Injection volume 85 µL
Buffer A 0.1 % formic acid (methanoic acid) in water
Buffer B 0.1 % formic acid in methanol Splitter ratio 1 : 3
Flow rate 1 mL min–1
Gradient 0–25 min: 5–100 % B
25 min 100 % B
ICP-MS Agilent 8800
Mode Organic mode
RF power 1600 W
Nebuliser gas 0.84 L min–1
Optional gas 6 %
ESIMS LTQ Orbitrap Discovery; Thermo Scientific
Mode Positive
Spray voltage 4.5 kV
Page 2
Environ. Chem. 2016 ©CSIRO 2016 ©CSIRO 2016
doi:10.1071/EN14229_AC
Page 2 of 30
Growth of cultures
a) b)
c)
Fig. S1. (a) Hincksia sp. from Reykjavík, Iceland; (b) Ectocarpus sp. from Cruden Bay, UK; (c) Pylaiella
littoralis, Reykjavik, Iceland.
a) b)
c) d)
Fig. S2. (a) Ectocarpus 022-10 (St3) in cultures grown under different conditions: (a) control sample; (b)
H2O2 addition; (c) low nitrate; (d) low phosphate.
Page 3
Environ. Chem. 2016 ©CSIRO 2016 ©CSIRO 2016
doi:10.1071/EN14229_AC
Page 3 of 30
a) b)
Fig. S3. The visual difference for cultures grown as (a) control compared with (b) under oxidative stress.
Fig. S4. Phylogenetic tree of the three strains (algorithm used: Neighbour Joining phylogeny of the three
strains; assembled using MEGA6; Tamura et al.[1]).
Page 4
Environ. Chem. 2016 ©CSIRO 2016 ©CSIRO 2016
doi:10.1071/EN14229_AC
Page 4 of 30
Table S2. Percentage of senescence cells in the Ectocarpus cultures Senescence
(%) Observations
Oban-Ctrl 20–30 St1 Oban-N 50–60 Sporangia visible, enlarged round cells with unusual structure Oban-P 50–60 Irregular sporangia, unhealthy looking cells, enlarged circular cell Oban-H2O2 60 Senescent cell much more tightly packed around a layer of somatic cells 022–10-Ctrl 70–80 Sporangia visible St3 022–10-N 70 022–10-P 60 022–10-H2O2 80–90 022–10-Ctrl+ As 70–80 St3 + As 022–10-N + As 70 022–10-P + As 60–70 Some enlarged cells 022–10-H2O2 + As 80–90 007–04-Ctrl 40–50 Some sporangia visible, much healthier than N and P treatments St1 007–04-N 70 Unusual cells detected 007–04-P 55–60 007–04-H2O2 60
Page 5
Environ. Chem. 2016 ©CSIRO 2016 ©CSIRO 2016
doi:10.1071/EN14229_AC
Page 5 of 30
Total arsenic concentration in the Ectocarpus
Table S3. Mass balance for field-collected Ectocarpales
All concentrations are given in milligrams per kilogram. The MeOH/DCM fraction evaporated and
redissolved in MeOH. For total arsenic (totAs) concentration, the number of replicates depended on
available sample material. Labels A,B and C refer to different measurement days of the samples,
which are all different replicates
LS WS RS totAs
MeOH: sum of all
peaks
MeOH fraction
Colum recovery
WS of MeOH
Hexane fraction
H2O: sum of
all peaks
H2O fraction
Column recovery
Residue digest
Sum all
Total
Label totAs (%) (void) totAs totAs (%) totAs As conc.
EC–rvk 12–8
ECr1–B 1.29 0.95 136 0.19 0.02 1.18 1.89 62 2.7 5.5 7.6 (n = 1) ECr2–B 1.03 0.75 138 0.17 0.02 0.95 1.42 67 2.7 4.9
EC–rvk–17–8
ECr3–B 2.03 2.19 93 1.2 0.03 2.07 2.62 79 3.8 8.6 9.2 ± 1.3 (n = 2) ECr4–B 0.59 0.57 103 0.22 0.02 1.92 2.33 82 3.4 6.3
ECr5–A 0.64 0.57 113 0.22 0.03 1.72 2.27 76 4.1 6.9
ECr6–C 3.51 3.38 104 0.20 0.18 0.70 nm – 3.3 –
Hincksia sp.
H–B 1.27 2.62 49 0.56 0.22 1.21 1.25 96 3.4 7.3 11.4 (n = 1)
EC–Abdn
ECa1–A 1.38 1.39 100 0.12 0.02 2.52 2.69 94 9.3 13 13.9 ± 0.4 (n = 3) ECa2–B 1.28 1.22 105 0.33 0.04 1.84 2.03 91 9.1 12
ECa3–C 0.91 0.82 111 0.16 0.21 1.00 1.29 78 5.5 7.8
ECa4–C 1.27 1.10 115 0.15 0.31 1.05 1.23 85 5.0 7.6
EC–CB ECc–B 0.50 1.00 50 0 0.06 3.86 4.41 87 5.0 10 11.5 (n = 1)
Elachista sp.
E1–B 4.56 4.9 93 3.0 0.04 25.14 26.98 93 7.5 39 34 ± 2 (n = 3) E2–B 4.61 4.72 98 3.2 0.05 25.55 27.19 94 7.4 39
E3–A 4.83 4.16 116 3.7 1.36 21.23 21.55 99 8.7 34
Pylaiella sp.
P1–B 2.01 1.53 131 0.56 0.01 8.15 9.57 85 10 21 21.5 ± 0.3 (n = 3) P2–B 2.58 3.02 85 0.56 0.01 8.20 9.12 90 9.1 21
P3–A 1.47 1.1 134 0.93 0.01 8.22 9.12 90 12 22
P4–C 1.23 1.22 101 0.51 2.99 5.82 8.09 72 7.6 20
The MeOH/DCM extraction was performed before the water extraction and a portion of the water-
soluble arsenic species was extracted into this fraction. Table S3 and Table S4 show the concentration
of this void volume of the MeOH/DCM fraction, which contains water-soluble arsenic species, such
as AsSugars, as well as a minor contribution of AsLp break-down products.[2] To portray more
realistically the LS fraction, Fig. 2 in the manuscript does not include this void volume of the MeOH
fraction.
Page 6
Environ. Chem. 2016 ©CSIRO 2016 ©CSIRO 2016
doi:10.1071/EN14229_AC
Page 6 of 30
Table S4. Total As in MeOH fraction, and sum of species, sum of species in water fraction and
sum of water-soluble arsenic eluting in void of the MeOH fraction, total arsenic (totAs)
concentration in the residue and the sum of all the extracted arsenic
All concentrations are given in milligrams per kilogram. nm, not measured; autosampler failed and
not enough sample material for another injection
LS WS RS Sample (each replica) MeOH:
sum of all peaks
MeOH: totAs
Column recovery
(%)
Water: sum of all
peaks
WS of MeOH (void)
Residue Total sum
1 EC–Oban Blank A nm 0.88 – 0.36 nm 2.12 3.36 2 EC–Oban Blank B 0.644 1.07 60.07 0.45 0.57 2.99 4.51 3 EC–Oban Blank C nm 1.41 – 0.49 nm 1.96 3.86 4 EC–Oban N30 % A 0.662 1.26 52.42 0.39 0.56 2.37 4.02 5 EC–Oban N30 % A 0.780 1.29 60.56 0.38 0.69 2.37 4.04 6 St1 EC–Oban N30 % A 0.903 1.03 87.47 0.35 0.74 1.65 3.03 7 EC–Oban P30 % A 0.664 1.29 51.50 0.50 0.55 2.96 4.75 8 EC–Oban P30 % A 0.584 0.87 67.47 0.46 0.44 2.64 3.97 9 EC–Oban P30 % A 0.530 0.97 54.44 0.28 0.44 3.02 4.27 10 EC–Oban H2O2 A 1.116 2.05 54.53 0.80 0.88 2.70 5.55 11 EC–Oban H2O2 A 1.328 2.21 60.12 0.93 0.95 1.99 5.13 12 EC–Oban H2O2 A 1.450 1.94 74.79 0.82 1.14 2.74 5.5 13 EC–007–04 Blank A nm 1.55 – 0.17 nm 3.10 4.82 14 EC–007–04 Blank B 1.51 2.35 64.32 0.19 0.79 3.08 5.62 15 EC–007–04 Blank C 0.97 1.83 53.18 0.14 0.32 4.08 6.05 16 EC–007–04 N30 % A 0.72 1.59 45.48 0.19 0.30 2.92 4.7 17 EC–007–04 N30 % B 0.79 1.59 49.42 0.24 0.30 2.82 4.65 18 St2 EC–007–04 N30 % C 0.69 1.67 41.03 0.08 0.40 2.92 4.67 19 EC–007–04 P30 % A 0.56 1.28 43.76 0.09 0.24 3.19 4.56 20 EC–007–04 P30 % B 0.78 1.41 54.98 0.24 0.47 3.69 5.34 21 EC–007–04 P30 % C 0.73 1.54 47.40 0.12 0.40 3.49 5.15 22 EC–007–04 H2O2 A 0.90 1.35 66.78 0.20 0.36 4.25 5.8 23 EC–007–04 H2O2 B 1.03 1.76 58.56 0.37 0.41 4.03 6.16 24 EC–007–04 H2O2 C 0.93 1.85 50.22 0.22 0.28 4.48 6.55 25 EC–022–10 Blank A 0.49 1.11 44.40 0.15 0.21 4.81 6.07 26 EC–022–10 Blank B 0.57 1.28 44.49 0.10 0.27 4.81 6.19 27 EC–022–10 Blank C 0.62 0.98 63.48 0.08 0.34 3.98 5.04 28 EC–022–10 N30 % A 0.54 1.10 49.59 0.11 0.24 4.52 5.73 29 EC–022–10 N30 % B 0.56 1.42 39.06 0.13 0.28 4.01 5.56 30 EC–022–10 N30 % C 0.48 1.11 42.88 0.16 0.22 3.89 5.16 31 EC–022–10 P30 % A 0.67 1.31 50.96 0.19 0.36 4.73 6.23 32 EC–022–10 P30 % B 5.47 6.99 78.22 0.32 5.12 3.80 11.11 33 EC–022–10 P30 % C 0.91 1.55 59.17 0.34 0.55 4.13 6.02 34 EC–022–10 H2O2 A 0.93 1.35 69.21 0.12 0.48 4.22 5.69 35 EC–022–10 H2O2 B 6.95 6.27 110.88 0.14 6.50 4.44 10.85 36 St3 EC–022–10 H2O2 C 5.54 5.37 103.10 0.11 5.17 6.07 11.55 37 EC–022–10 AsA 2.28 2.69 85.06 0.44 1.16 6.42 9.55 38 EC–022–10 AsB 1.43 2.02 70.78 0.32 0.29 6.71 9.05 39 EC–022–10 AsC 1.61 2.05 78.59 0.57 0.52 5.98 8.6 40 EC–022–10 AsN30 % A 1.21 1.74 69.73 0.38 0.42 4.78 6.9 41 EC–022–10 AsN30 % B 1.31 1.90 68.96 0.51 0.54 5.89 8.3 42 EC–022–10 AsN30 % C 2.11 2.36 89.05 0.56 1.24 5.48 8.4 43 EC–022–10 AsP30 % A 4.35 4.01 108.40 0.38 3.44 7.04 11.43
Page 7
Environ. Chem. 2016 ©CSIRO 2016 ©CSIRO 2016
doi:10.1071/EN14229_AC
Page 7 of 30
LS WS RS Sample (each replica) MeOH:
sum of all peaks
MeOH: totAs
Column recovery
(%)
Water: sum of all
peaks
WS of MeOH (void)
Residue Total sum
44 EC–022–10 AsP30 % B 4.97 4.68 106.11 0.52 4.15 5.52 10.72 45 EC–022–10 AsP30 % C 1.70 3.21 52.98 0.48 1.05 5.00 8.69 46 EC–022–10 As H2O2 A 2.92 3.52 83.13 0.35 1.68 7.17 11.04 47 EC–022–10 As H2O2 B 8.08 6.95 116.35 0.70 6.88 6.26 13.91 48 EC–022–10 As H2O2 C 3.34 3.05 109.54 0.51 2.28 4.96 8.52
Fig. S5. Mass balance for the EC cultures. Sum of all peaks in the LS fraction, includes the void volume (i.e.
water soluble species) (some replicates had high concentrations in the void which was supported by totAs
concentration of the fractions, Table S4). Error bars for the fractions are s.d. Error bars for totAs are percentage
combined uncertainty (dependent on amount of dry sample available).
There was not enough sample material to measure the totAs in the same samples as the different
fractions of the EC cultures. Instead, a small amount was grown further for 8 weeks (one replica only
for each set of conditions). The results tended to be in a similar range to the sum of the different
fractions; 105 % ± 31 of the totAs for St2 and St3, Fig. S5. The sum of fractions for St1 was higher
than the measured totAs (165 % ± 16).
0
2
4
6
8
10
12
14
16
18
20
conc
. (m
g / k
g)
WS: Sum all peaks LS: Sum all peaks RS totAs
Page 8
Environ. Chem. 2016 ©CSIRO 2016 ©CSIRO 2016
doi:10.1071/EN14229_AC
Page 8 of 30
This variation could be due to the algae not being the same sample as for the sequential extraction,
hence not as comparable as, for example, for the field-collected algae, and also the sample material
obtained ranged from 1–10 mg depending on environmental conditions. Samples of 3 mg or less
tended to differ more from the sum of fractions than samples where more material was available.
Additionally, for some replicas, there was an increase of arsenic found in the void volume of the
MeOH fraction (see Table S4). This was mostly evident for low-phosphate and oxidative stress
conditions – reflected here in higher totAs concentrations, Fig. S5.
When considering the small amount of sample material – both for the totAs measurement and the
sequential extraction – it is clear that the mass balance is in good agreement.
Page 9
Environ. Chem. 2016 ©CSIRO 2016
doi:10.1071/EN14229_AC
Page 9 of 30
Arsenolipids: quantification and identification
Table S6. Quantification of AsLps in the Ectocarpus cultures (n = 3)
All concentrations are given in milligrams per kilogram. Sum, sum of AsLps (total concentration)
Rt (min) St3-ctrl St3-N St3-P St3-OS Rt (min) St3-As St3-AsN St3-AsP St3-OS 1.8 0.274 ± 0.054 0.244 ± 0.024 2.01 ± 2.20 4.05 ± 2.58 1.8 0.65 ± 0.37 0.73 ± 0.36 2.88 ± 1.32 2.71 ± 2.32 21.3 0.005 ± 0.002 0.009 ± 0.002 0.007 ± 0.001 0.003 ± 0.003 25.3 0.180 ± 0.020 0.151 ± 0.005 0.049 ± 0.006 0.168 ± 0.027 25.2 0.906 ± 0.036 0.621 ± 0.045 0.290 ± 0.063 0.586 ± 0.075 30.2 0.073 ± 0.004 0.093 ± 0.011 0.059 ± 0.014 0.103 ± 0.005 30.3 0.135 ± 0.006 0.133 ± 0.010 0.066 ± 0.011 0.121 ± 0.007 – – – – 31.9 – – 0.009 ± 0.001 0.019 ± 0.001 32.5 – – 0.015 ± 0.002 0.013 ± 0.006 32.7 – – 0.020 ± 0.001 0.017 ± 0.004 33.8 – – 0.011 ± 0.001 0.029 ± 0.005 33.6 – – 0.022 ± 0.001 0.066 ± 0.009 35.3 0.019 ± 0.011 0.015 ± 0.002 0.120 ± 0.028 0.081 ± 0.012 35.3 0.029 ± 0.002 0.019 ± 0.002 0.25 ± 0.024 0.027 ± 0.007 39.1 0.007 ± 0.001 0.010 ± 0.001 0.034 ± 0.006 0.013 ± 0.004 39.1 0.020 ± 0.005 0.014 ± 0.002 0.061 ± 0.011 0.027 ± 0.007 44.5 0.008 ± 0.001 0.012 ± 0.002 0.045 ± 0.010 0.016 ± 0.003 44.7 0.023 ± 0.008 0.015 ± 0.004 0.075 ± 0.012 0.037 ± 0.003 Sum 0.288 ± 0.011 0.281 ± 0.018 0.332 ± 0.031 0.423 ± 0.039 Sum 1.12 ± 0.02 0.811 ± 0.037 0.79 ± 11 0.877 ± 0.077 1.8 0.573 0.665 ± 0.077 0.479 ± 0.055 0.997 ± 0.110 1.8 0.56 ± 0.23 0.331 ± 0.046 0.373 ± 0.097 0.352 ± 0.054 24.5 – – 0.006 ± 0.002 – 25.3 0.037 0.023 ± 0.003 0.043 ± 0.003 0.069 ± 0.007 25.0 0.496 ± 0.032 0.241 ± 0.032 0.185 ± 0.014 0.295 ± 0.029 26.7 – 0.008 ± 0.001 0.007 ± 0.002 – 27.6 – – 0.005 ± 0.001 – 29.3 0.014 0.020 ± 0.008 0.025 ± 0.007 0.036 ± 0.010 28.9 0.107 ± 0.007 0.081 ± 0.007 0.054 ± 0.026 0.157 ± 0.010 32.8 0.004 0.009 ± 0.006 0.005 ± 0.001 0.023 ± 0.007 32.6 0.016 ± 0.001 0.020 ± 0.001 0.030 ± 0.025 0.047 ± 0.002 35.2 0.015 0.044 ± 0.023 0.023 ± 0.009 0.136 ± 0.036 35.0 0.029 ± 0.001 0.031 ± 0.001 0.019 ± 0.007 0.063 ± 0.005 36.0 0.014 ± 0.001 0.015 ± 0.001 0.014 ± 0.005 0.028 ± 0.004 38.4 0.004 0.009 ± 0.002 0.006 ± 0.001 0.015 ± 0.003 38.4 0.010 ± 0.004 0.009 ± 0.004 0.008 ± 0.002 0.005 ± 0.001 43.7 0.002 0.013 ± 0.004 0.007 ± 0.002 0.016 ± 0.002 43.2 0.008 ± 0.002 0.009 ± 0.002 0.006 ± 0.001 0.006 ± 0.001 Sum 0.076 0.105 ± 0.032 0.117 ± 0.022 0.282 ± 0.059 – 0.681 ± 0.033 0.401 ± 0.033 0.316 ± 0.011 0.601 ± 0.046
Page 10
Environ. Chem. 2016 ©CSIRO 2016 ©CSIRO 2016
doi:10.1071/EN14229_AC
Page 10 of 30
Table S7. Identified AsHCs in Ectocarpus cultures
C19 H42 O As and C21 H46 O As identified by ESIMS accurate mass and retention time, compared
with As75 ICP-MS signal. Found in one to three of the replicas for each set of conditions. MSMS,
AsHC fragmentation pattern observed, example given in Fig. S5. Δm/z, (m/zfound – m/zcalc) × 106/m/zcalc
AsHC360 Δm/z (ppm)
Rt (min) MSMS
AsHC388 Δm/z (ppm)
Rt (min)
C19 H42 O As [M+H]+
measured
C21 H46 O As [M+H]+
measured
St1-ctrl 361.2436 –2.75 25.1 No 389.2762 0.76 25.7 St1-N 361.2438 –2.25 25.1 No
St1-P 361.2439 –1.89 25.1 Yes 389.2771 2.97 25.8 St1-OS 361.2439 –2.06 25.1 Yes
St2-ctrl 361.2442 –1.23 24.8 Yes 389.2759 –0.16 25.5 St2-N 361.2441 –1.48 24.9 Yes 389.2754 –1.27 25.6 St2-P 361.2441 –1.40 24.9 Yes 389.2755 –1.04 25.6 St2-OS 361.2439 –2.06 25.1 Yes 389.2752 –1.96 25.7 St3-ctrl 361.2445 –0.20 25.1 Yes 389.2761 0.38 25.7 St3-N 361.2443 –0.81 25.2 Yes 389.2757 –0.47 25.9 St3-P 361.2443 –0.98 25.3 Yes 389.2766 1.71 25.9 St3-OS 361.2440 –1.64 25.2 Yes 389.2752 –1.89 25.8 St3-As 361.2443 –0.81 25.1 Yes 389.2755 –1.19 25.8 St3-AsN 361.2442 –1.23 25.1 Yes 389.2753 –1.50 25.7 St3-AsP 361.2444 –0.65 25.2 Yes 389.2755 –1.12 25.8 St3-AsOS 361.2443 –0.90 25.2 Yes 389.2757 –0.63 25.8
Page 11
Environ. Chem. 2016 ©CSIRO 2016 ©CSIRO 2016
doi:10.1071/EN14229_AC
Page 11 of 30
Fig. S6. MS2 chromatogram for St1-OS for AsHC360 (C19 H42 O As, 361.2444, Δm –0.647) showing the
main fragments: C2 H4 As (102.9522 Δm –1.73 ppm), C2 H6 As (104.9680, Δm –0.078), C2 H8 O As
(122.9785, Δm –0.918).
Table S8. Tentative identification of AsPLs in Ectocarpus cultures
C44 H87 O14 As P and C46 H91 O14 As P identified by ESIMS accurate mass and retention time,
compared with As75 ICP-MS signal. Found in one to three of the replicas under each set of conditions
AsPL944 Δm (ppm)
Rt (min)
AsPL972 Δm (ppm)
Rt (min) C44 H87 O14 As P C46 H91 O14 As P
St1-N 945.5058 1.49 35.5 St1-P 945.5048 0.45 35.3 St2-ctrl 945.5035 –0.90 33.4 St2-N 945.5023 –2.25 33.3 St2-P 945.5054 1.04 33.2 St2-OS 945.5070 2.78 33.3 St3-As 945.5070 2.78 35.1 St3-AsN 945.5054 1.10 34.5 St3-AsP 945.5010 –3.61 34.1 973.5349 –0.865 35 St3-AsOS 945.5046 0.20 34.1
ec10 #1578 RT: 25.13 AV: 1 NL: 5.06E5F: FTMS + c ESI d w Full ms2 [email protected] [85.00-375.00]
100 120 140 160 180 200 220 240 260 280 300 320 340 360
m/z
0
1
2
3
4
5
6
7
8
9
10
11
12
13
14
15
16
Re
lative
Ab
un
da
nce
361.24
227.22
104.97122.98
268.30
102.95 249.08 317.77223.62 336.92125.76 193.64168.61
Page 12
Environ. Chem. 2016 ©CSIRO 2016 ©CSIRO 2016
doi:10.1071/EN14229_AC
Page 12 of 30
(a) (b)
Fig. S7. Identified AsPL944 in (a) St1-P; (b) St2-OS; (c) St3As-P. Column recovery and further information
for the samples in Tables S9–S13 is given in Table S3.
Table S9. Quantities of AsLs in Ectocarpus found in Cruden Bay, UK and Hincksia sp. found
in Reykjavík, Iceland EC Cruden Bay (EC-C) Hincksia
(H1)
Rt (min)
Concentration (mg kg–1)
Rt (min)
Concentration (mg kg–1)
25.7 0.019 25.4 0.070 26.6 0.136 26.4 0.335 – – 27.2 0.060 27.8 0.026 28.0 0.052 – – 30.1 0.054 – – 30.8 0.055 – – 32.0 0.031 33.8 0.006 34.0 0.037 36.3 0.008 36.7 0.017 Sum AsLps 0.195 Sum 0.711
0
10000
20000
30000
40000
50000
60000
70000
80000
90000
100000
0.005
0.007
0.009
0.011
0.013
0.015
0.017
0.019
24 34 44
Inte
nsity
(ESI
MS)
Rel
ativ
e in
tens
ity (I
CPM
S)
Time (min)
As75 AsPL944
0
10000
20000
30000
40000
50000
60000
70000
80000
90000
100000
0.003
0.013
0.023
0.033
0.043
0.053
0.063
0.073
0.083
0.093
24 34 44
Inte
nsity
(ESI
MS)
Rel
ativ
e in
tens
ity (I
CPM
S)
Time (min)
As75
-2000
0
2000
4000
6000
8000
10000
12000
0
0.005
0.01
0.015
0.02
0.025
0.03
22 27 32 37 42
Inte
nsi
ty (
ESIM
S)
Rel
ativ
e in
ten
sity
(IC
PM
S)
Time (min)
As75
AsPL972
AsPL944
Page 13
Environ. Chem. 2016 ©CSIRO 2016
doi:10.1071/EN14229_AC
Page 13 of 30
Table S10. Ectocarpus from Aberdeen: identification and quantification of species ECa2 (n = 1) ECa2 acid (n = 1) ECa2 base (n = 1) ECa1 (n = 1) ECa3–4 (n = 2) Formula Rt
(min) Conc.
(mg kg–1) m/z
[M + H]+ Δm/z (ppm)
Rt (min)
Conc. (mg kg–1)
Δm/z (ppm)
Rt (min)
Conc. (mg kg–1)
Δm/z (ppm)
Rt (min)
Conc. (mg kg–1)
Rt (min)
Conc. (mg kg–1)
Δm/z (ppm)
1.8 0.118 1.8 0.883 1.8 0.827 1.8 0.33 1.8 0.155 – – 2.8 0.052 22.1 0.002 – – – – – – 3.2 0.014 23 0.005 – – – – – – 4.9 0.002 24.3 0.002 – – – – U (unknown) 25.1 0.002 23.2 0.001 24.6 0.008 – – – – U 26 0.006 25.2 0.01 25.2 0.079 25.6 0.008 22.5 0.003 C23 H38 O As 26.9 0.858 405.2150 4.19 25.9 0.014 – – 26.1 0.003 24.6 0.645 –0.45
C19 H42 O As 27.8 361.2439 –2.00 26.4 0.577 –1.45 26.4 0.633 –0.04 26.5 0.798 25.3 –1.3
C20 H44 O As 27.8 375.2595 –2.14 –1.50 –1.00 –2.4
C21 H46 O As 27.9 389.2750 –2.37 27.2 0.066 –0.81 27.2 0.072 –1.04 –0.6
C22 H48 O As 28 403.2908 –1.97 –1.30 U 28.7 0.025 28 0.012 28 0.031 U 29.3 0.034 29.9 0.011 29.9 0.012 28.8 0.007 28.4 0.06 U 29.6 0.062 30.9 0.012 – – 29.3 0.003 – – U 30.5 0.011 – – – – 29.7 0.02 – – U 31.6 0.013 – – – – 31.4 0.003 30.3 0.009 C43 H85 O14 As P 32.4 0.018 931.4864 –2.52 – – – – 32.3 0.005 31.2 0.01 C44 H87 O14 As P 32.9 0.027 945.5035 –0.95 – – – – 32.7 0.029 32.2 0.07 –2.6
U 33.4 0.072 – – – – – – – – C46 H91 O14 As P 35.8 0.128 973.5352 –0.48 – – – – C45 H89 O14 As P 959.5185 –1.62 – – – C47 H91 O14 As P 985.5364 0.76 – – – – 35.1 0.051 34.7 0.08 –4.1
C48 H95 O14 As P 39.2 0.01 1001.5635 –3.51 – – – – 38.5 0.01 37.8 0.02 43.5 0.004 42.9 0.0021
Sum AsLps 1.27 0.69 0.81 0.95 0.93
Page 14
Environ. Chem. 2016 ©CSIRO 2016
doi:10.1071/EN14229_AC
Page 14 of 30
Table S11. Quantified and identified AsLps in Ectocarpus from Reykjavik, Iceland ECr6 (n = 1) ECr3 (n = 1) ECr4 (n = 1) ECr5 (n = 1) ECr1-2 (n = 2) Formula Rt
(min) Conc.
(mg kg–1) m/z
[M + H]+ Δm/z (ppm)
Rt (min)
Conc. (mg kg–1)
Rt (min)
Conc. (mg kg–1)
Rt (min)
Conc.. (mg kg–1)
Rt (min)
Conc. (mg kg–1)
U (unknown) – – – – – – 22.2 0.003 23.0 0.009 22.1 0.0012 ± 0.0005 U – – – – 24.3 0.029 23.1 0.006 23.8 0.003 23.1 0.0019 ± 0.0001 U – – – – 24.9 0.017 25.5 0.027 24.5 0.010 25.4 0.061 ± 0.009 U 24.2 – 405.2132 –0.2 25.9 0.112 26.0 0.009 25.7 0.021 25.9 0.02 C19 H42 O As 25.3 2.179 361.2443 –0.8 26.6 0.558 26.4 0.291 26.5 0.504 26.4 0.756 ± 0.107 C20 H44 O As 375.2596 –1.7 C21 H46 O As 389.2754 –1.4 U 27.5 0.016 – – 27.8 0.054 – – 27.8 0.017 27.1 0.056 ± 0.009 U 28.1 0.014 – – – – 28.8 0.011 27.8 0.037 ± 0.001 U 28.6 0.121 – – 30.2 0.006 29.4 0.010 30.1 0.016 ± 0.001 U 30.4 0.009 – – 30.6 0.011 30.8 0.006 29.9 0.016 30.8 0.022 ± 0.002 C47 H89 O14 As P 32.3 0.156 983.5170 –3.1 – – 31.4 0.005 31.5 0.003 31.8 0.005 ± 0.001 C45 H89 O14 As P 34.3 0.502 959.5181 –2.0 – – 33.3 0.014 32.7 0.003 ± 0.001 C46 H91 O14 As P 973.5342 –1.6 – – 34.0 0.004 35.3 0.020 33.8 0.006 ± 0.001 C47 H93 O14 As P 37.8 0.163 987.5590 7.8 – – 36.5 0.005 38.7 0.003 36.3 0.008 ± 0.001 C48 H95 O14 As P 1001.5685 1.5 – – – – – – – – C49 H97 O14 As P 42.8 0.134 1015.5821 –0.5 – – – – – – – – U 50.2 0.020 – – – – – – – – – – Sum AsLps 3.31 0.78 0.36 0.64 0.98 ± 0.12
Page 15
Environ. Chem. 2016 ©CSIRO 2016 ©CSIRO 2016
doi:10.1071/EN14229_AC
Page 15 of 30
Table S12. Quantification and identification of AsLps in Elachista E1-E2 (n = 2) E3 (n = 1) Chemical formula Rt
(min) Conc. (mg kg–
1) Δm/z (ppm)
m/z [M + H]+
Rt (min)
Conc. (mg kg–1)
Δm/z (ppm)
m/z [M + H]+
C23 H38 O As – – 25.5 0.008 2.113 405.2142 U (unknown) 26.6 0.002 ± 0.001 26.0 0.013 C19 H42 As O 27.4–
27.7 0.703 ± 0.081 –1.063 361.2442 26.4 0.748 –3.166 361.2435
C20 H44 As O –1.982 375.2595 –4.248 375.2587 C21 H46 As O –1.808 389.2752 –4.249 389.2743 C22 H48 As O –1.895 403.2908 U 28.8 0.02 28.1 0.038 U 29.4 0.025 ± 0.001 28.9 0.015 U 29.9 0.050 ± 0.001 29.4 0.019 U 31.2 0.041 ± 0.006 29.8 0.028 U – – 31.1 0.027 U 32.6 0.025 ± 0.001 32.3 0.011 C43 H85 As O14 P 33.1 0.064 ± 0.001 1.018 931.4897 32.8 0.027 –2.653 931.4863 C44 H87 As O14 P –0.382 945.5040 –0.509 945.5039 C47 H89 As O14 P 33.9 0.108 ± 0.008 –1.384 983.5187 33.6 0.045 C45 H89 As O14 P 35.5–
35.9 0.314 ± 0.008 –0.273 959.5198 35.3 0.112 –3.774 959.5164
C46 H91 As O14 P –1.429 973.5343 –4.316 973.5315 C47 H91 As O14 P –0.638 985.5363 –2.65 985.5331 C47 H93 As O14 P 39.6 0.099 ± 0.018 –0.63 987.5507 38.6 0.042 –3.222 987.5482 C48 H95 As O14 P –1.929 1001.565 –3.876 1001.563 C49 H97 As O14 P 45.2 0.034 1.761 1015.5844 – – Sum AsLps 1.49 1.13
For EC Rvk and Pylaiella, a single replica was much higher in concentration than the others, Table
S11 and Table S13. The higher concentration was supported by the totAs concentration measured
from the extract (Table S3); this could be due to homogeneity issues. These samples were used for
identification of the lipids because of their higher concentrations. They were excluded from average
calculations for the sum of AsLps, given in the main text in Fig. 2a, c.
Page 16
Environ. Chem. 2016 ©CSIRO 2016
doi:10.1071/EN14229_AC
Page 16 of 30
Table S13. Quantified and identified AsLps in Pylaiella P2 (n = 1) P4 (n = 2) P1 (n = 1) P3 (n = 1) Formula Rt
(min) Conc.
(mg kg–1) m/z
[M + H]+ Δm/z (ppm)
Rt (min)
Conc. (mg kg–1)
m/z [M + H]+
Δm/z (ppm)
Rt (min)
Conc. (mg kg–1)
Rt (min)
Conc. (mg kg–1)
24.9 0.002 24.9 0.004 26.8 0.038 24.0 0.003 ± 0.001 25.9 0.011 25.9 0.017 C23 H38 O As 27.7 0.176 405.2129 –0.9 24.7 0.012 ± 0.004 405.2127 –1.6 26.8 0.033 C19 H42 O As 28.3 361.2442 –1.1 25.9 0.24 ± 0.02 361.2435 –3.1 27.6 0.173 26.6 0.156 C20 H44 O As 375.2598 –1.3 375.2591 –3.2 C21 H46 O As 28.5 0.216 389.2753 –1.5 26.2 0.155 ± 0.008 389.2747 –3.1 27.9 0.121 27.2 0.061 C22 H48 O As 403.2910 –1.5 403.2903 –3.2 27.8 0.028 29.2 0.062 27.5 0.024 ± 0.007 28.8 0.023 28.9 0.025 29.6 0.181 28.0 0.042 ± 0.003 29.3 0.037 29.3 0.027 30.4 0.027 28.4 0.106 ± 0.005 29.7 0.085 29.7 0.073 31.6 0.043 29.3 0.005 ± 0.001 30.6 0.015 30.5 0.012 30.4 0.0168 ± 0.0001 31.7 0.024 31.4 0.013 C44 H87 O14 As P 32.5 0.048 945.5029 –1.6 31.3 0.014 ± 0.001 32.5 0.019 32.2 0.009 C45 H87 O14 As P 33.5 0.344 957.5036 –0.8 31.9 0.14 ± 0.01 957.5017 –2.9 33.6 0.107 33.2 0.058 C47 H89 O14 As P 983.5183 –1.8 32.3 983.5211 1.1 C45 H89 O14 As P 35.6 0.425 959.5177 –2.4 34.4 0.13 ± 0.03 959.5173 –2.8 35.7 0.076 35.2 0.053 C46 H91 O14 As P 973.5342 –1.5 973.5333 –2.5 C47 H91 O14 As P 985.5338 –1.9 C47 H93 O14 As P 39.4 0.102 987.5496 –1.8 38.1 0.02 ± 0.01 39.5 0.010 38.6 0.010 C48 H95 O14 As P 1001.5644 –2.6 C49 H97 O14 As P 44.8 0.038 1015.5802 –2.4 43.4 0.011 ± 0.007 43.4 0.004 Sum AsLps 1.70 0.90 0.72 0.53
Page 17
Environ. Chem. 2016 ©CSIRO 2016 ©CSIRO 2016
doi:10.1071/EN14229_AC
Page 17 of 30
Table S14. Fragmentation patterns (MS-MS data) of selected samples AsHC360 AsHC374 AsHC388 AsHC402
Pylaiella (P2)
C19 H42 O As (361.24512, ppm 1.401). C2 H8 O As (122.9786, ppm 0.221). C2 H6 As (104.9680, ppm 0.303). C2 H4 As (102.9523, ppm –0.37)
C20 H44 O As (375.2608, ppm 1.35). C19 H40 As (343.2342, ppm 0.498) = M – MeOH + H. C3 H10 Oas (136.9943, ppm 0.344). C2 H6 As (104.968, ppm 0.303)
C21 H46 O As (389.2762, ppm 0.606). C3 H10 O As (136.994s, ppm 0.49). C2 H8 O As (122.9784, ppm –1.57). C2 H6 As (104. 9679, ppm –0.745)
C22 H48 O As (403.2918, ppm 0.684). C21 H 44 As (371.2647, ppm –1.72) = M – MeOH + H. C3 H10 O As (136.9942, ppm –0.094). C2 H6 As (104.9678, ppm –2.36)
EC rvk (ECr6)
C19 H42 O As (361.2448, ppm 0.377). C2 H8 O As (122.9785, ppm –0.836). C2 H6 As (104.9681, ppm 1.07). C2 H4 As (102.9523, ppm –0.47)
EC Abdn (ECa3)
C19 H42 O As (361.2443, ppm –0.897). C2 H8 O As (122.9782, ppm –2.71). C2 H6 As (104.9679, ppm –0.745). C2 H4 As (102.9522, ppm –1.24)
C20 H44 O As (375.2597, ppm 1.58). C19 H40 As (343.2239, ppm –29.54) = M – MeOH + H. C3 H10 O As (136.9939, ppm –1.99).
Elachista
(E1) C19 H42 O As (361.2445, ppm –0.343). C2 H8 O As (122.9783, ppm –2.06). C2 H6 As (104.9678, ppm –1.51). C2 H4 As (102.9521, ppm –2.6)
C20 H44 O As (375.2604, ppm –0.878). C3 H10 O As (136.9942, ppm –0.313). C2 H8 O As (122.9780, ppm –4.3) C2 H6 As (104.9679, ppm –0.745)
Page 18
Environ. Chem. 2016 ©CSIRO 2016 ©CSIRO 2016
doi:10.1071/EN14229_AC
Page 18 of 30
The following graphs show the As75 signal from ICP-MS as well as the different signals from the
ESIMS (specific m/z) where individual signals have been elevated for clarity.
Fig. S8. Identified peaks in EC from Rvk (a) AsHCs; (b) AsPLs.
0
5000000
10000000
15000000
20000000
25000000
30000000
0
0.5
1
1.5
2
2.5
23 28 33 38 43
Inte
nsi
ty E
SIM
S
Re
lati
ve in
ten
sity
Time (min)
As75
AsHC360
AsHC374
AsHC388
0
10000
20000
30000
40000
50000
0
0.1
0.2
0.3
0.4
0.5
28 33 38 43
Inte
nsi
ty E
SIM
S
Re
lati
ve in
ten
stiy
IC
PM
S
Time (min)
As75 AsPL982 AsPL958 AsPL972 AsPL986 AsPL1000 AsPL1014
Page 19
Environ. Chem. 2016 ©CSIRO 2016 ©CSIRO 2016
doi:10.1071/EN14229_AC
Page 19 of 30
a)
b)
c)
Fig. S9. (a) Chromatogram of Elachista: (b) identified AsHCs; (c) identified AsPLs.
0
0.2
0.4
0.6
0.8
1
1.2
1.4
1.6
0 10 20 30 40 50
Re
lati
ve in
ten
sity
IC
PM
S
Time (min)
0
5000000
10000000
15000000
20000000
25000000
30000000
35000000
40000000
45000000
50000000
0
0.2
0.4
0.6
0.8
1
1.2
1.4
1.6
20 25 30 35 40 45 50
Inte
nsi
ty E
SIM
S
Re
lati
ve in
ten
sity
IC
PM
S
Time (min)
Elachista
AsHC360
AsHC374
AsHC388
0
50000
100000
150000
200000
250000
300000
350000
400000
450000
500000
0
0.1
0.2
0.3
0.4
0.5
30 35 40 45 50
Elachista
AsPL982
AsPL958
AsPL972
AsPL984
AsPL986
AsPL1000
AsPL1014
AsPL930
Page 20
Environ. Chem. 2016 ©CSIRO 2016 ©CSIRO 2016
doi:10.1071/EN14229_AC
Page 20 of 30
a)
b)
c)
Fig. S10. Identified arsenolipids peaks in Pylaiella: (a) sample P2: AsPLs; (b) sample P2: AsHCs; (c) sample
P4: AsHC404.
0
100000
200000
300000
400000
500000
0
0.1
0.2
0.3
0.4
0.5
0.6
0.7
0.8
30 35 40 45
Inte
nsity
ESI
MS
Rel
ativ
e in
tens
ity IC
PMS
Time (min)
As75 AsPL956 AsPL982 AsPL958 AsPL972 AsPL984 AsPL986 AsPL1000 AsPL1014
0
2000000
4000000
6000000
8000000
10000000
12000000
14000000
16000000
0
0.2
0.4
0.6
0.8
1
1.2
1.4
25 26 27 28 29 30 31 32 33
Inte
nsity
ESI
MS
Rel
ativ
e in
tens
ity IC
PMS
Time (min)
As75 AsHC360 AsHC375 AsHC388 AsHC402
0
50000
100000
150000
200000
250000
300000
350000
400000
0
0.05
0.1
0.15
0.2
0.25
0.3
24 25 26 27 28 29 30
Inte
nsi
ty E
SIM
S
Rela
tive in
ten
sity
(IC
PM
S)
Time (min)
As75 AsHC404 AsHC360
Page 21
Environ. Chem. 2016 ©CSIRO 2016 ©CSIRO 2016
doi:10.1071/EN14229_AC
Page 21 of 30
a)
b)
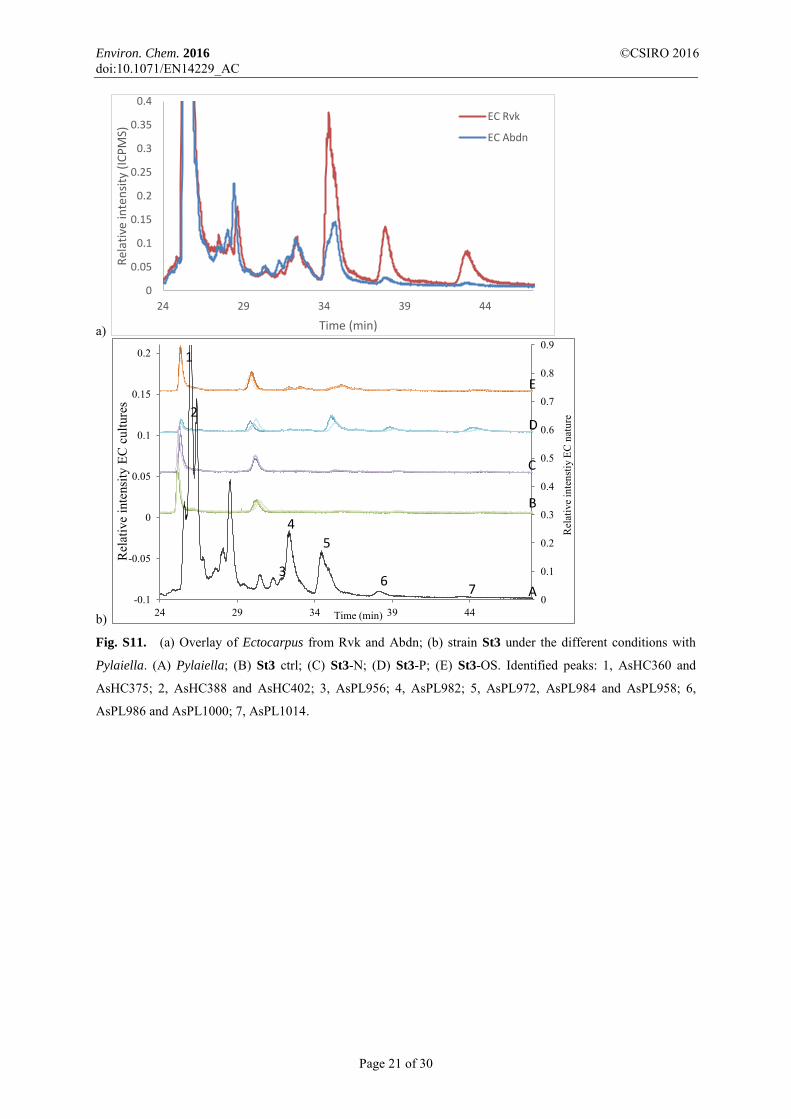
Fig. S11. (a) Overlay of Ectocarpus from Rvk and Abdn; (b) strain St3 under the different conditions with
Pylaiella. (A) Pylaiella; (B) St3 ctrl; (C) St3-N; (D) St3-P; (E) St3-OS. Identified peaks: 1, AsHC360 and
AsHC375; 2, AsHC388 and AsHC402; 3, AsPL956; 4, AsPL982; 5, AsPL972, AsPL984 and AsPL958; 6,
AsPL986 and AsPL1000; 7, AsPL1014.
0
0.05
0.1
0.15
0.2
0.25
0.3
0.35
0.4
24 29 34 39 44
Rel
ativ
e in
ten
sity
(IC
PM
S)
Time (min)
EC Rvk
EC Abdn
0
0.1
0.2
0.3
0.4
0.5
0.6
0.7
0.8
0.9
-0.1
-0.05
0
0.05
0.1
0.15
0.2
24 29 34 39 44
Rel
ativ
e in
tens
tiy E
C n
atur
e
Rel
ativ
e in
tens
ity E
C c
ultu
res
Time (min)
A
B
C
D
E
3
4
5
6 7
1
2
Page 22
Environ. Chem. 2016 ©CSIRO 2016 ©CSIRO 2016
doi:10.1071/EN14229_AC
Page 22 of 30
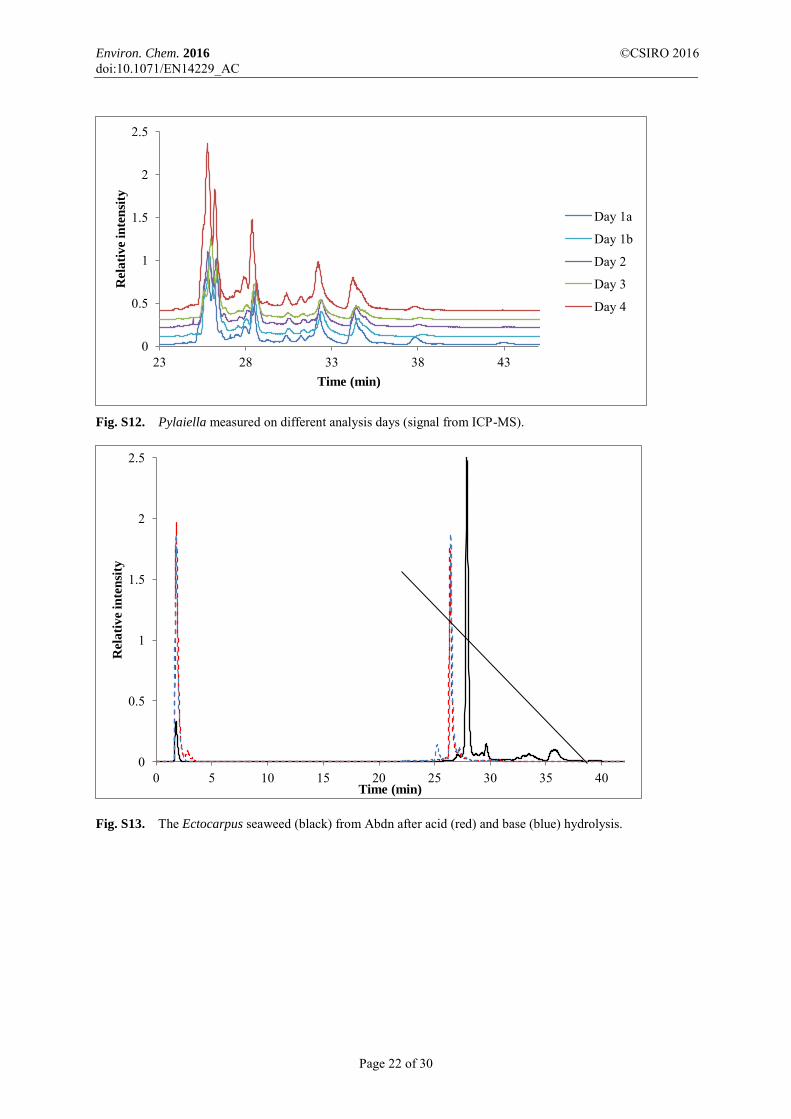
Fig. S12. Pylaiella measured on different analysis days (signal from ICP-MS).
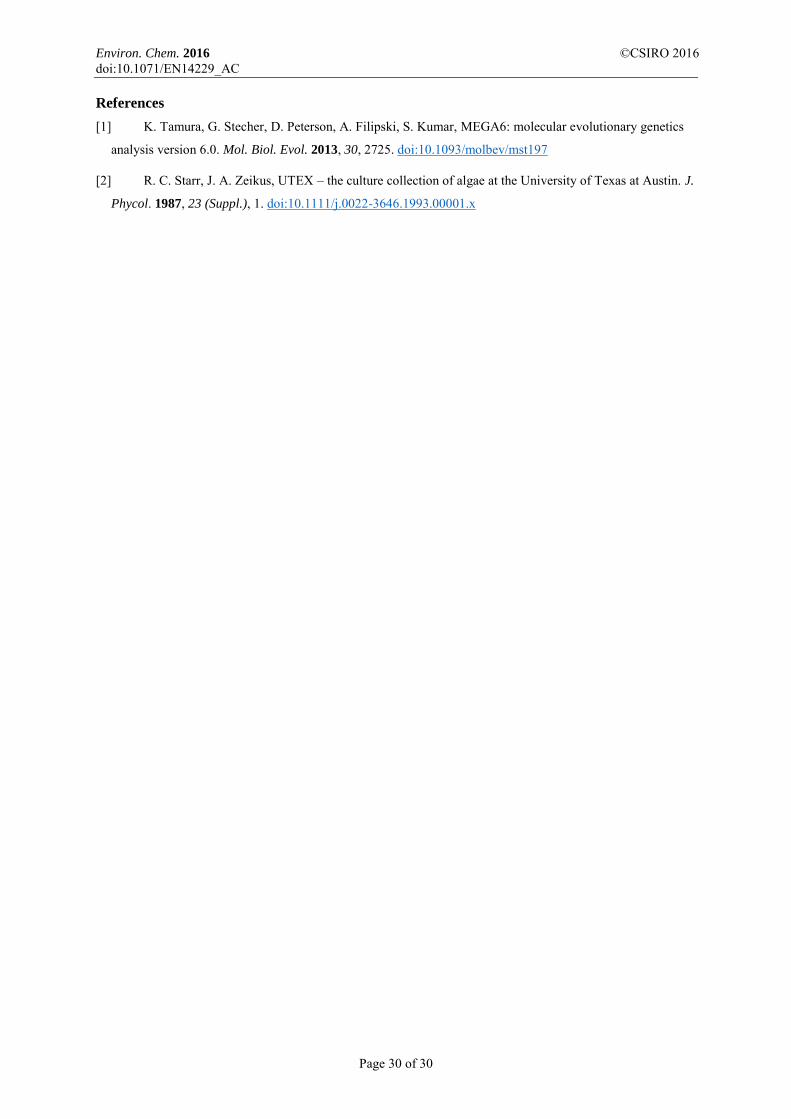
Fig. S13. The Ectocarpus seaweed (black) from Abdn after acid (red) and base (blue) hydrolysis.
0
0.5
1
1.5
2
2.5
23 28 33 38 43
Rel
ati
ve
inte
nsi
ty
Time (min)
Day 1a
Day 1b
Day 2
Day 3
Day 4
0
0.5
1
1.5
2
2.5
0 5 10 15 20 25 30 35 40
Rel
ati
ve
inte
nsi
ty
Time (min)
Page 23
Environ. Chem. 2016 ©CSIRO 2016 ©CSIRO 2016
doi:10.1071/EN14229_AC
Page 23 of 30
Hydrolysis
Acid (HCl) and base (KOH) (both from Fisher Scientific) hydrolysis was performed on an
Ectocarpus sample from Aberdeen Beach. The samples were incubated for 24 h at room temperature
at 1 M concentration for both acid and base hydrolysis (900 µL of sample + 100 µL 10 M acid or
base). Samples were centrifuged if required. This was done for additional confirmation that the peaks
eluting after ~30–32 min were hydrolysable AsLps (e.g. AsPLs). The AsHCs were identified in the
sample as well as the acid and base hydrolysates (Table S10), although the AsHC peaks were shifted
to earlier retention time (pH difference). Small peaks eluting before and after the AsHCs could be
fragments (still containing the arsenic moiety) after hydrolysis.
Arsenosugars: identification and quantification
Fig. S14. Water fraction of Pylaiella, signal from the ICP-MS (solid: As75 as AsO+ m/z 91) and identified
Assugars with ESIMS (a–c), iAs = inorganic arsenic.
Table S15. Identified arsenosugars in Pylaiella with parallel HPLC-ICP-MS/ESIMS
Δm/z, (m/zfound – m/zcalc) × 106/m/zcalc
M + H Formula Δm/z (ppm)
329.0569 C10 H22 O7 As –0.741
483.0595 C13 H29 O12 As P –1.221
393.0187 C10 H22 O9 As S –0.781
Page 24
Environ. Chem. 2016 ©CSIRO 2016 ©CSIRO 2016
doi:10.1071/EN14229_AC
Page 24 of 30
Table S16. Quantification of AsSugars in the Ectocarpales found in nature
All concentrations are given in milligrams per kilogram. Potentially some AsV contamination from
glassware
AsSugarOH (328) Rt 2.4
min
DMA Rt 3.3 min
AsSugarPO4 (482) Rt 3.9
min
AsSugarSO3 (392) Rt 7.0
min
AsV 14.1 min
Sum % column
recovery EC-Rvk12 (n = 2) 0.26 ± 0.02 0.041 ± 0.001 0.07 ± 0.02 0.19 ± 0.03 0.52 ± 0.05 1.06 64 ± 2 EC-Rvk17 (n = 3) 0.33 ± 0.04 0.047 ± 0.003 0.49 ± 0.07 0.48 ± 0.04 0.56 ± 0.06 1.90 73 ± 3 EC-Abdn (n = 2) 1.0 ± 0.2 0.052 ± 0.008 0.28 ± 0.04 0.35 ± 0.05 0.54 ± 0.08 2.18 81 ± 1 EC-Rvk (n = 1) 0.22 0.07 0.15 0.16 0.42 0.37 88 Hincksia (n = 1) 0.22 0.00 0.10 0.14 0.75 0.59 94 EC Cruden bay (n = 1) 0.24 0.04 0.31 0.69 2.58 3.9 87 Pylaiella (n = 3) 0.70 ± 0.01 0.134 ± 0.005 1.38 ± 0.01 5.65 ± 0.03 0.33 ± 0.01 8.2 82 ± 4 Elachista (n = 3) 7.9 ± 1.2 0.19 ± 0.03 6.2 ± 0.3 8.9 ± 0.7 0.68 ± 0.08 24.0 87 ± 2
Fig. S15. Comparison of iAs concentrations in Ectocarpales found in nature measured with HPLC-ICP-MS
and HG-ICPMS.
0
0.5
1
1.5
2
2.5
3
s1 s2 s3 s4 s6 s7 s8 s9 s10 s11 s12 s13 s14 s1a s2a s3a s4a
Rel
ati
ve
inte
nsi
ty
EC found in nature
iAs HPLC-ICPMS
iAs HG-ICPMS
Page 25
Environ. Chem. 2016 ©CSIRO 2016
doi:10.1071/EN14229_AC
Page 25 of 30
Table S17. Quantification of AsSugars in Ectocarpus in cultures (n = 3)
All concentrations are given in milligrams per kilogram. Estimated peak identifications by retention time: peak at 2.5 min, AsSugar328; peak at 3.4 min,
DMA; peak at 4.1 min, AsSugar482; and peak at 7.3 min, AsSugar 392. There was an AsV peak at 14.8 min; however, because of contamination from As in
glass, it was not possible to estimate concentration
Rt (min)
St1-ctrl St1-N St1-P St1-OS Rt (min)
St2-ctrl St2-N St2-P St2-OS
1.4 – – – 0.0019 ± 0.0007 1.5 0.006 ± 0.002 0.0092 ± 0.0002 0.013 ± 0.002 0.073 ± 0.037
2.5 0.081 ± 0.013 0.050 ± 0.014 0.138 ± 0.028 0.148 ± 0.014 2.6 0.089 ± 0.009 0.067 ± 0.002 0.081 ± 0.042 0.043 ± 0.051
3.4 0.0088 ± 0.0015 0.011 ± 0.002 0.012 ± 0.004 0.016 ± 0.002 3.4 0.010 ± 0.001 0.011 ± 0.002 0.012 ± 0.001 0.048 ± 0.037
4.1 0.094 ± 0.008 0.055 ± 0.011 0.005 ± 0.002 0.102 ± 0.01 4.1 0.012 ± 0.004 0.065 ± 0.018 – 0.079 ± 0.024
7.2 0.247 ± 0.034 0.254 ± 0.013 0.262 ± 0.064 0.581 ± 0.053 7.4 0.049 ± 0.01 0.060 ± 0.010 0.043 ± 0.02 0.0094 ± 0.0066
11.4 – 0.0033 ± 0.0005 – – 11.2 0.0022 ± 0.0007 0.007 ± 0.002 – –
Sum 0.43 ± 0.05 0.37 ± 0.02 0.42 ± 0.10 0.85 ± 0.06 Sum 0.17 ± 0.02 0.22 ± 0.03 0.15 ± 0.06 0.26 ± 0.08
1.4 0.027 ± 0.003 0.040 ± 0.004 0.026 ± 0.006 0.05 ± 0.01 1.4 0.097 ± 0.015 0.076 ± 0.013 0.08 ± 0.01 0.11 ± 0.02
2.5 0.047 ± 0.014 0.043 ± 0.010 0.010 ± 0.01 0.040 ± 0.003 2.5 0.16 ± 0.04 0.16 ± 0.02 0.16 ± 0.03 0.16 ± 0.05
3.2 0.0015 ± 0.0014 0.006 ± 0.003 0.008 ± 0.003 0.003 ± 0.002 3.4 0.009 ± 0.002 0.0070 ± 0.0007 0.013 ± 0.004 0.03 ± 0.01
4.0 0.00007 ± 0.00003 0.018 ± 0.015 – 0.010 ± 0.004 4.2 0.021 ± 0.005 0.095 ± 0.045 – 0.059 ± 0.056
7.4 0.034 ± 0.013 0.030 ± 0.008 0.15 ± 0.05 0.019 ± 0.001 7.3 0.16 ± 0.05 0.15 ± 0.02 0.20 ± 0.04 0.16 ± 0.07
Sum 0.11 ± 0.03 0.135 ± 0.022 0.28 ± 0.06 0.123 ± 0.016 Sum 0.44 ± 0.10 0.48 ± 0.08 0.46 ± 0.06 0.52 ± 0.14
Page 26
Environ. Chem. 2016 ©CSIRO 2016 ©CSIRO 2016
doi:10.1071/EN14229_AC
Page 26 of 30
Morphology and microscopy
Table S18. The mean and standard deviation of the chloroplast size for the different
treatments of the EC cultures and the statistical significance of the chloroplast size increase or
decrease
OS, oxidative stress
Mean n s.d. Chloroplast Significance
EC-022-10-ctrl 24.8 21 12.1 St3 EC-022-10-N 34.7 20 15.9 Increase P < 0.001 EC-022-10-P 41.6 25 14.5 P = 0.284 EC-022-10-OS 29.7 20 15.7 Minor increase P = 0.033 EC-022-10+As-ctrl 15.5 22 9.6 St3+As EC-022-10+As-N 29.1 12 17.4 Increase P = 0.18 EC-022-10+As-P 40.1 16 17.9 Increase P < 0.001 EC-022-10+As+OS 13.6 11 19.5 P = 0.74 EC-007-04-ctrl 35.5 8 17.9 St2 EC-007-04-N 15.1 11 9.9 Decrease P = 0.004 EC-007-04-P 19.5 13 13.7 Decrease P = 0.18 EC-007-04+OS 19.5 8 17.1 Decrease P = 0.33 EC-Oban-ctrl 40.2 11 10.0 St1 EC-Oban-N 45.3 10 7.2 P = 0.11 EC-Oban-P 45.6 14 8.5 P = 0.19
EC-Oban+OS 34.1 10 8.5 P = 0.13
Page 27
Environ. Chem. 2016 ©CSIRO 2016 ©CSIRO 2016
doi:10.1071/EN14229_AC
Page 27 of 30
TEM imaging (EC-022-10; St3)
Fig. S16. EC-022-10 TEM images of control sample.
For the control, Fig. S15, fibrils (F) associated with the cell membrane were seen; these have an
unknown function. Further research is required. Chloroplasts (Ch) appear to take up a large amount of
the cell. Mitochondria (Mi) are small and irregular. The membrane is difficult to discern from the rest
of the organelle. Mitochondria were defined by the dark spherical ultrastructure.
Ch
Ch Ch
Ch Ch Nu
Mi
F
F Mi
Page 28
Environ. Chem. 2016 ©CSIRO 2016 ©CSIRO 2016
doi:10.1071/EN14229_AC
Page 28 of 30
Fig. S17. EC-022-10 TEM images of low-nitrate sample.
For the low-nitrate sample, there is an increase in chloroplast size compared with the control. The
mitochondria are irregular again but visible. The fibrils are not as dense as for the control.
Fig. S18. EC-022-10 TEM images of low-phosphate sample.
Fewer somatic cells are visible in the section. New sections are being produced to try to resolve
this. Chloroplasts are enlarged.
Dense body structures are visible as in the H2O2 treatment. No mitochondria are visible. Fibrils are
greatly reduced.
Ch
Nu Ch
DB DB
Ch
Ch
F
Ch
Ch
Nu
Page 29
Environ. Chem. 2016 ©CSIRO 2016 ©CSIRO 2016
doi:10.1071/EN14229_AC
Page 29 of 30
Fig. S19. EC-022-10 TEM images of added-H2O2 sample. Fibrils still present associated with the cell
membrane. No large differences in chloroplasts and mitochondria are obvious. The mitochondria again seem to
be an irregular shape. Dense body structures can be seen occupying the cell.
F
Ch
DB
DB
Nu F
DB
DB
Mi?
Ch F
Page 30
Environ. Chem. 2016 ©CSIRO 2016 ©CSIRO 2016
doi:10.1071/EN14229_AC
Page 30 of 30
References
[1] K. Tamura, G. Stecher, D. Peterson, A. Filipski, S. Kumar, MEGA6: molecular evolutionary genetics
analysis version 6.0. Mol. Biol. Evol. 2013, 30, 2725. doi:10.1093/molbev/mst197
[2] R. C. Starr, J. A. Zeikus, UTEX – the culture collection of algae at the University of Texas at Austin. J.
Phycol. 1987, 23 (Suppl.), 1. doi:10.1111/j.0022-3646.1993.00001.x