Fernando Cotait Maluf Director Oncology Department Beneficência Portuguesa São Paulo, Brazil Member of the Steering Committee Oncology Center Hospital Israelita Albert Einstein São Paulo, Brazil Epidemiology and Treatment of Advanced Prostate Cancer in South America
Transcript
Fernando Cotait Maluf Director Oncology Department Beneficência Portuguesa São Paulo, Brazil Member of the Steering Committee Oncology Center Hospital Israelita Albert Einstein São Paulo, Brazil
Epidemiology and Treatment of Advanced
Prostate Cancer in South America
Disclosure
Honoraria: Pfizer, BMS, Novartis, Astellas
Scientific Advisory Board: Janssen, Novartis
Research Grant: Janssen; AstraZeneca, Sanofi-
Aventis
• Latin America and the Caribbean characteristics:
• 600 million inhabitants
• 10% of the world’s population
• Highest overall Human Development Index rating
• Major Inequalities
• Significant reductions in fertility
• Significant reductions in infant mortality
• Highest life expectancies among developing regions
General Facts
• Incidence: 1.1M new cancer/year (7.8% world cases)
• Deaths/year: 600.000 cases
• Cancer mortality rates are relatively high
• Contributing factors to inferior outcomes:
• Advanced stage at diagnosis
• Limited access to effective treatment : 54% no health-care coverage
• A sharp rise in cost (currently ~$ 4billion annually)
• Inequitable Distribution of Cancer Resources
Overall Cancer Burden in LA
Public vs. Private Coverage
Population covered by
sector
Expenditures by sector
Public 75%
Private 25%
Private 60%
Public 40%
Salud Publica Mex. 2009; 51 (supl 2): 263-269
Age-adjusted Mortality Rates, Women.
Brazil (1979-2004)
Source, INCA, MS, Brazil
Factors Accounting for Cancer Outcomes Disparities
Presented By Alexandru Eniu at 2015 ASCO Annual Meeting
Access to Radiotherapy, 2013
2012 2030
New cases 134,000 249,000
43,000 86,000
Overall Prostate Cancer Burden in LA 1'
Ferlay J et al. GLOBOCAN 2012 v1.0. http://globocan.iarc.fr.
109salud pública de méxico / vol. 58, no. 2, marzo-abril de 2016
Cancer patterns and tr ends in Latin America A RT ÍCULO ORIGIN A L
FIGU RE 2. LEADIN G CAU SES OF CAN CER IN CID EN CE AN D M ORTALIT Y AM ON G M ALES AN D FEM ALES BY COU N T RY, LAC REGION
The boundaries and names shown and the designations used on this map do not imply the expression of any opinion
whatsoever on the part of the World Health Organization concerning the legal status of any country, territory, city or area
or of its authorities, or concerning the delimitation of its frontiers or boundaries. Dotted and dashed lines on maps
represent approximate border lines for which ther e may not yet be full agreement.
Data source: GLOBOCAN 2012
Map production: IARC
World Health Organizatio n
No data
Stomach (3)
Cervix uteri (9)
Lung (1)
Breast (18)
No data
Breast (24)
Cervix uteri (7)
No data
Stomach (1)
Prostate (30)
Males Females
Incidence
Mortality
No data
Stomach (5)
Prostate (22)
Lung (4)
109salud pública de méxico / vol. 58, no. 2, marzo-abril de 2016
Cancer patterns and tr ends in Latin America A RT ÍCULO ORIGIN A L
FIGU RE 2. LEADIN G CAU SES OF CAN CER IN CID EN CE AN D M ORTALIT Y AM ON G M ALES AN D FEM ALES BY COU N T RY, LAC REGION
The boundaries and names shown and the designations used on this map do not imply the expression of any opinion
whatsoever on the part of the World Health Organization concerning the legal status of any country, territory, city or area
or of its authorities, or concerning the delimitation of its frontiers or boundaries. Dotted and dashed lines on maps
represent approximate border lines for which there may not yet be full agreement.
Data source: GLOBOCAN 2012
Map production: IARC
World Health Organizatio n
No data
Stomach (3)
Cervix uteri (9)
Lung (1)
Breast (18)
No data
Breast (24)
Cervix uteri (7)
No data
Stomach (1)
Prostate (30)
Males Females
Incidence
Mortality
No data
Stomach (5)
Prostate (22)
Lung (4)
Overall Prostate Cancer Burden in LA 2'
GLOBOCAN 2012 v1.0. http://globocan.iarc.fr.
• In Central America and the Caribbean, prostate cancer is the leading cause of cancer death in men, whereas it is the second cause of cancer death in men South America and the third in North America.
• The number of new prostate cancer cases and deaths will almost double by 2030 in Latin America and the Caribbean if current trends continue.
Proportion of new cases and deaths from prostate cancer in the Americas
Incidence Mortality
Prostate cancer incidence and mortality rate, by country, 2012
Number of new cases and deaths from prostate cancer in 2012 and 2030
Prostate Cancer in the Americas
Prostate cancer is the most common cancer in men in the Americas, and the second leading cause of cancer deaths. There are more than 412,000 new cases and 85,000 deaths each year in the Americas.
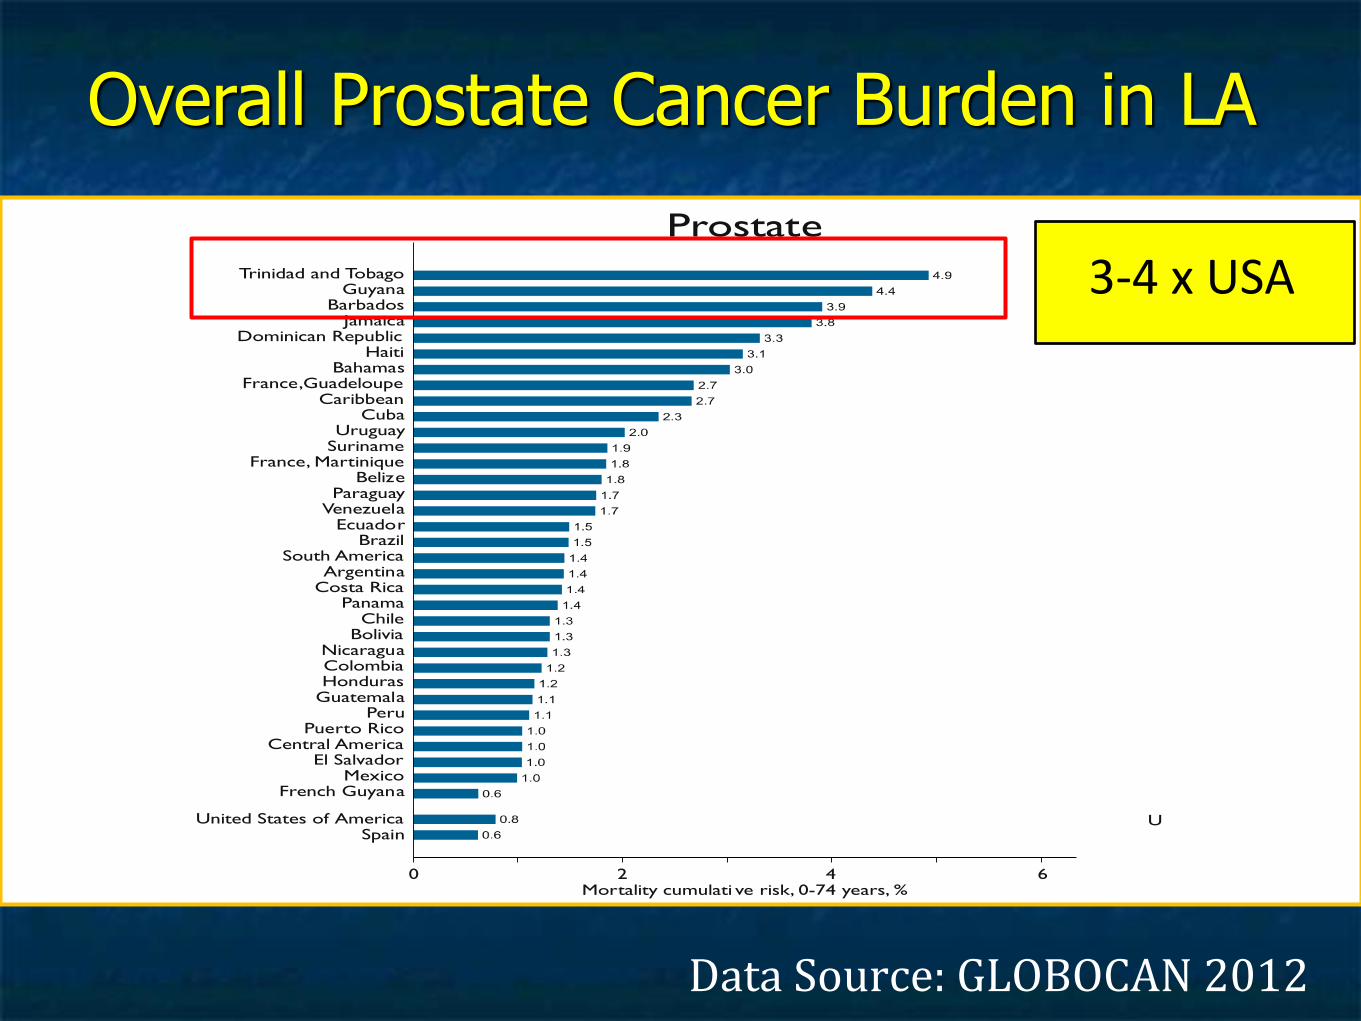
Overall Prostate Cancer Burden in LA
Data Source: GLOBOCAN 2012
A RT ÍCULO ORIGIN A L
110 salud pública de méxico / vol. 58, no. 2, marzo-abril de 2016
Bray F, Piñeros M
FIGU RE 3. CU M U LAT IVE RISK OF M ORTALIT Y FOR SIX COM M ON CAN CERS BY COU N T RY AN D SEX , LAC REGION
FemalesMales
Trinidad and TobagoGuyana
BarbadosJamaica
Dominican RepublicHaiti
BahamasFrance,Guadeloupe
CaribbeanCuba
UruguaySuriname
France, MartiniqueBelize
ParaguayVenezuela
EcuadorBrazil
South AmericaArgentina
Costa RicaPanama
ChileBolivia
NicaraguaColombiaHonduras
GuatemalaPeru
Puerto RicoCentral America
El SalvadorMexico
French Guyana
United States of AmericaSpain
Prostate
0 2 4 6Mortality cumulati ve risk, 0-74 years, %
BahamasTrinidad and Tobago
UruguayBarbadosArgentina
GuyanaJamaica
CubaSurinameParaguay
CaribbeanBrazil
Costa RicaSouth America
BelizePuerto Rico
VenezuelaFrance, GuadeloupeDominican Republic
French GuyanaChile
PanamáFrance, Martinique
HaitiColombiaNicaragua
EcuadorMexico
Central AmericaEl Salvador
PeruHonduras
BoliviaGuatemala
United States of AmericaSpain
Breast
0 2 4 6Mortality cumulati ve risk, 0-74 years, %
Cervix uteri
GuyanaBolivia
NicaraguaFrench Guayana
SurinameParaguay
BelizeEcuador
HondurasDominican RepublicTrinidad and Tobago
HaitiPeru
VenezuelaJamaica
GuatemalaEl Salvador
Central AmericaSouth America
CaribbeanMexico
ColombiaArgentina
BrazilBahamasPanama
UruguayCuba
BarbadosChile
France, GuadeloupeCosta Rica
France, MartiniquePuerto Rico
United States of AmericaSpain
0 2 4 6Mortality cumulati ve risk, 0-74 years, %
Lung
UruguayCuba
ArgentinaJamaica
CaribbeanParaguay
Trinidad and TobagoVenezuela
South AmericaSuriname
BrazilChile
BahamasBelize
ColombiaDominican Republic
Puerto RicoFrance, Guadeloupe
PanamaFrance, Martinique
MexicoPeru
French GuyanaCentral America
BarbadosEcuador
NicaraguaCosta RicaHonduras
GuyanaGuatemalaEl Salvador
HaitiBolivia
SpainUnited States of America
6 4 2 0 2 4 6Mortality cumulati ve risk, 0-74 years, %
(continues…)
3-4 x USA
Data Source: IARC WHO Mortality Cancer Database
113salud pública de méxico / vol. 58, no. 2, marzo-abril de 2016
Cancer patterns and trends in Latin America A RT ÍCULO ORIGIN A L
* Regional registries
Source: IARC-CI5 Series; WHO Cancer Mortality Catabase
FIGU RE 6. T REN DS IN PROSTAT E CAN CER IN CID EN CE (6A) AN D M ORTALIT Y RAT ES (6B) (ASR PER 100 000)
Brazil*
Colombia*
Costa Rica
Ecuador*
Spain*
USA*
1520
2530
4050
6070
100
110
120
150
180
Age
-sta
ndar
dize
d (w
orl
d) in
cide
nce
rate
per
100
000
, mal
es
1980 1990 2000 2010
Year
A
67
89
1012
1520
25
Age
-sta
ndar
dize
d (w
orl
d) m
ort
alit
y ra
te p
er 1
00 0
00, M
ales
1980 1990 2000 2010
Year
Argentina
Brazil
Chile
Colombia
Cuba
Mexico
Spain
USA
CostaRica
B
2.5
33.
54
56
78
910
1215
19
Age
-sta
ndar
dize
d (w
orl
d) m
ort
alit
y ra
te p
er 1
00 0
00, m
ales
1980 1990 2000 2010
Year
Argentina
Brazil
Chile
Colombia
Cuba
Mexico
Spain
USA
CostaRica
A
2.5
33.
54
56
78
910
1214
Age
-sta
ndar
dize
d (w
orl
d) m
ort
alit
y ra
te p
er 1
00 0
00, f
emal
es
1980 1990 2000 2010
Year
Argentina
Brazil
ChileColombia
Cuba
Mexico
Spain
USA
CostaRica
B
Source: reference 7
FIGU RE 7. T REN DS IN COLORECTAL CAN CER MORTALIT Y RAT ES, MALES (7A) AN D FEMALES (7B) (ASR PER 100 000)
Trends in Prostate Cancer Incidence
Trends in Prostate Cancer Incidence and Mortality (all ages per 100.000)
Sierra et al. Cancer Epidemiology 44: 131–140, 2016
Incidence/Mortality Ratio of Prostate Cancer vs GDP per capita
PAHO 2014 2016
• The highest prostate cancer incidence and mortality rates are found in the Caribbean, particularly Barbados, Trinidad and Tobago and Guyana
• The United States and Canada have the lowest mortality rates for prostate cancer, in spite of their high incidence rates.
Incidence/mortality ratio of prostate cancer compared to GDP per capita (current US$) by country, 2012
• While in Canada there is 1 death for every 9 new cases of prostate cancer, in Haiti and Nicaragua, there is 1 death for approximately every 2 new cases of prostate cancer.
• In general terms, countries with the highest Gross Domestic Product per capita* (GDP) have the
highest incidence/mortality ratios for prostate cancer.
Sources: GLOBOCAN 2012 (IARC), available from: http://globocan.iarc.fr/ ; The World Bank Group 2014 Indicators; available from: http://data.worldbank.org/indicator/NY.GDP.PCAP.CD * 2011 GDP per capita (current US$)
Mortality Trends versus Country
Data Source: GLOBOCAN 2012
Country Mortality Trends
Brazil
Cuba
Actions to Improve Prostate Cancer Oucomes
• Increase financial resources for cancer control
• Restructure health-care systems
• Optimise oncology workforce to meet regional needs
• Improve technical resources and services for cancer prevention and treatment
• Invest in research and evidence-based cancer care relevant to the region
• Invest in education •
Lancet Oncol 2015; 16: 1405–38
Prostate Cancer Control Programmes
Sierra et al. Cancer Epidemiology 44: 131–140, 2016
• Countries have recently made PC a priority in their national cancer plans and have developed guidelines for the detection, diagnosis, treatment, and f/u
- Brazil (2002),
- Colombia (2013)
- Costa Rica (2011)
- El Salvador (2015)
- Mexico (2010)
- Nicaragua (2010)
- Peru (2010)
190,954 studies (190 countries)
48.313 studies in Cancer.
CANCER TRIALS (CLINICALTRIALS.GOV)
Source: www.ClinicalTrials.gov Accessed May 22nd, 2015
56%
4,5%
Cooperative Groups Worldwide
Institutional Guidelines
Manual de Oncologia do Brasil
NCCN Prostate Cancer Guideline
Version I.2014
Version for Latin America - LACOG Panel of Reviewers
Meeting 21 February 2014, São Paulo, Brazil
NCCN Prostate Cancer Guideline
Version 2.2016
Version for Latin America - LACOG Panel of Reviewers