2017-22 Strategic Plan ∣ Strategic Measures Summary VISION: A respected partner, providing a sustainable retirement system and health care program for those who serve California MISSION: Deliver retirement and health care benefits to members and their beneficiaries CORE VALUES: Quality, Respect, Accountability, Integrity, Openness, Balance EPR First Quarter Report: Strategic Measures Summary Dashboard The CalPERS 2017-22 Strategic Plan encompasses 37 Strategic Measures (Measures) that enable us to track our progress towards achieving our strategic goals and objectives. The Strategic Measures Summary Dashboard provides a brief synopsis of how all 37 Measures are performing for the first quarter (July 1, 2017 – September 30, 2017), as well as revisions to Measures since the July 2017 Board Offsite. Additional performance details can be found on the summary sheets for each Measure. First Quarter Measure Performance: • 11 On-Target (Green) • 2 At-Risk (Yellow) • 3 Off-Target (Red) • 9 Pending refresh • 6 Data not available • 5 Measures under development • 1 Presented in Closed Session Thresholds have been established for each Measure to assess performance and identify whether each respective Measure is On-Target, At-Risk, or Off-Target. The tables below captures feedback and updates to Measures from the July 2017 Board Offsite: FUND SUSTAINABILITY Strategic Measure Feedback Updates Projected funded status Revisit threshold ranges to clarify negative ranges Threshold ranges have been amended appropriately 1-year total expected fund volatility Consider a 4-year timeframe Impacts of the 4-year ALM cycle have been addressed in narrative Investment managers’ policies and procedures for ESG factor integration Consider reflecting thresholds as percentages Threshold ranges have been amended to reflect percentages Agenda Item 12 - Attachment B - Page 1 of 60
Transcript
2017-22 Strategic Plan ∣ Strategic Measures Summary VISION: A respected partner, providing a sustainable retirement system and health care program for those who serve California MISSION: Deliver retirement and health care benefits to members and their beneficiaries CORE VALUES: Quality, Respect, Accountability, Integrity, Openness, Balance
EPR First Quarter Report: Strategic Measures Summary Dashboard
The CalPERS 2017-22 Strategic Plan encompasses 37 Strategic Measures (Measures) that enable us to track our progress towards achieving our strategic goals and objectives. The Strategic Measures Summary Dashboard provides a brief synopsis of how all 37 Measures are performing for the first quarter (July 1, 2017 – September 30, 2017), as well as revisions to Measures since the July 2017 Board Offsite. Additionalperformance details can be found on the summary sheets for each Measure.
First Quarter Measure Performance: • 11 On-Target (Green)• 2 At-Risk (Yellow)• 3 Off-Target (Red)• 9 Pending refresh• 6 Data not available• 5 Measures under development• 1 Presented in Closed Session
Thresholds have been established for each Measure to assess performance and identify whether each respective Measure is On-Target, At-Risk, or Off-Target.
The tables below captures feedback and updates to Measures from the July 2017 Board Offsite:
FUND SUSTAINABILITY
Strategic Measure Feedback Updates
Projected funded status Revisit threshold ranges to clarify negative ranges
Threshold ranges have been amended appropriately
1-year total expected fund volatility Consider a 4-year timeframe Impacts of the 4-year ALM cycle have been addressed in narrative
Investment managers’ policies and procedures for ESG factor integration
Consider reflecting thresholds as percentages
Threshold ranges have been amended to reflect percentages
Agenda Item 12 - Attachment B - Page 1 of 60
HEALTH CARE AFFORDABILITY
Strategic Measure Feedback Updates
Opioids - dose Revisit focus on prescription volume
New Measure; focuses on Morphine Milligram Equivalent (MME) per member, per year
Opioids - duration Consider focusing on duration of opioid use
Measure now focuses on duration of opioids use
Mental health and well being Data availability concerns; replace with an appropriate measure
Measure is under develoment
C-section rate Replace with a measurable indicator (i.e. region based)
Measure is under development
Hospital readmissions Focus on readmissions, and revisit thresholds
Measure now focuses on readmissions, and thresholds are under development
REDUCE COMPLEXITY
Strategic Measure Feedback Updates
CEM pension benchmarking survey – pension complexity score
Clarify threshold percentages Thresholds percentages have been revised
Total overhead cost Measure target should include an actual dollar amount
Target will be revisited when baseline is established in May 2018
Agenda Item 12 - Attachment B - Page 2 of 60
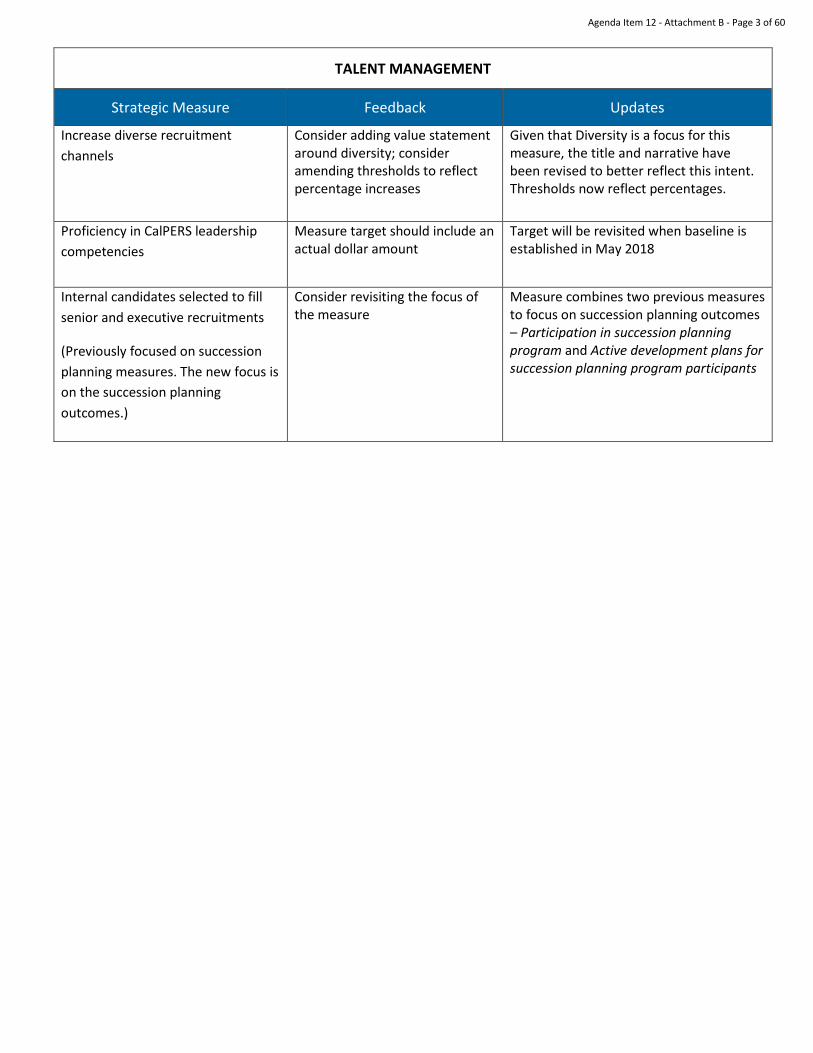
TALENT MANAGEMENT
Strategic Measure Feedback Updates
Increase diverse recruitment channels
Consider adding value statement around diversity; consider amending thresholds to reflect percentage increases
Given that Diversity is a focus for this measure, the title and narrative have been revised to better reflect this intent. Thresholds now reflect percentages.
Proficiency in CalPERS leadership competencies
Measure target should include an actual dollar amount
Target will be revisited when baseline is established in May 2018
Internal candidates selected to fill senior and executive recruitments
(Previously focused on succession planning measures. The new focus is on the succession planning outcomes.)
Consider revisiting the focus of the measure
Measure combines two previous measures to focus on succession planning outcomes – Participation in succession planningprogram and Active development plans forsuccession planning program participants
Agenda Item 12 - Attachment B - Page 3 of 60
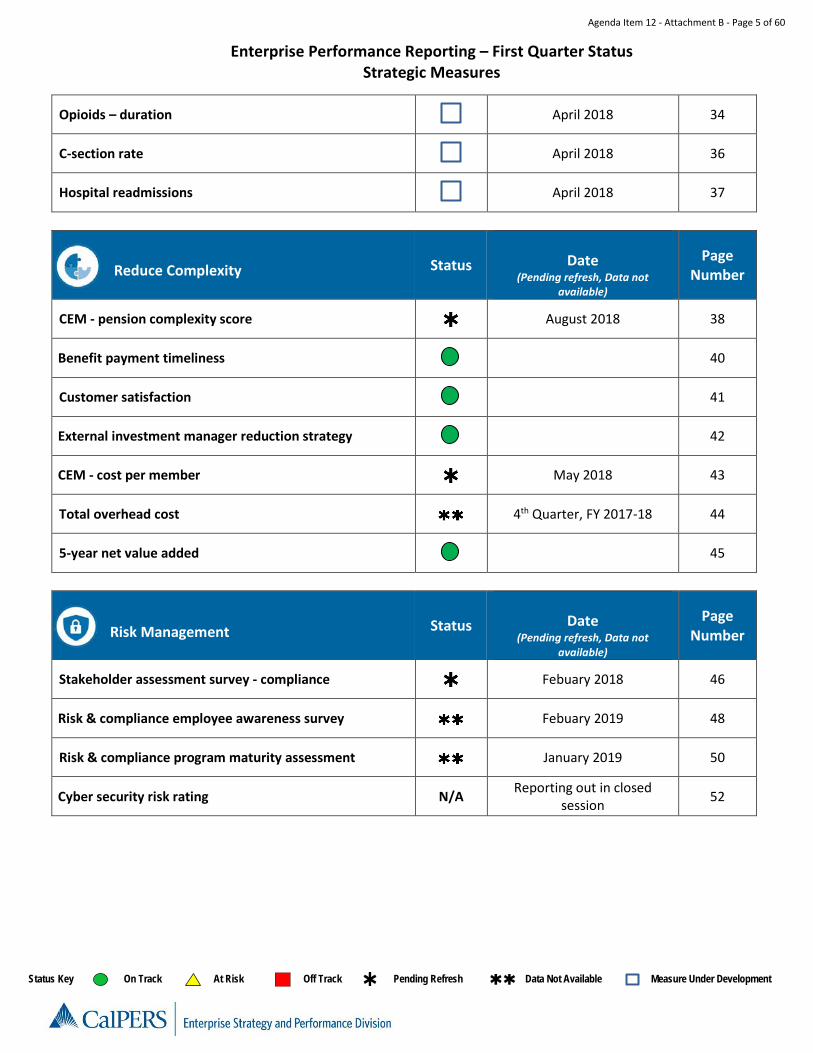
Enterprise Performance Reporting – First Quarter Status
Strategic Measures
Status Key On Track At Risk Off Track Pending Refresh Data Not Available Measure Under Development
Fund Sustainability
Status
Date
(Pending refresh, Data not available)
Page Number
Probability of PERF falling below 50% funded over the next 30 years 7
Probability of sharp single year increase in employer contribution rates 9
Probability of high employer contribution rates 11
Funded Status 13
Projected Funded Status August 2018 15
1-year total expected fund volatility 17
Annualized (5-year) excess investment returns relative to total fund policy benchmark 19
Risk & compliance program maturity assessment January 2019 50
Cyber security risk rating N/A Reporting out in closed session 52
Agenda Item 12 - Attachment B - Page 5 of 60
Enterprise Performance Reporting – First Quarter Status
Strategic Measures
Status Key On Track At Risk Off Track Pending Refresh Data Not Available Measure Under Development
Talent Management
Status
Date
(Pending refresh, Data not available)
Page Number
Increase diverse recruitment channels July 2018 53
Workforce diversity & inclusion 55
Employee engagement survey December 2017 57
Proficiency in CalPERS leadership competencies August 2018 58
Internal candidates selected to fill senior and executive recruitments August 2018 59
Agenda Item 12 - Attachment B - Page 6 of 60
2017-22 Strategic Plan Measure Summary VISION: A respected partner, providing a sustainable retirement system and health care program for those who serve California MISSION: Deliver retirement and health care benefits to members and their beneficiaries CORE VALUES: Quality, Respect, Accountability, Integrity, Openness, Balance
Status Key: On Track At Risk Off Track
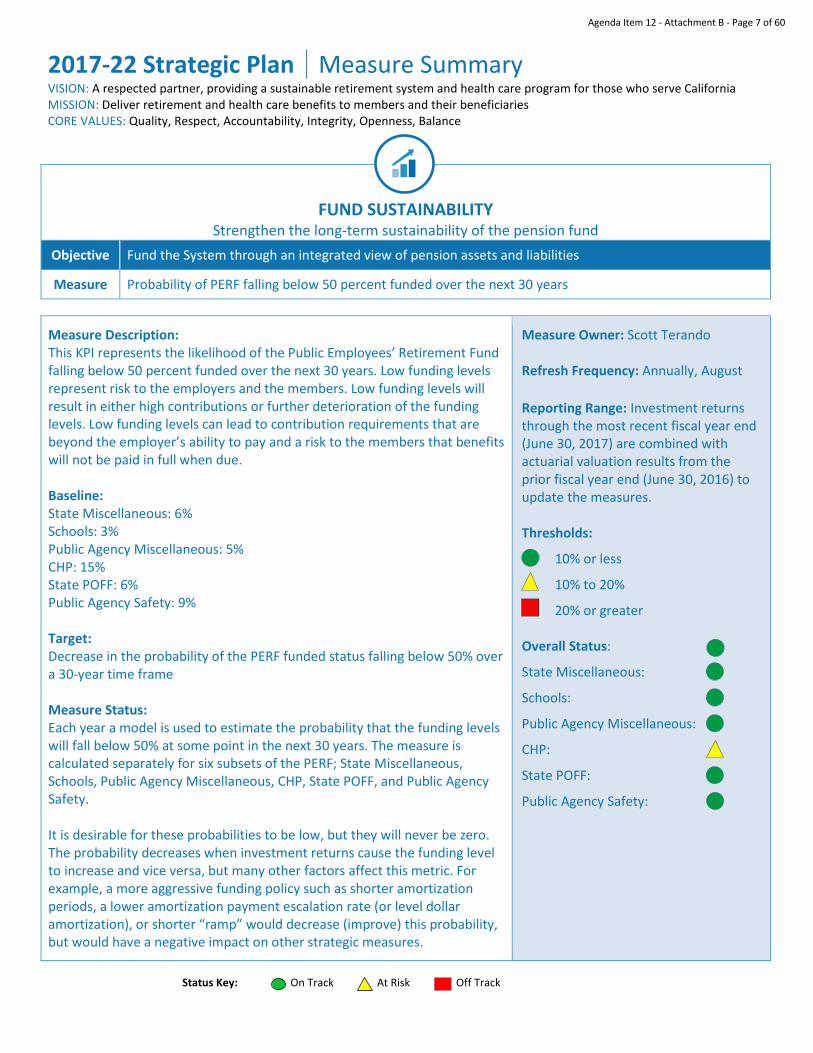
FUND SUSTAINABILITY Strengthen the long-term sustainability of the pension fund
Objective Fund the System through an integrated view of pension assets and liabilities
Measure Probability of PERF falling below 50 percent funded over the next 30 years
Measure Description: This KPI represents the likelihood of the Public Employees’ Retirement Fund falling below 50 percent funded over the next 30 years. Low funding levels represent risk to the employers and the members. Low funding levels will result in either high contributions or further deterioration of the funding levels. Low funding levels can lead to contribution requirements that are beyond the employer’s ability to pay and a risk to the members that benefits will not be paid in full when due. Baseline: State Miscellaneous: 6% Schools: 3% Public Agency Miscellaneous: 5% CHP: 15% State POFF: 6% Public Agency Safety: 9% Target: Decrease in the probability of the PERF funded status falling below 50% over a 30-year time frame Measure Status: Each year a model is used to estimate the probability that the funding levels will fall below 50% at some point in the next 30 years. The measure is calculated separately for six subsets of the PERF; State Miscellaneous, Schools, Public Agency Miscellaneous, CHP, State POFF, and Public Agency Safety. It is desirable for these probabilities to be low, but they will never be zero. The probability decreases when investment returns cause the funding level to increase and vice versa, but many other factors affect this metric. For example, a more aggressive funding policy such as shorter amortization periods, a lower amortization payment escalation rate (or level dollar amortization), or shorter “ramp” would decrease (improve) this probability, but would have a negative impact on other strategic measures.
Measure Owner: Scott Terando Refresh Frequency: Annually, August Reporting Range: Investment returns through the most recent fiscal year end (June 30, 2017) are combined with actuarial valuation results from the prior fiscal year end (June 30, 2016) to update the measures. Thresholds:
10% or less
10% to 20%
20% or greater
Overall Status:
State Miscellaneous:
Schools:
Public Agency Miscellaneous:
CHP:
State POFF:
Public Agency Safety:
Agenda Item 12 - Attachment B - Page 7 of 60
More conservative assumptions can have a negative impact on this measure initially but a positive impact in the long run. For example, reducing the Measure Status continued: discount rate lowers the current funding levels and can increase this probability for a plan that is already close to 50 percent funded. However, if a lower discount rate means a lower likelihood of actuarial losses in the future, this probability would be expected to decrease (improve) later. One action that causes an immediate improvement in this metric is when an employer makes an additional payment towards the unfunded liability. Public agencies continue to make additional payments and this year the State is contributing $6 Billion above the required contribution.
Initiatives and Projects: The current ALM cycle will conclude in 2017, and these measures will assist in analyzing the impact of any strategic asset allocation decisions. The Actuarial Amortization Policy is reviewed in compliance with the Enterprise Compliance Division’s Policy Process.
Agenda Item 12 - Attachment B - Page 8 of 60
2017-22 Strategic Plan Measure Summary VISION: A respected partner, providing a sustainable retirement system and health care program for those who serve California MISSION: Deliver retirement and health care benefits to members and their beneficiaries CORE VALUES: Quality, Respect, Accountability, Integrity, Openness, Balance
Status Key: On Track At Risk Off Track
FUND SUSTAINABILITY Strengthen the long-term sustainability of the pension fund
Objective Fund the System through an integrated view of pension assets and liabilities
Measure Probability of sharp single year increase in contribution rates
Measure Description: This KPI represents the likelihood of sharp single year increases in contribution rates. Sharp increases in contribution rates can impose financial strain on employers and may increase the risk that employers fail to make their required contributions. Baseline: State Miscellaneous: 0% Schools: 0% Public Agency Miscellaneous: 0% CHP: 1% State POFF: 0% Public Agency Safety: 0% Target: Low probability of a single year employer contribution rate increase of 5% of payroll for miscellaneous or 7% of payroll for safety Measure Status: Each year a model is used to estimate the probability that the employer contribution rates will increase by 5% of payroll (7% for Safety plans) in a single year at some point in the next 30 years. The measure is calculated separately for six subsets of the PERF; State Miscellaneous, Schools, Public Agency Miscellaneous, CHP, State POFF, and Public Agency Safety. It is desirable for these probabilities to be low, but the goal is not for these probabilities to be zero. There will always be a chance that future extraordinary and/or successive actuarial losses will require a sharp increase in employer contribution rates. Increases in employer contribution rates can occur when actuarial losses (particularly investment losses) occur, or there are changes in actuarial assumptions. Unfunded liabilities from these events are amortized over extremely long periods (30 years for losses and 20 years for assumption changes) precisely to avoid sharp increases in contribution rates.
Measure Owner: Scott Terando Refresh Frequency: Annually, August Reporting Range: Investment returns through the most recent fiscal year end (June 30, 2017) are combined with actuarial valuation results (June 30, 2016) to update the measures. Thresholds:
10% or less
10% to 20%
20% or greater
Overall Status:
State Miscellaneous:
School:
Public Agency Miscellaneous:
CHP:
State POFF:
Public Agency Safety
Agenda Item 12 - Attachment B - Page 9 of 60
Measure Status continued: There is also a 5 year ramp up and ramp down built into the amortization schedules, which further smooths the contribution rates. Increases in employer contribution rates can also occur with a change in actuarial methodology such as shortening the amortization period. The impact on employer contribution rates would be thoroughly analyzed before making any such change.
Initiatives and Projects: The Actuarial Amortization Policy is reviewed in compliance with the Enterprise Compliance Division’s Policy Process.
Agenda Item 12 - Attachment B - Page 10 of 60
2017-22 Strategic Plan Measure Summary VISION: A respected partner, providing a sustainable retirement system and health care program for those who serve California MISSION: Deliver retirement and health care benefits to members and their beneficiaries CORE VALUES: Quality, Respect, Accountability, Integrity, Openness, Balance
Status Key: On Track At Risk Off Track
FUND SUSTAINABILITY Strengthen the long-term sustainability of the pension fund
Objective Fund the System through an integrated view of pension assets and liabilities
Measure Probability of high employer contribution rates
Measure Description: This KPI represents the likelihood of high employer contribution rates. High employer contribution rates impose significant financial stress and may increase the risk the employers will default and be unable to make their required contributions. Baseline: State Miscellaneous: 73% Schools: 4% Public Agency Miscellaneous: 11% CHP: 100% State POFF: 69% Public Agency Safety: 78% Target: Decrease in the probability of employer contribution rates exceeding 35% of payroll for miscellaneous or 55% of payroll for safety Measure Status: Each year a model is used to estimate the probability that the employer contribution rates will exceed 35% of payroll (55% for Safety plans) at some point in the next 30 years. The measure is calculated separately for six subsets of the PERF; State Miscellaneous, Schools, Public Agency Miscellaneous, CHP, State POFF, and Public Agency Safety. It is desirable for these probabilities to be low, but they will never be zero. The probability decreases when investment returns cause the contribution rates to decrease and vice versa, but many other factors affect this metric. A more aggressive funding policy such as shorter amortization periods can have a negative impact on this measure initially but a positive impact in the long run. For example, amortizing gains and losses over 10 years could cause this probability to increase, because a future loss would cause a larger increase in the employer contribution rate. Eventually though, in any given
Measure Owner: Scott Terando Refresh Frequency: Annually, August Reporting Range: Investment returns through the most recent fiscal year end (June 30, 2017) are combined with actuarial valuation results (June 30, 2016) to update the measures. Thresholds:
10% or less
10% to 20%
20% or greater
Overall Status:
State Miscellaneous:
Schools:
Public Agency Miscellaneous:
CHP:
State POFF:
Public Agency Safety:
Agenda Item 12 - Attachment B - Page 11 of 60
year the employer would only be paying for the previous 10 years of gains and losses rather than the previous 30 years. Measure Status continued: One action that causes an immediate improvement in this metric is when an employer makes an additional payment towards the unfunded liability. Public agencies continue to make additional payments and this year the State is contributing $6 Billion above the required contribution.
Initiatives and Projects: In November 2017, an ALM workshop will be conducted with the Board to evaluate potential policy portfolios that best balance the long-term investment objectives, risk appetite and tolerances (thresholds), and liquidity constraints.
Agenda Item 12 - Attachment B - Page 12 of 60
2017-22 Strategic Plan Measure Summary VISION: A respected partner, providing a sustainable retirement system and health care program for those who serve California MISSION: Deliver retirement and health care benefits to members and their beneficiaries CORE VALUES: Quality, Respect, Accountability, Integrity, Openness, Balance
Status Key: On Track At Risk Off Track
FUND SUSTAINABILITY Strengthen the long-term sustainability of the pension fund
Objective Fund the System through an integrated view of pension assets and liabilities
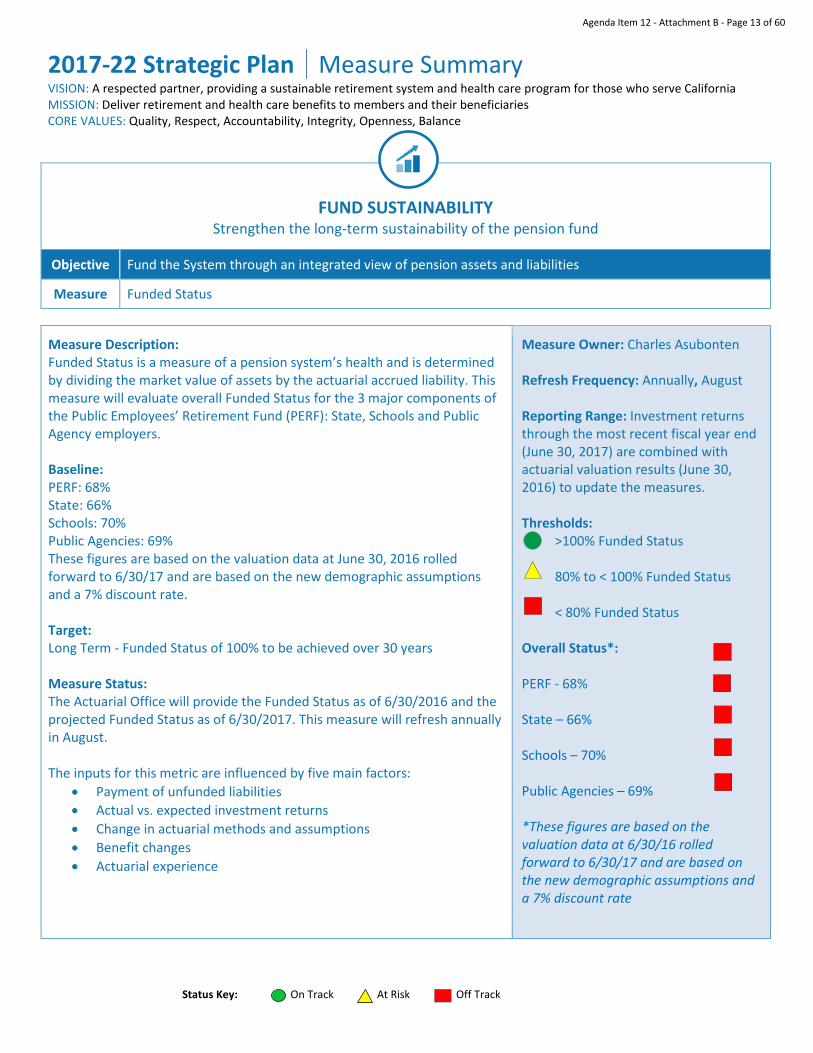
Measure Funded Status
Measure Description: Funded Status is a measure of a pension system’s health and is determined by dividing the market value of assets by the actuarial accrued liability. This measure will evaluate overall Funded Status for the 3 major components of the Public Employees’ Retirement Fund (PERF): State, Schools and Public Agency employers. Baseline: PERF: 68% State: 66% Schools: 70% Public Agencies: 69% These figures are based on the valuation data at June 30, 2016 rolled forward to 6/30/17 and are based on the new demographic assumptions and a 7% discount rate. Target: Long Term - Funded Status of 100% to be achieved over 30 years Measure Status: The Actuarial Office will provide the Funded Status as of 6/30/2016 and the projected Funded Status as of 6/30/2017. This measure will refresh annually in August. The inputs for this metric are influenced by five main factors:
• Payment of unfunded liabilities • Actual vs. expected investment returns • Change in actuarial methods and assumptions • Benefit changes • Actuarial experience
Measure Owner: Charles Asubonten Refresh Frequency: Annually, August Reporting Range: Investment returns through the most recent fiscal year end (June 30, 2017) are combined with actuarial valuation results (June 30, 2016) to update the measures. Thresholds: >100% Funded Status
80% to < 100% Funded Status
< 80% Funded Status
Overall Status*: PERF - 68%
State – 66%
Schools – 70%
Public Agencies – 69%
*These figures are based on the valuation data at 6/30/16 rolled forward to 6/30/17 and are based on the new demographic assumptions and a 7% discount rate
Agenda Item 12 - Attachment B - Page 13 of 60
Measure Status continued: As part of the CalPERS ALM cycle, the Board will examine the current Funded Status of the system and make decisions in alignment with the goal of strengthening the long-term sustainability of the pension fund. CalPERS is also focused on reducing complexity and system costs which will contribute positively to the Funded Status of the PERF.
Initiatives and Projects: November 2017- an ALM workshop will be conducted with the Board to evaluate potential policy portfolios that best balance the long-term investment objectives, risk appetite and tolerances (thresholds), and liquidity constraints. Business Plan Initiatives - Alignment of asset liability management; Employer contractng and collection reporting; Redesign and enhance the actuarial valuation system
Agenda Item 12 - Attachment B - Page 14 of 60
2017-22 Strategic Plan Measure Summary VISION: A respected partner, providing a sustainable retirement system and health care program for those who serve California MISSION: Deliver retirement and health care benefits to members and their beneficiaries CORE VALUES: Quality, Respect, Accountability, Integrity, Openness, Balance
Status Key: On Track At Risk Off Track
FUND SUSTAINABILITY Strengthen the long-term sustainability of the pension fund
Objective Fund the System through an integrated view of pension assets and liabilities
Measure Projected Funded Status
Measure Description: Monitoring the actual vs. projected Funded Status of the PERF to determine if CalPERS’ goal of 100% funding is on track. Baseline: PERF: 68% State: 66% Schools: 70% Public Agencies: 69% These figures are based on the valuation data at June 30, 2016 rolled forward to 6/30/17 and are based on the new demographic assumptions and a 7% discount rate. Baseline for the PERF will be established annually in August using annual actuarial valuation reports. Target: Meet or exceed projected funded status based on actuarial valuation reports. Measure Status: The Actuarial Office will provide the Funded Status as of 6/30/2016 and the projected Funded Status as of 6/30/2017. This measure will refresh annually in August. The inputs for this metric are influenced by five main factors:
• Payment of unfunded liabilities • Actual vs. expected investment returns • Change in actuarial methods and assumptions • Benefit changes • Actuarial experience
Measure Owner: Charles Asubonten Refresh Frequency: Annually, August Reporting Range: Investment returns through the most recent fiscal year end (June 30, 2017) are combined with actuarial valuation results (June 30, 2016) to update the measures. Thresholds: Not more than 1.0% below projected funded status 1.0% - 3.0% below projected funded status More than 3.0% below projected funded status Status: Pending refresh – August 2018
Agenda Item 12 - Attachment B - Page 15 of 60
Measure Status continued: Annually, the Actuarial Office produces valuation reports for the State, Schools and Public Agency employers to determine minimum employer contribution requirements and the Funded Status of each plan. Because Funded Status changes slowly over time, it is important to monitor performance trends to indicate if long-term funding goals are on track.
Initiatives and Projects: Business Plan Initiatives – Alignment of asset liability management; Employer contracting and collection reporting; Redesign and enhance the actuarial valuation system
Agenda Item 12 - Attachment B - Page 16 of 60
2017-22 Strategic Plan Measure Summary
VISION: A respected partner, providing a sustainable retirement system and health care program for those who serve California MISSION: Deliver retirement and health care benefits to members and their beneficiaries CORE VALUES: Quality, Respect, Accountability, Integrity, Openness, Balance
Status Key: On Track At Risk Off Track
FUND SUSTAINABILITY Strengthen the long-term sustainability of the pension fund
Objective Mitigate the risk of significant investment loss
Measure 1-year total expected fund volatility
Measure Description: The total (gross) risk of the Total Fund expressed in the standard deviation (1-yr) of the funds’ total return distribution, expressed in percent. Reported on a fiscal year-end basis, the metric will measure the expected volatility of the Total Fund returns Baseline: Current Barra volatility estimate for PERF is 8.3%, as of June 30, 2016 Target: Current total expected fund volatility is 8% or less; target derived through the capital market assumption process used in the most recent Asset Liability Management (ALM) Process which is set every four years. A new target is expected to be set with the November 2017 ALM Cycle, to be effective July 1, 2018 Current target was established in 2016, when based upon expected long-term capital markets outlook and CalPERS’ risk tolerance, the Investment Committee approved changes to the interim Asset Allocation Targets to reduce the Total Fund risk. *Timeframe to achieve this target is greater than 5 years. Measure Status: Current forecast volatility of 8.3% vs. 10.4% in prior year
• 0.5% risk reduction from asset allocation changes • Recent low-volatility market conditions explain remainder of
reduction in forecast • Implies 24% chance of negative returns in a given year • Growth assets, especially public equities, remain the primary drivers
of total volatility • Forecast active tracking error of 0.5% is within guidelines of 1.5%
Measure Owner: Ted Eliopoulos & Wylie Tollette Refresh Frequency: Annually, August Reporting Range: FY 2016-17 Thresholds: Equal to or less than target
1- 50 bps excess of target
51 bps or more excess of target Status:
Agenda Item 12 - Attachment B - Page 17 of 60
Measure Status continued: Current status reflects current Barra volatility estimate for PERF as 8.3%, which exceeds target of 8% by 30 bps Variance of returns over the reporting time period due to today’s challenging investment environment. Increased focus on liquidity and income due to the cash flow requirements of CalPERS, reduced return expectations across many asset classes, and increased risk and complexity of interrelated global financial markets can affect deviations from stated capital market assumptions.
Initiatives and Projects: Business Plan Initiative – Invesment risk management and performance attribution
Agenda Item 12 - Attachment B - Page 18 of 60
2017-22 Strategic Plan Measure Summary VISION: A respected partner, providing a sustainable retirement system and health care program for those who serve California MISSION: Deliver retirement and health care benefits to members and their beneficiaries CORE VALUES: Quality, Respect, Accountability, Integrity, Openness, Balance
Status Key: On Track At Risk Off Track
FUND SUSTAINABILITY Strengthen the long-term sustainability of the pension fund
Measure Annualized (5-year) excess investment returns relative to Total Fund policy benchmark
Measure Description: Measures annualized 5-year excess investment returns relative to the Total Fund policy benchmark, which is a composite established by the Investment Committee-assigned asset class benchmarks and the target weights derived from the Asset Liability Management (ALM) process. Reported on a fiscal year-end basis, the metric will measure the effectiveness of the Investment Office in meeting the objective of achieving superior investment performance relative to relevant targets. The actual performance generated by the portfolio is affected by both the active under- or over-weighting of the asset classes within their policy ranges, as well as the performance of the individual asset classes vs. their specified policy benchmark. Baseline: As of June 30, 2017, the Public Employees’ Retirement Fund (PERF) outperformed the Total Fund policy benchmark by 23 bps, for the 5-year period Target: Meet or exceed the Total Fund policy benchmark. Policy benchmark weights are fixed and do not vary except by Investment Committee action, such as the approval of interim target weights. Measure Status: Relative to the policy benchmark, the PERF generated solid returns over the five-year period, 8.83 percent which exceeded the actuarial target of 7.5 percent, and a Total Net Rate Return of 8.83 which exceeded the policy benchmark by 23 basis points.
Measure Owner: Ted Eliopoulos & Wylie Tollette Refresh Frequency: Annually, August Reporting Range: FY 2012-13 through FY 2016-17 Thresholds: Exceed Total Fund Policy Benchmark Meet or Trail Total Fund Policy Benchmark by up to 10 bps Trail Total Fund Policy Benchmark by 10bps or more Status:
Agenda Item 12 - Attachment B - Page 19 of 60
Measure Status continued: The Investment Office executive staff developed the INVO 2020 Vision, which is a 5-year strategic plan that defines long-term direction and support of the CalPERS Strategic Plan while addressing management of the CalPERS Investment portfolio in a cost-effective, transparent, and risk-aware manner.
Initiatives and Projects: Business Plan Initiatives – Enhance capital allocation framework; Enhance investment platform and controls; Investment program long-term planning
Agenda Item 12 - Attachment B - Page 20 of 60
2017-22 Strategic Plan Measure Summary VISION: A respected partner, providing a sustainable retirement system and health care program for those who serve California MISSION: Deliver retirement and health care benefits to members and their beneficiaries CORE VALUES: Quality, Respect, Accountability, Integrity, Openness, Balance
Status Key: On Track At Risk Off Track
FUND SUSTAINABILITY
Strengthen the long-term sustainability of the pension fund
Objective Educate employers, members, and stakeholders on system risks and mitigation strategies
Measure Stakeholder assessment survey - risk
Measure Description: The measure scores the overall stakeholder perception of CalPERS' success in explaining and mitigating risks to the System. Data is gathered through the annual Stakeholder Perception Survey in response to the statement "I understand the risks inherent in the System and I am confident CalPERS is taking steps to reduce the risks." Baseline: 5.17 out of 7 possible points Target: Five-year goal: achieve a score of 5.43 out of 7; a 5% increase from the baseline. Annual increases of 1% (0.05 points). This target will be met through continued stakeholder engagement, proactive communications with our various member/employer/retiree populations, and through focused efforts to share our risks and risk mitigation strategies. Measure Status: 5.17 is the cumulative score for active members, employers, retired members, employer leaders, inactive members and stakeholder leaders. The breakdown of each stakeholder group is:
Segment Mean Active Members 5.01 Employers 5.29 Retired Members 5.48 Employer Leaders 4.86 Inactive Members 4.82 Stakeholder Leaders 4.93 Total (ALL) 5.17
5.17 indicates that stakeholders "somewhat agree" that CalPERS is doing a good job explaining and mitigating risk.
Measure Owner: Brad Pacheco Refresh Frequency: Annually, February Reporting Range: January 2016 – December 2016 Thresholds: The five-year goal is an increase of 5%, giving us a target of 1% increase annually. Annual increase of 0.05 + points Annual increase of 0.0 - 0.04 points Decrease from 5.17 or failure to increase 1% from the previous year Status: Pending refresh – February 2018
Agenda Item 12 - Attachment B - Page 21 of 60
2017-22 Strategic Plan Measure Summary VISION: A respected partner, providing a sustainable retirement system and health care program for those who serve California MISSION: Deliver retirement and health care benefits to members and their beneficiaries CORE VALUES: Quality, Respect, Accountability, Integrity, Openness, Balance
Status Key: On Track At Risk Off Track
Measure Status continued: Stakeholder sentiment is based on the work we do with them directly (communication and engagement) and perceptions they develop through exposure to media, political affiliation, their own associations, and other external factors.
The following is being done to improve upon this metric:
• Increased communication and messaging on steps being taken to ensure long-term sustainability.
• Increased engagement with senior employer leaders • Developing additional touch points for stakeholders • Continuing to clarify roles in the administration of pensions through
editorial board meetings, op-eds and letters to the editor • Op-ed pieces rebutting mischaracterizations • Participation in industry conferences and events
Initiatives and Projects: Project - Local Elected Officials Handbook Business Plan Initiative – Stakeholder education on system risks & mitigation
Agenda Item 12 - Attachment B - Page 22 of 60
2017-22 Strategic Plan Measure Summary VISION: A respected partner, providing a sustainable retirement system and health care program for those who serve California MISSION: Deliver retirement and health care benefits to members and their beneficiaries CORE VALUES: Quality, Respect, Accountability, Integrity, Openness, Balance
Status Key: On Track At Risk Off Track
FUND SUSTAINABILITY Strengthen the long-term sustainability of the pension fund
Objective Integrate environmental, social, and governance considerations into investment decision making
Measure Investment managers policies and procedures for ESG factor integration
Measure Description: Annual survey to determine percentage of internal and external managers that have policies and procedures articulating how environmental, social, and governance (ESG) risk and opportunity considerations are incorporated into investment processes and decisions. Baseline: Baseline will be established at the end of FY 2017-18 by the INVO Investment Manager Engagement Programs (IMEP) staff responsible for central monitoring, external communication, and establishment of measurement processes and reporting. Launched in May 2015, the Pilot Program trialed asset class-specific Sustainable Investment Practice Guidelines with respective internal and external investment managers. These guidelines utilized common governance elements applied across the Total Fund, such as the Investment Beliefs and Global Governance Principles, while adapted to the particular strategies of each asset class; qualitative findings were reported in December 2016. Target: 100% of internal and external investment managers have policies and procedures in place to integrate ESG factors into investment decisions. Measure Status: To be reported at the end of FY 2017-18, the metric will measure total percentage of internal and external investment managers with ESG factors incorporated into investment processes and decisions. Staff continue to develop a framework to conduct an annual survey of internal/external managers on their policies and procedures related to ESG risk and opportunity considerations.
Measure Owner: Ted Eliopoulos & Wylie Tollette Refresh Frequency: Annually, August Reporting Range: FY 2017-18 Thresholds: 80% and above 50 – 79% Less than 50% Status: Data not available – August 2018
Agenda Item 12 - Attachment B - Page 23 of 60
Measure Status continued: Established as a Strategic Priority in August 2016 as part of CalPERS’ Environmental Social and Governance (ESG) strategy. Asset classes are continuing to refine and evolve ESG integration efforts, including continued sharing of best practices internally and amongst external investment managers.
Initiatives and Projects: Business Plan Initiative – Investment beliefs and environmental, social, and governance risk integration
Agenda Item 12 - Attachment B - Page 24 of 60
2017-22 Strategic Plan Measure Summary VISION: A respected partner, providing a sustainable retirement system and health care program for those who serve California MISSION: Deliver retirement and health care benefits to members and their beneficiaries CORE VALUES: Quality, Respect, Accountability, Integrity, Openness, Balance
Status Key: On Track At Risk Off Track
HEALTH CARE AFFORDABILITY Transform health care purchasing and delivery to achieve affordability
Objective Restructure benefit design to promote high-value health care
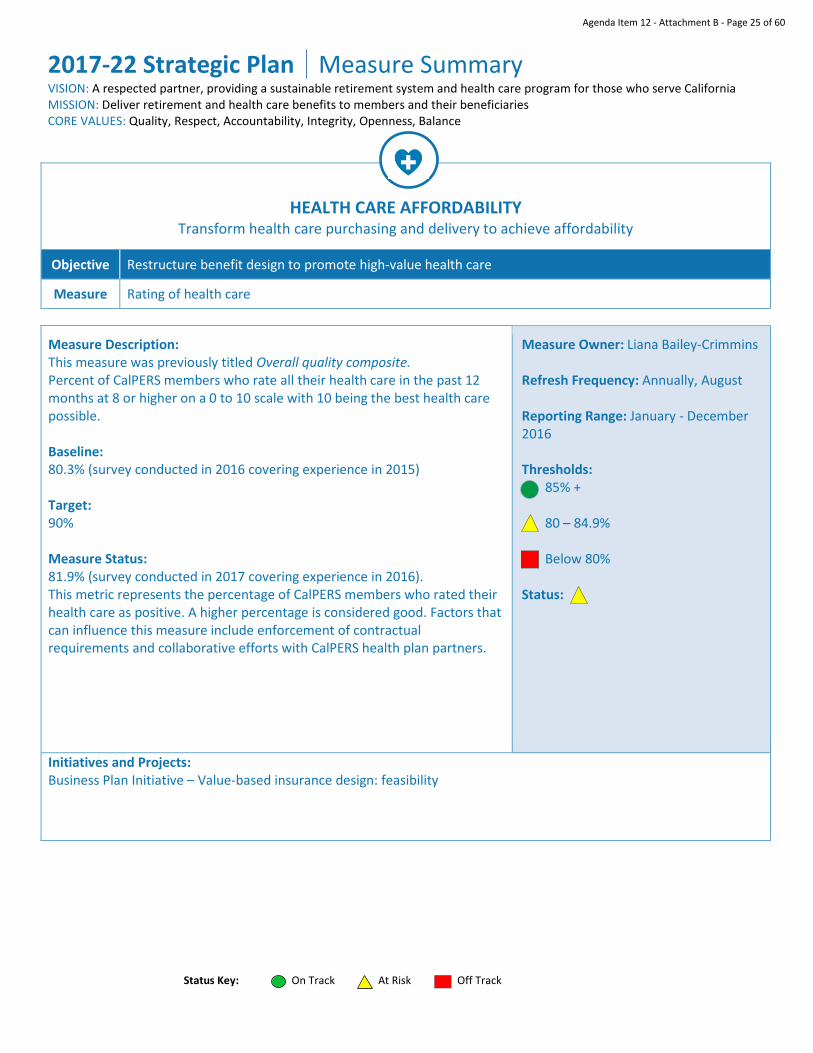
Measure Rating of health care
Measure Description: This measure was previously titled Overall quality composite. Percent of CalPERS members who rate all their health care in the past 12 months at 8 or higher on a 0 to 10 scale with 10 being the best health care possible. Baseline: 80.3% (survey conducted in 2016 covering experience in 2015) Target: 90% Measure Status: 81.9% (survey conducted in 2017 covering experience in 2016). This metric represents the percentage of CalPERS members who rated their health care as positive. A higher percentage is considered good. Factors that can influence this measure include enforcement of contractual requirements and collaborative efforts with CalPERS health plan partners.
Measure Owner: Liana Bailey-Crimmins Refresh Frequency: Annually, August Reporting Range: January - December 2016 Thresholds: 85% + 80 – 84.9% Below 80% Status:
Initiatives and Projects: Business Plan Initiative – Value-based insurance design: feasibility
Agenda Item 12 - Attachment B - Page 25 of 60
2017-22 Strategic Plan Measure Summary VISION: A respected partner, providing a sustainable retirement system and health care program for those who serve California MISSION: Deliver retirement and health care benefits to members and their beneficiaries CORE VALUES: Quality, Respect, Accountability, Integrity, Openness, Balance
Status Key: On Track At Risk Off Track
HEALTH CARE AFFORDABILITY Transform health care purchasing and delivery to achieve affordability
Objective Restructure benefit design to promote high-value health care
Measure Access to care
Measure Description: Percent of CalPERS members responding that they received immediate and routine care as soon as they needed it in the last 12 months. Baseline: 86.0% (survey conducted in 2016 covering experience in 2015) Target: 90% Measure Status: 86.4% (survey conducted in 2017 covering experience in 2016). This metric represents the perception of CalPERS members’ access to care when needed. A higher percentage is considered good. Factors that can influence this measure include enforcement of contractual requirements and collaborative efforts with CalPERS health plan partners.
Measure Owner: Liana Bailey-Crimmins Refresh Frequency: Annually, August Reporting Range: January - December 2016 Thresholds: 85% + 80 – 84.9% Below 80% Status:
Initiatives and Projects: Business Plan Initiative – Site of care management
Agenda Item 12 - Attachment B - Page 26 of 60
2017-22 Strategic Plan Measure Summary VISION: A respected partner, providing a sustainable retirement system and health care program for those who serve California MISSION: Deliver retirement and health care benefits to members and their beneficiaries CORE VALUES: Quality, Respect, Accountability, Integrity, Openness, Balance
Status Key: On Track At Risk Off Track
HEALTH CARE AFFORDABILITY Transform health care purchasing and delivery to achieve affordability
Objective Restructure benefit design to promote high-value health care
Measure Health care cost annual increase
Measure Description: This measure assesses the annual aggregated percent increase in premiums. Baseline: 3.24% based on change between 2016 and 2017 Target: Control annual premium cost increase to Consumer Price Index (CPI) for Medical care plus 3%. The amount changes annually. Between 2015 and 2016, the annual CPI for Medical Care increased 3.79%, so the target is 6.79%. Measure Status: This measure is pending refresh of annual CPI data. Health and claims data is received, analyzed, and utilized during the cyclical work performed by the health team to annually develop CalPERS health plan rates. This metric represents the year-over-year increases in premiums. Keeping this amount flat or on a downward trend is considered good. Factors that can influence this measure include member utilization, unit costs, and contract negotiations based on the data, help to constrain health care costs.
Measure Owner: Liana Bailey-Crimmins Refresh Frequency: Annually, August Reporting Range: January - December 2017 Thresholds: CPI for Medical Care plus 3% or less CPI for Medical Care plus 3.1 – 5% CPI for Medical Care plus 5.1% + Status: Pending refresh – August 2018
Initiatives and Projects: Business Plan Initiatives – Value-based insurance design: feasibility; Pharmacy benefit design pilot; Reference pricing expansion
Agenda Item 12 - Attachment B - Page 27 of 60
2017-22 Strategic Plan Measure Summary VISION: A respected partner, providing a sustainable retirement system and health care program for those who serve California MISSION: Deliver retirement and health care benefits to members and their beneficiaries CORE VALUES: Quality, Respect, Accountability, Integrity, Openness, Balance
Status Key: On Track At Risk Off Track
HEALTH CARE AFFORDABILITY Transform health care purchasing and delivery to achieve affordability
Objective Improve the health status of our employees, members and their families, and the communities where they live
Measure Adult obesity
Measure Description: This measure assesses the percent of adult members who have a Body Mass Index (BMI) higher than 30 based on self-reported weight and height. Baseline: 28.3% (survey conducted in 2016 covering experience in 2015) Target: 11% Measure Status: 28.3% (survey conducted in 2017 covering experience in 2016). This metric represents the percentage of CalPERS members who have a BMI of 30 or above based on self-reported height and weight in the annual Health Plan Member survey. A lower percentage is considered good. Factors that can influence this measure include:
• Provider and member behavior (e.g., diet and exercise) • Enforcement of contractual requirements and collaborative efforts
with CalPERS health plan partners. For example, obese members who have prediabetes may be eligible for Diabetes Prevention Programs that can help them to lose weight.
Measure Owner: Liana Bailey-Crimmins Refresh Frequency: Annually, August Reporting Range: January - December 2016 Thresholds: 11-15% 16-20% 21% + Status:
Initiatives and Projects: Business Plan Initiative – Population health alignment with Let’s Get Healthy California taskforce report dashboard
Agenda Item 12 - Attachment B - Page 28 of 60
2017-22 Strategic Plan Measure Summary VISION: A respected partner, providing a sustainable retirement system and health care program for those who serve California MISSION: Deliver retirement and health care benefits to members and their beneficiaries CORE VALUES: Quality, Respect, Accountability, Integrity, Openness, Balance
Status Key: On Track At Risk Off Track
HEALTH CARE AFFORDABILITY Transform health care purchasing and delivery to achieve affordability
Objective Improve the health status of our employees, members and their families, and the communities where they live
Measure Adult diabetes
Measure Description: This measure assesses the prevalence of diagnosed diabetes per 100 adults. Baseline: 13.3% (based on 2016 data) Target: 7.0% Measure Status: This metric represents diabetes specific diagnosis codes reported by the health plans for Basic members. Lowering this metric is considered good. Factors that can influence this measure include:
• Provider and member behavior (e.g., diet and exercise) • Enforcement of contractual requirements and collaborative efforts
with CalPERS health plan partners. For example, members who have prediabetes may be eligible for Diabetes Prevention Programs that can help them prevent the onset of diabetes.
Measure Owner: Liana Bailey-Crimmins Refresh Frequency: Annually, August Reporting Range: January - December 2017 Thresholds: 7-10% 10-13% 13% + Status: Pending refresh – August 2018
Initiatives and Projects: Business Plan Initiative – Population health alignment with Let’s Get Healthy California taskforce report dashboard
Agenda Item 12 - Attachment B - Page 29 of 60
2017-22 Strategic Plan Measure Summary VISION: A respected partner, providing a sustainable retirement system and health care program for those who serve California MISSION: Deliver retirement and health care benefits to members and their beneficiaries CORE VALUES: Quality, Respect, Accountability, Integrity, Openness, Balance
Status Key: On Track At Risk Off Track
HEALTH CARE AFFORDABILITY Transform health care purchasing and delivery to achieve affordability
Objective Improve the health status of our employees, members and their families, and the communities where they live
Measure Diabetes self-management
Measure Description: This measure assesses the proportion of diabetics who report that they check their blood glucose or sugar at least once a day. Baseline: 67.3% (survey conducted in 2016 covering experience in 2015) Target: 70% Measure Status: 64.1% (survey conducted in 2017 covering experience in 2016). This metric represents the percentage of CalPERS members with diabetes who indicated that they check their blood for glucose or sugar at least once a day, based on the Annual Health Plan Member survey. A higher percentage is considered good. Factors that can influence this measure include:
• Provider and member behavior. • Enforcement of contractual requirements and collaborative efforts
with CalPERS health plan partners. For example, many health plans have disease management programs through which members receive advice and coaching on diabetes by telephone.
Measure Owner: Liana Bailey-Crimmins Refresh Frequency: Annually, August Reporting Range: January - December 2016 Thresholds: 60% + 50-59.9% Below 50% Status:
Initiatives and Projects: Business Plan Initiative – Population health alignment with Let’s Get Healthy California taskforce report dashboard
Agenda Item 12 - Attachment B - Page 30 of 60
2017-22 Strategic Plan Measure Summary VISION: A respected partner, providing a sustainable retirement system and health care program for those who serve California MISSION: Deliver retirement and health care benefits to members and their beneficiaries CORE VALUES: Quality, Respect, Accountability, Integrity, Openness, Balance
Status Key: On Track At Risk Off Track
HEALTH CARE AFFORDABILITY Transform health care purchasing and delivery to achieve affordability
Objective Improve the health status of our employees, members and their families, and the communities where they live
Measure Mental health and well being
Measure Description: Poor mental health is associated with rapid social change, stressful work conditions, gender discrimination, social exclusion, unhealthy lifestyle, risk of violence, and physical ill-health. Baseline: Measure under development. CalPERS team members are working to select an appropriate measure, with an anticipated completion date of April 2018. Target: Measure under development. CalPERS team members are working to select an appropriate measure, with an anticipated completion date of April 2018. Measure Status: Previously-suggested measures in this area have problems; for example, data on major depressive episodes in people with depression are not available. CalPERS team members are working to select an appropriate measure, with an anticipated completion date of April 2018. Factors that can influence this measure include:
• Provider and member behavior, access to care. • Enforcement of contractual requirements and collaborative efforts
with CalPERS health plan partners. For example, some health plans screen members in disease management programs for depression.
Measure Owner: Liana Bailey-Crimmins Refresh Frequency: Annually, August Reporting Range: January - December 2018 Thresholds: Measure under development Status: Measure under development
Initiatives and Projects: Business Plan Initiatives – Population health alignment with Let’s Get Healthy California taskforce report dashboard; Partner with health plans to engage in community activities
Agenda Item 12 - Attachment B - Page 31 of 60
2017-22 Strategic Plan Measure Summary VISION: A respected partner, providing a sustainable retirement system and health care program for those who serve California MISSION: Deliver retirement and health care benefits to members and their beneficiaries CORE VALUES: Quality, Respect, Accountability, Integrity, Openness, Balance
Status Key: On Track At Risk Off Track
HEALTH CARE AFFORDABILITY Transform health care purchasing and delivery to achieve affordability
Objective Improve the health status of employees, members and their families, and the communities where they live
Measure Self-reported overall health status
Measure Description: This measure assesses the proportion of CalPERS member who rate their overall health as good, very good, or excellent. Baseline: 88.4% (survey conducted in 2016 covering experience in 2015) Target: 90% Measure Status: 87.8% (survey conducted in 2017 covering experience in 2015). This metric represents the percentage of CalPERS members who rated their overall health as good, very good, or excellent on the annual Health Plan Member survey. A higher percentage is considered good. Factors that can influence this measure include enforcement of contractual requirements and collaborative efforts with CalPERS health plan partners.
Measure Owner: Liana Bailey-Crimmins Refresh Frequency: Annually, August Reporting Range: January - December 2016 Thresholds: 85% + 80-84.9% Below 80% Status:
Initiatives and Projects: Business Plan Initiative – Population health alignment with Let’s Get Healthy California taskforce report dashboard
Agenda Item 12 - Attachment B - Page 32 of 60
2017-22 Strategic Plan Measure Summary VISION: A respected partner, providing a sustainable retirement system and health care program for those who serve California MISSION: Deliver retirement and health care benefits to members and their beneficiaries CORE VALUES: Quality, Respect, Accountability, Integrity, Openness, Balance
Status Key: On Track At Risk Off Track
HEALTH CARE AFFORDABILITY Transform health care purchasing and delivery to achieve affordability
Objective Reduce the overuse of ineffective or unnecessary medical care
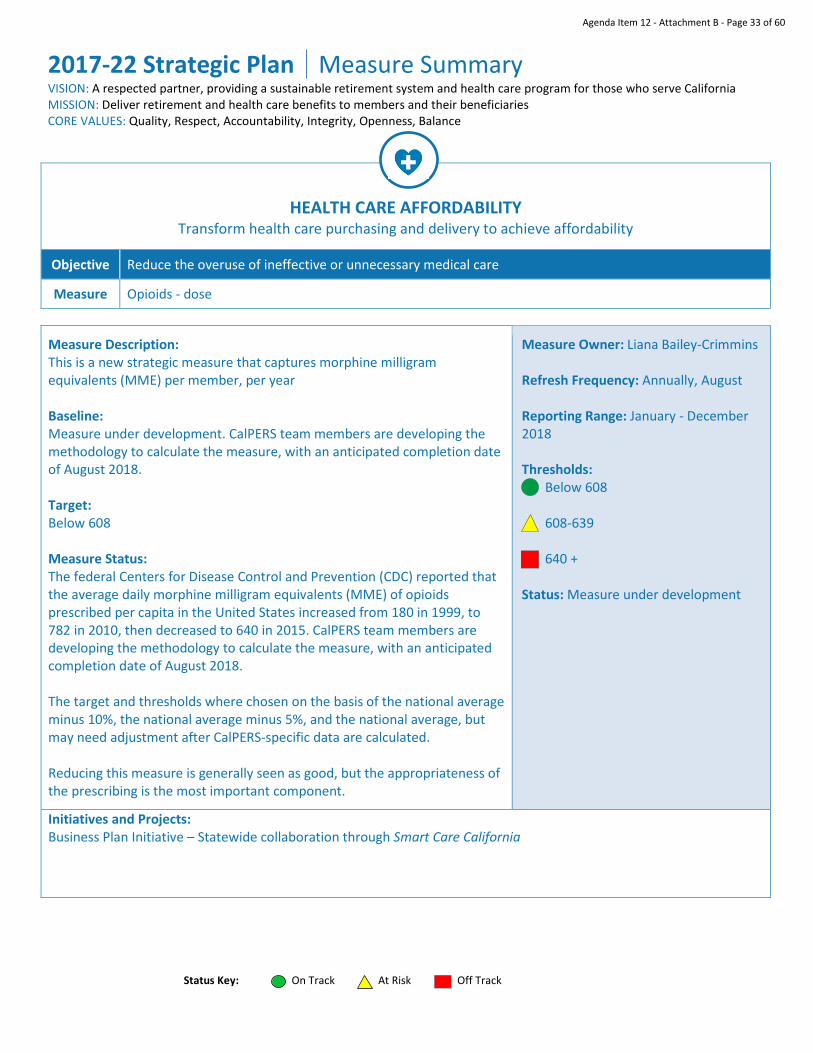
Measure Opioids - dose
Measure Description: This is a new strategic measure that captures morphine milligram equivalents (MME) per member, per year Baseline: Measure under development. CalPERS team members are developing the methodology to calculate the measure, with an anticipated completion date of August 2018. Target: Below 608 Measure Status: The federal Centers for Disease Control and Prevention (CDC) reported that the average daily morphine milligram equivalents (MME) of opioids prescribed per capita in the United States increased from 180 in 1999, to 782 in 2010, then decreased to 640 in 2015. CalPERS team members are developing the methodology to calculate the measure, with an anticipated completion date of August 2018. The target and thresholds where chosen on the basis of the national average minus 10%, the national average minus 5%, and the national average, but may need adjustment after CalPERS-specific data are calculated. Reducing this measure is generally seen as good, but the appropriateness of the prescribing is the most important component.
Measure Owner: Liana Bailey-Crimmins Refresh Frequency: Annually, August Reporting Range: January - December 2018 Thresholds: Below 608 608-639 640 + Status: Measure under development
Initiatives and Projects: Business Plan Initiative – Statewide collaboration through Smart Care California
Agenda Item 12 - Attachment B - Page 33 of 60
2017-22 Strategic Plan Measure Summary VISION: A respected partner, providing a sustainable retirement system and health care program for those who serve California MISSION: Deliver retirement and health care benefits to members and their beneficiaries CORE VALUES: Quality, Respect, Accountability, Integrity, Openness, Balance
Status Key: On Track At Risk Off Track
HEALTH CARE AFFORDABILITY Transform health care purchasing and delivery to achieve affordability
Objective Reduce the overuse of ineffective or unnecessary medical care
Measure Opioids - duration
Measure Description: This measure was previously titled Opioids prescription volume. Prescription opioid misuse is a public health problem that can lead to long-term health consequences, including death. Baseline: Measure under development. CalPERS team members are currently researching the feasibility of calculating this measure using a “HEDIS-like” methodology, with an anticipated completion date of April 2018, versus selecting another measure. Target: Measure under development. CalPERS team members are currently researching the feasibility of calculating this measure using a “HEDIS-like” methodology, with an anticipated completion date of April 2018, versus selecting another measure. Measure Status: CalPERS management requested a measure related to duration of opioid use. The only known relevant nationally-accepted, common measure is the Healthcare Effectiveness Data and Information Set (HEDIS) measure “Use of Opioids at High Dosage.” A new measure for 2018, this is defined as “For members 18 years and older, the rate per 1,000 receiving prescription opioids for greater than or equal to 15 days during the measurement year at a high dosage (average morphine milligram dose (MED) greater than 120mg). CalPERS team members are currently researching the feasibility of calculating this measure using a “HEDIS-like” methodology, with an anticipated completion date of April 2018, versus selecting another measure. As the measure is new, national comparative data to establish a target and thresholds will not be available until 2019. Reducing this measure is generally seen as good, but the appropriateness of the prescribing is the most important component.
Measure Owner: Liana Bailey-Crimmins Refresh Frequency: Annually, August Reporting Range: January - December 2018 Thresholds: Measure under development Status: Measure under development
Agenda Item 12 - Attachment B - Page 34 of 60
2017-22 Strategic Plan Measure Summary VISION: A respected partner, providing a sustainable retirement system and health care program for those who serve California MISSION: Deliver retirement and health care benefits to members and their beneficiaries CORE VALUES: Quality, Respect, Accountability, Integrity, Openness, Balance
Status Key: On Track At Risk Off Track
Initiatives and Projects: Business Plan Initiative – Statewide collaboration through Smart Care California
Agenda Item 12 - Attachment B - Page 35 of 60
2017-22 Strategic Plan Measure Summary VISION: A respected partner, providing a sustainable retirement system and health care program for those who serve California MISSION: Deliver retirement and health care benefits to members and their beneficiaries CORE VALUES: Quality, Respect, Accountability, Integrity, Openness, Balance
Status Key: On Track At Risk Off Track
HEALTH CARE AFFORDABILITY Transform health care purchasing and delivery to achieve affordability
Objective Reduce the overuse of ineffective or unnecessary medical care
Measure C-section rate
Measure Description: Although cesarean births can be lifesaving and medically optimal, far too many are performed for non-medical reasons. Baseline: In 2016, 28.8% of all deliveries for CalPERS members were performed by C-section. Target: Measure under development. CalPERS team members will work with Smart Care California to determine appropriate target and thresholds for the ‘not-NTSV-specific” C-section rate, if any, with an anticipated completion date of April 2018. Measure Status: Nationally and in California, the preferred measure for C-sections is called the “NTSV” rate. “NTSV” stands for “nulliparous” (i.e., first time), “term” (i.e., not preterm or postterm), “single” (i.e., not twins, triplets, etc.), and “vertex” (i.e., not breech) births. California has set an NTSV C-section rate target. Unfortunately, CalPERS-specific NTSV C-section data are unavailable. Therefore, CalPERS team members will work with Smart Care California to determine appropriate target and thresholds for the ‘not-NTSV-specific” C-section rate, if any, with an anticipated completion date of April 2018.
Measure Owner: Liana Bailey-Crimmins Refresh Frequency: Annually, August Reporting Range: January - December 2018 Thresholds: Measure under development Status: Measure under development
Initiatives and Projects: Business Plan Initiative – Statewide collaboration through Smart Care California
Agenda Item 12 - Attachment B - Page 36 of 60
2017-22 Strategic Plan Measure Summary VISION: A respected partner, providing a sustainable retirement system and health care program for those who serve California MISSION: Deliver retirement and health care benefits to members and their beneficiaries CORE VALUES: Quality, Respect, Accountability, Integrity, Openness, Balance
Status Key: On Track At Risk Off Track
HEALTH CARE AFFORDABILITY Transform health care purchasing and delivery to achieve affordability
Objective Reduce the overuse of ineffective or unnecessary medical care
Measure Hospital readmissions
Measure Description: This measure was previously titled Preventable hospitalizations per 100,000. Reducing hospital readmissions is important because they are associated with unfavorable patient outcomes and high financial costs. Nevertheless, a measure must be chosen carefully because not all readmissions are “bad readmissions.” Baseline: Measure under development. CalPERS team members are currently researching the feasibility of calculating this measure using a current “HEDIS-like” methodology in a way comparable with national data (e.g., HMO vs PPO), with an expected completion date of April 2018. Target: Measure under development. CalPERS team members are currently researching the feasibility of calculating this measure using a current “HEDIS-like” methodology in a way comparable with national data (e.g., HMO vs PPO), with an expected completion date of April 2018. Measure Status: As of February 2014, it was reported to the Board Governance Committee that one strategic measure would be “Quality of health care provided as measured by observed ratio of all-cause readmissions compared to what would be expected.” This would be consistent with the “Plan All-Cause Readmissions” measure in the Healthcare Effectiveness Data and Information Set (HEDIS). CalPERS team members are currently researching the feasibility of calculating this measure using a current “HEDIS-like” methodology in a way comparable with national data (e.g., HMO vs PPO), with an expected completion date of April 2018.
Measure Owner: Liana Bailey-Crimmins Refresh Frequency: Annually, August Reporting Range: January - December 2018 Thresholds: Measure under development Status: Measure under development
Initiatives and Projects: Business Plan Initiative – Research and expand evidence-based medicine
Agenda Item 12 - Attachment B - Page 37 of 60
2017-22 Strategic Plan Measure Summary VISION: A respected partner, providing a sustainable retirement system and health care program for those who serve California MISSION: Deliver retirement and health care benefits to members and their beneficiaries CORE VALUES: Quality, Respect, Accountability, Integrity, Openness, Balance
Status Key: On Track At Risk Off Track
REDUCE COMPLEXITY Reduce complexity across the enterprise
Objective Simplify programs to improve service and/or reduce cost
Measure CEM pension administration benchmarking survey – pension complexity score
Measure Description: The total Cost Effectiveness Measurement (CEM) complexity score represents the weighted average of CEM’s complexity measure by cause, before scaling, from the annual CEM Pension Administration Benchmarking Survey. Baseline: 71 (Weighted Average from 2016) Target: Reduce the weighted average CEM complexity score by 3 percent Measure Status: • This annual measure compares the complexity of CalPERS business to
other pension systems in our peer group. • Each year CalPERS has participated in this benchmarking activity, our
total relative complexity has remained the highest in CEM’s global database.
• Some factors that contribute to our overall complexity and the performance of this measure include:
o Total number of employers: the total number of employers we serve is more than twice the peer average.
o Diversity of employers: types of employers we serve include state agencies, schools, and local public agencies.
o Diversity of programs: the wide variety of programs we administer requires that our staff spend additional time and money serving our customers to ensure they understand their individual benefits.
o Legislative environment: the passage of PEPRA (Public Employees’ Pension Reform Act) and other legislation related to public pension benefits has necessitated continuing expenditures of time and money.
• We are committed to assessing and identifying opportunities to reduce complexity in our business processes in an effort to gain efficiency in the
Measure Owner: Donna Lum Refresh Frequency: Annually, August Reporting Range: August – June Thresholds: Reduced by 1 percent or more annually or target met Reduced by less than 1 percent annually Any increase Status: Pending refresh - August 2018
Agenda Item 12 - Attachment B - Page 38 of 60
2017-22 Strategic Plan Measure Summary VISION: A respected partner, providing a sustainable retirement system and health care program for those who serve California MISSION: Deliver retirement and health care benefits to members and their beneficiaries CORE VALUES: Quality, Respect, Accountability, Integrity, Openness, Balance
Status Key: On Track At Risk Off Track
services we provide to our members and business partners and reduce our overall CEM Complexity Score.
Initiatives and Projects: Business Plan Initiative – CEM complexity score reduction The objective of the CEM complexity score reduction initiative is to assess our current complexity score and identify target areas of complexity reduction.
Agenda Item 12 - Attachment B - Page 39 of 60
2017-22 Strategic Plan Measure Summary
VISION: A respected partner, providing a sustainable retirement system and health care program for those who serve California MISSION: Deliver retirement and health care benefits to members and their beneficiaries CORE VALUES: Quality, Respect, Accountability, Integrity, Openness, Balance
Status Key: On Track At Risk Off Track
REDUCE COMPLEXITY
Reduce complexity across the enterprise
Objective Simplify programs to improve service and/or reduce cost
Measure Benefit payment timeliness
Measure Description: This measure captures the timeliness of four payment types: Service Retirement, Refunds, Disability Retirement, and Survivor Benefits (Lump Sum and ASAP payments). Baseline: Fiscal Year 2017-18, Quarter 1: 95 percent.
Target: Issue 98 percent of benefit payments within service level timeframes. Measure Status: • The timeliness of payments is a key component of a positive customer
experience. We focus heavily on benefits payments in our performance management to ensure customers receive timely payments.
• This metric reflects benefit payments that are most essential to our customers. The delay or interruption of these payment streams could create significant hardship. Our target of 98 percent reflects the critical importance of these payments to our customers and our absolute commitment to meeting their financial needs.
• The overall measure of our benefit payments has consistently performed above the exception threshold.
• In accordance with the development of the Enterprise Performance Reporting program, CSS evaluated all existing metrics to align methodology.
Measure Owner: Donna Lum Refresh Frequency: Quarterly Reporting Range: July - June Thresholds: The current threshold for this metric has been to provide exception reports when any benefit payment stream falls below 90 percent. Status:
Initiatives and Projects: As the Customer Satisfaction metric measures ongoing core operations with stable performance, it is more appropriate to report as a Key Performance Indicator. Business Plan Initiative – Improve pension benefit payments timeliness
Agenda Item 12 - Attachment B - Page 40 of 60
2017-22 Strategic Plan Measure Summary
VISION: A respected partner, providing a sustainable retirement system and health care program for those who serve California MISSION: Deliver retirement and health care benefits to members and their beneficiaries CORE VALUES: Quality, Respect, Accountability, Integrity, Openness, Balance
Status Key: On Track At Risk Off Track
REDUCE COMPLEXITY
Reduce complexity across the enterprise
Objective Simplify programs to improve service and/or reduce cost
Measure Customer satisfaction
Measure Description: This metric reflects data from our customer satisfaction surveys. Collecting satisfaction data through surveys allows us to utilize the full value of customer feedback and increases our flexibility and responsiveness to their needs. Baseline: Fiscal Year 2017-18, Quarter 1: 86 percent Target: Achieve an overall satisfaction rate of 95 percent, reflecting a positive customer experience across core business processes. Measure Status: • Customer Services and Support (CSS) administers an extensive range of
surveys, delivered online, by mail, in person, and through email measuring overall satisfaction with the core process or services we offer.
• Our customer satisfaction metric has continued to consistently exceed the exception threshold, indicating our customers’ high satisfaction with the services we provide. Performance on surveys for some individual processes regularly surpass targets.
• These surveys enable us to continually refine our customer satisfaction measurement techniques through accessible, cost-effective, and inclusive surveys and leverage the feedback we receive.
• In accordance with the development of the Enterprise Performance Reporting program, CSS is evaluating all existing metrics to align methodology.
Measure Owner: Donna Lum Refresh Frequency: Quarterly Reporting Range: July - June Thresholds: The current threshold for this metric has been to provide exception reports when any individual survey falls below 85 percent. Status:
Initiative and Projects: As the Customer Satisfaction metric measures ongoing core operations with stable performance, it is more appropriate to report as a Key Performance Indicator. Business Plan Initiatives – Customer satisfaction – actionable feedback; Implement digital communication strategy
Agenda Item 12 - Attachment B - Page 41 of 60
2017-22 Strategic Plan Measure Summary VISION: A respected partner, providing a sustainable retirement system and health care program for those who serve California MISSION: Deliver retirement and health care benefits to members and their beneficiaries CORE VALUES: Quality, Respect, Accountability, Integrity, Openness, Balance
Status Key: On Track At Risk Off Track
REDUCE COMPLEXITY
Reduce complexity across the enterprise
Objective Simplify programs to improve service and/or reduce costs
Measure Description: Annual evaluation of the number of strategic and transition external managers. Baseline: 151 external strategic and transition managers Target: 100 or fewer external strategic and transition managers Measure Status: This metric examines the total population of strategic and transition external managers retained to manage assets on behalf of CalPERS. Significant progress has been made over the last year, as of September 2017, the Investment Office is on track to decrease 5 or more managers for FY 2017-18, as current count is 147 (-4 from last count). Transparent, robust, fair and competitive ongoing evaluation processes are driving this metric. The INVO 2020 Vision, a 5-year strategic plan, focuses on reducing management fees and complexity, enhancing governance and manager expectations, and moving to fewer but more strategic partnerships.
Measure Owner: Ted Eliopoulos & Wylie Tollette Refresh Frequency: Annually, May Reporting Range: FY 2016-17 Thresholds: Decrease of 5 or more managers per year Decrease of 4 or less managers per year No reduction, or increase in # of managers Status:
Initiatives and Projects: Business Plan Initiative – External manager monioring, expectations, and reduction strategy
Agenda Item 12 - Attachment B - Page 42 of 60
2017-22 Strategic Plan Measure Summary VISION: A respected partner, providing a sustainable retirement system and health care program for those who serve California MISSION: Deliver retirement and health care benefits to members and their beneficiaries CORE VALUES: Quality, Respect, Accountability, Integrity, Openness, Balance
Status Key: On Track At Risk Off Track
REDUCE COMPLEXITY Reduce complexity across the enterprise
Objective Streamline operations to gain efficiencies, improve productivity, and reduce costs
Measure CEM pension administration benchmarking survey – cost per member
Measure Description: From the annual CEM Pension Administration Benchmarking Survey, reduce cost per member, exclusively to pension administration, and does not include health and investment. Baseline: Baseline to be established in December 2017 (Data from end of FY2016-17 used to calculate) This measure’s baseline will be established with the most recent data to provide an accurate starting point. With new employee contracts shifting operating costs it is critical that this measure start with the most relevant data available. Target: Reduce by 2% annually Measure Status: The total cost per member is calculated by taking the total members divided by the total pension overhead operating costs. There are several variables that impact the increase or decrease of these costs, including those that are out of our control. For example, if our membership numbers go down, and our operating costs remain the same, costs per member will go up. Employee salary increases drive up the costs per member, determined by collective bargaining. The Financial Office will produce a baseline based on the average of the two previous fiscal years of CEM data. In efforts to reduce costs per member, process improvement efforts are being developed to increase efficiencies. Working cross-divisionally the Financial Office will identify enterprise cost drivers for the organization and produce a baseline report. Based on the report, the Executive team can look at assessing the members return on investment for the customer service provided and identify possible ways to reduce costs.
Measure Owner: Charles Asubonten Refresh Frequency: Annually, May Reporting Range: FY 2016-17 Thresholds: Reduced by 2.0% annually
Reduced by 1.5-1.99% annually
Reduced by less than 1.5% annually Status: Pending refresh – May 2018
Initiatives and Projects: Business Plan Initiatives – Develop and implement continuous process improvement framework; Reduce system costs and improve efficiencies
Agenda Item 12 - Attachment B - Page 43 of 60
2017-22 Strategic Plan Measure Summary VISION: A respected partner, providing a sustainable retirement system and health care program for those who serve California MISSION: Deliver retirement and health care benefits to members and their beneficiaries CORE VALUES: Quality, Respect, Accountability, Integrity, Openness, Balance
Status Key: On Track At Risk Off Track
REDUCE COMPLEXITY Reduce complexity across the enterprise
Objective Streamline operations to gain efficiencies, improve productivity, and reduce costs
Measure Total overhead cost
Measure Description: Total overhead costs calculated for pension administration and health. Baseline: Baseline to be established in Annual Budget. This measure’s baseline will be established with the most recent budget data to provide accurate starting point in May 2018. Target: Reduce by 1.5-2% annually Measure Status: Working cross-divisionally the Financial Office will work to identify enterprise cost drivers for the organization and produce a baseline report. Cost drivers can vary in significance of impact. Once a baseline is established, a root cause analysis will be conducted to determine the main drivers impacting overhead costs and a priority analysis will be used to determine which ones the enterprise will address first. By identifying and prioritizing, efforts can be made to minimize those selected cost drivers to strive for this measures target.
Measure Owner: Charles Asubonten Refresh Frequency: Quarterly Reporting Range: Quarterly
Thresholds: Reduced by 1.5-2.0% annually
Reduced by 1.0-1.49% annually
Reduced by less than 1.0% Annually Status: Data not available – 4th Quarter, FY 2017-18
Initiatives and Projects: Business Plan Initiatives – Develop and implement continuous process improvement framework; Reduce system costs and improve efficiencies
Agenda Item 12 - Attachment B - Page 44 of 60
2017-22 Strategic Plan Measure Summary VISION: A respected partner, providing a sustainable retirement system and health care program for those who serve California MISSION: Deliver retirement and health care benefits to members and their beneficiaries CORE VALUES: Quality, Respect, Accountability, Integrity, Openness, Balance
Status Key: On Track At Risk Off Track
REDUCE COMPLEXITY
Reduce complexity across the enterprise
Objective Streamline operations to gain efficiencies, improve productivity, and reduce costs
Measure 5-year net value added
Measure Description: 5-year net value added relative to an appropriate peer universe median return adjusted for composition of asset allocation and after expenses. Baseline: 5-year net value-added relative to an appropriate United States’ (US) peer universe median return, adjusted for composition of asset allocation and after expenses, is 0%. CalPERS is cost advantaged vs our peers by 7 bps. Each year, INVO participates in a CEM Benchmarking (CEM) survey which independently analyzes costs against a customized peer group. Target: Exceed the median US peer on investment cost and returns Measure Status: This measure is the analysis of INVO’s cost drivers and cost structure versus US peers. The most recent data available indicates CalPERS did exceed the US Peer median.
INVO is cost-advantaged compared to its US peers, primarily due to:
o Internal management of public assets o Index-oriented management of 2/3 of equity portfolio o Lower private asset fees
Continued focus on delivering more value for cost through effective management of portfolios, resources, and technology. This includes renegotiation of external management fees and reduction of consulting and other related operating costs.
Measure Owner: Ted Eliopoulos & Wylie Tollette Refresh Frequency: Annually, May Reporting Range: Current 5 Year Period: FY 2010/11 through FY 2014/15 CEM collects calendar year 2015 performance and assets from CalPERS and its peers, using a standard methodology to compare the peer funds. CalPERS reports costs to CEM on a fiscal year basis (FY 2014-15), therefore measure will always have a lag in reporting period. Thresholds: Exceed the US Peer median
Meet the US Peer median
Fall below the US Peer median Status:
Initiatives and Projects: Business Plan Initiative – Enhance business effectiveness, resource allocation, and efficency of investment programs
Agenda Item 12 - Attachment B - Page 45 of 60
2017-22 Strategic Plan Measure Summary VISION: A respected partner, providing a sustainable retirement system and health care program for those who serve California MISSION: Deliver retirement and health care benefits to members and their beneficiaries CORE VALUES: Quality, Respect, Accountability, Integrity, Openness, Balance
Status Key: On Track At Risk Off Track
RISK MANAGEMENT
Cultivate a risk-intelligent organization
Objective Enhance compliance and risk functions throughout the enterprise
Measure Description: The measure scores the overall stakeholder perception of CalPERS' success in implementing functions and programs that support compliance and risk. Data is gathered through the annual Stakeholder Perception Survey in response to the statement: "CalPERS has effective functions and programs to address compliance and risk." Baseline: 5.16 out of 7 possible points Target: Five-year goal: 5.43 out of 7; a 5% increase from the baseline. Annual increases of 1% (0.05 points). This target will be met through continued stakeholder engagement and the consistent demonstration of our commitment to a culture of compliance and risk as an organization and as a system. Measure Status: 5.16 is the cumulative score for active members, employers, retired members, employer leaders, inactive members and stakeholder leaders. The breakdown of each stakeholder group is:
Segment Mean Active Members 5.05 Employers 5.39 Retired Members 5.24 Employer Leaders 4.92 Inactive Members 4.82 Stakeholder Leaders 5.15 Total (ALL) 5.16
5.16 indicates that stakeholders "somewhat agree" that CalPERS has effective compliance and risk programs.
Measure Owner: Brad Pacheco Refresh Frequency: Annually, February Reporting Range: January 2016- December 2016 Thresholds: The five-year goal is an increase of 5%, giving us a target of 1% increase annually. Annual increase of 0.05 + points Annual increase of 0.0-0.04 points Decrease from 5.16 or increase of less than 1% from previous year Status: Pending refresh – February 2018
Agenda Item 12 - Attachment B - Page 46 of 60
2017-22 Strategic Plan Measure Summary VISION: A respected partner, providing a sustainable retirement system and health care program for those who serve California MISSION: Deliver retirement and health care benefits to members and their beneficiaries CORE VALUES: Quality, Respect, Accountability, Integrity, Openness, Balance
Status Key: On Track At Risk Off Track
Measure Status continued: Stakeholder sentiment is driving by the communications and messages we share through our various channels and interactions. The following is being done to improve upon this metric:
• Increased communication and messaging on steps being taken to ensure long-term sustainability.
• Increased engagement with senior employer leaders • Developing additional touch points for stakeholders • Continuing to clarify roles in the administration of pensions through
editorial board meetings, op-eds and letters to the editor • Op-ed pieces rebutting mischaracterizations • Participation in industry conferences and events
Initiatives and Projects: N/A
Agenda Item 12 - Attachment B - Page 47 of 60
2017-22 Strategic Plan Measure Summary VISION: A respected partner, providing a sustainable retirement system and health care program for those who serve California MISSION: Deliver retirement and health care benefits to members and their beneficiaries CORE VALUES: Quality, Respect, Accountability, Integrity, Openness, Balance
Status Key: On Track At Risk Off Track
RISK MANAGEMENT Cultivate a risk-intelligent organization
Objective Enhance compliance and risk functions throughout the enterprise
Measure Risk and compliance employee awareness survey
Measure Description: Annual Employee survey. Example question: “I am aware of my role in CalPERS’ compliance and risk functions, and I incorporate compliance and risk practices into my decision making.” Baseline: Establish a baseline after the initial survey is administered in FY 2017-18. Analysis will take approximately 2 months to complete once survey is administered. Target: The target will be set based on the initial survey and baseline. Enterprise Compliance (ECOM) and Enterprise Risk Management (ERMD) will set a target that reflects a percentage increase of respondents agreeing with the benchmark question. Measure Status: The metric is the percentage of CalPERS employees, including team members, managers, and executives, that respond “Yes” to the question: “I am aware of CalPERS’ compliance and risk functions, and I incorporate compliance and risk best practices into my decision making.” This metric is driven by CalPERS’ employee awareness and active use of the expectations, programs and resources that make up the compliance and risk functions throughout the enterprise.
ECOM and ERMD implement annual plans to enhance and mature compliance and risk functions across CalPERS based on industry best practices, annual risk assessments, and recommendations from the Five-Year Compliance Plan. As part of those plans, each division has education and communication components intended to increase team member and leadership awareness and understanding of CalPERS’ expectations and their personal responsibilities under the compliance and risk functions.
Measure Owner: Charles Asubonten Refresh Frequency: Annually, February Reporting Range: Current Fiscal Year Snapshot (i.e. first survey in FY 2017-18 will cover FY 2017-18) Thresholds: Thresholds will be set based on initial survey and baseline in FY 2017-18. ECOM and ERMD will establish thresholds and a final target as a, currently undetermined, percentage increase of survey respondents agreeing with the benchmark question. Status: Data not available - February 2019
Agenda Item 12 - Attachment B - Page 48 of 60
2017-22 Strategic Plan Measure Summary VISION: A respected partner, providing a sustainable retirement system and health care program for those who serve California MISSION: Deliver retirement and health care benefits to members and their beneficiaries CORE VALUES: Quality, Respect, Accountability, Integrity, Openness, Balance
Status Key: On Track At Risk Off Track
Initiatives and Projects: Business Plan Initiatives – Increase enterprise-wide risk awareness; Increase enterprise-wide compliance awareness
Agenda Item 12 - Attachment B - Page 49 of 60
2017-22 Strategic Plan Measure Summary VISION: A respected partner, providing a sustainable retirement system and health care program for those who serve California MISSION: Deliver retirement and health care benefits to members and their beneficiaries CORE VALUES: Quality, Respect, Accountability, Integrity, Openness, Balance
Status Key: On Track At Risk Off Track
RISK MANAGEMENT Cultivate a risk-intelligent organization
Objective Enhance compliance and risk functions throughout the enterprise
Measure Risk and compliance program maturity assessment
Measure Description: Compliance and risk program maturity model assessments are completed annually Baseline: Establish a baseline after the initial assessment is conducted in Fiscal Year 2017-18 Target: CalPERS risk management and compliance maturity assessment scores increase annually from the baseline set in FY 2017-18. The final targets and thresholds will be established after the initial assessment is conducted. Measure Status: The metrics are maturity scores for both CalPERS’ risk management program and compliance program. Maturity is defined here as the degree to which risk and compliance processes have been formalized, implemented and integrated into an organization’s operations. Enterprise Risk Management (ERMD) and Enterprise Compliance (ECOM) with complete the assessments with CalPERS’ Integrated Assurance Workgroup.
The metrics are driven by the level of progress made by CalPERS’ to incorporate recognized compliance and risk elements and best practices into business operations and decision making processes across the enterprise.
ECOM and ERMD implement annual plans to enhance and mature compliance and risk functions across CalPERS based on best practices, annual risk assessments, and recommendations from the Five-Year Compliance Plan. Additionally, CalPERS has a Three Lines of Defense model to define assurance roles and responsibilities and an Embedded Compliance and Risk Framework that guide the implementation of new and enhanced compliance and risk functions throughout the organization.
Measure Owner: Charles Asubonten Refresh Frequency: Annually, January Reporting Range: Current fiscal year snapshot (i.e. first assessment in FY 2017-18 will cover FY 2017-18) Thresholds: Thresholds will be set based on initial assessment and baseline score. Status: Data not available - January 2019
Agenda Item 12 - Attachment B - Page 50 of 60
Initiatives and Projects: Business Plan Initiatives – Increase enterprise-wide risk awareness; Increase enterprise-wide compliance awareness
Agenda Item 12 - Attachment B - Page 51 of 60
2017-22 Strategic Plan Measure Summary Reported in Closed Session VISION: A respected partner, providing a sustainable retirement system and health care program for those who serve California MISSION: Deliver retirement and health care benefits to members and their beneficiaries CORE VALUES: Quality, Respect, Accountability, Integrity, Openness, Balance
Status Key: On Track At Risk Off Track
RISK MANAGEMENT
Cultivate a risk-intelligent organization
Objective Continue to Evolve Cyber Security Program
Measure Cyber security risk rating
Measure Description: The total number of successful and unsuccessful blocking of attacks across the enterprise. A description of successful attacks and their level of risk (low/medium/critical), based upon the impact of the attack; mitigation measures will also be provided. Baseline: Information to be provided in closed session Target: Information to be provided in closed session Measure Status: Information to be provided in closed session
Measure Owner: Doug Hoffner Refresh Frequency: Monthly Reporting Range: Monthly Thresholds: Information to be provided in closed session Status: Information to be provided in closed session
Initiatives and Projects: Business Plan Initiatives - Information security roadmap; Enterprise business continuity project, phase II
Agenda Item 12 - Attachment B - Page 52 of 60
2017-22 Strategic Plan Measure Summary VISION: A respected partner, providing a sustainable retirement system and health care program for those who serve California MISSION: Deliver retirement and health care benefits to members and their beneficiaries CORE VALUES: Quality, Respect, Accountability, Integrity, Openness, Balance
Status Key: On Track At Risk Off Track
TALENT MANAGEMENT Promote a high-performing and diverse workforce
Objective Recruit and empower a broad range of talents to meet organization priorities
Measure Increase diverse recruitment channels
Measure Description: Increase the number of diverse channels used to broadcast open positions across the enterprise. Baseline: As of July 1, 2017, the Human Resources Division actively engages in 7 distinct recruitment channels: • Online Job Board • Social Networks • CalPERS Brand • Search Firms • Print Advertisements • Outreach Activities • Job Notifications
Target: Increase diverse recruitment channels by 25% Measure Status: To attract the most diverse and qualified applicant pool to CalPERS and engage prospective applicants in new ways, two new recruitment channels have been established. Career Services & Outreach (CSO) has collaborated with the “Honor a Hero, Hire a Vet” organization in the past and wants to expand to additional partnerships. CSO continually increases the number of veteran recruitment partnerships and in 2017 has connected with four additional veteran organizations in the effort to increase recruitment channels. CalPERS will continue to reach out and increase the number of veteran organization partnerships to attend career fairs and promote job openings.
Measure Owner: Doug Hoffner Refresh Frequency: Annually, July Reporting Range: Fiscal year Thresholds: Our target is to expand by 2 recruitment channels to meet our goal, with a stretch goal of 3 or 4 new channels. We will also expand and refine current recruitment channel activities. Increase of 25% or more channels from baseline Increase of 14% or more channels from baseline No increase Status: Pending refresh - July 2018
Agenda Item 12 - Attachment B - Page 53 of 60
2017-22 Strategic Plan Measure Summary VISION: A respected partner, providing a sustainable retirement system and health care program for those who serve California MISSION: Deliver retirement and health care benefits to members and their beneficiaries CORE VALUES: Quality, Respect, Accountability, Integrity, Openness, Balance
Status Key: On Track At Risk Off Track
Measure Status continued: In addition to our Veteran recruitment partnerships, CalPERS has also established four LinkedIn Recruiter seats. This recruitment channel allows us to actively search and reach out to top qualified candidates on LinkedIn. By expanding the usage of LinkedIn Recruiter seats, CalPERS will be able to actively seek out additional candidates for hard to recruit positions. These LinkedIn Recruitment seats will be used by Executive Recruitment and Employment Services Unit to search for qualified candidates for vacancies across the enterprise. This measure is also a Business Plan Initiative for 2017-18. In addition to expand existing recruitment channels, HRSD will also identify and add new recruitment activities within existing channels. Details in chart provided below:
Initiatives and Projects: Business Plan Initiatives – Develop and implement an expanded recrutiment strategy; Expand diversity and inclusion program
Agenda Item 12 - Attachment B - Page 54 of 60
2017-22 Strategic Plan Measure Summary VISION: A respected partner, providing a sustainable retirement system and health care program for those who serve California MISSION: Deliver retirement and health care benefits to members and their beneficiaries CORE VALUES: Quality, Respect, Accountability, Integrity, Openness, Balance
Status Key: On Track At Risk Off Track
TALENT MANAGEMENT
Promote a high-performing and diverse workforce
Objective Recruit and empower a broad range of talents to meet organization priorities
Measure Workforce diversity & inclusion
Measure Description: This measure focuses on our efforts to help foster a culture of inclusion that welcomes diversity of thought, experience, and background. We have learned that diversity within an inclusive working environment enhances the relevance of our work, increases productivity, and improves the value of services we provide. The annual employee engagement survey has several specific questions aimed at gauging the success of our diversity and inclusion (D&I) efforts. Baseline: On average, 62% of team members agree that CalPERS fosters a culture of inclusion that welcomes diversity of thought, experience, and background. Target: Increase the Engagement Survey score average related to D&I by 8% by 2022 Measure Status: The number being reported is the average of team members (66%) that agree that CalPERS fosters a culture of inclusion that welcomes diversity of thought, experience, and background. This number is based on an average of specific D&I questions from the 2017 Employee Engagement Survey.
This metric is considered a good opportunity to begin implementing expansion efforts to bring more awareness to D&I within the organization as well as with our business partners, members, and future team members. In the 2016-17 Business Planning Cycle, CalPERS Diversity Outreach Program (CDOP) developed an Enterprise D&I Strategy that is now being implemented through the 2017-18 Business Planning Cycle. This includes the launch of the Employee Engagement Survey, which will help steer efforts to be successful and sustainable. This strategy as well as CDOP's ongoing work to provide education and training to team members will help engage the enterprise in their awareness of CalPERS D&I efforts.
Measure Owner: Brad Pacheco Refresh Frequency: Annually, December Reporting Range: April 2016 - April 2017 Thresholds: Increase engagement scores related to D&I by at least 1.6% each year Annual increase of 1.6% or more Annual increase of 1-1.5% Annual increase of less than 1% or no increase Status:
Agenda Item 12 - Attachment B - Page 55 of 60
2017-22 Strategic Plan Measure Summary VISION: A respected partner, providing a sustainable retirement system and health care program for those who serve California MISSION: Deliver retirement and health care benefits to members and their beneficiaries CORE VALUES: Quality, Respect, Accountability, Integrity, Openness, Balance
Status Key: On Track At Risk Off Track
Initiatives and Projects: Business Plan Initiative – Expand diversity & inclusion program
Agenda Item 12 - Attachment B - Page 56 of 60
2017-22 Strategic Plan Measure Summary VISION: A respected partner, providing a sustainable retirement system and health care program for those who serve California MISSION: Deliver retirement and health care benefits to members and their beneficiaries CORE VALUES: Quality, Respect, Accountability, Integrity, Openness, Balance
Status Key: On Track At Risk Off Track
TALENT MANAGEMENT
Promote a high-performing and diverse workforce
Objective Recruit and empower a broad range of talents to meet organization priorities
Measure Employee engagement survey
Measure Description: This measure focuses on our annual employee engagement survey which supports our efforts to foster a culture of engagement at CalPERS. The questions in the survey correspond to engagement and retention drivers, such as manager relationships, learning and development, culture, and organization potential. Baseline: 59.5% Target: To be established in December 2017 Measure Status: The employee engagement survey administered in October 2017 established the baseline of 59.5%; of those surveyed, 70% completed the survey. The employee engagement survey measures how engaged the workforce is and exactly what drives that engagement level. Survey questions are based on proven engagement drivers and results will enable CalPERS to focus improvement efforts directly to those areas that may be hindering adequate levels of engagement. A complementary, one-question pulse check survey is intended to indicate whether improvement efforts are making a difference.
Measure Owner: Doug Hoffner Refresh Frequency: Annually, December Reporting Range: October-September Thresholds: 59% and above 40-59% Under 40% Status: Data not available – December 2017
Initiatives and Projects: Business Plan Initiative - Develop and administer team member engagement surveys
Agenda Item 12 - Attachment B - Page 57 of 60
2017-22 Strategic Plan Measure Summary VISION: A respected partner, providing a sustainable retirement system and health care program for those who serve California MISSION: Deliver retirement and health care benefits to members and their beneficiaries CORE VALUES: Quality, Respect, Accountability, Integrity, Openness, Balance
Status Key: On Track At Risk Off Track
TALENT MANAGEMENT
Promote a high-performing and diverse workforce Objective Cultivate leadership competencies and develop succession plans across the enterprise
Measure Proficiency in CalPERS leadership competencies
Measure Description: Measure proficiency in CalPERS leadership competencies in a phased approach. Baseline: Will be established in August 2018 when Year 1 efforts conclude Target: Will be established in August 2018 for Year 1 evaluated leaders Measure Status: Year 1 data will be available following the 2017-18 CEA Incentive Compensation calibration (July/August 2018). Year 2 data to include CEAs and Investment Office leaders will be available following the January 2019 Incentive Compensation mid-year calibration. Year 3 data to include all CalPERS leaders. Beginning of Year 4 data to be all-inclusive baseline. 2017-18 CEA plans will include individually rated leadership competencies. An automated tool will be available to pilot in 2018-19 to individually rate Investment Office leadership against leadership competencies. The tool could be used in 2019-20 to individually rate all CalPERS leaders against CalPERS Leadership Competencies.
Measure Owner: Doug Hoffner Refresh Frequency: Annually, August Reporting Range: July-June Thresholds: N/A Status: Data not available – August 2018
Initiatives and Projects: N/A
Agenda Item 12 - Attachment B - Page 58 of 60
2017-22 Strategic Plan Measure Summary VISION: A respected partner, providing a sustainable retirement system and health care program for those who serve California MISSION: Deliver retirement and health care benefits to members and their beneficiaries CORE VALUES: Quality, Respect, Accountability, Integrity, Openness, Balance
Status Key: On Track At Risk Off Track
TALENT MANAGEMENT Promote a high-performing and diverse workforce
Objective Cultivate leadership competencies and develop succession plans across the enterprise
Measure Internal candidates selected to fill senior and executive recruitments
Measure Description: This current measure combines the two previously titled measures - Participation in succession planning program and Active development plans for succession planning program participant - which allows us to better measure the outcome of the strategic objective. This measure assesses the percentage of senior and executive recruitments filled by internal candidates who participate in the competitive recruitment process. Baseline: In FY 2016-17, 75% of senior and executive recruitments were filled by internal candidates.
Target: In accordance with industry best practices, 67% of recruitments should be filled by internal candidates. Measure Status: The target of this measure is based on the 67/33 build/buy ratio from Korn Ferry’s Real World Leadership Study, which commissioned a comprehensive, global survey of views on leadership development with broad representation from a variety of international markets. The merit process limits what we can do to affect change to this measure, but outreach efforts to include Diversity and Inclusion and building talent pools of qualified candidates with LinkedIn are some ways we engage external candidates. The Succession Planning Program and Leadership Development programs are internal factors that can contribute to the measure. Annual reporting, as a result of completed recruitments, will be available in August 2018. Senior and executive recruitments are classified as Division leaders at a CEA or equivalent classification and Branch leaders that are direct reports to the CEO.
Measure Owner: Doug Hoffner Refresh Frequency: Annually, August Reporting Range: Fiscal year Thresholds: Monitor and report outcomes of senior and executive recruitments 62-72% 56-61% or 73-77% <55% or = > 78% Status: Pending refresh – August 2018
Agenda Item 12 - Attachment B - Page 59 of 60
2017-22 Strategic Plan Measure Summary VISION: A respected partner, providing a sustainable retirement system and health care program for those who serve California MISSION: Deliver retirement and health care benefits to members and their beneficiaries CORE VALUES: Quality, Respect, Accountability, Integrity, Openness, Balance