U.S. Fish and Wildlife Service Office of Subsistence Management Fisheries Resource Monitoring Program Estimating the inriver abundance of Copper River Chinook salmon, 2009 annual report Annual Report for Study 07-503 The Native Village of Eyak PO Box 1388 Cordova, AK 99574 LGL Alaska Research Associates, Inc. 1101 E. 76 th Avenue, Suite B Anchorage, AK 99518 March 2010
Transcript
U.S. Fish and Wildlife Service Office of Subsistence Management
Fisheries Resource Monitoring Program
Estimating the inriver abundance of Copper River Chinook salmon, 2009 annual report
Annual Report for Study 07-503
The Native Village of Eyak PO Box 1388
Cordova, AK 99574
LGL Alaska Research Associates, Inc. 1101 E. 76th Avenue, Suite B
Anchorage, AK 99518
March 2010
Estimating the inriver abundance of Copper River Chinook salmon, 2009 annual report
Annual Report for Study 07-503
Keith M. van den Broek, Thomas M. Haluska Native Village of Eyak
P.O. Box 1388 Cordova, AK 99574
and
Jason J. Smith LGL Alaska Research Associates, Inc.
1101 E. 76th Ave., Suite B Anchorage, AK 99518
March 2010
i
TABLE OF CONTENTS LIST OF FIGURES ....................................................................................................................... iii LIST OF TABLES...........................................................................................................................v LIST OF APPENDICES................................................................................................................ vi INTRODUCTION ...........................................................................................................................1
Objectives ....................................................................................................................................2 Study Area ...................................................................................................................................2
Hiring and Training..................................................................................................................3 Permit Requirements................................................................................................................4 Fishwheel Design and Construction ........................................................................................4 Mobilizing the Field Camps.....................................................................................................4 Camp Communication .............................................................................................................5
Fishwheel Operation and Catch...................................................................................................5 Fishwheel Operation ................................................................................................................5 Fishwheel Catch and Effort .....................................................................................................6
Tag Application and Recovery ....................................................................................................6 Inriver Abundance Estimates.......................................................................................................7
Conditions for a Consistent Abundance Estimate ...................................................................7 Abundance Estimate ................................................................................................................9
RESULTS ........................................................................................................................................9 Project Mobilization ....................................................................................................................9 Fishwheel Operation and Catch.................................................................................................10
Tag Application and Recovery ..................................................................................................11 Inriver Abundance Estimate ......................................................................................................11
Conditions for a Consistent Estimator ...................................................................................11 Abundance Estimate ..............................................................................................................12
Other Tag Recoveries ................................................................................................................12 DISCUSSION................................................................................................................................12
Project Mobilization ..................................................................................................................12 Data Collection ..........................................................................................................................13 Fishwheel Operation and Catch.................................................................................................13 Abundance Estimate ..................................................................................................................14
CONCLUSIONS ...........................................................................................................................14 RECOMMENDATIONS...............................................................................................................14 ACKNOWLEDGMENTS .............................................................................................................15 LITERATURE CITED ..................................................................................................................16
LIST OF FIGURES Figure 1. Map of the study area showing the location of the Baird Canyon and Canyon Creek
fishwheels on the Copper River in Alaska, 2009. .......................................................... 25
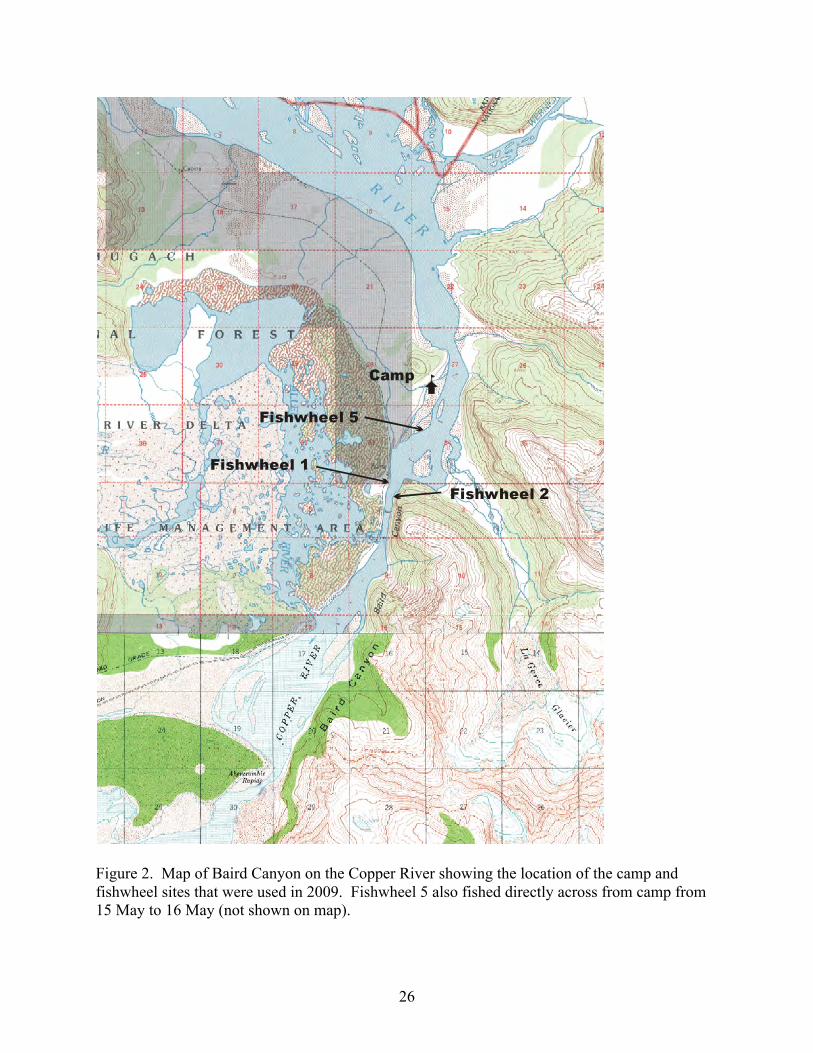
Figure 2. Map of Baird Canyon on the Copper River showing the location of the camp and fishwheel sites that were used in 2009. Fishwheel 5 also fished directly across from camp from 15 May to 16 May (not shown on map)....................................................... 26
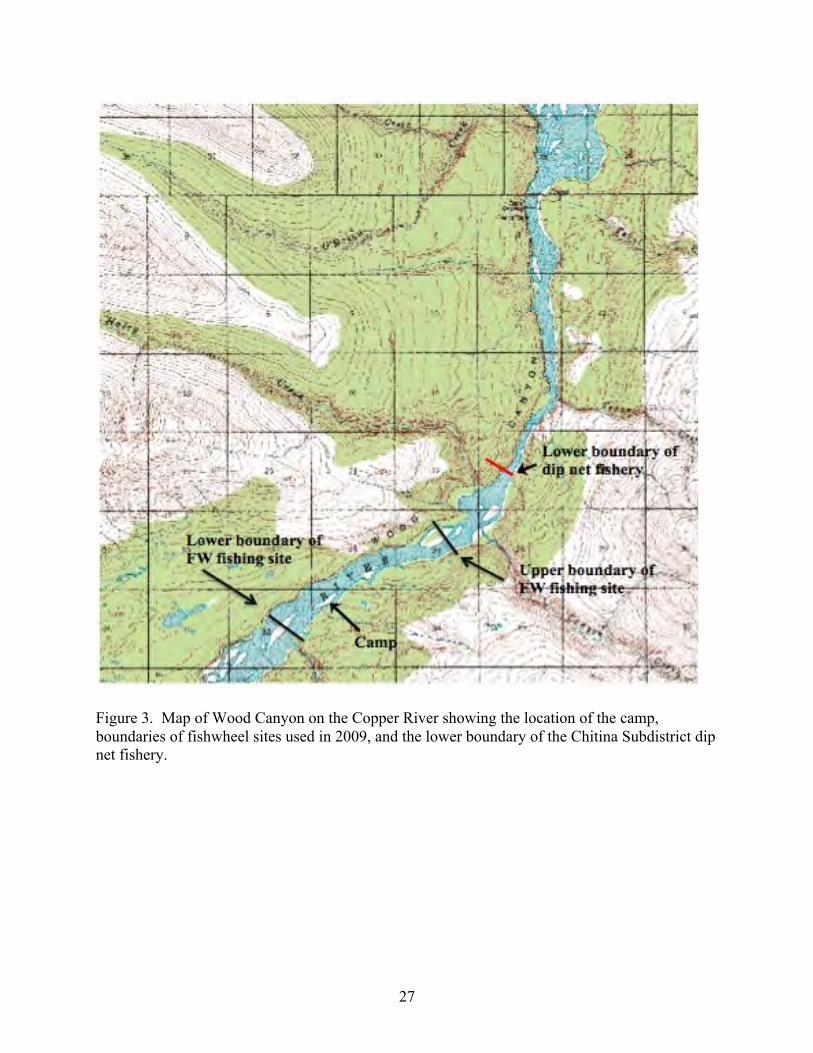
Figure 3. Map of Wood Canyon on the Copper River showing the location of the camp, boundaries of fishwheel sites used in 2009, and the lower boundary of the Chitina Subdistrict dip net fishery............................................................................................... 27
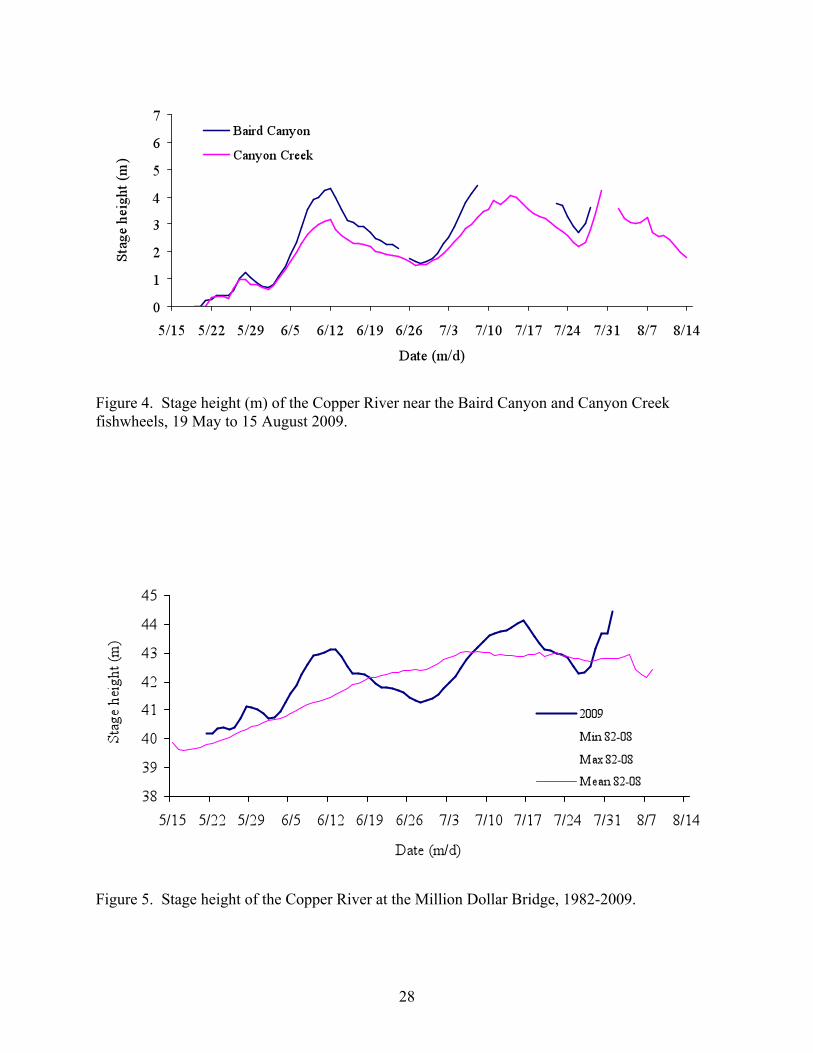
Figure 4. Stage height (m) of the Copper River near the Baird Canyon and Canyon Creek fishwheels, 19 May to 15 August 2009. ......................................................................... 28
Figure 5. Stage height of the Copper River at the Million Dollar Bridge, 1982-2009. ............... 28
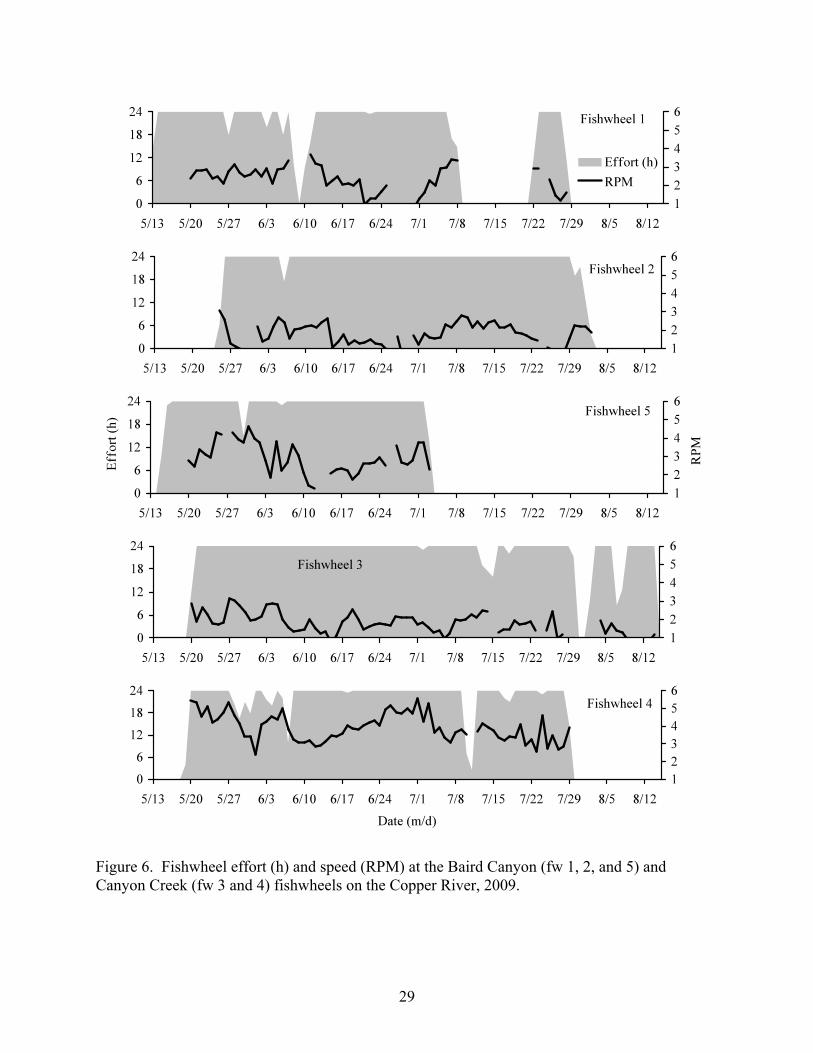
Figure 6. Fishwheel effort (h) and speed (RPM) at the Baird Canyon (fw 1, 2, and 5) and Canyon Creek (fw 3 and 4) fishwheels on the Copper River, 2009............................... 29
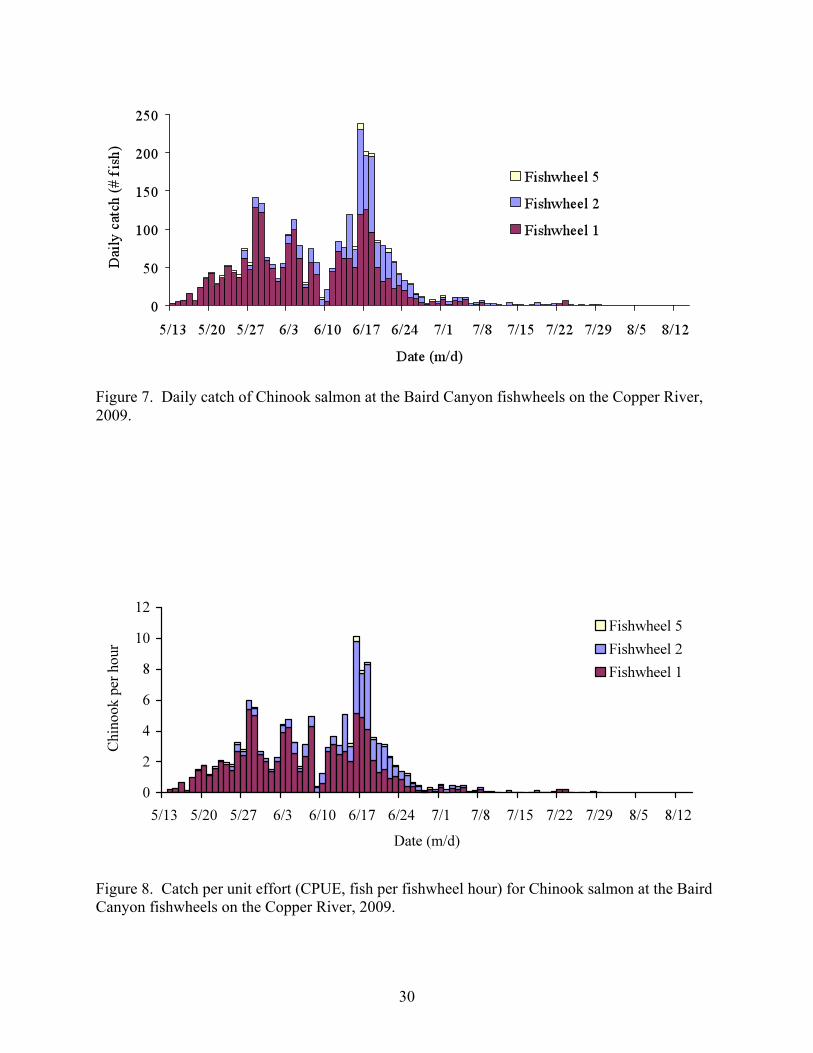
Figure 7. Daily catch of Chinook salmon at the Baird Canyon fishwheels on the Copper River, 2009. ............................................................................................................................... 30
Figure 8. Catch per unit effort (CPUE, fish per fishwheel hour) for Chinook salmon at the Baird Canyon fishwheels on the Copper River, 2009. ............................................................. 30
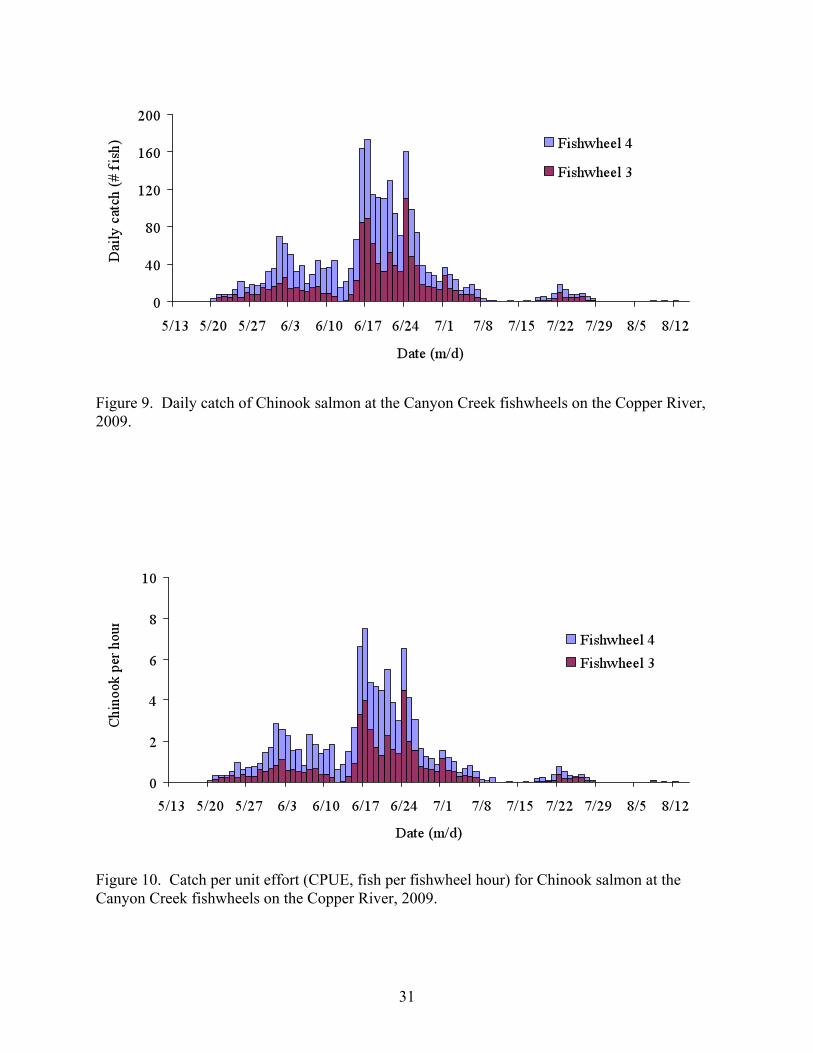
Figure 9. Daily catch of Chinook salmon at the Canyon Creek fishwheels on the Copper River, 2009. ............................................................................................................................... 31
Figure 10. Catch per unit effort (CPUE, fish per fishwheel hour) for Chinook salmon at the Canyon Creek fishwheels on the Copper River, 2009. .................................................. 31
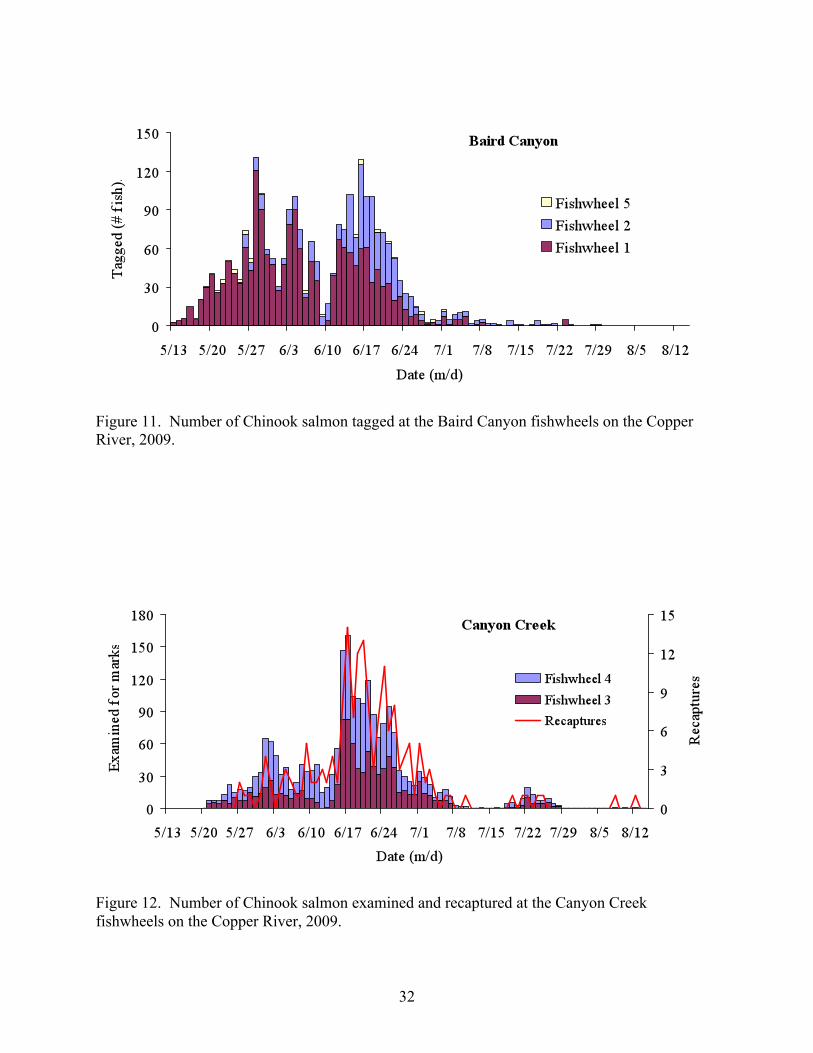
Figure 11. Number of Chinook salmon tagged at the Baird Canyon fishwheels on the Copper River, 2009. .................................................................................................................... 32
Figure 12. Number of Chinook salmon examined and recaptured at the Canyon Creek fishwheels on the Copper River, 2009. .......................................................................... 32
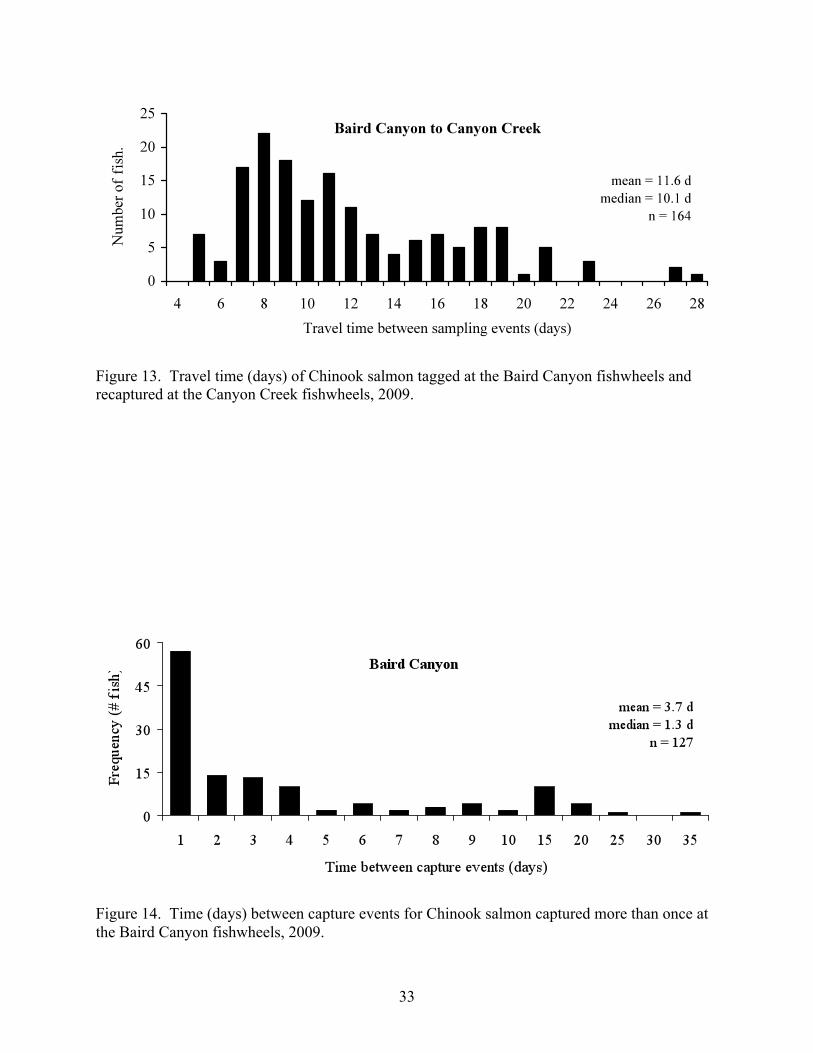
Figure 13. Travel time (days) of Chinook salmon tagged at the Baird Canyon fishwheels and recaptured at the Canyon Creek fishwheels, 2009. ........................................................ 33
Figure 14. Time (days) between capture events for Chinook salmon captured more than once at the Baird Canyon fishwheels, 2009................................................................................ 33
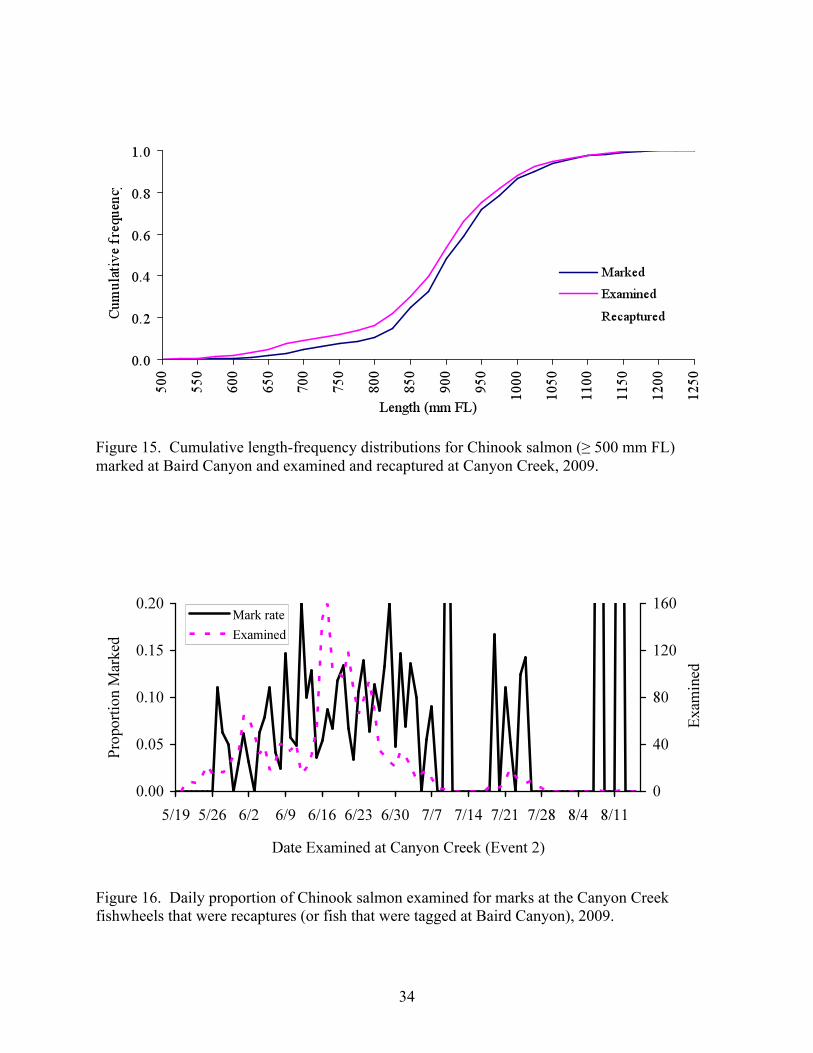
Figure 15. Cumulative length-frequency distributions for Chinook salmon (≥ 500 mm FL) marked at Baird Canyon and examined and recaptured at Canyon Creek, 2009. .......... 34
iv
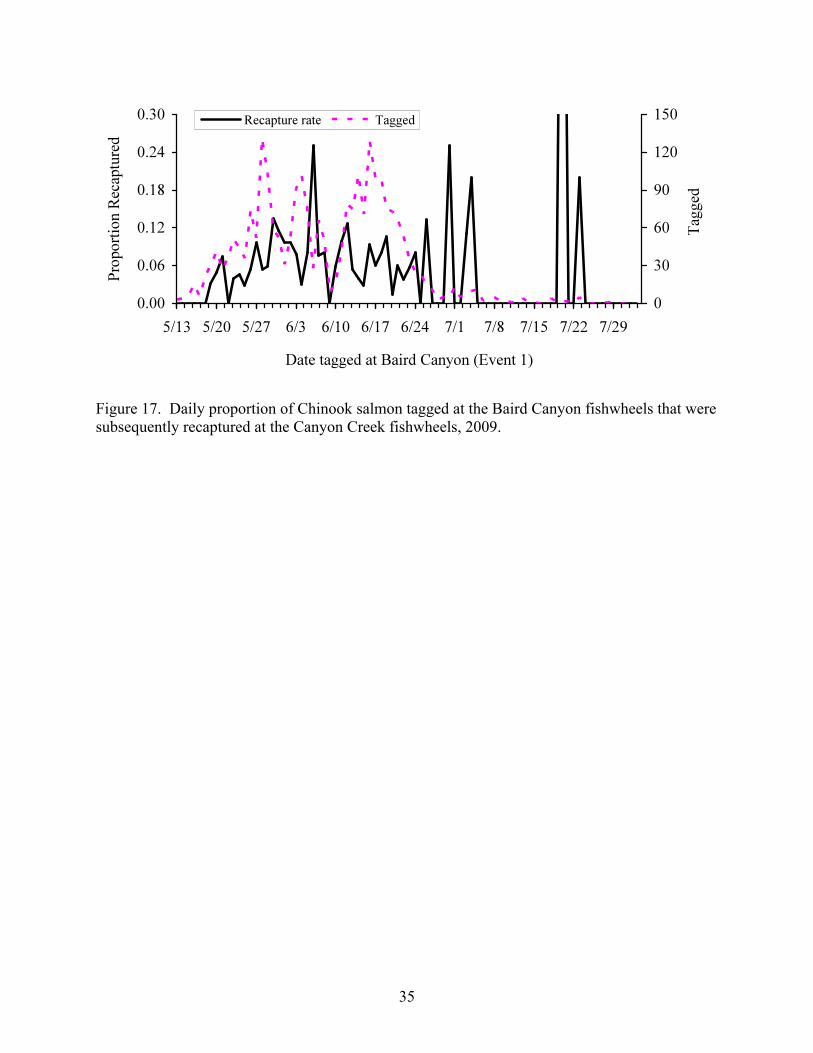
Figure 16. Daily proportion of Chinook salmon examined for marks at the Canyon Creek fishwheels that were recaptures (or fish that were tagged at Baird Canyon), 2009. ...... 34
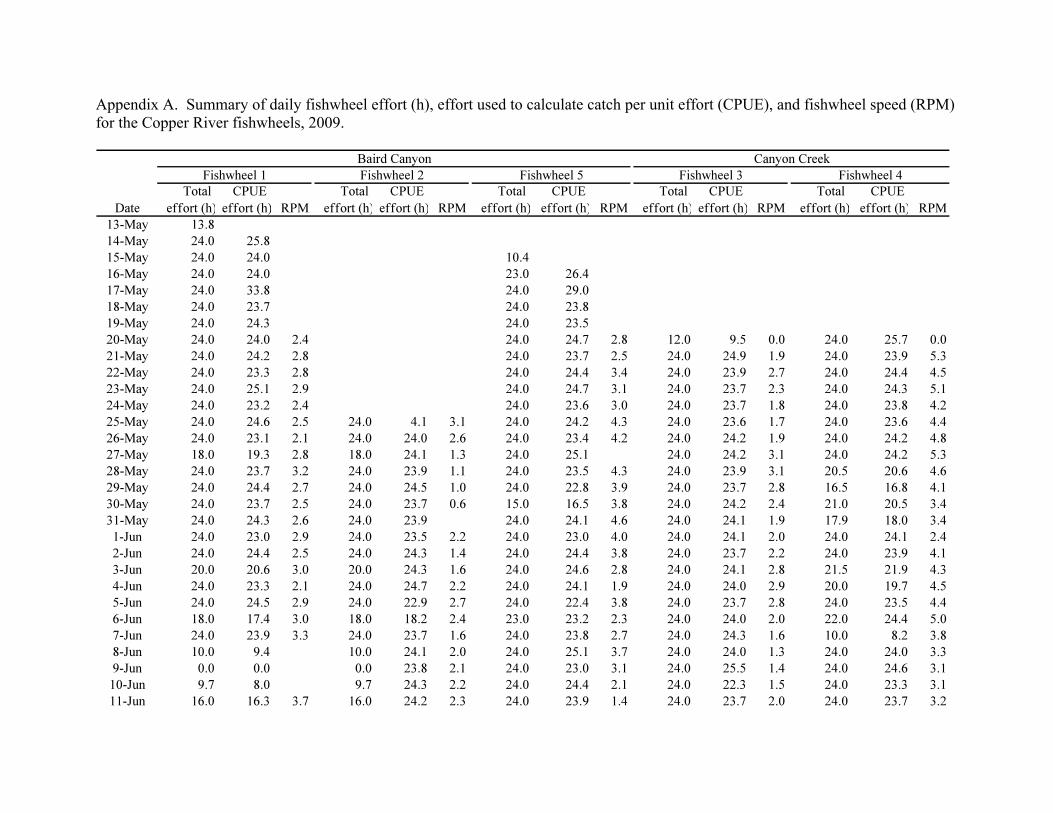
Figure 17. Daily proportion of Chinook salmon tagged at the Baird Canyon fishwheels that were subsequently recaptured at the Canyon Creek fishwheels, 2009. .................................. 35
v
LIST OF TABLES Table 1. Number of Chinook salmon recaptured, by bank of release, and the results of a test to
compare recapture rates of fish marked on the east and west banks of the Copper River, 2009. ............................................................................................................................... 21
Table 2. Number of Chinook salmon recaptured, by bank of release and bank of recovery, and the results of a test to compare for equal movement across the river, 2009................... 21
Table 3. Number of Chinook salmon marked, by bank of recovery, and the results of a test to compare mark rates of fish recovered on the east and west banks of the Copper River, 2009. ............................................................................................................................... 21
Table 4. Capture history of Chinook salmon that were tagged, examined, and recaptured at the Copper River fishwheels, 2009. Bold text indicates the data used for the Chi-square tests. ................................................................................................................................ 22
Table 5. Estimated inriver abundance of Chinook salmon above Baird Canyon on the Copper River, 2003-2009. ........................................................................................................... 22
Table 6. Number of tagged Chinook salmon reported harvested by the various Copper River fisheries, 2009................................................................................................................. 23
vi
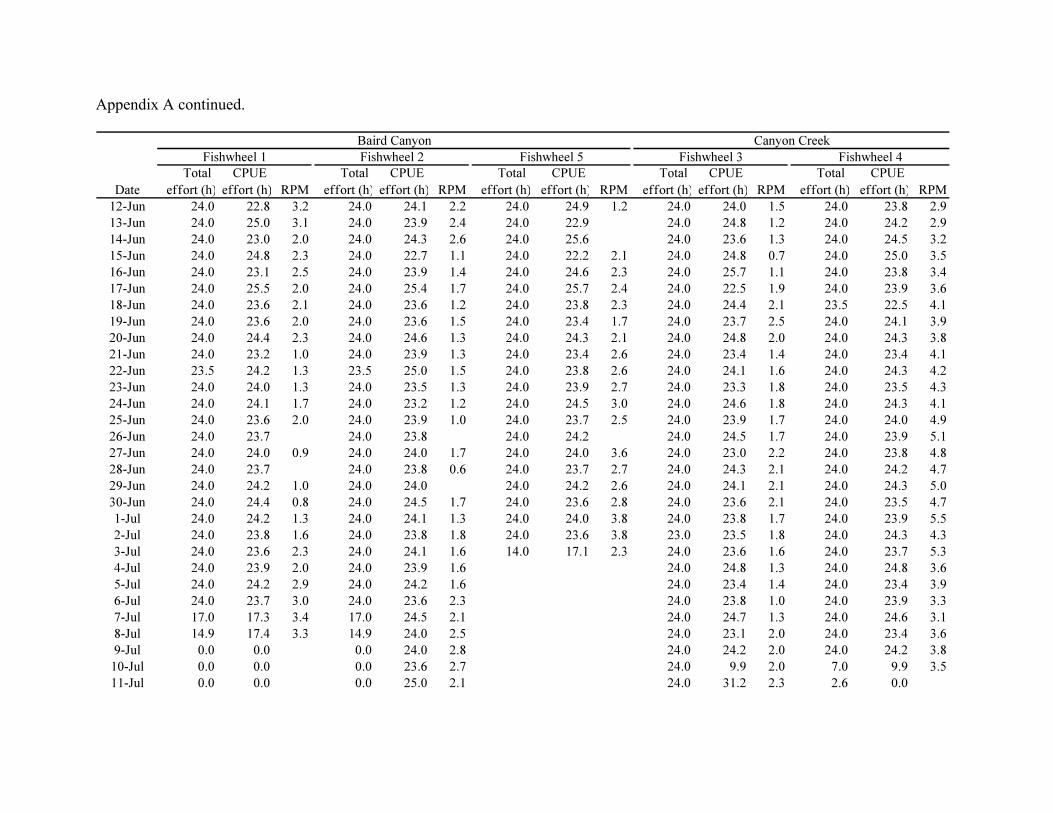
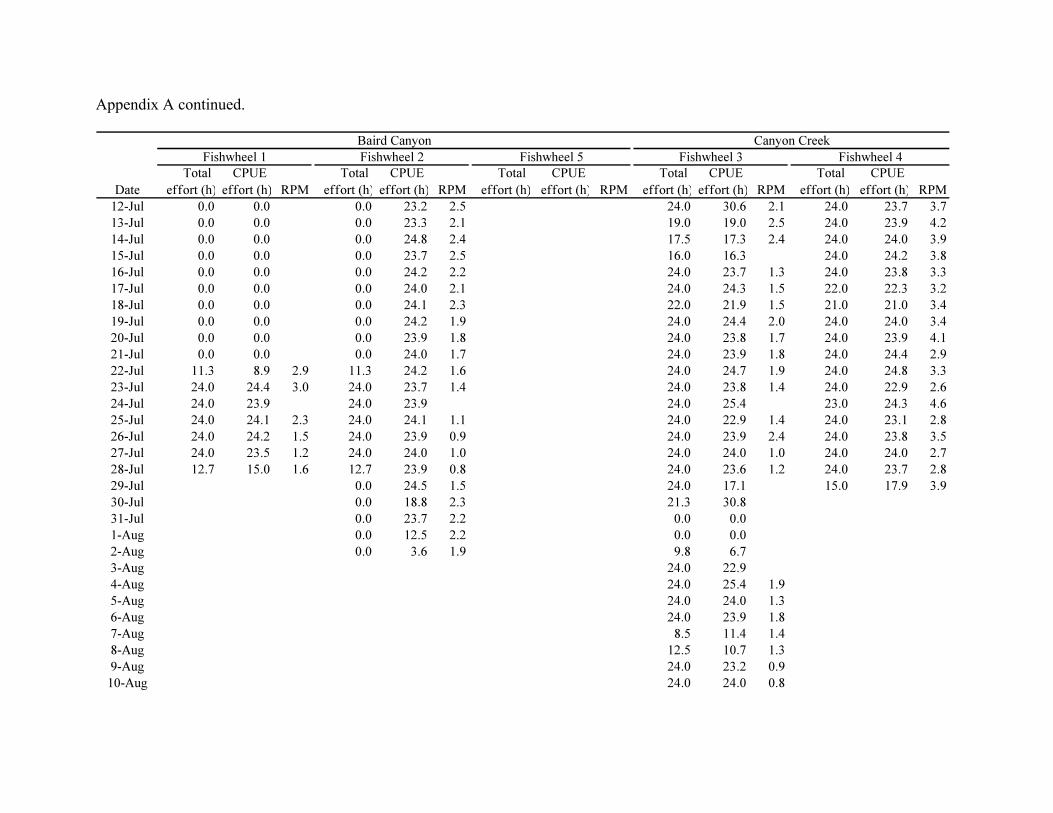
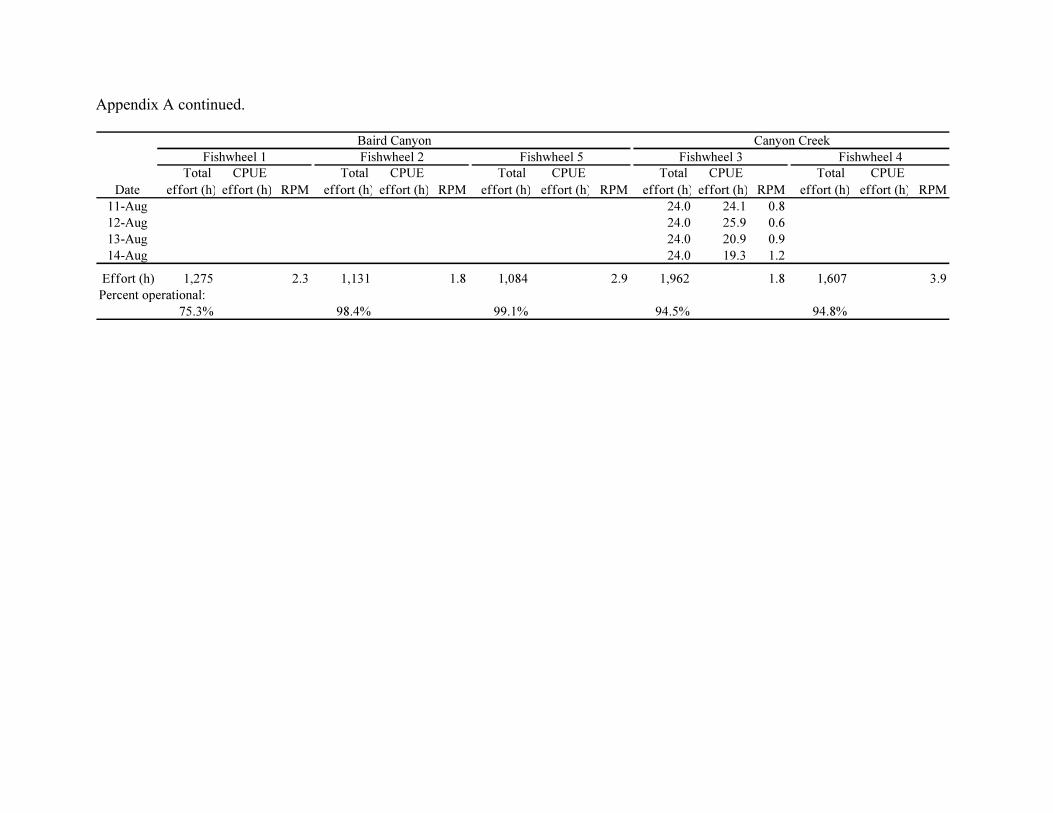
LIST OF APPENDICES Appendix A. Summary of daily fishwheel effort (h), effort used to calculate catch per unit effort
(CPUE), and fishwheel speed (RPM) for the Copper River fishwheels, 2009. ............... 1
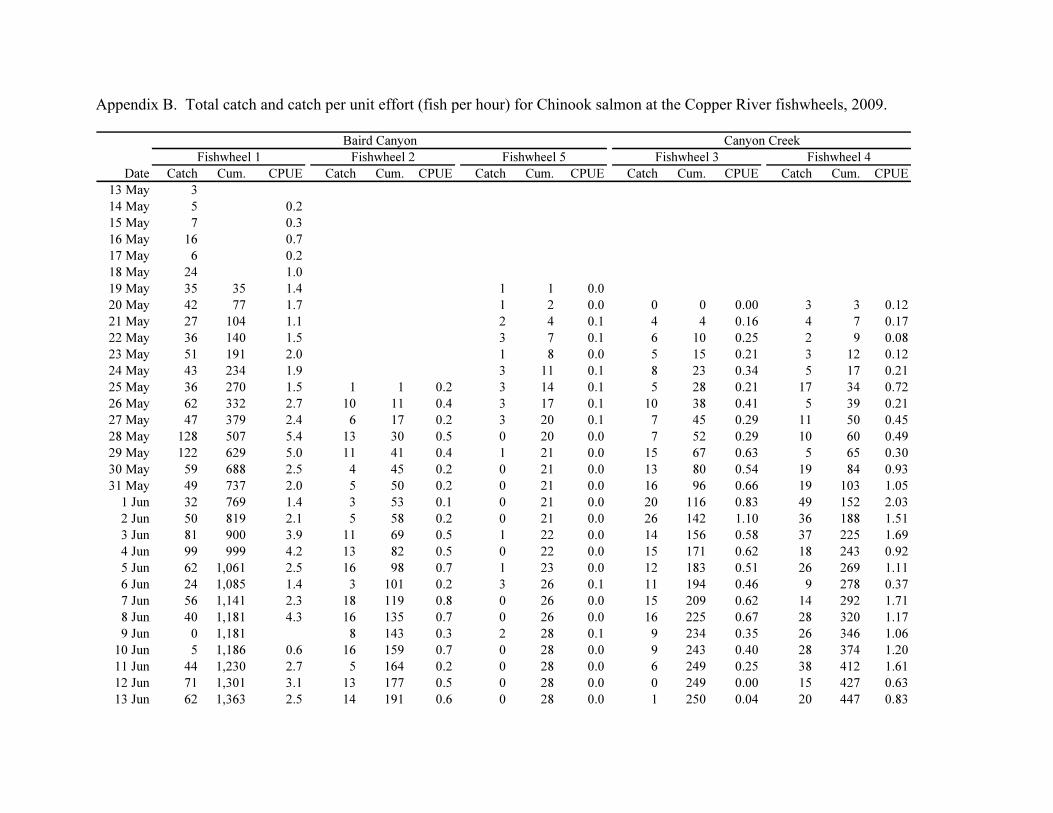
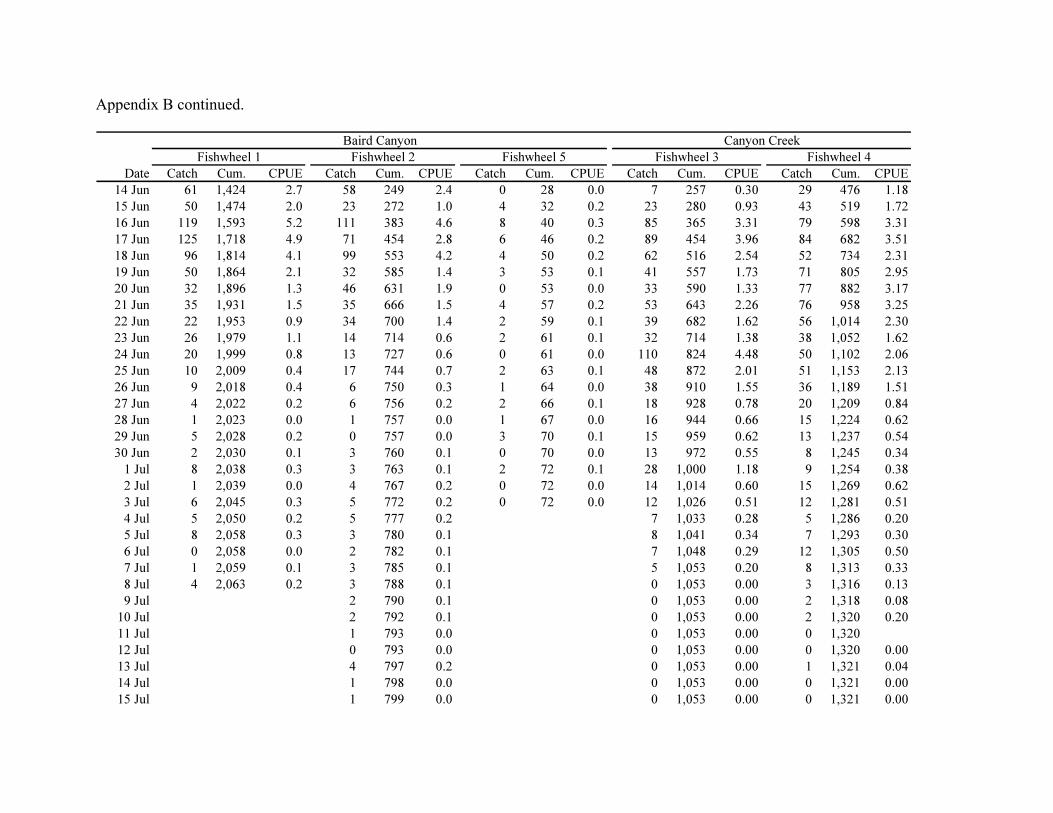
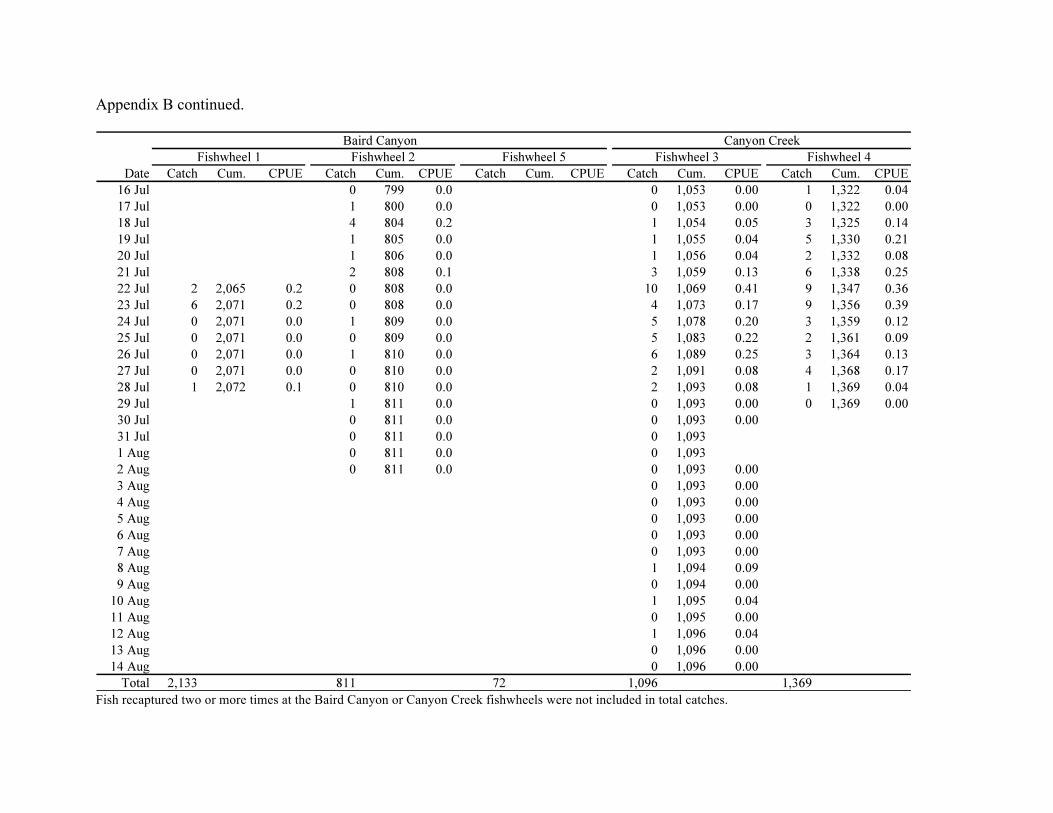
Appendix B. Total catch and catch per unit effort (fish per hour) for Chinook salmon at the Copper River fishwheels, 2009. ....................................................................................... 5
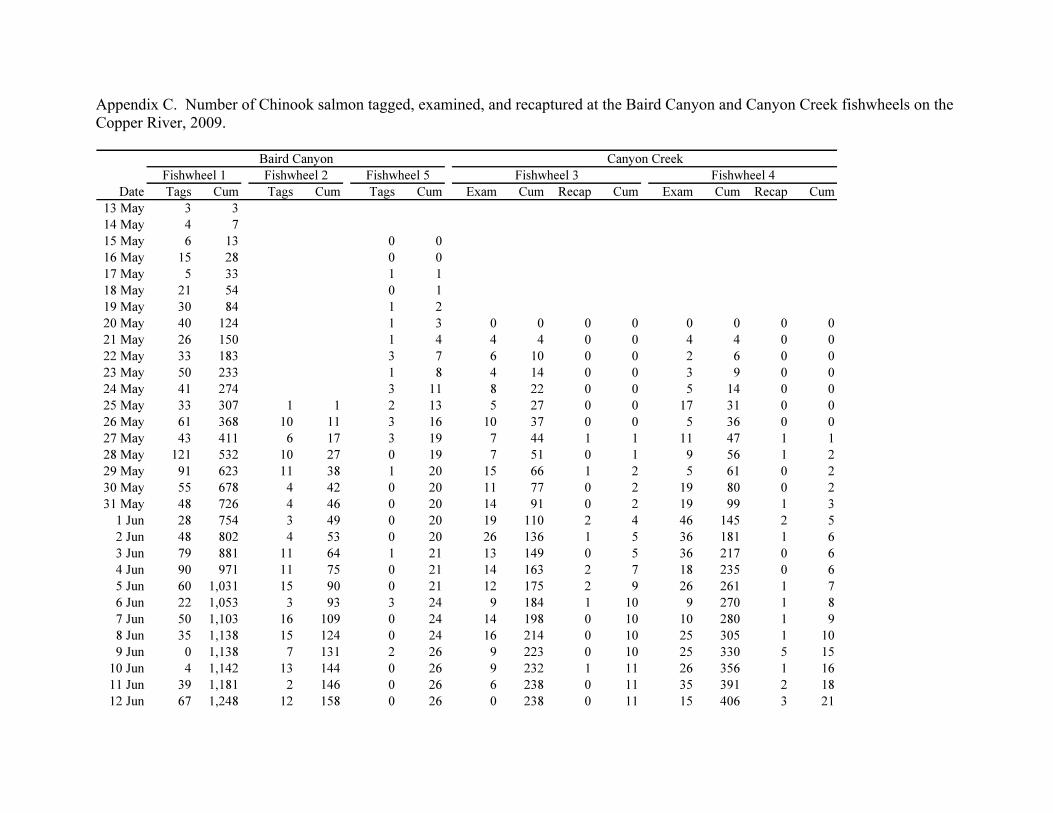
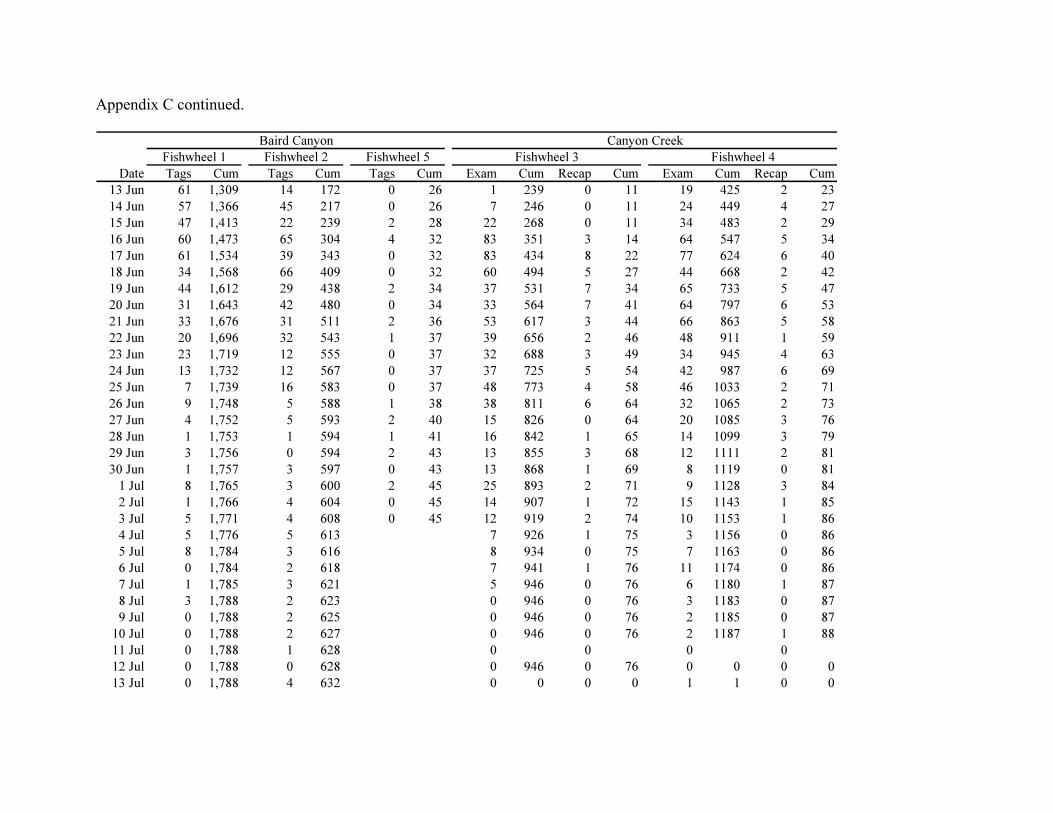
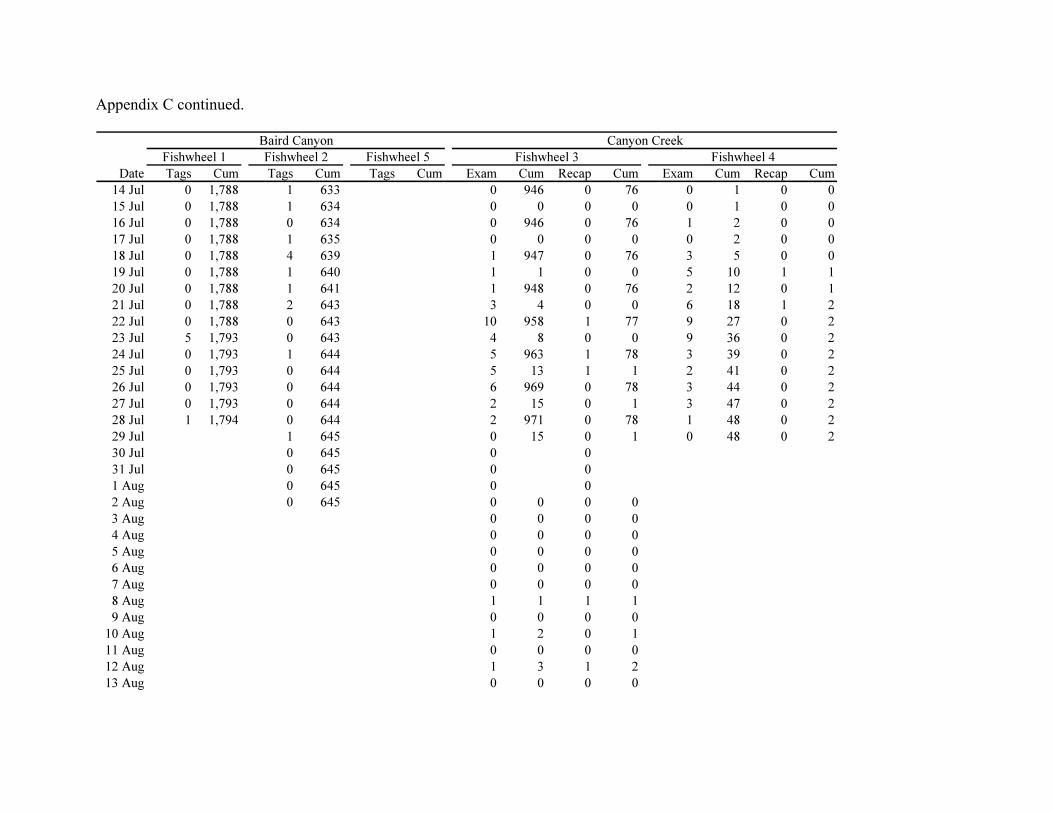
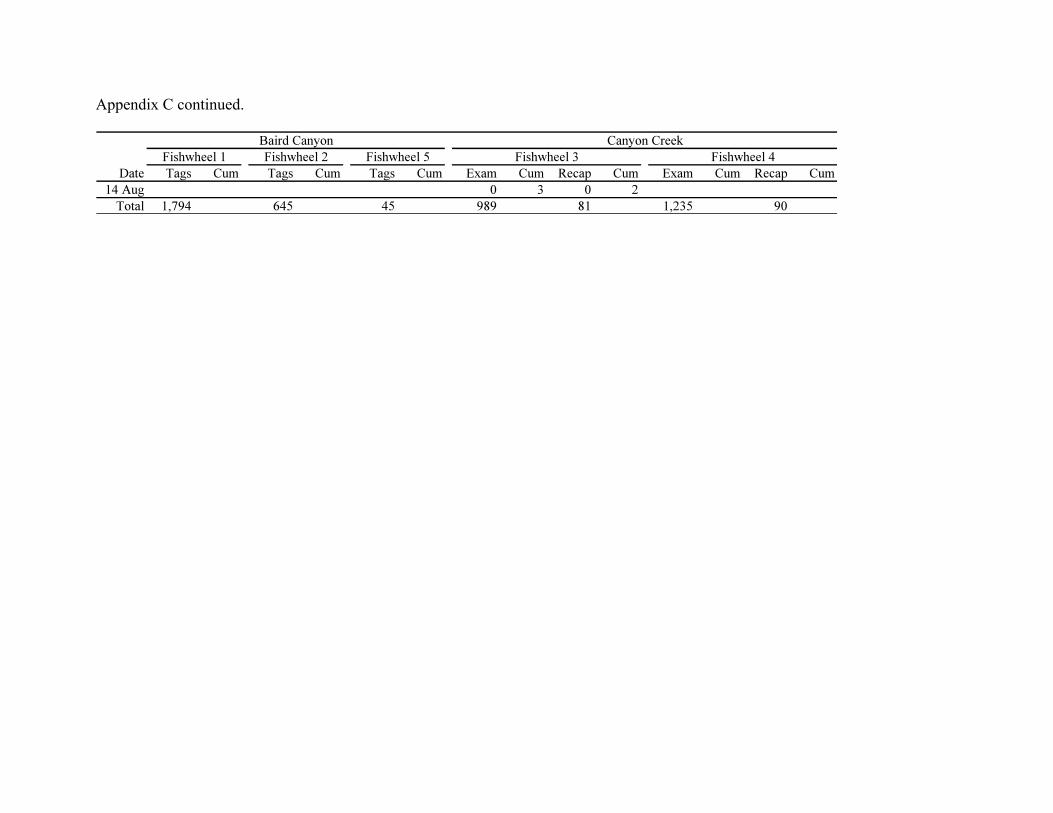
Appendix C. Number of Chinook salmon tagged, examined, and recaptured at the Baird Canyon and Canyon Creek fishwheels on the Copper River, 2009............................................... 8
vii
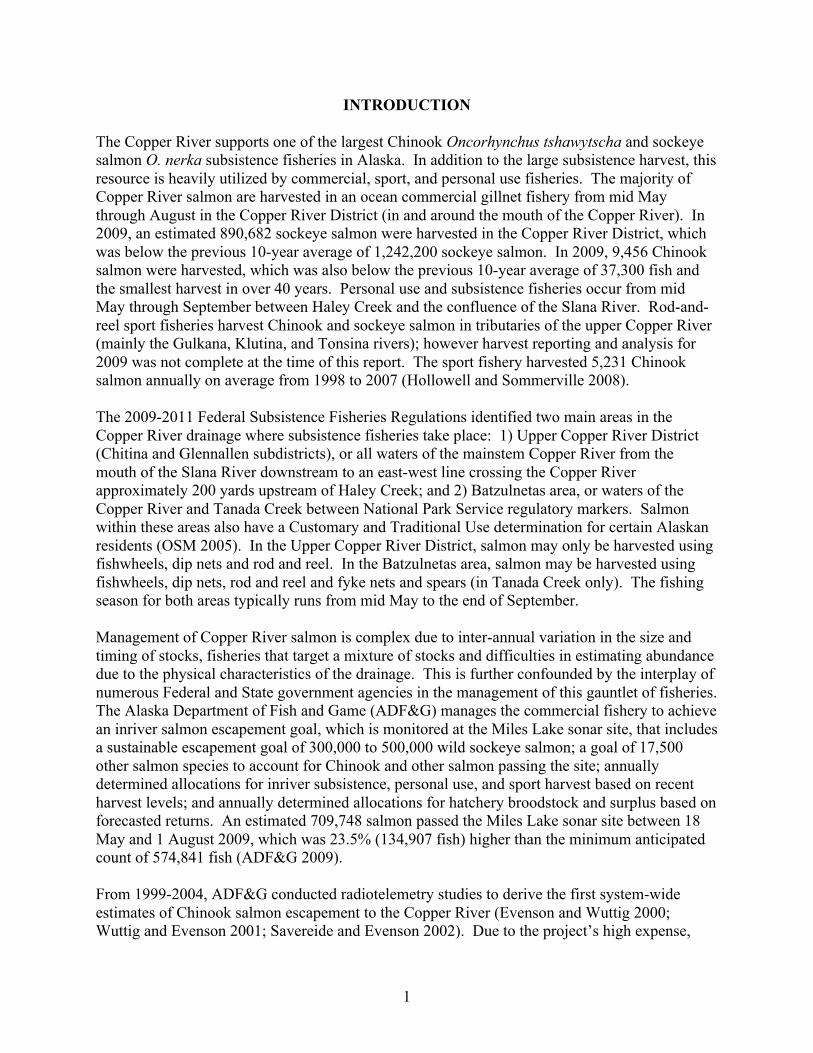
ABSTRACT The purpose of this project was to use fishwheels and two-sample mark-recapture methods for long-term monitoring of Chinook salmon Oncorhynchus tshawytscha escapement on the Copper River. This report summarizes results from the 2009 field season, the ninth year since the project’s inception. The main objective for 2009 was to estimate the inriver abundance of Chinook salmon returning to the Copper River such that the estimate was within 25% of the true escapement 95% of the time. For the first sample event, up to three live-capture fishwheels were operated at Baird Canyon for a total of 3,490 h from 13 May to 2 August. During this period, 2,484 adult Chinook salmon were marked. For the second sample event, up to two fishwheels were operated at Canyon Creek near the lower end of Wood Canyon for 3,569 h from 19 May to 15 August. A total of 2,465 Chinook salmon were examined for marks, of which 171 fish were marked. Using a temporally stratified Darroch estimator, the estimated abundance of Chinook salmon measuring 500 mm FL or greater that migrated upstream of Baird Canyon from 13 May to 2 August was 32,401 (SE = 2,365). The median travel time of Chinook salmon marked at Baird Canyon and recaptured at Canyon Creek (91 km upstream) was 10.1 d. Funding for this study by the Fisheries Resource Monitoring Program (FRMP) has been approved through 2013. This highly successful and long-term monitoring program has made NVE an integral part of Copper River salmon research. Citation: van den Broek, K. M., T. M. Haluska, and J. J. Smith. 2010. Estimating the inriver abundance of Copper River Chinook salmon, 2009 annual report. U.S. Fish and Wildlife Service, Office of Subsistence Management, Fisheries Resource Monitoring Program (Study No. 07-503), Anchorage, Alaska.
1
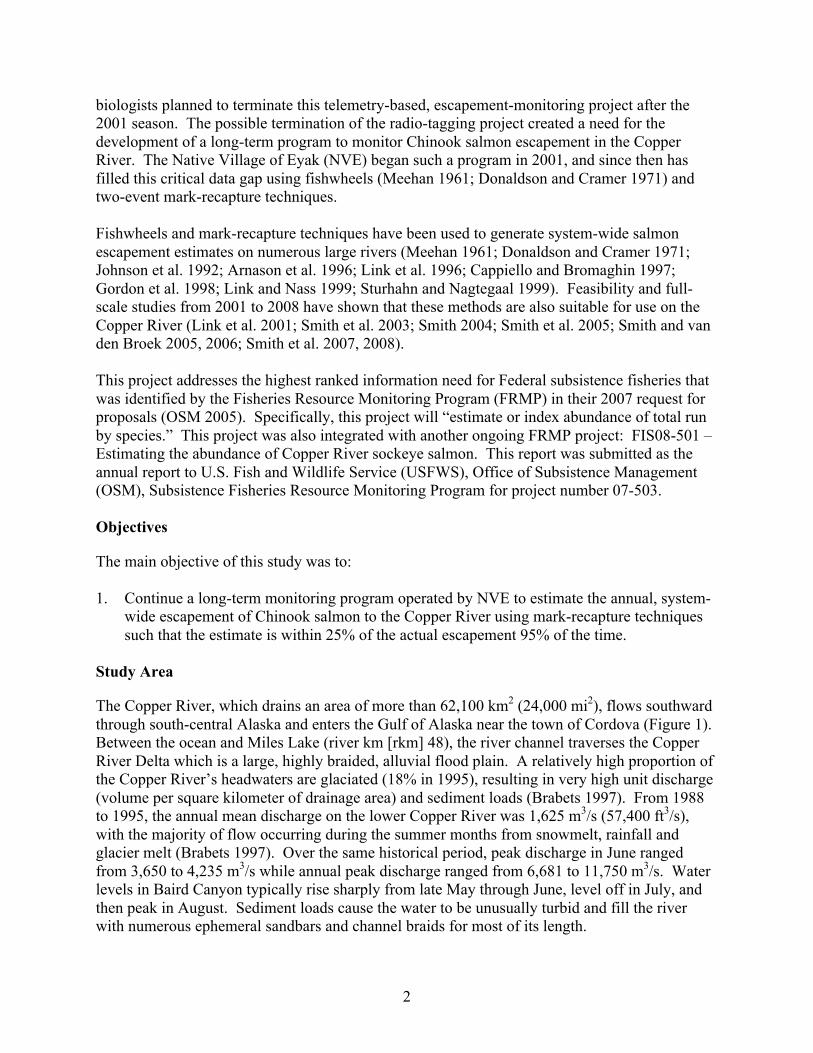
INTRODUCTION The Copper River supports one of the largest Chinook Oncorhynchus tshawytscha and sockeye salmon O. nerka subsistence fisheries in Alaska. In addition to the large subsistence harvest, this resource is heavily utilized by commercial, sport, and personal use fisheries. The majority of Copper River salmon are harvested in an ocean commercial gillnet fishery from mid May through August in the Copper River District (in and around the mouth of the Copper River). In 2009, an estimated 890,682 sockeye salmon were harvested in the Copper River District, which was below the previous 10-year average of 1,242,200 sockeye salmon. In 2009, 9,456 Chinook salmon were harvested, which was also below the previous 10-year average of 37,300 fish and the smallest harvest in over 40 years. Personal use and subsistence fisheries occur from mid May through September between Haley Creek and the confluence of the Slana River. Rod-and-reel sport fisheries harvest Chinook and sockeye salmon in tributaries of the upper Copper River (mainly the Gulkana, Klutina, and Tonsina rivers); however harvest reporting and analysis for 2009 was not complete at the time of this report. The sport fishery harvested 5,231 Chinook salmon annually on average from 1998 to 2007 (Hollowell and Sommerville 2008). The 2009-2011 Federal Subsistence Fisheries Regulations identified two main areas in the Copper River drainage where subsistence fisheries take place: 1) Upper Copper River District (Chitina and Glennallen subdistricts), or all waters of the mainstem Copper River from the mouth of the Slana River downstream to an east-west line crossing the Copper River approximately 200 yards upstream of Haley Creek; and 2) Batzulnetas area, or waters of the Copper River and Tanada Creek between National Park Service regulatory markers. Salmon within these areas also have a Customary and Traditional Use determination for certain Alaskan residents (OSM 2005). In the Upper Copper River District, salmon may only be harvested using fishwheels, dip nets and rod and reel. In the Batzulnetas area, salmon may be harvested using fishwheels, dip nets, rod and reel and fyke nets and spears (in Tanada Creek only). The fishing season for both areas typically runs from mid May to the end of September. Management of Copper River salmon is complex due to inter-annual variation in the size and timing of stocks, fisheries that target a mixture of stocks and difficulties in estimating abundance due to the physical characteristics of the drainage. This is further confounded by the interplay of numerous Federal and State government agencies in the management of this gauntlet of fisheries. The Alaska Department of Fish and Game (ADF&G) manages the commercial fishery to achieve an inriver salmon escapement goal, which is monitored at the Miles Lake sonar site, that includes a sustainable escapement goal of 300,000 to 500,000 wild sockeye salmon; a goal of 17,500 other salmon species to account for Chinook and other salmon passing the site; annually determined allocations for inriver subsistence, personal use, and sport harvest based on recent harvest levels; and annually determined allocations for hatchery broodstock and surplus based on forecasted returns. An estimated 709,748 salmon passed the Miles Lake sonar site between 18 May and 1 August 2009, which was 23.5% (134,907 fish) higher than the minimum anticipated count of 574,841 fish (ADF&G 2009). From 1999-2004, ADF&G conducted radiotelemetry studies to derive the first system-wide estimates of Chinook salmon escapement to the Copper River (Evenson and Wuttig 2000; Wuttig and Evenson 2001; Savereide and Evenson 2002). Due to the project’s high expense,
2
biologists planned to terminate this telemetry-based, escapement-monitoring project after the 2001 season. The possible termination of the radio-tagging project created a need for the development of a long-term program to monitor Chinook salmon escapement in the Copper River. The Native Village of Eyak (NVE) began such a program in 2001, and since then has filled this critical data gap using fishwheels (Meehan 1961; Donaldson and Cramer 1971) and two-event mark-recapture techniques. Fishwheels and mark-recapture techniques have been used to generate system-wide salmon escapement estimates on numerous large rivers (Meehan 1961; Donaldson and Cramer 1971; Johnson et al. 1992; Arnason et al. 1996; Link et al. 1996; Cappiello and Bromaghin 1997; Gordon et al. 1998; Link and Nass 1999; Sturhahn and Nagtegaal 1999). Feasibility and full-scale studies from 2001 to 2008 have shown that these methods are also suitable for use on the Copper River (Link et al. 2001; Smith et al. 2003; Smith 2004; Smith et al. 2005; Smith and van den Broek 2005, 2006; Smith et al. 2007, 2008). This project addresses the highest ranked information need for Federal subsistence fisheries that was identified by the Fisheries Resource Monitoring Program (FRMP) in their 2007 request for proposals (OSM 2005). Specifically, this project will “estimate or index abundance of total run by species.” This project was also integrated with another ongoing FRMP project: FIS08-501 –Estimating the abundance of Copper River sockeye salmon. This report was submitted as the annual report to U.S. Fish and Wildlife Service (USFWS), Office of Subsistence Management (OSM), Subsistence Fisheries Resource Monitoring Program for project number 07-503. Objectives
The main objective of this study was to: 1. Continue a long-term monitoring program operated by NVE to estimate the annual, system-
wide escapement of Chinook salmon to the Copper River using mark-recapture techniques such that the estimate is within 25% of the actual escapement 95% of the time.
Study Area
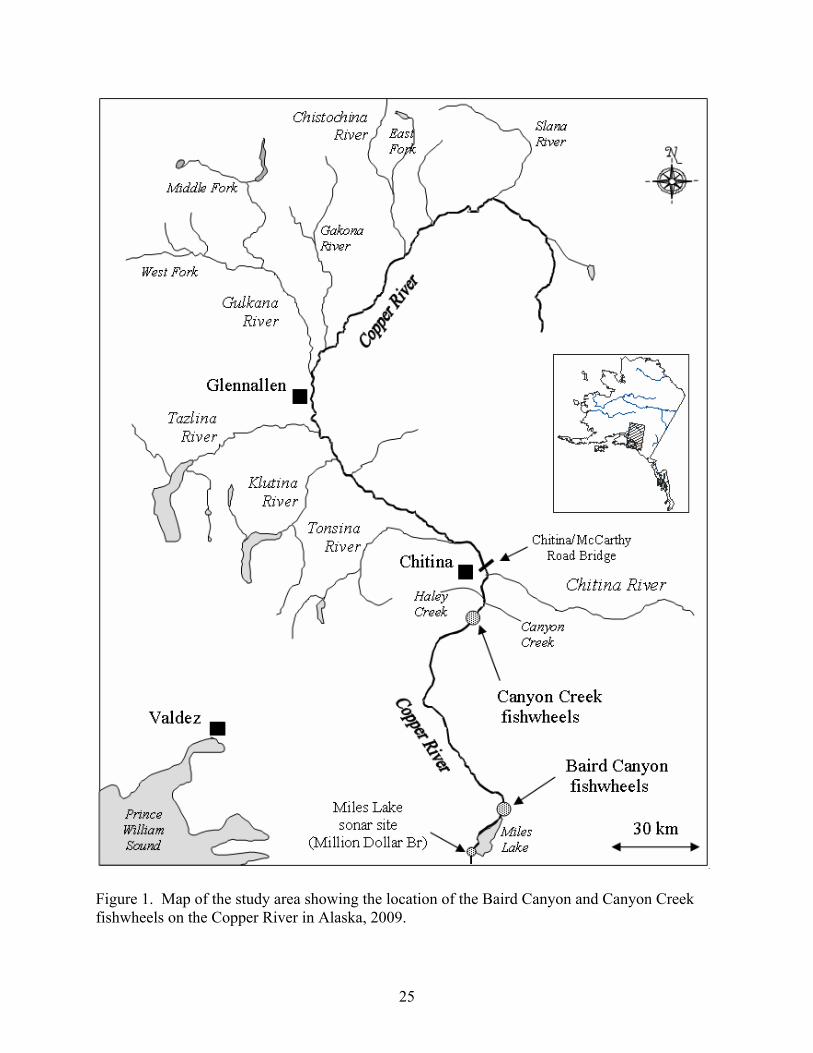
The Copper River, which drains an area of more than 62,100 km2 (24,000 mi2), flows southward through south-central Alaska and enters the Gulf of Alaska near the town of Cordova (Figure 1). Between the ocean and Miles Lake (river km [rkm] 48), the river channel traverses the Copper River Delta which is a large, highly braided, alluvial flood plain. A relatively high proportion of the Copper River’s headwaters are glaciated (18% in 1995), resulting in very high unit discharge (volume per square kilometer of drainage area) and sediment loads (Brabets 1997). From 1988 to 1995, the annual mean discharge on the lower Copper River was 1,625 m3/s (57,400 ft3/s), with the majority of flow occurring during the summer months from snowmelt, rainfall and glacier melt (Brabets 1997). Over the same historical period, peak discharge in June ranged from 3,650 to 4,235 m3/s while annual peak discharge ranged from 6,681 to 11,750 m3/s. Water levels in Baird Canyon typically rise sharply from late May through June, level off in July, and then peak in August. Sediment loads cause the water to be unusually turbid and fill the river with numerous ephemeral sandbars and channel braids for most of its length.
3
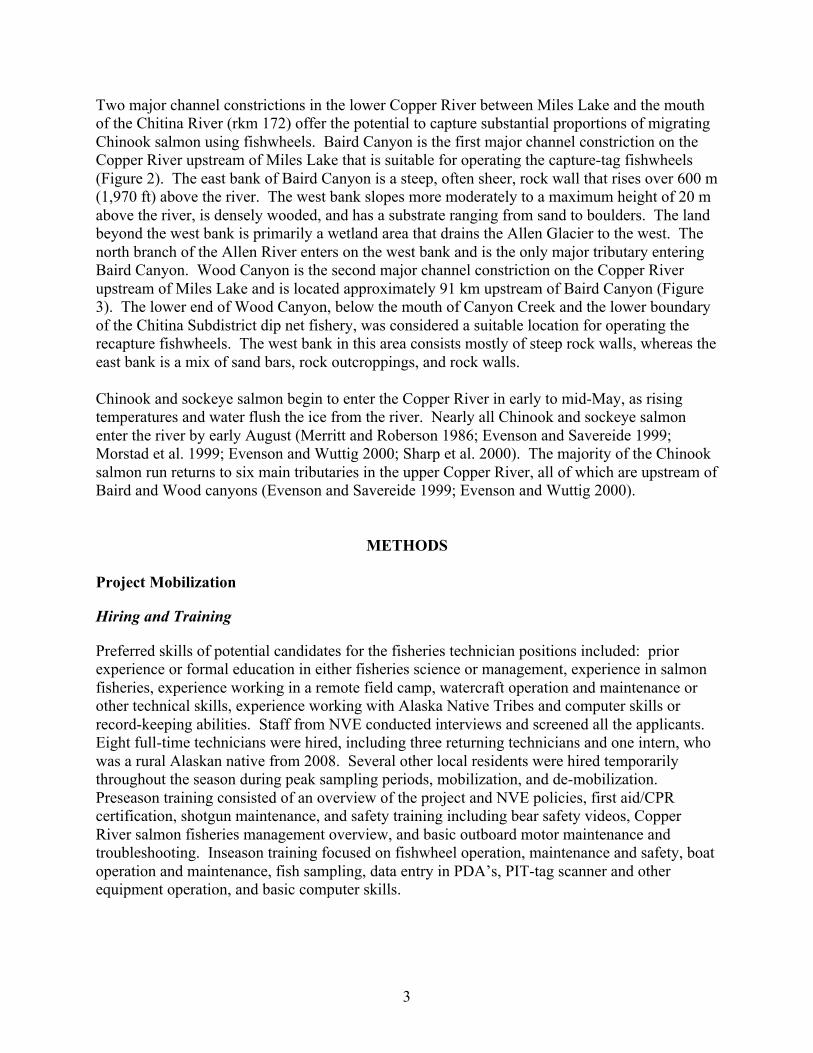
Two major channel constrictions in the lower Copper River between Miles Lake and the mouth of the Chitina River (rkm 172) offer the potential to capture substantial proportions of migrating Chinook salmon using fishwheels. Baird Canyon is the first major channel constriction on the Copper River upstream of Miles Lake that is suitable for operating the capture-tag fishwheels (Figure 2). The east bank of Baird Canyon is a steep, often sheer, rock wall that rises over 600 m (1,970 ft) above the river. The west bank slopes more moderately to a maximum height of 20 m above the river, is densely wooded, and has a substrate ranging from sand to boulders. The land beyond the west bank is primarily a wetland area that drains the Allen Glacier to the west. The north branch of the Allen River enters on the west bank and is the only major tributary entering Baird Canyon. Wood Canyon is the second major channel constriction on the Copper River upstream of Miles Lake and is located approximately 91 km upstream of Baird Canyon (Figure 3). The lower end of Wood Canyon, below the mouth of Canyon Creek and the lower boundary of the Chitina Subdistrict dip net fishery, was considered a suitable location for operating the recapture fishwheels. The west bank in this area consists mostly of steep rock walls, whereas the east bank is a mix of sand bars, rock outcroppings, and rock walls. Chinook and sockeye salmon begin to enter the Copper River in early to mid-May, as rising temperatures and water flush the ice from the river. Nearly all Chinook and sockeye salmon enter the river by early August (Merritt and Roberson 1986; Evenson and Savereide 1999; Morstad et al. 1999; Evenson and Wuttig 2000; Sharp et al. 2000). The majority of the Chinook salmon run returns to six main tributaries in the upper Copper River, all of which are upstream of Baird and Wood canyons (Evenson and Savereide 1999; Evenson and Wuttig 2000).
METHODS Project Mobilization
Hiring and Training
Preferred skills of potential candidates for the fisheries technician positions included: prior experience or formal education in either fisheries science or management, experience in salmon fisheries, experience working in a remote field camp, watercraft operation and maintenance or other technical skills, experience working with Alaska Native Tribes and computer skills or record-keeping abilities. Staff from NVE conducted interviews and screened all the applicants. Eight full-time technicians were hired, including three returning technicians and one intern, who was a rural Alaskan native from 2008. Several other local residents were hired temporarily throughout the season during peak sampling periods, mobilization, and de-mobilization. Preseason training consisted of an overview of the project and NVE policies, first aid/CPR certification, shotgun maintenance, and safety training including bear safety videos, Copper River salmon fisheries management overview, and basic outboard motor maintenance and troubleshooting. Inseason training focused on fishwheel operation, maintenance and safety, boat operation and maintenance, fish sampling, data entry in PDA’s, PIT-tag scanner and other equipment operation, and basic computer skills.
4
Permit Requirements
In order to access and operate both field camps and install the fishwheels on the Copper River (including anchoring them to the shore), land-use permits were obtained from the U.S. Forest Service (USFS), Alaska Department of Natural Resources (Division of Mining, Land, and Water), Chugach Alaska Corporation, Eyak Corporation, and Ahtna Incorporated. Permits were also acquired from ADF&G for fish collection and sampling. All permits were obtained prior to the start of the field season. Fishwheel Design and Construction
Three tagging fishwheels (fishwheels 1, 2, and 5) were operated at Baird Canyon (rkm 66), and two recovery fishwheels (fishwheels 3 and 4) at Canyon Creek (rkm 157) in 2009. Two of the fishwheels at Baird Canyon (fishwheels 1 and 2) and one fishwheel at Canyon Creek (fishwheel 3) were large aluminum models built for fishing against deep canyon walls. Fishwheels 1 and 2 were made of two, welded aluminum pontoons (11.6 m long x 0.9 m wide x 0.5 m deep), a 3.7 m long axle, three baskets (3.0 x 3.0 m x 2.1 m), and a tower (6.1 m high) and boom (4.9 m long) assembly that was used to raise and lower the axle. The baskets were designed to fish up to about 3 m below the water surface and were lined with knotless nylon mesh (6.4 cm stretch). Fishwheel 3 was designed similar to fishwheels 1 and 2 except the baskets were shorter, which allowed it to fish at shallower depths present in the Canyon Creek area. An aluminum tank (4.3 m long x 1.5 m deep x 0.6 m wide) for holding captured fish was fitted inside each pontoon. The bottom of each live tank was fitted with windows of extruded aluminum mesh to allow for ample water circulation. The third fishwheel at Baird Canyon (fishwheel 5) was similar in design to fishwheel 4 that operated at Canyon Creek. These fishwheels were composed of two aluminum pontoons (11.6 m long x 0.6 m wide x 0.5 m deep), four lumber and spruce pole baskets (2 m long x 1.8 m wide x 0.8 m deep), and a tower assembly designed to raise and lower the axle. The baskets were lined with knotless nylon mesh (6.4 cm stretch). As with the other fishwheels, each live tank was fitted with windows of extruded aluminum mesh and an escape panel. Mobilizing the Field Camps
At Baird Canyon, a cabin and four bunkhouses (built by NVE in the summer of 2008) served as the field camp in 2009. The camp was located on the west bank of the Copper River approximately 2 km upstream from the upper end of Baird Canyon (Figure 2), and was supplied by helicopter, boat or plane from Cordova. The Canyon Creek camp, which was located on the east bank of the Copper River approximately 12 km downstream from Chitina (Figure 3), consisted of two Weatherport tents and individual wall tents for crew members. The upriver camp was supplied mainly by boat from Chitina. Mobilization at both camps was timed to ensure that the fishwheels were operational as soon as the river ice cleared and the first salmon began migrating past each location.
5
Camp Communication
The field crews followed a specific communication protocol to ensure that the camps were operated as safely and efficiently as possible. Each camp was equipped with a base-station VHF and several handheld VHF radios, Iridium satellite telephones, and a Starband satellite internet system (McLean, VA) that provided continuous high-speed internet access. These systems were powered by an array of 6-V batteries (wired to provide 12-V power) at Baird Canyon and 12-V batteries at Canyon Creek. These arrays were charged by a combination of solar panels, wind turbines and a gas-powered generator (for backup only). Each morning at a pre-arranged time, the camp lead from each camp was responsible for contacting the NVE office in Cordova via email to exchange information (e.g., provide daily fishwheel catches, place food and supply orders, arrange flights and crew changes). The majority of camp communications were conducted via the internet, with satellite phones reserved for emergencies and instances where internet was temporarily unavailable. The crew was able to communicate camp needs in a timely and cost-effective manner, receive feedback on project operations from senior managers, and provide daily catch and tag updates to ADF&G biologists and fishery managers. Fishwheel Operation and Catch
Fishwheel Operation
Suitable fishwheel sites were selected based on water depth, water velocity, accessibility, bankfull width, and protection from floating debris and rock fall. For the two large basket fishwheels used on this project, water depths greater than 3 m and velocities ranging from 0.5-1.5 m/s were needed to rotate the baskets at optimal speeds and force migrating fish to travel near shore and into the path of the fishwheels. Narrow, fast-flowing channels tend to concentrate migrating salmon close to shore and are thus preferred to wide, slow-flowing areas. The small, three and four-basket fishwheels could operate in slower water velocities and shallower depths than the large fishwheels. The basket assembly of fishwheels 3, 4, and 5 could also be raised or lowered as water levels changed throughout the season. The two large fishwheels used in 2009 were installed and operated similar to the methods used in previous years. A rock drill was used to set steel anchor pins into the rock walls at the Baird Canyon and Canyon Creek fishwheel sites. Anchor lines attached to these pins consisted of galvanized wire rope (1.3 cm dia) and polypropylene rope (1.9 cm dia). To hold the two smaller fishwheels in place when fishing along gravel bars, a boat anchor was buried 1.5 m deep on the river bank approximately 30 m upstream of the fishing site. Wire rope (1.3 cm dia) was then attached to the fishwheel at one end and to the anchor at the other end. Wood-pole or aluminum-plank spars were used to hold the bow of the fishwheels off the river bank or cliff. Two, propeller-driven, outboard motors were mounted on transoms at the stern of the fishwheel pontoons and were used to move the fishwheels between sites. Fishwheels were re-positioned upriver and downriver by adjusting the bow anchor lines, and laterally by adjusting the stern and side anchor lines or repositioning the spar. The fishwheels were operated 24 hours per day except for stoppages when they were being re-positioned or repaired, or when catches were too high to fish them overnight. Opening or closing of escapement panels was used to regulate capture of sockeye or smaller sized Chinook salmon,
6
limiting fish retention to only those times when they were required for sampling to avoid overcrowding of the live tanks. Fishwheel speed (revolutions per minute, RPM) was determined one or more times each day by measuring the time required for the fishwheel baskets to complete three revolutions, thus mitigating for the effects of temporary surges in water velocity. If fishwheel speed was recorded more than once in a day, the arithmetic mean of the measurements was calculated. Daily water levels (m) at both camps were measured from an aluminum staff gauge that was secured to the canyon wall near the fishwheels. Fishwheel Catch and Effort
Two forms of fishwheel effort were calculated. First, daily fishing effort was computed as the number of hours that a fishwheel operated on a given calendar day from midnight to midnight. Second, effort for calculating catch per unit effort (CPUE) was computed as the number of hours that a fishwheel fished to obtain a given day’s catch. These two effort values were often not the same for a given day because the live tanks were not always emptied of fish at the exact same times each evening. For example, if fish were last sampled at 2200 hours on day t and last sampled on day t+1 at 2000 hours, then only 22 hours of fishing effort was used to obtain the effort for calculating CPUE on day t+1 (assuming uninterrupted fishwheel operation). However, in this example, the daily fishing effort on day t+1 would be 24 hours because the fishwheel operated continuously for the entire calendar day. Effort for calculating CPUE on day t+1 could also exceed 24 hours if the last sampling session on day t was earlier in the day than the last sampling session on day t+1. Additionally, daily effort for capture of sockeye salmon was distributed sporadically between different fishwheels and live tanks to ensure random sampling with minimal pressure on the fish. Therefore, effort for calculating CPUE for sockeye was generally considerably less than 24 hours for any fishwheel on any given day, even though actual daily fishing effort was 24 hours. To calculate CPUE (fish per fishwheel hour), the total number of fish captured on a given calendar day was divided by that day’s effort for CPUE. In order to reduce the potential for high densities and crowding of fish in the live tanks during periods when sockeye were not being sampled, escape panels were installed in the live tanks of all project fishwheels (see Photo 6 on p. 84 in Smith et al. 2003). The escape panels consisted of two, adjustable vertical slots in a removable aluminum frame. When installed and opened to the appropriate width (6-7 cm), the escape panels allow smaller fish (e.g., sockeye and by-catch species) to easily swim out of the live tanks while retaining Chinook salmon. As a result, the escape panels reduce crowding and the potential for sampling mortalities during high-catch periods as well as the amount of crew labor for handling fish. Tests in 2004 indicated that the escape panels allowed 69-100% of sockeye salmon to escape from the live tanks, while retaining 100% of the adult Chinook salmon captured (Smith 2004). Tag Application and Recovery
Two to four times per day, depending on catches, crews at Baird Canyon and Canyon Creek removed all fish in the live tanks of each fishwheel. All fish were identified to species and counted. All Chinook salmon were sexed, measured for fork length (FL), inspected for an adipose fin (a missing adipose fin indicated a coded-wire-tagged hatchery fish) and examined for marks, scars or bleeding. Salmon were transferred with a dip net from the live tanks to a V-
7
shaped, water-filled, foam-lined trough (with a fixed measuring tape) for sampling. Water in the trough was changed repeatedly throughout each sampling session. At Baird Canyon, all Chinook salmon greater than 500 mm FL and in good condition were marked (up to a maximum of 100 per day) with a 134.2 kHz, passive RFID transponder (ENSID Technologies, Inc, Auckland, New Zealand). The transponder was encapsulated on a t-bar style tag with two, 25 mm monofilament lines that terminated in perpendicular 9 mm anchor bars (herein referred to as a TBA-PIT tag). NVE’s address and phone number were printed on a 45 mm piece of yellow PVC marker (Hallprint Pty Ltd, Adelaide South Australia). Unique tag numbers were electronically encoded and read via a PDA with integrated RFID scanner. The TBA-PIT tags were a new technology specially designed and constructed for these projects. Tags were supplied in magazine clips of 20 tags each, and were applied to fish using a hand held applicator gun with a 16 gauge needle. The tip of the needle was sunk into the musculature of the fish 1-2 cm ventral to the insertion of the dorsal fin between the third and forth pterygiophores, to a depth of 1-2 cm, so that the tag anchors would lodge behind the pterygiophores within the dorsal musculature when ejected from the applicator gun. Chinook salmon also received a small hole punched in the right operculum. In addition to the general sampling procedures described above (i.e., counting, recording length and sex, and examining for adipose fin and physical marks), all salmon caught at the Canyon Creek fishwheels were physically examined for a tag and scanned with a PDA with a built in RFID scanner to record the unique ID if a tag was observed. Since the TBA-PIT tags were external and easily seen, and each fish was handled by the crew, it is unlikely that a tagged fish was captured and not observed at the Canyon Creek fishwheels. Inriver Abundance Estimates
Conditions for a Consistent Abundance Estimate
Two-sample mark-recapture methods were used to estimate the inriver abundance of adult Chinook and sockeye salmon above the Baird Canyon fishwheels. These abundance estimates are potentially biased if any of the assumptions inherent to the mark-recapture model are violated (Ricker 1975; Seber 1982). Handling and tagging fish did not make them more or less vulnerable to recapture than untagged fish. There was no explicit test for this assumption because the behavior of untagged fish could not be assessed. Sampling sessions were frequent (minimum of three times per day) to ensure that fish were not retained in the live tanks for long periods of time. Escape panels were used to reduce fish densities in the live tanks, particularly during periods of high sockeye salmon catches. Technicians were trained by experienced biologists on how to handle and sample fish in order to reduce the amount of stress on the fish. Visibly stressed or injured fish were not tagged. Also, the distance between the tag and recapture sites (91 km) was assumed sufficient enough to reduce the potential of handling-induced “trap happiness” or “trap shyness” in tagged fish.
8
Tagged fish did not lose their tags, and there was no mortality of tagged fish between the tagging and recovery sites. Tag loss was tested through the application of a secondary mark (operculum punch) on all tagged Chinook salmon. Only Chinook salmon that received primary and secondary marks at Baird Canyon, and fish that were examined for primary and secondary marks at Canyon Creek, were included in the calculations of abundance. The chance of a fish losing both marks between sampling events was assumed to be negligible. Fish captured at Canyon Creek with a secondary mark and no primary mark would be used to quantify tag loss. It was assumed that tag retention rates for sockeye salmon were the same as those for Chinook salmon. It was further assumed that natural mortality between sampling events was equal for tagged and untagged fish; thus the abundance estimates were germane to the tagging location at Baird Canyon. Tagged fish mixed completely with untagged fish between the sampling events. The Copper River is highly braided in some sections between Baird Canyon and Canyon Creek which reduced the chances that tagged and untagged fish remain unmixed between sample events. Results from previous years of this study have shown that recapture rates for fish tagged at Baird Canyon and recaptured at Canyon Creek were independent of the bank of capture. Furthermore, studies from 1999-2001 showed equal mixing of tagged and untagged Chinook salmon between the lower end of Wood Canyon and the CSS fishery (Evenson and Wuttig 2000; Wuttig and Evenson 2001; Savereide and Evenson 2002), a much shorter distance than between the Baird Canyon and Canyon Creek fishwheels. Contingency tables and Chi-square tests were used to compare mark and recapture rates by bank of capture in 2007 for Chinook and sockeye salmon. Fish had equal probabilities of being marked or equal probabilities of being recaptured regardless of size. To test for size-selective sampling at the fishwheels, Kolmogorov-Smirnov (K-S) two-sample tests (Zar 1984) were used to compare the cumulative length-frequency distributions of: (1) a subsample of fish tagged during the first sampling event and a subsample of fish recaptured during the second event; and (2) a subsample of fish tagged during the first sampling event and a subsample of fish examined during the second event (as presented in Bernard and Hansen 1992). Fish had equal probabilities of being marked regardless of time of capture. Apart from minor fishwheel stoppages for repairs and moves, fishing effort at the Baird Canyon fishwheels was continuous throughout the study period for Chinook salmon. Fishing effort was distributed between fishwheels and river banks (spatially) to reduce the potential of bias being introduced into the experiment. Period-specific mark rates in the second sampling event were compared using contingency table analysis to determine whether this condition was met.
9
Marked fish had equal probabilities of being recaptured regardless of when they passed the recapture fishwheel. Period-specific recapture rates in the second event were compared using contingency table analysis. If both the mark and recapture rates varied among periods and a sufficient number of recaptures were available, a temporally stratified estimator would be used. Abundance Estimate
One of two models was used to provide mark-recapture estimates: the pooled Petersen estimator (PPE) with Chapman’s correction (Seber 1982) or the partially stratified Petersen estimator (i.e., the Darroch model (Darroch 1961)). Schwarz and Taylor (1998) provide thorough descriptions of both models. The PPE pools all of the data from the entire sampling season to estimate abundance, whereas the Darroch model is used to stratify the data into groups with similar capture and/or movement probabilities (in this case temporally). The abundance estimate was calculated using the software SPAS (Arnason et al. 1996). For the Darroch estimator, temporal strata were chosen via an iterative process of trying all possible cut-points along the daily transition matrix. The matrix was first stratified into two tagging and two recovery strata. All possible 2×2 stratifications were performed and for each the chi-square statistic from the equal movement test was recorded. Stratifications that rendered cells in the expected frequency table with a value less than 5 were dismissed. Of the remaining stratifications, the one that resulted in the greatest chi-square value was used to stratify the daily matrix. This approach divided the daily matrix into four cells that were the most different with respect to movement and/or capture probabilities, and therefore, the most homogenous within. Additional stratifications were performed on cells lying along the diagonal from top left to bottom right until there were too few recoveries to allow further stratification, or until the population estimate stabilized (i.e., additional stratifications caused little change in N). Schwarz and Taylor (1998) recommended the equal movement test for determining when to pool adjacent tagging strata; namely, low chi-square values indicate pooling is acceptable because of equality of movement across the strata. This concept was extended to allow objective determination of temporal strata and facilitate estimation from the Darroch maximum-likelihood (ML) model. Sometimes stratification schemes will not form a Darroch ML estimate, but this algorithm always seems to produce matrices that will (further investigation as to why is warranted).
RESULTS Project Mobilization
Mobilization of the Baird Canyon camp began on 6 May. Six technicians, one project manager, one biologist, one Starband installation technician, and gear were flown to camp on several round-trip flights via helicopter (A-Star, Era Helicopters, Valdez). Open water and some ice were present throughout the Copper River from above Baird Canyon at the Bremner River confluence downstream to the Mile 27 and Mile 38 bridges. Miles Lake was ice locked and not navigable by boat until approximately 12 May. Snow cover was approximately 1.5-m deep upon arrival at camp and much of the equipment was partially buried but in good condition.
10
Fishwheel 1 began fishing at Baird Canyon on 13 May, followed by fishwheel 5 on 15 May and fishwheel 2 on 25 May. Mobilization of the Canyon Creek camp began on 15 May. Equipment, boats, and vehicles were moved from storage locations in Cordova, Glennallen, and Gakona to the camp site using trucks and jet boats. Fishwheels 3 and 4 required substantial repairs. Due to regular wear-and-tear during the previous season, the baskets on fishwheel 3 had to be repaired and re-webbed. Fishwheel 4 required new bow decking and basket repair. Fishwheel 4 began fishing on 18 May followed by fishwheel 3 on 20 May. Fishwheel Operation and Catch
Fishwheel Operation
Stage height of the Copper River at Baird Canyon varied by 6.3 m from 13 May to 2 August (Figure 4). At Canyon Creek, stage height varied by 4.5 m from 18 May to 15 August. Water levels rose slowly in late May, increased quickly in early June, and fluctuated throughout the remainder of the season. Stage height peaked on 31 July at both sites. In 2009, stage height of the Copper River at the Million Dollar Bridge was above the historical average from late May to mid-June, dropped below average from late June to early July, and was above average again in mid- and late-July (Figure 5). Fishwheel 1 operated on the west bank of Baird Canyon for 1,275 h (75.3% of the time) from 13 May to 28 July (Figure 6; Appendix A). Fishwheel 2 operated on the east bank of Baird Canyon for 1,131h (98.4% of the time) from 25 May to 2 August. Fishwheel 5 operated primarily on the west bank of the Copper River approximately 1.5 km upstream from Baird Canyon for 1,084 h (99.1% of the time) from 15 May to 3 July. Fishwheel speeds averaged 2.3, 1.8, and 2.9 RPM for fishwheels 1, 2, and 5, respectively (Figure 6; Appendix A). At Canyon Creek, Fishwheel 3 operated along the east bank of the Copper River approximately 2.5 km downstream from the mouth of Canyon Creek. From 20 May to 15 August, it operated for 1,962 h (94.5% of the time; Figure 6; Appendix A). Fishwheel 4 operated primarily on the west bank approximately 1.5 km downstream from the mouth of Canyon Creek, and fished for 1,607 h (94.8% of the time) from 18 May to 29 July. Fishwheel 4 also operated approximately 0.75 km upstream from the mouth of Canyon Creek on the east bank from 29 May to 6 June until water levels dropped. Fishwheel speeds averaged 1.8 and 3.9 RPM for fishwheels 3 and 4, respectively (Figure 6; Appendix A). Fishwheel Catch
A total of 3,016 adult Chinook salmon were captured at the Baird Canyon fishwheels. Of the 3,016 adult Chinook salmon captured, 2,133 were captured at fishwheel 1, 811 at fishwheel 2, and 72 at fishwheel 5 (Figure 7; Appendix B). Total daily catch peaked at 238 Chinook salmon on 16 June. Daily CPUE peaked at 5.4, 4.6, and 0.3 Chinook salmon per hour at fishwheels 1, 2, and 5, respectively (Figure 8; Appendix B). Thirty-four salmon smolts, 1 pink salmon O. gorbuscha, 1 steelhead trout O. mykiss, 79 Dolly Varden Salvelinus malma, 30 whitefish
11
Coregonus spp., 20 Pacific lamprey Lampetra tridentata, 17 sucker Catostomus sp., and 1 burbot Lota lota, were also captured and released. A total of 2,465 Chinook salmon were captured at the Canyon Creek fishwheels, including 1,096 at fishwheel 3 and 1,369 at fishwheel 4 (Figure 9; Appendix B). Daily catch peaked at 173 Chinook salmon on 17 June. Daily CPUE peaked at 4.5 and 3.5 Chinook salmon per hour at fishwheels 3 and 4 (Figure 10; Appendix B). Four coho salmon, 4 steelhead trout, 18 Dolly Varden, 118 whitefish, 30 Pacific lamprey, 79 sucker, 58 salmon smolt, and 8 arctic grayling Thymallus arcticus were also captured and released. Tag Application and Recovery
Of the 3,016 Chinook salmon that were captured at the Baird Canyon fishwheels, 2,484 fish (82%) were tagged and released (Figure 11; Appendix C). The number of tags applied on a single day peaked at 131 fish on 28 May. A total of 532 Chinook salmon were not tagged, including: 333 fish released voluntarily because the daily quota had been reached, 90 fish that escaped prior to being sampled, 100 fish that were visibly injured or stressed, and 9 mortalities. Eleven Chinook were also released that measured less than 500 mm FL. A total of 2,224 Chinook salmon were examined for marks at the Canyon Creek fishwheels; while 81 Chinook salmon escaped prior to being thoroughly examined (Figure 12; Appendix C). Of those examined, 171 (7.7%) were recaptures, or fish that had been tagged at Baird Canyon. The first two tagged fish were captured at Canyon Creek on 27 May (both tagged 21 May at fishwheel 1) and the last tagged fish was captured on 12 August (tagged on 23 July at fishwheel 1). The number of Chinook salmon examined for marks at Canyon Creek peaked at 160 fish on 17 June and the number of recaptures peaked at 14 fish on 17 June. The median travel time of Chinook salmon tagged at Baird Canyon and recaptured at Canyon Creek was 10.1 d (range: 4.4-35.3 d; Figure 13). Inriver Abundance Estimate
Conditions for a Consistent Estimator
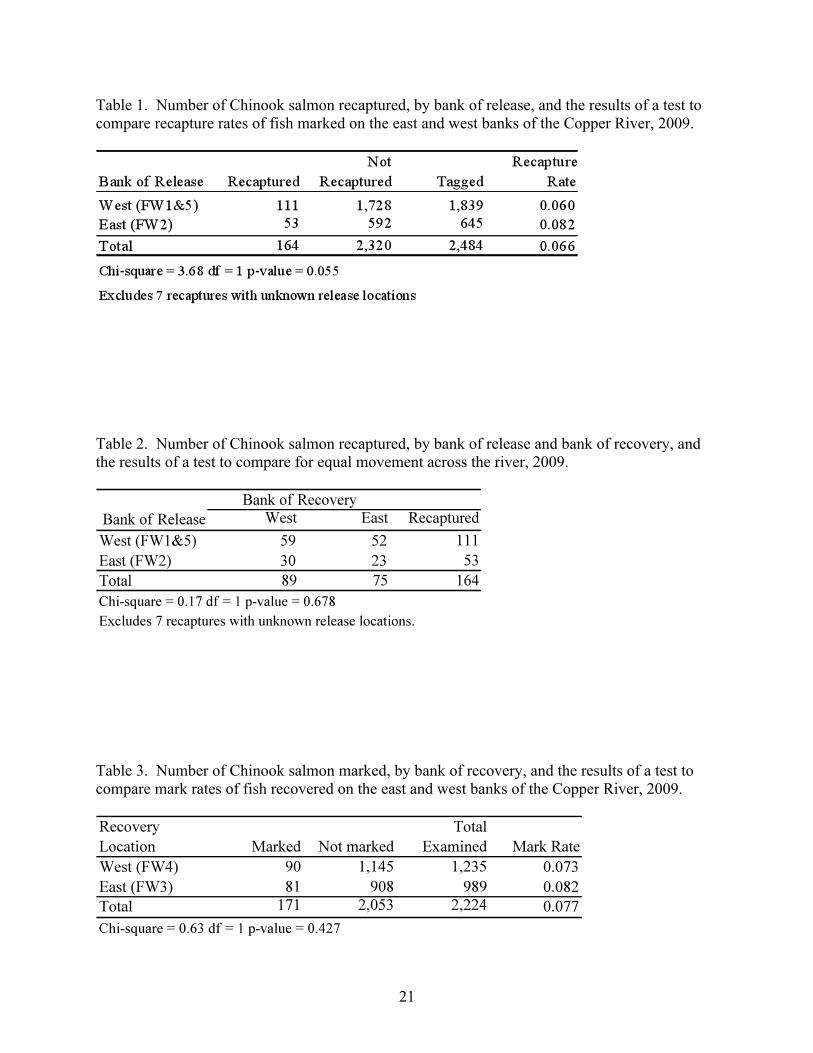
Handling and tagging procedures at Baird Canyon did not appear to significantly delay the migratory behavior of Chinook salmon. Of the 127 Chinook salmon captured more than once at the Baird Canyon fishwheels, 57 fish (44.9%) were recaptured within 1 d of being tagged. The longest delay between captures was 35 d (Figure 14). It was assumed that these migratory delays had a negligible affect on the abundance estimate. No Chinook salmon were captured at Canyon Creek with an operculum punch and no TBA-PIT tag. However, in one instance a fish was recaptured at a Baird Canyon fishwheel that had an operculum punch but no tag. Overall, primary mark loss between sampling events was assumed to be negligible. Tagged Chinook salmon appeared to move equally between banks. Recapture rates of Chinook salmon that were tagged on the west bank (6.0%) of the river at Baird Canyon were not significantly different than recapture rates of fish tagged on the east bank (8.2%; χ2 = 3.68, df = 1, P = 0.055; Table 1). A second test to assess the proportionality of movement across the river using Chinook salmon recaptures by bank of release and bank of recovery showed no significant
12
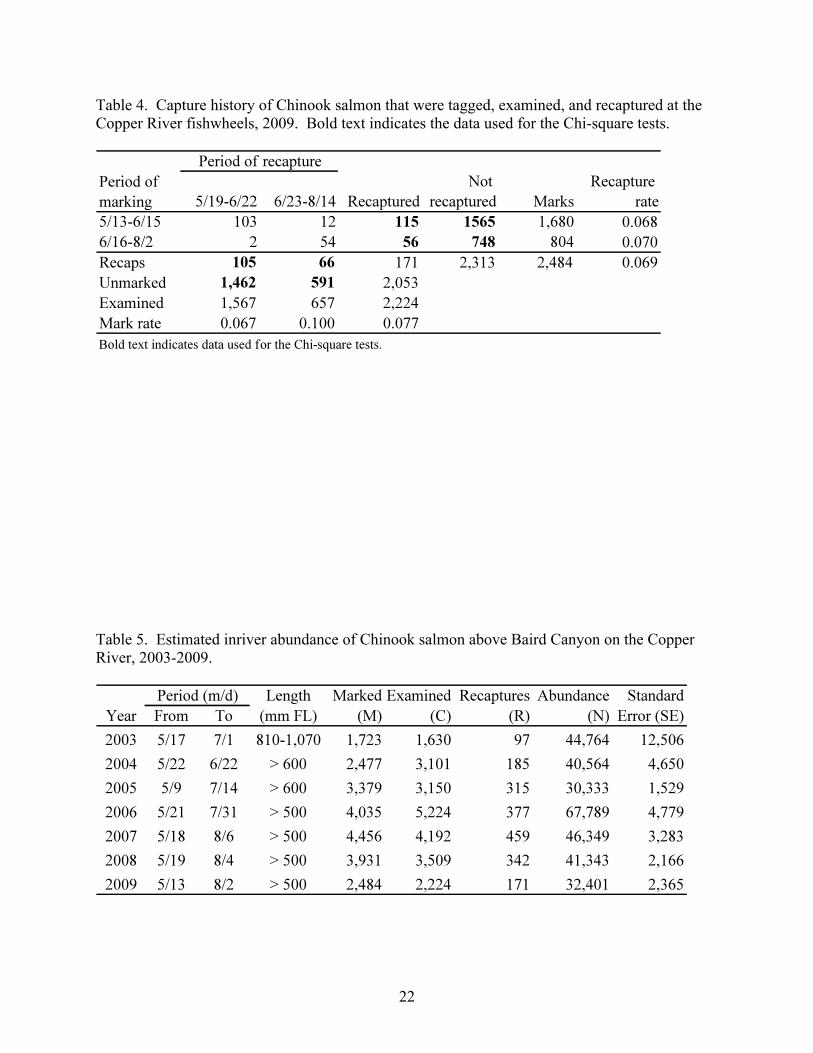
difference (χ2 = 0.17, df = 1, P = 0.678; Table 2). Furthermore, mark rates of Chinook salmon inspected on the east bank (8.2%) at Canyon Creek were not significantly higher than mark rates of fish inspected on the west bank (7.3%; χ2 = 0.63, df = 1, P = 0.427; Table 3). Cumulative length-frequency distributions of Chinook salmon marked in the first event and fish recaptured in the second event were not significantly different (Dmax = 0.089, P = 0.28; Figure 15). In contrast, cumulative length-frequency distributions of fish marked in the first event and fish examined for marks in the second event were significantly different (Dmax = 0.076, P = 0.00). No significant difference (Dmax = 0.055, P = 0.848) was found between cumulative length-frequency distributions of fish examined and recaptured in the second event. Based on these results, there was no size selectivity during either event and no stratification by size was necessary to estimate abundance. Capture statistics were summarized by period of marking and recapture over the study period (Table 4). The probability of a fish being marked at Baird Canyon was not independent of time of capture as indicated by significantly different mark rates between periods of recapture (χ2 = 7.3, df = 1, P = 0.007). In contrast, recapture rates were similar between periods of marking (χ2 = 0.03, df = 1, P = 0.087). Despite the non-significant result in this test (2 row x 2 column matrix), variability in the daily mark and recapture rates (Figures 16 and 17) indicated that a temporally stratified estimator was required to estimate abundance. Abundance Estimate
Using a maximum likelihood Darroch estimator, estimated abundance of Chinook salmon measuring 500 mm FL or greater that migrated upstream of Baird Canyon from 13 May to 2 August was 32,410 (SE = 2,365; 95% CI = 27,766-37,036; Table 5). This estimate was based on 2,484 tagged fish available for recapture, 2,224 fish examined for marks, and 171 recaptures. The Darroch estimate was 0.8% (256 fish) greater than the pooled Petersen estimate Other Tag Recoveries
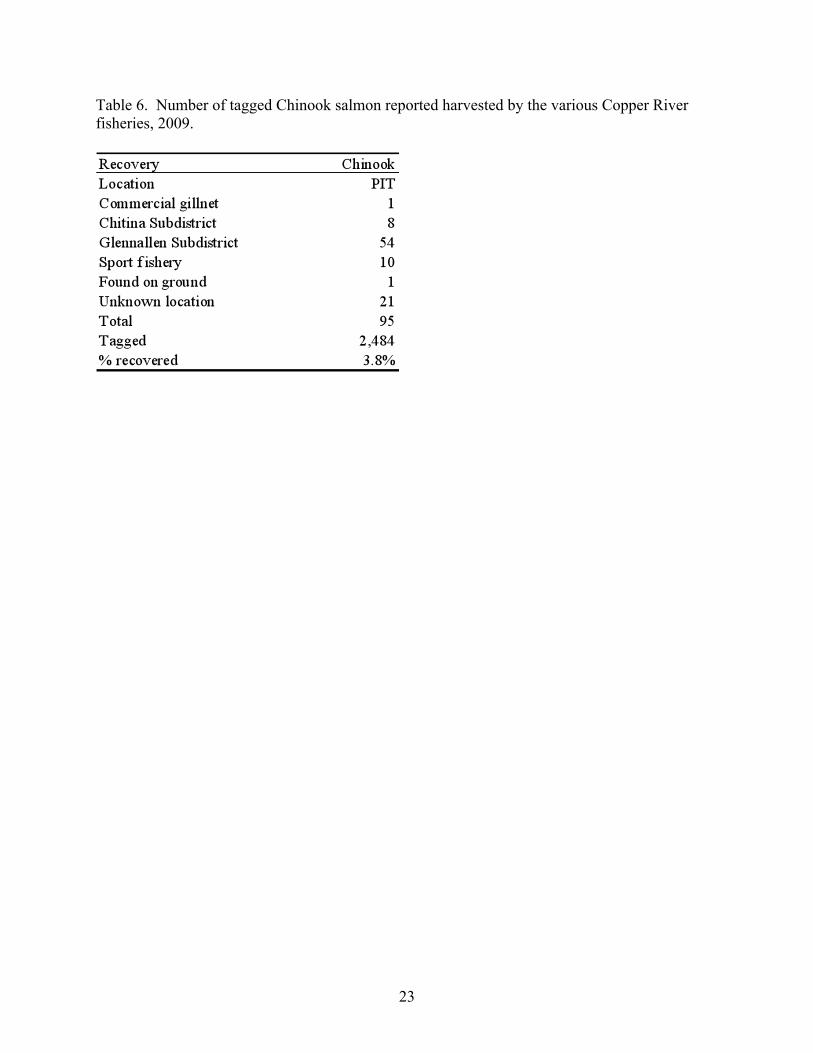
Ninety-five Chinook salmon (3.8% of total tagged) were reported harvested by the various Copper River fisheries (Table 6). Recoveries included: 10 in the sport fishery, 54 in the combined federal and state subsistence (primarily fishwheel) fisheries, 8 in the personal use dip net fishery, 1 Chinook in the Prince William Sound commercial drift gillnet fishery, and 22 Chinook where the specific fishery was not reported.
DISCUSSION Project Mobilization
In 2009, river ice was minimal as compared to previous years and snow cover was a just over 1 m deep, which was considerably less compared to the previous two seasons. It took approximately 9 d from the time the crew arrived at camp (6 May) until the successful deployment of all three fishwheels (15 May). This was comparable to 2005 (9 d), and considerably faster than the time it took to mobilize in 2004 (21 d), 2006 (18 d), 2007 (16 d) and
13
2008 (13 d) when similar environmental conditions were encountered. The first fishwheel was launched and began fishing on 13 May, followed by fishwheel 5 (15 May) and fishwheel 2 (25 May). Fishwheel 5 needed extensive repairs to the basket assembly that delayed deployment, and fishwheel 2 was delayed due to low river levels and changing conditions at the fishing site. As in previous years, the Canyon Creek fishwheels were stored intact at the camp site. Routine repairs to both fishwheels were required prior to sampling. Between repairs, logistics of preparing fishwheels, and the establishment of camp, it took approximately 5 d from the first day of mobilization on 15 May until the first wheel was actively fishing on 20 May. Camp preparation was delayed approximately 1 d due to improper storage of tents and tools from the previous season. The tents had extensive mold growth that required cleaning and the tool storage Weatherport was damaged during the winter and subsequently disorganized. With the addition of three multi-use cabins at Canyon Creek, storage of equipment will be done on site and improve mobilization efforts. Also, due to the low river levels, fishwheels had to be moved over a longer distance for deployment. This added at least 1 d to the mobilization effort. The timing and execution of mobilization at both camps was suitable given the environmental conditions in early May. No early run fish were missed at either site. Data Collection
In 2009, weatherproof PDA units with integrated RFID-PIT-tag scanners were used with new software designed specifically for the needs of this project. This significantly reduced the amount of down time due to equipment failures and minimized the chances of data loss or data-entry errors. However, some issues with the weatherproof PDA units persisted in 2009, which were partially attributed to increased sampling efficiency, being able to collect data more rapidly, and a faulty seal within some of the weatherproof PDA’s. This necessitated the use of hand-logging data on paper in order to back-up the electronic data. Fishwheel Operation and Catch
Through the first four openers (14, 18, 25, and 28 May) in the Copper River District, harvest of sockeye salmon was the 10th largest since 1980, and harvest of Chinook salmon was the smallest since 1980. The Miles Lake sonar through 29 May had counted 144,104 fish versus an anticipated 112,084 fish, resulting in the fishery opening 1 June for 36 h, 8 June for 12 h and subsequently closed until 17 June when it opened for 12 h. Conversely, during the previous three seasons (2006-08) the commercial fishery was closed by emergency order (EO) for portions of the fishing season from 14 May to 17 June. The resulting low commercial Chinook salmon harvests mirrored Baird Canyon Chinook salmon catches. Chinook salmon catch at Baird Canyon was also affected by the commercial fishery being open throughout the majority of May and June. The 3,013 Chinook salmon caught at Baird Canyon in 2009 was the lowest total since 2004. At Canyon Creek, Chinook salmon catches in 2009 (2,465 fish) were 31% lower than in 2008 (3,592 fish) and the lowest catches since 2003. The reduction in catches was mainly attributable to difficulties in finding a suitable fishing site for fishwheel 4 and persistent high water. Due to the October 2006 flood, depth and velocity conditions at the fishwheel 4 site used in previous years made it unsuitable. Much of the season was spent relocating and adjusting fishwheel 4 in
14
order to keep it safe and fishing properly in an attempt to maximize catches. Persistent high water from 8 June to 13 June and 4 July to 10 August also affected fishing effort. At times the fishwheels had to be shut down to reposition them in more fishable locations. On the evening of 29 July, Fishwheel 4 broke loose from its anchor and was swept down river. It was subsequently shut down for the remainder of the season due to extensive damage. This likely did not cause a significant impact to the sampling of Chinook salmon, which had slowed considerably by this point and were being caught in representative numbers by Fishwheel 3 alone. Abundance Estimate
Abundance estimates for Chinook (32,401; CV = 7.3%) salmon 2009 appeared unbiased and exceeded the precision levels specified in the study objectives. The spawning escapement goal set by the Board of Fisheries for salmon on the Copper River is 24,000 or more Chinook. If we subtract from our abundance estimate the number of Chinook salmon harvested in the Chitina and Glennallen subdistricts (preliminary estimate is 2,874 fish), and assume that the number of Chinook salmon harvested in the sport and personal use fishery was minimal due to emergency orders (dated 03 June, 24 June, and 22 July) which limited or prohibited Chinook salmon retention, then the 2009 spawning escapement is estimated to be around 29,527 fish.
CONCLUSIONS Despite the numerous and often significant challenges encountered during this study, it has continued to meet or exceed all project objectives and expectations. Drainage-wide abundance estimates of Chinook salmon have been generated consistently and reliably for seven years and the project has evolved into a long-term monitoring program. This work has made NVE an integral part of Copper River salmon research and management. In addition, this project has demonstrated that several agencies (e.g., USFWS, NVE, and ADF&G) can work cooperatively to collect valuable data on the Copper River salmon stocks that can be used to assess current management practices. Given the success of the project, it appears that fishwheels and mark-recapture methods can be used to estimate the inriver abundance of Chinook salmon on the Copper River well into the future.
RECOMMENDATIONS In light of the preceding discussion and the fact that this project will be funded by the Federal Subsistence Board in the future, the following are recommended for the 2010 field season: (1) Improve the inriver reporting of harvested tagged and untagged fish within the Chitina and
Glennallen subdistricts. Recent research data and anecdotal information suggests that considerable unreported harvest is taking place in the inriver fisheries of the Copper River. Essentially, once the salmon pass the Miles Lake sonar, there is limited accountability of inriver harvests within the State and Federal subsistence, personal use, sport and guided sport fisheries throughout the Copper River drainage. In 2008, NVE submitted an unsuccessful pre-proposal to the USFWS-OSM requesting funds for a project to improve
15
public awareness of existing tagging studies and increase the percentage of tagged fish that were reported to investigators. Attempts should be made to implement some of these ideas under the current budget framework;
(2) Operate fishwheels 1 and 2 at the same sites used in 2009. Fishwheel 5 is no longer needed at Baird Canyon and will be stored onsite to provide spare parts for the other fishwheels. Fishwheels 3 and 4 at Canyon Creek are typically relocated throughout the season and from year to year to adapt to changing river conditions. River conditions in the Canyon Creek area have been more variable since the Fall flood in 2006. Continued efforts need to be made to continually move these fishwheels and find the most suitable sites for Chinook salmon capture;
(3) Continue monitoring ice and snow conditions at Baird Canyon through April and early May in order to assess the best time, labor requirements, and transportation logistics to mobilize. Plan on the Baird Canyon crew starting around 5 May and the Canyon Creek crew around 12 May, with Baird Canyon mobilized in time to have the first fishwheel launched and fishing immediately following full break-up and clearing of river ice above Miles Lake, and Canyon Creek mobilized in time to have the first fishwheel launched and fishing within 2 d of the first tagged fish released;
ACKNOWLEDGMENTS Technicians were hired locally by NVE to assist with fishwheel construction, transportation, installation, operation, inseason maintenance, fish sampling, and data collection. Camp leads were Andrew Ball, and Charles Russell. Fisheries research technicians were Julius Koenig, Joshua Rines, Elizabeth Farone, Conrad Carriere, Miranda Johnson, and Danielle Macphee. Bruce Cain, Autumn Bryson, Mark King, Scott Madison, the 2009 trail crew, 2009 interns(Dani Hess, Maleah Wraith), and several locally hired temporary employees provided project support. Michael Link (LGL) was a co-investigator on this study and Scott Raborn (LGL) provided assistance with data analysis. Tim Nelson installed Starband satellite internet communications. Lenny Peterson (Peterson Welding and Machine, Cordova) assisted with inseason repairs to fishwheels and equipment. Air support was provided by Cordova Air, Alaska Wilderness Air, and Era Aviation. David Hall (Hallprint Pty Ltd and ENSID Technologies Inc.) provided invaluable technical support in the continuing development and implementation of new TBA-PIT-tag technology. We also thank Gary Martinek and Gulkana hatchery staff who sampled fish for tags during broodstock collection. This project (FIS07-503) was approved by the Federal Subsistence Board, managed by the U.S. Fish and Wildlife Service, Office of Subsistence Management, and funded by USFS. This project was a cooperative effort between the USFS, NVE, LGL, and ADF&G, and this annual report partially fulfills contract obligations for USFS Contract #AG-0109-C-07-0011.
16
LITERATURE CITED ADF&G. 2009. Commerical fisheries news release. Retrieved on 01 March 2009 from the
Alaska Department of Fish and Game, Commercial Fisheries Division webpage: http://www.cf.adfg.state.ak.us/region2/finfish/salmon/pws/pwspos09.pdf.
ADF&G. 2009. Commerical fisheries news release. Retrieved on 23 February 2009 from the
Alaska Department of Fish and Game, Commerical Fisheries Division webpage: http://csfish.adfg.state.ak.us/newsrelease/select.php?year=2009&dist=CDV&species=400
&submit=Go Arnason, A. N., C. W. Kirby, C. J. Schwarz, and J. R. Irvine. 1996. Computer analysis of data
from stratified mark-recovery experiments for estimation of salmon escapements and other populations. Can. Tech. Rep. Fish. Aquat. Sci. 2106: vi + 37.
Bernard, D., and P. A. Hansen. 1992. Mark-recapture experiments to estimate the abundance of
fish. Alaska Department of Fish and Game, Division of Sport Fish, Special Publication No. 92-4, Anchorage.
Brabets, T. P. 1997. Geomorphology of the lower Copper River, Alaska. United States
Geological Survey, U.S. Geological Survey Professional Paper 1581, Denver. Cappiello, T. A., and J. F. Bromaghin. 1997. Mark-recapture abundance estimates of fall-run
chum salmon in the Upper Tanana River, Alaska, 1995. Alaska Fishery Research Bulletin 4(1): 12-35.
Darroch, J. N. 1961. The two-sample capture-recapture census when tagging and sampling are
stratified. Biometrika 48: 241-260. Donaldson, I. J., and F. K. Cramer. 1971. Fishwheels of the Columbia. Binfords and Mort
Publishers, Portland. 124 p. Evenson, M. J., and J. W. Savereide. 1999. A historical summary of harvest, age composition,
and escapement data for Copper River Chinook salmon, 1969-1998. Alaska Department of Fish and Game, Fishery Data Series No. 99-27, Anchorage.
Evenson, M. J., and K. G. Wuttig. 2000. Inriver abundance, spawning distribution, and migratory
timing of Copper River Chinook salmon in 1999. Alaska Department of Fish and Game, Division of Sport Fish, Fishery Data Series No. 00-32, Anchorage.
17
Gordon, J. A., S. P. Klosiewski, T. J. Underwood, and R. J. Brown. 1998. Estimated abundance of adult fall chum salmon in the Upper Yukon River, Alaska, 1996. U.S. Fish and Wildlife Service, Alaska Fisheries Technical Report No. 45, Fairbanks.
Hollowell, G., and M. A. Sommerville. 2008. Management of salmon stocks in the Copper
River, report to the Alaska Board of Fisheries: December 1-7, 2008, Cordova, Alaska. Alaska Department of Fish and Game, Divisions of Sport Fish and Commercial Fisheries, Special Publication No. 08-15.
Johnson, R. E., R. P. Marshall, and S. T. Elliot. 1992. Chilkat River Chinook salmon studies,
1991. Alaska Department of Fish and Game, Division of Sport Fish, Fishery Data Series No. 92-49, Anchorage, AK.
Link, M. R., K. K. English, and R. C. Bocking. 1996. The 1992 fishwheel project on the Nass
River and an evaluation of fishwheels as an inseason management and stock assessment tool for the Nass River. Can. Manuscr. Rep. Fish. Aquat. Sci. 2372: x + 82.
Link, M. R., and B. L. Nass. 1999. Estimated abundance of Chinook salmon returning to the
Nass River, B.C., 1997. Can. Manuscr. Rep. Fish. Aquat. Sci. 2475: xi + 64. Link, M. R., M. J. Nemeth, and R. Henrichs. 2001. Feasibility of using fishwheels for long-term
monitoring of Chinook salmon escapement on the Copper River. U.S. Fish and Wildlife Service, Office of Subsistence Management, Anchorage.
Meehan, W. R. 1961. The use of a fishwheel in salmon research and management. Transactions
of the American Fisheries Society 90: 490-494. Merritt, M. F., and K. Roberson. 1986. Migratory timing of upper Copper River sockeye salmon
stocks and its implications for the regulation of the commercial fishery. N. Amer. J. Fish. Manag. 6: 216-225.
Morstad, S., D. Sharp, J. Wilcock, T. Joyce, and J. Johnson. 1999. Prince William Sound
management area 1998 annual finfish management report. Alaska Department of Fish and Game, Commercial Fisheries Division, Regional Information Report No. 2A99-20, Anchorage.
OSM. 2005. Priority information needs, federal subsistence fisheries, 2007 Fisheries Resource
Monitoring Program. Office of Subsistence Management, Fisheries Information Services Division, U.S. Fish and Wildlife Service, Anchorage.
OSM. 2009. Subsistence management regulations for the harvest of fish and shellfish on federal
public lands and waters in Alaska (effective April 1, 2009 – March 31, 2011). Retreived on 15 April 2009 from the Federal Subsistence Management Program, US Fish and Wildlife Service, Office of Subsistence Management webpage: http://alaska.fws.gov/asm/law.cfml.
18
Ricker, W. E. 1975. Computation and interpretation of biological statistics of fish populations. Bull. Fish. Res. Board Can. 191. 382 p.
Savereide, J. W., and M. J. Evenson. 2002. Inriver abundance, spawning distribution, and
migratory timing of Copper River Chinook salmon in 2001. Alaska Department of Fish and Game, Fishery Data Series No. 02-28, Anchorage.
Schwarz, C. J., and C. G. Taylor. 1998. Use of the stratified-Petersen estimator in fisheries
management: estimating the number of pink salmon (Oncorhynchus gorbuscha) spawners in the Fraser River. Can. J. Fish. Aquat. Sci.: 281-296.
Seber, G. A. F. 1982. The estimation of animal abundance and related parameters, 2nd edition.
Charles Griffin and Company, Ltd., London. 654 p. Sharp, D., T. Joyce, J. Johnson, S. Moffitt, and M. Willette. 2000. Prince William Sound
management area: 1999 annual finfish management report. Alaska Department of Fish and Game, Commercial Fisheries Division, Regional Information Report No. 2A00-32, Anchorage, AK.
Smith, J. J. 2004. Feasibility of using fishwheels for long-term monitoring of Chinook salmon
escapement on the Copper River, 2003 annual report. U.S. Fish and Wildlife Service, Office of Subsistence Management, Fisheries Resource Monitoring Program (Study No. 01-020), Anchorage, Alaska.
Smith, J. J., M. R. Link, and B. D. Cain. 2005. Development of a long-term monitoring project to
estimate abundance of Chinook salmon in the Copper River, Alaska, 2001-2004. Alaska Fishery Research Bulletin 11(2): 118-134.
Smith, J. J., M. R. Link, and M. B. Lambert. 2003. Feasibility of using fishwheels for long-term
monitoring of Chinook salmon escapement on the Copper River, 2002 annual report. U.S. Fish and Wildlife Service, Office of Subsistence Management, Fisheries Resource Monitoring Program (Study No. 01-020), Anchorage, Alaska.
Smith, J. J., and K. van den Broek. 2005. Feasibility of using fishwheels for long-term
monitoring of Chinook salmon escapement on the Copper River, 2004 annual report. U.S. Fish and Wildlife Service, Office of Subsistence Management, Fisheries Resource Monitoring Program (Study No. 04-503), Anchorage, Alaska.
Smith, J. J., and K. van den Broek. 2006. Estimating Chinook salmon escapement on the Copper
River, 2005 annual report. U.S. Fish and Wildlife Service, Office of Subsistence Management, Fisheries Resource Monitoring Program (Study No. 04-503), Anchorage, Alaska.
Smith, J. J., K. M. van den Broek, and G. Wade. 2007. Estimating Chinook salmon escapement
on the Copper River, 2006 annual report. U.S. Fish and Wildlife Service, Office of
Sommerville, M. 2010. Summary data for the 2009 state of Alaska upper Copper and upper Copper and upper Susitna area subsistence, personal use, and sport fisheries. Alaska Department of Fish and Game, Division of Sport Fish. Sturhahn, J. C., and D. A. Nagtegaal. 1999. Results of the Chinook assessment study conducted
on the Klinaklini River during 1998. Can. Manuscr. Rep. Fish. Aquat. Sci. 2497: x + 18. van den Broek, K. M., T. Haluska, and J. J. Smith. 2009. Estimating the inriver abundance of
Copper River Chinook salmon, 2008 annual report. U.S. Fish and Wildlife Service, Office of Subsistence Management, Fisheries Resource Monitoring Program (Study No. 07-503), Anchorage, Alaska.
van den Broek, K. M., J. J. Smith, and G. Wade. 2008. Estimating the inriver abundance of
Copper River Chinook and sockeye salmon, 2007 annual report. U.S. Fish and Wildlife Service, Office of Subsistence Management, Fisheries Resource Monitoring Program (Study No. 07-503), Anchorage, Alaska.
Wuttig, K. G., and M. J. Evenson. 2001. Inriver abundance, spawning distribution, and migratory
timing of Copper River Chinook salmon in 2000. Alaska Department of Fish and Game, Fishery Data Series No. 01-22, Anchorage.
Zar, J. H. 1984. Biostatistical analysis, 2nd edition. Prentice-Hall, Inc., New Jersey. 718 p.
20
TABLES
21
Table 1. Number of Chinook salmon recaptured, by bank of release, and the results of a test to compare recapture rates of fish marked on the east and west banks of the Copper River, 2009.
Table 2. Number of Chinook salmon recaptured, by bank of release and bank of recovery, and the results of a test to compare for equal movement across the river, 2009.
Table 3. Number of Chinook salmon marked, by bank of recovery, and the results of a test to compare mark rates of fish recovered on the east and west banks of the Copper River, 2009.
22
Table 4. Capture history of Chinook salmon that were tagged, examined, and recaptured at the Copper River fishwheels, 2009. Bold text indicates the data used for the Chi-square tests.
Table 5. Estimated inriver abundance of Chinook salmon above Baird Canyon on the Copper River, 2003-2009.
23
Table 6. Number of tagged Chinook salmon reported harvested by the various Copper River fisheries, 2009.
24
FIGURES
25
Figure 1. Map of the study area showing the location of the Baird Canyon and Canyon Creek fishwheels on the Copper River in Alaska, 2009.
26
Figure 2. Map of Baird Canyon on the Copper River showing the location of the camp and fishwheel sites that were used in 2009. Fishwheel 5 also fished directly across from camp from 15 May to 16 May (not shown on map).
27
Figure 3. Map of Wood Canyon on the Copper River showing the location of the camp, boundaries of fishwheel sites used in 2009, and the lower boundary of the Chitina Subdistrict dip net fishery.
28
Figure 4. Stage height (m) of the Copper River near the Baird Canyon and Canyon Creek fishwheels, 19 May to 15 August 2009.
Figure 5. Stage height of the Copper River at the Million Dollar Bridge, 1982-2009.
29
Figure 6. Fishwheel effort (h) and speed (RPM) at the Baird Canyon (fw 1, 2, and 5) and Canyon Creek (fw 3 and 4) fishwheels on the Copper River, 2009.
30
Figure 7. Daily catch of Chinook salmon at the Baird Canyon fishwheels on the Copper River, 2009.
Figure 8. Catch per unit effort (CPUE, fish per fishwheel hour) for Chinook salmon at the Baird Canyon fishwheels on the Copper River, 2009.
31
Figure 9. Daily catch of Chinook salmon at the Canyon Creek fishwheels on the Copper River, 2009.
Figure 10. Catch per unit effort (CPUE, fish per fishwheel hour) for Chinook salmon at the Canyon Creek fishwheels on the Copper River, 2009.
32
Figure 11. Number of Chinook salmon tagged at the Baird Canyon fishwheels on the Copper River, 2009.
Figure 12. Number of Chinook salmon examined and recaptured at the Canyon Creek fishwheels on the Copper River, 2009.
33
Figure 13. Travel time (days) of Chinook salmon tagged at the Baird Canyon fishwheels and recaptured at the Canyon Creek fishwheels, 2009.
Figure 14. Time (days) between capture events for Chinook salmon captured more than once at the Baird Canyon fishwheels, 2009.
34
Figure 15. Cumulative length-frequency distributions for Chinook salmon (≥ 500 mm FL) marked at Baird Canyon and examined and recaptured at Canyon Creek, 2009.
Figure 16. Daily proportion of Chinook salmon examined for marks at the Canyon Creek fishwheels that were recaptures (or fish that were tagged at Baird Canyon), 2009.
35
Figure 17. Daily proportion of Chinook salmon tagged at the Baird Canyon fishwheels that were subsequently recaptured at the Canyon Creek fishwheels, 2009.
36
APPENDICES
Appendix A. Summary of daily fishwheel effort (h), effort used to calculate catch per unit effort (CPUE), and fishwheel speed (RPM) for the Copper River fishwheels, 2009.
Appendix A continued.
Appendix A continued.
Appendix A continued.
Appendix B. Total catch and catch per unit effort (fish per hour) for Chinook salmon at the Copper River fishwheels, 2009.
Appendix B continued.
Appendix B continued.
Fish recaptured two or more times at the Baird Canyon or Canyon Creek fishwheels were not included in total catches.
Appendix C. Number of Chinook salmon tagged, examined, and recaptured at the Baird Canyon and Canyon Creek fishwheels on the Copper River, 2009.
Appendix C continued.
Appendix C continued.
Appendix C continued.
The U.S. Fish and Wildlife Service, Office of Subsistence Management conducts all programs and activities free from discrimination on the basis of sex, color, race, religion, national origin, age, marital status, pregnancy, parenthood, or disability. For information on alternative formats available for this publication please contact the Office of Subsistence Management to make necessary arrangements. Any person who believes she or he has been discriminated against should write to: Office of Subsistence Management, 3601 C Street, Suite 1030, Anchorage, AK 99503; or O.E.O., U.S. Department of Interior, Washington, D.C. 20240.