Estimation of actual evapotranspiration to derive irrigation efficiency indicators in the Aral Sea Basin, Central Asia Patrick Knöfel, Dimo Dimov, Sarah Schönbrodt-Stitt, Christopher Conrad Universität Würzburg, Institut für Geographie und Geologie, Lehrstuhl für Fernerkundung, Oswald-Külpe-Weg 86, 97074 Würzburg Tagung „Landschaftsprozessmonitoring mittels Multisensordaten “ 5. Gemeinsamer Workshop der AKs „Auswertung von Fernerkundungsdaten“ der DGPF e.V. und „Fernerkundung“ der DGfG e.V . 1
Transcript
Estimation of actual evapotranspiration to derive irrigation efficiency indicators in the Aral Sea Basin, Central Asia
Patrick Knöfel, Dimo Dimov, Sarah Schönbrodt-Stitt, Christopher Conrad
Universität Würzburg, Institut für Geographie und Geologie, Lehrstuhl für Fernerkundung, Oswald-Külpe-Weg 86, 97074 Würzburg
Tagung „Landschaftsprozessmonitoring mittels Multisensordaten “ 5. Gemeinsamer Workshop der AKs
„Auswertung von Fernerkundungsdaten“ der DGPF e.V. und „Fernerkundung“ der DGfG e.V.
1
Photo
: A
usw
ärt
iges A
mt 2008
About the project
CAWa was designed to support scientific cooperation and
communication between the CA countries (and Germany) in the
sector of water resource management
• EU strategy „Central Asia“
German Water Initiative for Central Asia
(„Berlin Process“):
– Political institut. component by GIZ
– Educational component by German-Kazakh Univ.
– Scientific component: Regional Research Network
«Water in Central Asia»
Phase I–II (2008-2014): scientific data base,
analysis and modeling
Phase III (2015-2017): Consolidation, Capacity Building, Transfer
Work package III (University of Wuerzburg):
WUEMoCA (Water Use Efficiency Monitor in Central Asia):
automated monitoring and visualization instrument addressing
sustainable land management, decision making, and planning processes
2
Aims and Partners
Use of satellite remote sensing (multi-temporal multi-sensor
mapping), Information about crops for each field parcel
WUEMoCA
WUEMoCA
Crop yield/biomass development
Land use (cotton, rice, wheat, fallow, etc.)
Water flow / use efficiency
3
Evaluation of irrigation systems
4
Water Use Efficiency Indicators:
Irrigation Efficiency: ETa/W
ETa : actual Evapotranspiration
W : water withdrawal at the boundary of district
Crop water productivity : Y/ETa in kg/m³
Y: Crop specific yield
Non-sustainable irrigation water use in the Aral Sea Basin
5
Focus area
Khorezm is a textbook example of the problems of irrigated agriculture in the Aral Sea Basin (Vlek et al., 2012)
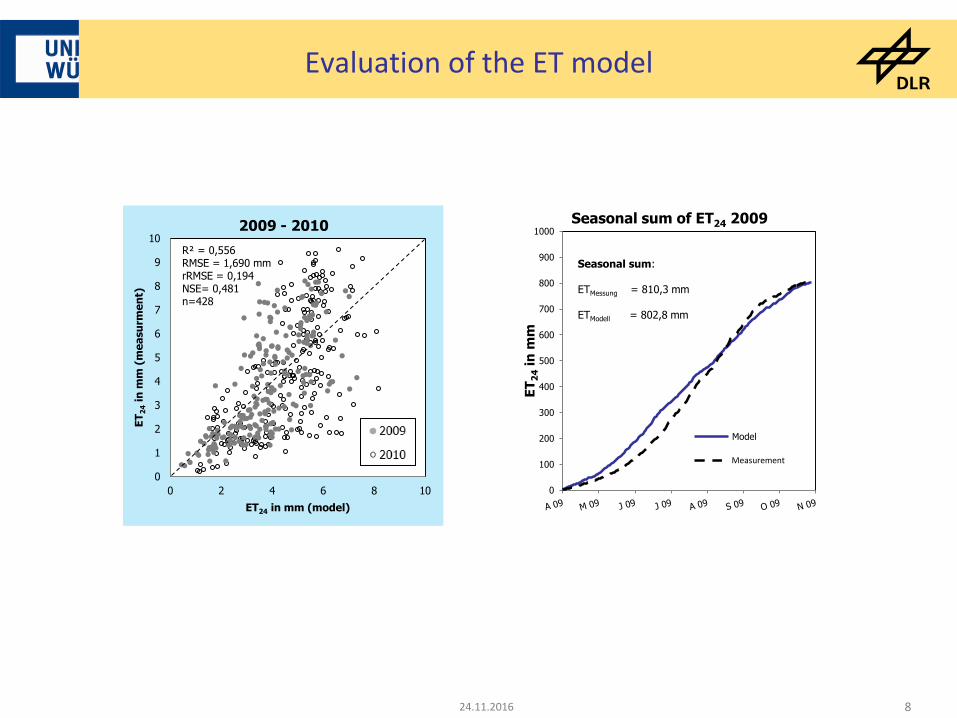
Seasonal sum: ETMessung = 810,3 mm ETModell = 802,8 mm
Measurement
0
1000
2000
3000
4000
5000
2007 2008 2009 2010
Wate
r In
take,
mio
. m
³
Year
2007 2008 2009 2010
Background: False color Landsat image 2009.
Folie 9
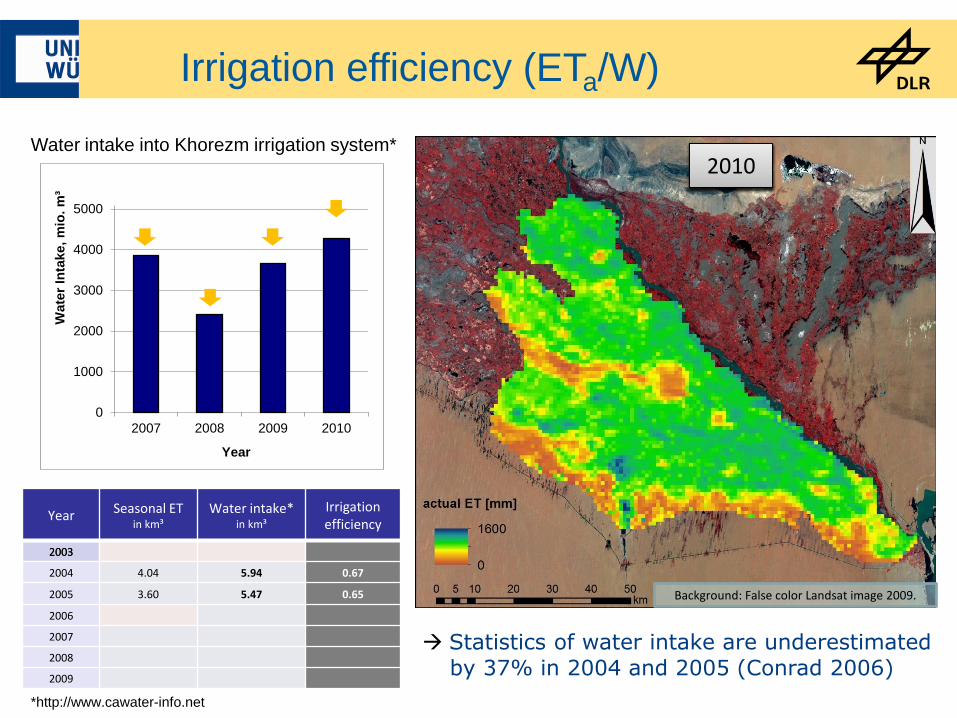
Water intake into Khorezm irrigation system*
Year Seasonal ET in km³
Water intake* in km³
Irrigation efficiency
2003 3.36 3.58 0.93
2004 4.04 3.68 1.10
2005 3.60 3.93 0.91
2006 3.28 3.68 0.89
2007 3.31 3.1 1.07
2008 3.11 1.69 1.82
2009 3.53 3.44 1.03
Irrigation efficiency (ETa/W)
Statistics of water intake are underestimated
by 37% in 2004 and 2005 (Conrad 2006)
*http://www.cawater-info.net
Year Seasonal ET in km³
Water intake* in km³
Irrigation efficiency
2003
2004 4.04 5.94 0.67
2005 3.60 5.47 0.65
2006
2007
2008
2009
NPPday-x = FPAR * LUEact * PAR
NPPseason = NPPday-1 + … + NPPday-H
Yield = NPPseason * Hi
Validation with harvest information
Remote Sensing time series (MODIS, Landsat, RapidEye)
Meteorological data
e.g.
Land use classification
Daily calculation
Seasonal calculation
day-H = day of harvest
Fritsch, 2013
Yield modeling – Light Use Efficiency
Cotton yield
Yield results MODIS 250m for 2005 and 2008
Source : Fritsch et al. 2013
Water productivity
Due to spatial resolution of input data the “water productivity” is calculated based the coarse resolution 1km pixel with homogenous land use (threshold: 80% of same land use)
12
2003 2004 2005 2006 2007 2008 2009
Cotton 486 659 661 573 672 366 629
Wheat-Rice 0 0 0 2 1 1 8
Wheat-Fallow 0 6 1 2 0 0 0
Wheat-Other 46 29 58 67 37 48 46
Rice 101 58 34 31 25 12 6
Fallow 461 485 458 475 518 821 563
Table: Number of homogeneous pixel per year
Results: Water productivity (cotton)
13
Year mean
water productivity cotton
2003 0.28
2004 0.25
2005 0.27
2006 0.28
2007 0.31
2008 0.22
2009 0.30
Background: False color Landsat image 2009.
14
Results – Indicator calculation
Analysis of cotton water productivity based on 1km homogenous pixel is suitable, but for other crop this approach is insufficient.
test of disaggregation method MODIS 1km to 250m of evaporative fraction ETF based on ETF - NDVI relation for 2006 (Eswar et al., 2013)
Wheat WP 2006
Year wheat WP 1km wheat WP 250m
2003 - -
2004 0.340 -
2005 0.385 -
2006 0.449 0.388
2007 - -
2008 - -
2009 - -
15
Summary
• Medium irrigation efficiency in Khorezm 0.66 (well>80%, poor<50%) in 2004 and 2005. Official water withdrawal statistics are not suitable for calculation due to underestimation.
• Problems of ET modelling in dry years.
• Regions mean CWP is 0.26 kg/m³ (literature for CA: 0.22–0.46) for cotton and 0.41 kg/m³ (CA: 0.44-1.02) for winter wheat
• to evaluate wheat CWP 1km resolution was insufficient disaggregated approach is more suitable
• CWP is small compared to other irrigation systems of the world.
*Zwart SJ, Bastiaanssen WGM (2004) Review of measured crop water productivity values for irrigated wheat, rice, cotton and maize. Agric Water Manage 69:115–133
Crop CWP*
in kg/m³ world mean CWP*
in kg/m³
Wheat 2.23 (China) 1.72 (USA)
1.09
Cotton 0.84 (Argentina)
0.59 (Turkey) 0.65
Thanks for your attention
Patrick Knöfel, Dimo Dimov, Sarah Schönbrodt-Stitt, Christopher Conrad
Universität Würzburg, Institut für Geographie und Geologie, Lehrstuhl für Fernerkundung, Oswald-Külpe-Weg 86, 97074 Würzburg
Tagung „Landschaftsprozessmonitoring mittels Multisensordaten “ 5. Gemeinsamer Workshop der AKs
„Auswertung von Fernerkundungsdaten“ der DGPF e.V. und „Fernerkundung“ der DGfG e.V.


![2009-04 Financials [Read-Only] - Palomar Health · Balanced Scorecard ADD G-3 Financial Indicators January February March Actual Actual Actual Actual Budget Variance % Actual to Budget](https://static.documents.pub/doc/80x56/5b938cb409d3f280378d95d9/2009-04-financials-read-only-palomar-balanced-scorecard-add-g-3-financial.jpg)


![[Dimov i.t.] monte_carlo_methods_for_applied_scien(book_fi.org)](https://static.documents.pub/doc/80x56/554a584eb4c9054b328b4d16/dimov-it-montecarlomethodsforappliedscienbookfiorg.jpg)
