Ethylene, Ethane, Acetaldehyde, and Ethanol Production ByPlants under Stress'
Received for publication August 12, 1981 and in revised form December 2, 1981
THOMAS W. KIMMERER AND THEODORE T. KOZLOWSKIDepartment of Forestry, University of Wisconsin, Madison, Wisconsin 53706
ABSTRACT
Red pine (Pinus resinosa Ait.) and paper birch (Betulapapyrafera Marsh.)seedlings exposed to sulfur dioxide produced acetaldehyde and ethanol,and exhibited increased production of ethylene and ethane. Gas chromato-graphic measurement of head space gas from incubation tubes containingleaves or seedlings was a simple method of simultaneously measuring allfour compounds. Increased ethylene production had two phases, a moderateincrease from the gnnng of the stress period and a large increase justprior to appearance of leaf lesions. Ethane production in SO2-stressedplants did not increase until lesions appeared. Acetaldehyde and ethanolproduction began within 6 hours at 03 microliter per liter SO2 and 24hours at 0.1 microliter per liter SO2 and continued throughout a 6-dayfumigation. Production of acetaldehyde and ethanol continued when plantswere removed to clean air for up to 2 days. A higher concentration of SO2(0.5 microliter per liter) induced acetaldehyde and ethanol productionwithin 2 hours of the start of fumigation of birch and pine seedlings. Anumber of other stresses, including water deficit, freezing, and ozoneexposure induced production of acetaldehyde and ethanol. Production ofthese compounds was not due to hypoxia, as the 02 partial pressure in theincubation vessels did not decline. Increasing the 02 partial pressure to300 miimeters Hg did not affect production of these compounds. Produc-tion of ethylene, acetaldehyde, and ethanol declined when more than 80%of the leaf area became necrotic, while ethane production was linearlyrelated to the percentage of necrosis. A number of woody and herbaceousplant species produced acetaldehyde and ethanol in response to freezingstress, while others did not. Measurement of these four compounds simul-taneously in the gas phase may be a valuable method for monitoring plantstress, particularly air pollution stress.
Production of ethylene by plants increases as a result of envi-ronmental stress or wounding (16, 17), and measurement of stressethylene can be a useful indicator of the onset of stress and/or thedegree of stress which a plant is experiencing (14, 16). For example,ethylene evolution by ozone-stressed plants was well correlatedwith the ozone dose in a large number of plant species (14). Thereare difficulties with the use of stress ethylene as a diagnostic tool,however. Ethylene is produced by unstressed plants, and theamount varies with age of the tissue and with environmentalconditions (16). When stress results in death of cells, ethyleneevolution declines. Therefore, the correlation between stress andethylene evolution may be poor (5).
Plants under stress also produce ethane, and unlike ethylene,the amount produced by unstressed plants is normally quite low.Elstner and Konze (5) found that ethane evolution by freezing-
' Supported by the College of Agricultural and Life Sciences, Universityof Wisconsin, Madison.
stressed plants was linearly correlated with the amount of leafnecrosis. Other studies indicated that ethane production is acommon response to wounding (8, 10), and simultaneous mea-surement of stress ethylene and ethane may be of considerableuse in evaluating plant stress.Ethane evolution is the result of free-radical-mediated peroxi-
dation ofmembrane linolenic acids and apparently occurs becausefree-radical scavenging mechanisms are overcome when cells aredecompartmented (6, 7, 10). Bressan et al. (2) and Peiser and Yang(12) reported that ethane is evolved from S02-stressed plants. Theproposed mechanism is that Chl-initiated oxidation of bisulfite bya free-radical mediated process results in co-oxidation of linolen-ate (12). We investigated the production of ethylene and ethaneby woody plants exposed to SO2 in order to determine whether(a) measurement of ethylene and ethane can be a useful methodfor objectively evaluating environmental stress; and (b) whetherethane production is the result of a specific S02-driven process, assuggested by Peiser and Yang (12), or the result of necrosis anddecompartmentation of cells.During gas-chromatographic measurement of ethylene and
ethane production by woody plants, we found that ethanol andacetaldehyde were produced by stressed plants in addition toethylene and ethane.
Ethanol and acetaldehyde production is usually associated withanaerobic processes such as occur in flooded plants. Under aerobicconditions, little or none ofthese glycolytic metabolites is normallyproduced (4). Ethanol and acetaldehyde are also produced bysome fruits, such as strawberries, and by deteriorating seeds (11,15). In all of these cases, reduced 02 availability or reduced 02transport is thought to inhibit TCA electron transport leadingultimately to formation of acetaldehyde and ethanol (4). Ourexperiments show that ethanol production by plants under stressdoes not require restricted 02 availability.
In the present study, we examined production of ethylene,ethane, acetaldehyde, and ethanol by woody plants exposed toS02 and water stress. Further experiments examined the produc-tion of these compounds as a result of several kinds of stress andwounding in a variety of woody and herbaceous plants.
MATERIALS AND METHODSPlant Material. Woody plants were grown from commercially
available seed in a greenhouse with supplemental lighting to givea 16-h photoperiod. Paper birch (Betula papyrifera Marsh.) andred pine (Pinus resinosa Ait.) seeds were germinated in 3:2:1 peat:Perlite:vermiculite, and seedlings were transplanted 2 to 4 weeksafter germination into the same soil mix in 10-cm pots. Seeds ofother woody plants were germinated in peat moss and transplantedinto 3:2 loam:sand in 30-cm pots. Plants were watered daily andfertilized weekly with Hyponex. Herbaceous plants were grown invarious soil mixes in the greenhouse under continuous lighting.SO2 Stress. Plants were transferred to fumigation chambers of
the University of Wisconsin Biotron the night before fumigation.840
VOLATILE HYDROCARBON PRODUCTION BY STRESSED PLANTS
Environmental conditions in the chambers were: photoperiod, 16h beginning at 0500 h; quantum flux density, measured with aLambda Quantameter (Li-Cor, Inc.), 350 ± 25 ,uE m-2 s-1 (PAR)at the top of the pots form two 400-w HID2 lamps and five 25-wincandescent lamps; 25°C day/15°C night temperature; and 70± 5% RH. S02 was provided from tanks of 3,000 ,ul I` SO2 in N2,and the SO2 concentration was monitored with calibrated ThermoElectron (Thermo Electron Corp., Hopkinson, MA) pulsed flu-orescent SO2 analyzers. The fumigation chambers and environ-mental monitoring methods have been described previously (9).
Other Stresses. Freezing stress was imposed by touching a 6-mm diameter stainless steel rod to the leaves after it was immersedin liquid N2 (5). The percentage of leaf area killed was determinedfrom the number of times the rod was touched to the leaf and theleaf area, measured with a Li-Cor model 3100 Leaf Area Meter.Wounded leaves were sliced with a razor blade between eachlateral vein from the midrib to the margin. Crushing injury wasobtained by compression of the leaf mesophyll with the steel rod.Water deficit was induced by H20 withholding. Water potential(Nb) was measured with a pressure bomb on leaves just above andbelow those sampled for gas measurement, and the water potentialof the sample leaves was taken to be the mean of those measure-ments. Hypoxia was induced by flushing the flasks with 95% N2,5% CO2.
Incubation of Leaves for Gas Analysis. Leaves of angiospermousplants were removed from the stem and the petiole was cut-off.The leaves were gently rolled and placed in 14-ml test tubescontaining 0.1 ml H20. The tubes were sealed with silicone rubberserum stoppers which had been wrapped in a single layer of SaranWrap, and were incubated for 4 or 8 h in a water bath at 250Cunder an HID lamp with a quantum flux density (PAR) of 350,uE m-2 s-1. In some experiments, leaves were placed in 60-mlmodified separatory funnels and incubated in the water bath. Thefunnels were modified to accept a serum stopper just below theglass stopcock and a Beckman polarographic O2 electrode at theother end. The electrode was sealed in the funnel with Apiezon Q(American Scientific Products, McGaw Park, IL) and wrappedwith several layers of Parafilm. The Apiezon Q was acid washedto remove traces of acetic acid and ethanol. One-ml samples ofhead space gas in the tubes and funnels were taken by injecting 1ml air through the stopper and withdrawing 1 ml head space gaswith a tuberculin syringe and 26-gauge needle. The needle waspushed into a rubber stopper to prevent leakage during transportto the gas chromatograph. Leakage rates from the tubes, funnels,and syringes were not significant over the time course of ourexperiments, although low concentrations of ethane may beslightly underestimated.
In experiments with pine seedlings, the entire shoot was incu-bated. The seedling was excised just above the cotyledons andplaced in a 14-ml tube (small seedlings) or a 25-ml tube (largerseedlings). Incubation conditions were as described above.Gas Chromatography. One-ml samples of head space gas were
injected onto a 183 x 0.32 cm stainless steel chromatographycolumn containing 80/100 Porapak Q in a Hewlett-Packard gaschromatograph. The column oven was at 900C, and the carriergas (N2) flow was 38 ml min-'. Peaks were detected by ionizationin a H2 flame, and were identified by coelution with authenticcompounds on columns of Porapak N, Porapak Q, and ApiezonL on Chromosorb W-HP (Anspec Co., Ann Arbor, MI). Verifi-cation was obtained by GC-MS.Hydrocarbon production by the plants was calculated as
GC Response x Calibration Factor x (Tube Volume + 1)Dry Weight of Plant Material
where the correction factor was determined from standard curvesfor each gas. Standard curves were prepared by serial dilution inH20 of freshly distilled acetaldehyde and ethanol. One-,ul aliquotsof standards were injected within 15 min of dilution to avoidoxidation of the acetaldehyde. These standard curves were usedto determine partition coefficients of acetaldehyde and ethanolbetween H20 and air, and subsequent standard curves wereprepared by injecting 1-ml samples of head space gas over freshlyprepared standards in water. Ethylene and ethane standard curveswere prepared by serial dilution of 1,000 pl 1-1 stock gases usinggas-tight syringes.
Details of each experiment are given in the legends to figuresand tables.
RESULTS
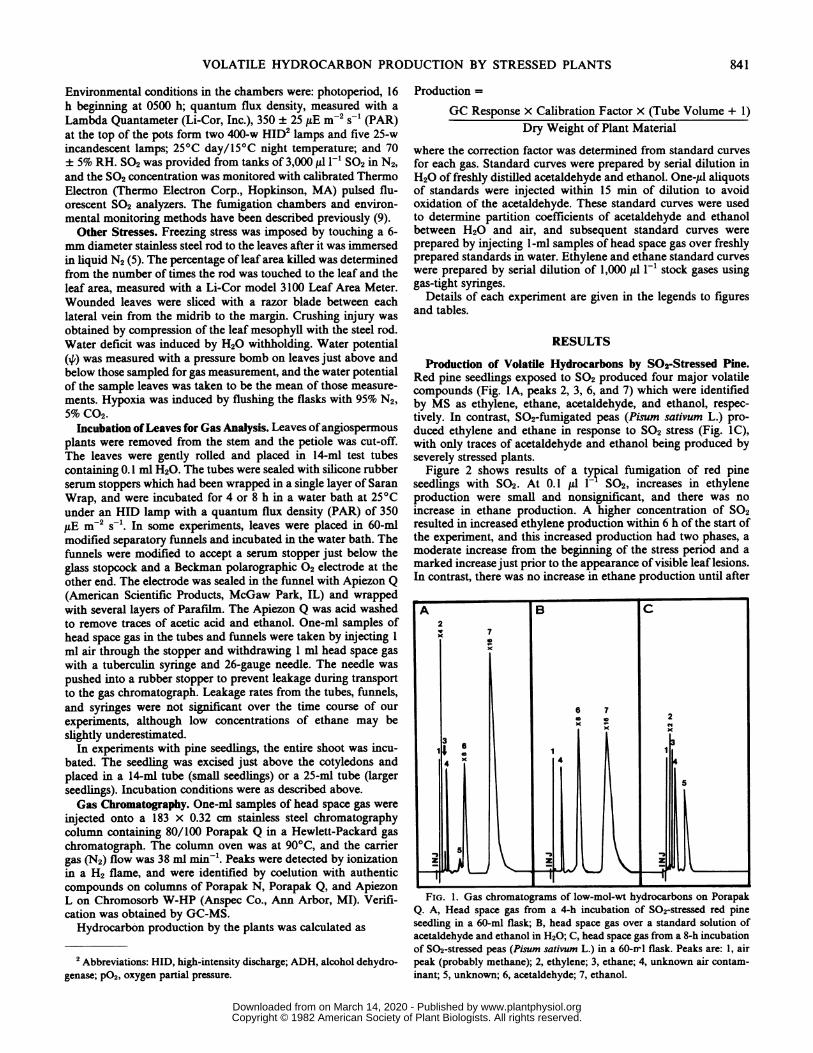
Production of Volatile Hydrocarbons by S02-Stressed Pine.Red pine seedlings exposed to SO2 produced four major volatilecompounds (Fig. IA, peaks 2, 3, 6, and 7) which were identifiedby MS as ethylene, ethane, acetaldehyde, and ethanol, respec-tively. In contrast, S02-fumigated peas (Pisum sativum L.) pro-duced ethylene and ethane in response to SO2 stress (Fig. IC),with only traces of acetaldehyde and ethanol being produced byseverely stressed plants.
Figure 2 shows results of a typical fumigation of red pineseedlings with SO2. At 0.1 ,ul I SO2, increases in ethyleneproduction were small and nonsignificant, and there was noincrease in ethane production. A higher concentration of SO2resulted in increased ethylene production within 6 h of the start ofthe experiment, and this increased production had two phases, amoderate increase from the beginning of the stress period and amarked increase just prior to the appearance of visible leaf lesions.In contrast, there was no increase in ethane production until after
FIG. 1. Gas chromatograms of low-mol-wt hydrocarbons on PorapakQ. A, Head space gas from a 4-h incubation of SO2-stressed red pineseedling in a 60-ml flask; B, head space gas over a standard solution ofacetaldehyde and ethanol in H20; C, head space gas from a 8-h incubationof S02-stressed peas (Pisum sativum L.) in a 60-rrl flask. Peaks are: 1, airpeak (probably methane); 2, ethylene; 3, ethane; 4, unknown air contam-inant; 5, unknown; 6, acetaldehyde; 7, ethanol.
FIG. 2. Effect of exposure to S02 on production of ethanol, acetalde-hyde, ethylene, and ethane by 6-month-old red pine seedlings. Plants werefumigated continuously from 0900 on day 0 to 1400 on day 6. Plants wereharvested at 0900 and 1500 on day 0 and 0900 each subsequent day. Eachpoint is the mean oftwo assays on three plants in two replicate experiments(n = 12). Arrows, first appearance of visible lesions. Dotted lines showproduction of gases from plants removed from the fumigation chambersto clean air. Standard errors were -lI0o of the mean, except ethanol andacetaldehyde at 0.3 p1 1` S02, where SE was up to 20%o of the mean.Unfumigated control plants were harvested at each sampling period. Meanproduction of gases by control plants was: ethanol, 0; acetaldehyde, 0;ethylene, 0.80; ethane, 0.09 nmol/g dry weight.
visible injury appeared. Ethanol and acetaldehyde productionbegan in the high-stress plants within 6 h of the start of fumigationand reached a peak within 24 h. At the lower S02 concentration,traces of acetaldehyde were detectable by 24 h after the start offumigation and the amount continued to increase throughout thestress period, while ethanol production peaked on the 3rd d andremained constant thereafter.Removal of the plants from the fumigation chamber into clean
air (Fig. 2, dashed lines) did not eliminate production of acetal-dehyde or ethanol, but there was an approximately linear decreasein their production over 2 d. Plants exposed to 0.3 ,ul I 1 S02 for3 d, then removed to clean air, continued to produce elevatedlevels of ethylene, but there was not a sharp increase, and nolesions formed by the end of the experiment (Fig. 2).
Fumigation of pine and birch seedlings with higher concentra-tions of S02 for shorter periods caused similar changes (Fig. 3),except that: (a) the onset of ethanol and acetaldehyde productionwas more rapid; (b) there was no increase in ethane and no visiblelesions formed during the course of the experiment; and (c)increased ethylene production in birch preceded production of
90 -
60 -
30-
9-
6 -
33 -1
a: 0 1O 200-
0
z0 10 -CX
o _0000 -
X- 50z0m
O 00 -0
0
100 _
50 _
0
0 2 4 6 8 10TIME, HOURS
FIG. 3. Effect of exposure to 0.5 IL r`' S02 on production of ethanol,acetaldehyde, ethylene, and ethane by 6-month-old red pine and fullyexpanded leaves of 4-month-old paper birch seedlings. Plants were fumi-gated beginning at time 0. There were no visible lesions by the end of theexperiment. Each point is the mean of two assays on two plants of eachspecies in two replicate experiments (n = 8). Standard errors were 10%loof the mean. Unfumigated controls produced no acetaldehyde or ethanol.Ethane production was not increased by fumigation above the controlmeans of 0.08 and 0.04 nmol/g dry weight for pine and birch, respectively.
acetaldehyde and ethanol, while in pine they increased simulta-neously as in the experiment of Figure 2. Several other differenceswere observed between the responses of birch and pine seedlingsto S02. The increase in ethylene production was much greater inbirch than in pine, and this may reflect the slightly greatersensitivity of the birch seedlings to S02. Production of ethanol bybirch seedlings was quite low while acetaldehyde accumulationwas much greater in birch than in pine. This may be due to greaterADH activity in pine than in birch (T. W. Kimmerer and T. T.Kozlowski, manuscript in preparation). The amounts of volatilehydrocarbons produced and the response to S02 stress varied withage of the seedling and age of the individual leaves (T. W.Kimmerer and T. T. Kozlowski, manuscript in preparation).Other Stresses. A number of other stresses and injuries induced
production of acetaldehyde and ethanol, while others increasedethylene and ethane production without causing production ofacetaldehyde and ethanol (Table I). Most of these stresses andinjuries resulted in formation of necrotic lesions, and these wereaccompanied by increases in the amount of ethane produced.
VOLATILE HYDROCARBON PRODUCTION BY STRESSED PLANTS
Table I. Effects of Various Stresses and Injuries on Volatile Hydrocarbon Production by 4-Month-Old Birch andPine Seedlings
Wounding and freezing injury killed 50%o of the leaf. There was no visible injury in the ozone-stressed plantsor in water-stressed plants at -1.3 MPa. At -2.5 MPa, leaves were severely wilted and slightly necrotic. Data aremean + SE. Number of replicates is given in parentheses.
Type of Stress or Injury Species Ethanol Acetalde- Ethylene EthaneType ~~~~~~~~~~~hydenmol/g dry wt
FIG. 4. Hydrocarbon production by leaves of 4-month-old birch seed-lings at various water potentials. Plants were drought stressed by with-holding water. Each point represents the mean of two gas measurementson two adjacent fully expanded leaves of a single plant. Maximumproduction for ethylene, ethane, acetaldehyde, and ethanol was 16, 0.42,307, and 208 nmol/g dry weight, respectively.
Water deficit resulted in production of large amounts of acetal-dehyde and ethanol, but not until leaf was quite low, and theleaves were severely wilted (Table I; Fig. 4). With water stress, incontrast to SO2 stress, acetaldehyde and ethanol production oc-curred after a large increase in ethylene production and justpreceded the increase in ethane production and the onset ofvisiblelesions (Fig. 4). The plants wilted at a leaf 'P of about -1.4 MPa,which is also the point at which the large increase in ethyleneproduction was observed. Note that, although ethanol productiondeclined at very low water potentials, acetaldehyde productioncontinued to increase.
Injury and Volatile Production. In several experiments, ethanolproduction declined when injury was very severe, while ethaneproduction continued to increase. To examine the relationshipbetween injury and gas production, we compared production ofvolatiles with percentage of leaf injury in birch seedlings stressedwith 0.5 IAI 1` SO2 (Fig. 5). Production of all four gases was
approximately linearly related to the percentage of injury up toabout 80%Yo, beyond which production of all gases except ethanedeclined. In this experiment, only a few leaves without injury wereanalyzed. As shown in Figure 2, maximal production of acetal-dehyde and ethanol may occur in the absence of visible lesions.
cr 6a-8Cz
0
4
0 40
I 20
ETHYLENE X
1 00 ~~~~00
0
0 0
0
0 0
p-
ETHANOL
.
0 0
* *000
* .@0
0
0
0
ETHANEE0
*_0
.S-
0*0* 0
*
SSACETALDEHYDE 4: 0"o
0
0.
0
0
0
*0 ,,0
0 0
o 20 40 60 80 000 20 40 60 80 100
% INJURY
FIG. 5. Relationship between percentage of injury (necrosis) and gas
production as percentage of maximum in fully expanded leaves of 4-month-old paper birch seedlings fumigated with an acute dose of SO2 (0.5.ul I' for 8 h). Injury was estimated visually after incubation of tissue forgas analysis. Each point represents the mean of two gas measurements on
individual leaves incubated in 14-ml tubes.
Thus, at a lower SO2 concentration than used in the experimentof Figure 5, there would be no linear relationship between injuryand the production of these two gases.Oxygen Concentration Effects. In unstressed pine seedlings, no
ethanol or acetaldehyde was produced. When seedlings were
exposed to hypoxic conditions, these compounds were producedonly when the P02 was less than 10 mm Hg (Table I). Analysis ofthe 02 tensions in separatory funnels containing stressed seedlingsshowed that acetaldehyde and ethanol were produced in thepresence of normal ambient 02 tensions. Some representative P02data are shown in Table II. In most cases, the P02 changed onlyslightly with up to 24 h incubation in the light, with a gradualdecline in 02 tension in the dark. Severely injured seedlingsshowed a net uptake of 02, with the P02 gradually declining.Increasing the 02 tension to 300 mm Hg by flushing flasks with02 did not alter acetaldehyde and ethanol production of S02-
Table II. Some Representative 02 Tension Datafrom Several ExperimentsAfter 8 h incubation, samples were taken for ethanol and acetaldehyde production. Incubation time is the total
time over which the P02 was measured. S02-stressed plants were fumigated for 8 h with 0.5 ,ul 1-1 S02 prior toincubation. Injury was assessed visually at the end of the incubation period.
Acetalde- Time ofStress L/Da Ethanol PIncuba-InitialPO2 Fina pO2 Injury
tionnmol/g dry wt h mm Hg
None L 0 0 24 160 158 NoneNone D 0 0 24 155 148 NoneS02 L 245 32 24 160 160 NoneSO2 L 146 19 24 158 160 SlightSO2 L 130 10 24 160 152 ModerateSO2 L 102 5 24 160 140 SevereSO2 D 0 0 24 160 120 SevereFreezing L 112 28 12 162 135 SevereFreezing D 5 0 12 158 97 SevereNone L 0 0 12 300 260 NoneSO2 L 267 38 12 310 240 NoneSO2 L 210 42 12 295 210 ModerateSO2 D 0 0 12 305 196 Moderate
8 Incubated in light (L) or dark (D).
stressed pine seedlings. Measurement of 02 tensions in the 14-mlincubation tubes confirmed these results: production of acetalde-hyde and ethanol by stressed plants is not the result ofanaerobiosisdue to 02 consumption in the incubation tubes. Localized anaer-obiosis due to water-soaked lesions is also unlikely, as acetalde-hyde and ethanol were produced by plants that did not developvisible lesions. Microscopic examination of leaves of stressed birchseedlings which were producing acetaldehyde and ethanol failedto reveal any small water-soaked or necrotic areas.
Production Rates and Gas/Liquid Relationships. We examinedthe time course of accumulation of these volatile products in 60-ml separatory funnels by taking periodic 1-ml head space samplesduring 24 h incubation of stressed pine seedlings in the light anddark. Figure 6 shows a representative experiment. Production ofethylene, ethanol, and acetaldehyde was much more rapid in thelight than in the dark, with acetaldehyde and ethanol in the darkdeclining after the first 5 h incubation. There was no lag in theonset of production of these compounds, with ethylene, ethanol,and acetaldehyde detectable within 10 min of the start of theincubation. Ethane production was very low in these experimentsas the tissue was not necrotic. Ethane accumulation was linearover time, though not detectable until about 2 h after the start offumigation. Ethane accumulation was not affected by light (datanot shown).
Ethylene accumulation in the light appeared to be autocatalytic,with the slope of accumulation rate increasing over time. Incontrast, acetaldehyde and ethanol production reached a constantwithin 12 h of incubation, with acetaldehyde sometimes, but notalways, showing a sharp peak within 5 h of incubation.
Production of volatile hydrocarbons by stressed birch leavesshowed similar kinetics, with two important differences: ethanolaccumulation was considerably less than that ofacetaldehyde, andlight did not affect the rate of accumulation (T. W. Kimmerer andT. T. Kozlowski, manuscript in preparation).
In the 14-ml tubes, saturation of acetaldehyde and ethanolappeared to occur within 4 h of incubation. However, because thesample volume withdrawn for chromatography (1 ml) was largerelative to the tube volume, kinetics of accumulation could not beexamined in detail. We found that 4 h was an adequate incubationtime for ethanol and acetaldehyde accumulation to be measured,but at least 8 h were required for accurate estimation of ethaneproduction.The data presented thus far are for gas-phase hydrocarbons
from head space samples. While ethylene and ethane can beexpected to be entirely in the gas phase under the conditions ofour experiments, the same cannot be said for acetaldehyde andethanol. Pure acetaldehyde boils at 21°C, while ethanol boils at78.50C. At 250C, the temperature of our fumigations and incu-bations, most of the acetaldehyde could be expected to boil off,and little ethanol would accumulate unless diffusion of acetalde-hyde away from the leaf was inhibited. At lower temperatures,much greater accumulation ofboth metabolites could be expected.Table III shows the results of extraction of pine needles incomparison with the gas-phase production of ethanol and acetal-dehyde. While acetaldehyde and ethanol were produced by thestressed plants prior to enclosure in the incubation tubes, therewas relatively little accumulation of the products due to volatili-zation of the acetaldehyde. At lower temperatures, however, bothcompounds do accumulate to an appreciable degree (Table III).
Responses of Other Species to Stress. We surveyed a numberof crop and woody plants to determine whether acetaldehyde andethanol accumulation are common responses to stress in plants byusing the point freezing assay of Elstner and Konze (5). As shownin Table IV, a number of species and cultivars produced thesecompounds under freezing stress. There was no clear correlationbetween taxonomic relationships and production of the stressmetabolites, nor did the plants that produced them under onekind of stress always produce them in response to other stresses(data not shown).
DISCUSSION
S02 stress, as well as a number of other stresses and injuries,induced production of acetaldehyde and ethanol in addition toincreasing production of ethylene and ethane. Acetaldehyde andethanol are not normal products of plants in aerobic conditions,and our results suggest a substantial alteration of respiratorymetabolism in stressed plants. Measurement of these two com-pounds in the gas phase is relatively easy and allows simultaneousdetermination of these compounds as well as two other importantstress metabolites, ethylene and ethane. Gas chromatographicmeasurement of these four compounds may be a useful, sensitivemethod for evaluating plant stress, particularly SO2 stress. Unlikeethylene and ethane, acetaldehyde and ethanol appear to beproduced only under stress conditions; we have never detectedethanol or acetaldehyde production by unstressed plants in any of
VOLATILE HYDROCARBON PRODUCTION BY STRESSED PLANTS
our experiments.In pine seedlings stressed with SO2, acetaldehyde and ethanol
production began very soon after the start of fumigation, in the
ETHYLENE200_
-.*4STRESSED, LIGHT
150- o-oSTRESSED,
_ CONTROL
100_
50-
0*-
$z24 ACETALDEHYDE
0
IC
0
D 12-
0
0. 6-z
0
i \0_
O ETHANOLa
200_
150_
100 /
50-
0 5 10 15 20 25TIME, HOURS
FIG. 6. Rate of accumulation of ethanol, acetaldehyde, and ethylene in60-ml separatory funnels containing 8-month-old red pine seedlings whichhad been fumigated with 0.2 1i 1-1 SO2 for 8 h. Seedlings were incubatedin the dark or under a HID light providing 350 ,uE m-2 s-1 (PAR) at 25°C.At each sampling time, 1 ml air was injected into the flask and 1 ml headspace gas was withdrawn for GC. Control seedlings produced no ethanolor acetaldehyde. Ethane accumulated at a linear rate for the entireincubation, and the rate was not affected by light.
845
absence of any visible injury. Removal of the plants from the SO2atmosphrere into clean air did not result in immediate cessationof production of these compounds (Fig. 2). SO2 stress evidentlycauses lasting metabolic changes in leaf cells even at fumigantconcentrations which do not cause visible injury. Production ofthese compounds may have serious consequences for the plant:while it is unlikely that toxic levels ofthese metabolites accumulatein stressed plants at temperatures above the boiling point ofacetaldehyde, the loss of acetaldehyde and ethanol vapors may bea significant loss offixed carbon from the plant. Since the productsvolatilize, it is unlikely that product inhibition could occur, andbiosynthesis of these compounds might then be unregulated.Moreover, glycolysis may be competing with the TCA cycle andreducing the rate ofATP synthesis per mol glucose consumed. Atlower leaf temperatures, it is possible that toxic amounts of eitheracetaldehyde or ethanol could accumulate.The production of ethanol evidently requires living cells, as
does ethylene biosynthesis (1). Figure 5 shows that as necrosisincreased above 80%o, the production ofthese compounds declined.This is similar to the results of Elstner and Konze (5) who foundthat ethylene production by freezing-stressed plants declined whenmore than 50%o of the leaf was necrotic. The reason for the higherthreshold for declining production of the gases in our experimentsmay be the timing of the injury assessment; we measured necrosisafter the incubation and measurement of gas production. Theremay have been more living cells at the beginning ofthe incubation,producing ethylene and the other gases, and becoming necroticduring incubation as a consequence of the initial stress. Theproduction of acetaldehyde is presumed to require living cells, butthe evidence is somewhat contradictory. In S02-stressed birchseedlings, severe necrosis was accompanied by a decline in acet-aldehyde production (Fig. 5). However, in water-stressed birchseedlings, severe water deficits which resulted in a decline in theproduction of ethylene and ethanol did not cause a concomitantdecrease in acetaldehyde production (Fig. 4).We have assumed that the source of both acetaldehyde and
ethanol in stressed plants is glycolysis, with stress somehow af-fecting either the uptake of 02 or promotion of pyruvic decarbox-ylase activity at the expense of pyruvic dehydrogenase activity. Itis possible that there is another source of acetaldehyde in plantcells. Lipid peroxidation in vitro can lead to production of severalaldehydes, including acetaldehyde (13). If SO2 causes extensivelipid peroxidation, as Peiser and Yang (12) claimed, then acetal-dehyde may be evolved. Since ADH is a constitutive or inducibleenzyme in the cytoplasm of plant cells (4), the production ofacetaldehyde by lipid peroxidation would lead to ethanol synthe-
Table III. Acetaldehyde and Ethanol in Gas and Liquid Phasesfollowing 4 Hours Fumigation ofRed PineSeedlings with 1.0 p1 1-1 SO2
Half the seedlings (10 plants) were incubated for 8 h in 14-ml tubes, the head space gas was assayed, and theshoots were frozen in liquid N2, ground to a fine powder, and extracted with H20 at 15C. After filtering, 5 ,ul ofthe extract were injected on the GC. The remaining seedlings were left for 4 h at 15°C (five plants) or 25°C (fiveplants) in clean air, then frozen and extracted as above without incubation in the tubes.
Table IV. Production of Volatile Hydrocarbons by Herbaceous and Woody PlantsPlants were stressed by freezing 30%o of the leaf area. Data are given in nmol/cm2 leaf area, except for Pinus
halepensis, for which nmol/g dry weight is presented. Each value is the mean of two determinations on tworeplicate samples. Standard errors were less than 10%o of the mean for controls and up to 30%o of the mean forstressed plants.
Species Treatment Ethylene Ethane Acetalde- EthanolhydeZea mays Control 1.37 3.12 0 0
Stressed 1.92 21.85 0 0
Cucurbita maxima Control 12.48 0 0 0Stressed 4.12 1.23 0 0
sis. We consider this less likely than an origin of both compoundsfrom glycolysis for two reasons: (a) the quantities of both acetal-dehyde and ethanol produced are quite large, and it seems unlikelythat a minor product of lipid peroxidation could provide thisamount of either compound; and (b) ethane is known to bederived from peroxidized membrane fatty acids, and if acetalde-hyde is derived from the same source, the time ofpeak productionof both compounds should coincide. This was clearly not the case(Figs. 2-4). This evidence is somewhat circumstantial and needsto be confirmed by more direct methods.
In plants under anaerobic conditions, the production of acetal-dehyde and ethanol may be a result of a decline in cytoplasmicpH due to accumulation of organic acids leading to activation ofpyruvic decarboxylase (4). This requires that the control of cyto-plasmic pH be overriden by a sufficiently large accumulation ofacid species. This may also happen in S02-stressed plants, sincedissolution of SO2 in H20 produces acid products (3). If this is thecase, acetaldehyde production will begin as soon as pyruvic de-carboxylase is activated by reduced pH, and ethanol productionwill begin immediately if ADH is present, or when ADH isinduced or activated by acetaldehyde. However, it could be ex-pected that cytoplasmic pH would recover soon after SO2 wasremoved from the air, since the acid products of S02 are highlyreactive and could be expected to disappear rapidly from thecytoplasm (3). This was not the case, as shown by the persistentproduction of both acetaldehyde and ethanol in clean air (Fig. 2).
Moreover, there is no compelling evidence that the other stresseswhich induced acetaldehyde and ethanol production would lowercytoplasmic pH.
Ethane production was increased by S02 in our experiments,but not until lesions appeared (Fig. 2). This occurred considerablylater than other signs of stress, including increased ethylene pro-duction and the onset of acetaldehyde and ethanol production. Ifethane synthesis were closely linked to the toxic effects of S02 bythe peroxidation of lipid membranes, as suggested by Peiser andYang (12) and by Bressan et al. (2), ethane production couldreasonably be expected to increase well before the appearance oflesions, perhaps even before the increase in stress ethylene pro-duction. The disruption of membranes by peroxidation of constit-uent lipids could then increase membrane permeability, lead toloss of metabolic control, and ultimately cause cellular necrosis.This clearly was not the case with the woody plants we studied.Rather, ethane production accompanied the formation of necroticlesions resulting from a variety of stresses (Table I; Fig. 2). Inwoody plants, then, ethane appears to be a product of the deathof cells regardless of the cause of death and is not an importantproduct of stress metabolism. Monitoring of ethane in woodyplants under stress may only be useful as a simple, objectivemeasure of necrosis, which is not always easy to assay visually,especially when the extent of injury is small.
Acknowledgments-The authors thank Dr. Steven W. Ela and Dr. Heinrich K.
VOLATILE HYDROCARBON PRODUCTION BY STRESSED PLANTS
Schnoes, University of Wisconsin-Madison, for helpful discussion; and Mel Mickefor assistance in performing the MS.
LITERATURE CITED
1. ABELES FB 1973 Ethylene in Plant Biology. Academic Press, New York2. BRESSAN RA, L LECuREux, LG WILSON, P FILNER 1979 Emission of ethylene
and ethane by leaf tissue exposed to injurious concentrations of sulfur dioxideor bisulfite ion. Plant Physiol. 63: 924-930
3. CARMICHAEL CR, LK PETERS 1979 Some aspects of SO2 absorption by water-generalized treatment. Atmos Environ 13: 1505-1513
4. DAVIEs DD 1980 Anaerobic metabolism and the production of organic acids. InPK Stumpf, EE Conn, eds, The Biochemistry of Plants, Vol. 2. AcademicPress, New York, pp 581-611
5. ELsTNER EF, JR KONZE 1976 Effect of point freezing on ethylene and ethaneproduction by sugar beet leaf disks. Nature (Lond) 263: 351-352
6. FIUDOVICH I 1976 02 radicals, hydrogen peroxide and 02 toxicity. In WA Pryor,ed, Free Radicals in Biology, Vol 1. Academic Press, New York, pp 239-277
7. GALIARD T 1970 The enzymic breakdown of lipids in potato tuber by phospho-lipid- and galactolipid-acyl hydrolase activity and bylipoxygenase. Phytochem-istry 9: 1725-1734
8. JoHN WW, RW CURTIS 1977 Isolation and identification of the precursor of
ethane in Phaseolus vulgaris L. Plant Physiol 59: 521-5229. KIMMERER TW, TT KOZLOWSKI 1981 Stomatal conductance and sulfur uptake
of five clones of Populus tremuloides exposed to sulfur dioxide. Plant Physiol67: 990-995
10. KONZE JR, EF ELSTNER 1978 Ethane and ethylene formation by mitochondriaas indication of aerobic lipid degradation in response to wounding of planttissue. Biochim Biophys Acta 528: 213-221
11. NURSTEN HE, AA WILLIAMS 1967 Fruit aromas: a survey of components iden-tified. Chem Ind (Lond) 1967: 486
12. PEISER GD, SF YANG 1979 Ethylene and ethane production from sulfur dioxide-injured plants. Plant Physiol 63: 142-145
13. SCHAUENSTEIN E, H ESTERBAUER, H ZOLLNER 1977 Aldehydes in BiologicalSystems. Their Natural Occurrence and Biological Activities. Pion Ltd, London
14. TINGEY DT, C STANDLEY, RW FIELD 1976 Stress ethylene evolution: a measureof ozone effects on plants. Atmos Environ 10: 969-974
15. WOODSTOCK LW, RB TAYLORSON 1981 Ethanol and acetaldehyde in imbibingsoybean seeds in relation to deterioration. Plant Physiol 67: 424-428
16. WRIGHT STC 1978 Phytohormones and stress phenomena. In DS Letham, PBGoodwin, TJV Higgins, eds, Phytohormones and Related Compounds-AComprehensive Treatise, Vol 2. Elsevier/North-Holland, Amsterdam, pp 495-536
17. YANG SF, HK PRAsrr 1978 The physiology of ethylene in wounded plant tissue.In G Kahl, ed, Biochemistry of Wounded Plant Tissue. de Gruyter, Berlin.