+ All Categories
Home > Documents > Is there going to be enough ethane to support capacity ... · Is there going to be enough ethane to...

Is there going to be enough ethane to support capacity ... · Is there going to be enough ethane to...

Date post: 11-Apr-2018
Category:
Upload: vukien
View: 225 times
Download: 0 times
Share this document with a friend
32
© 2013 The Williams Companies, Inc. All rights reserved. Is there going to be enough ethane to support capacity expansion? Ethane to Ethylene & Derivatives 2013 – Global Petrochemicals Markets Summit Williams NGL & Petchem Services October 29, 2013 Williams Ft. Beeler WV plant
Transcript

© 2013 The Williams Companies, Inc. All rights reserved.

Is there going to be enough ethane to support capacity expansion?

Ethane to Ethylene & Derivatives 2013 – Global Petrochemicals Markets Summit Williams NGL & Petchem Services October 29, 2013

Williams Ft. Beeler WV plant

© 2013 The Williams Companies, Inc. All rights reserved. 2 AmericanBusinessConferences | 10/29/2013

Forward-looking statements The reports, filings, and other public announcements of The Williams Companies, Inc. (Williams) and Williams Partners L.P. (WPZ) may contain or incorporate by reference statements that do not directly or exclusively relate to historical facts. Such statements are "forward-looking statements" within the meaning of Section 27A of the Securities Act of 1933, as amended, and Section 21E of the Securities Exchange Act of 1934, as amended. We make these forward looking statements in reliance on the safe harbor protections provided under the Private Securities Litigation Reform Act of 1995. You typically can identify forward-looking statements by various forms of words such as “anticipates,” “believes,” “seeks,” “could,” “may,” “should,” “continues,” “estimates,” “expects,” “assumes,” “forecasts,” “intends,” “might,” “goals,” “objectives,” “targets,” “planned,” “potential,” “projects,” “scheduled,” “will,” “guidance,” “outlook,” “in service date” or other similar expressions. These forward-looking statements are based on management's beliefs and assumptions and on information currently available to management and include, among others, statements regarding:

>  Amounts and nature of future capital expenditures; >  Expansion and growth of our business and operations; >  Financial condition and liquidity; >  Business strategy; >  Cash flow from operations or results of operations; >  The levels of dividends to Williams stockholders and of cash distributions to WPZ unitholders; >  Seasonality of certain business components; >  Natural gas, natural gas liquids, and olefins prices, supply, and demand; and >  Demand for our services

Forward-looking statements are based on numerous assumptions, uncertainties and risks that could cause future events or results to be materially different from those stated or implied in this presentation. Many of the factors that will determine these results are beyond our ability to control or predict. Specific factors that could cause actual results to differ from results contemplated by the forward-looking statements include, among others, the following:

>  Whether Williams has sufficient cash to enable it to pay current and expected levels of dividends; >  Whether WPZ has sufficient cash from operations to enable it to pay current and expected levels of cash distributions, if any, following establishment of cash

reserves and payment of fees and expenses, including payments to WPZ’s general partner; >  Availability of supplies, market demand, and volatility of prices; >  Inflation, interest rates, and, in the case of Williams, fluctuation in foreign exchange and general economic conditions (including future disruptions and volatility in

the global credit markets and the impact of these events on our customers and suppliers); >  The strength and financial resources of our competitors and the effects of competition;

Ethane to Ethylene & Derivatives 2013

2

© 2013 The Williams Companies, Inc. All rights reserved. 3 AmericanBusinessConferences | 10/29/2013

Forward-looking statements continued

>  Ability to acquire new businesses and assets and integrate those operations and assets into our existing businesses, as well as successfully expand our facilities;

>  Development of alternative energy sources; >  The impact of operational and development hazards and unforeseen interruptions; >  Costs of, changes in, or the results of laws, government regulations (including safety and environmental regulations), environmental liabilities, litigation,

and rate proceedings; >  Williams’ costs and funding obligations for defined benefit pension plans and other postretirement benefit plans sponsored by its affiliates; >  WPZ’s allocated costs for defined benefit pension plans and other post retirement benefit plans sponsored by its affiliates; >  Changes in maintenance and construction costs; >  Changes in the current geopolitical situation; >  Our exposure to the credit risk of our customers and counterparties; >  Risks related to strategy and financing, including restrictions stemming from our debt agreements, future changes in our credit ratings and the availability and

cost of capital; >  The amount of cash distributions from and capital requirements of our investments and joint ventures in which we participate. >  Risks associated with weather and natural phenomena, including climate conditions; >  Acts of terrorism, including cybersecurity threats and related disruptions; and >  Additional risks described in our filings with the Securities and Exchange Commission (SEC).

Given the uncertainties and risk factors that could cause our actual results to differ materially from those contained in any forward-looking statement, we caution investors not to unduly rely on our forward-looking statements. We disclaim any obligations to and do not intend to update the above list or to announce publicly the result of any revisions to any of the forward-looking statements to reflect future events or developments.

In addition to causing our actual results to differ, the factors listed above may cause our intentions to change from those statements of intention set forth in this announcement. Such changes in our intentions may also cause our results to differ. We may change our intentions, at any time and without notice, based upon changes in such factors, our assumptions, or otherwise.

With respect to WPZ, limited partner interests are inherently different from the capital stock of a corporation, although many of the business risks to which we are subject are similar to those that would be faced by a corporation engaged in a similar business.

Investors are urged to closely consider the disclosures and risk factors in Williams’ and WPZ’s annual reports on Form 10-K filed with the SEC on Feb. 27, 2013, and each of our quarterly reports on Form 10-Q available from our offices or from our websites at www.williams.com and www.williamslp.com.

Ethane to Ethylene & Derivatives 2013

3

© 2013 The Williams Companies, Inc. All rights reserved. 4 AmericanBusinessConferences | 10/29/2013

Agenda

>  NGL Production: More supply, what about demand?

>  Infrastructure: The challenges of linking supply with demand

>  Alternatives: Are there “new uses” that could change the conventional wisdom?

>  Globalization: Will exports change our economic outlook?

Ethane to Ethylene & Derivatives 2013

© 2013 The Williams Companies, Inc. All rights reserved. 5 AmericanBusinessConferences | 10/29/2013

NGL Production: How big is BIG?

Ethane to Ethylene & Derivatives 2013

© 2013 The Williams Companies, Inc. All rights reserved. 6 AmericanBusinessConferences | 10/29/2013

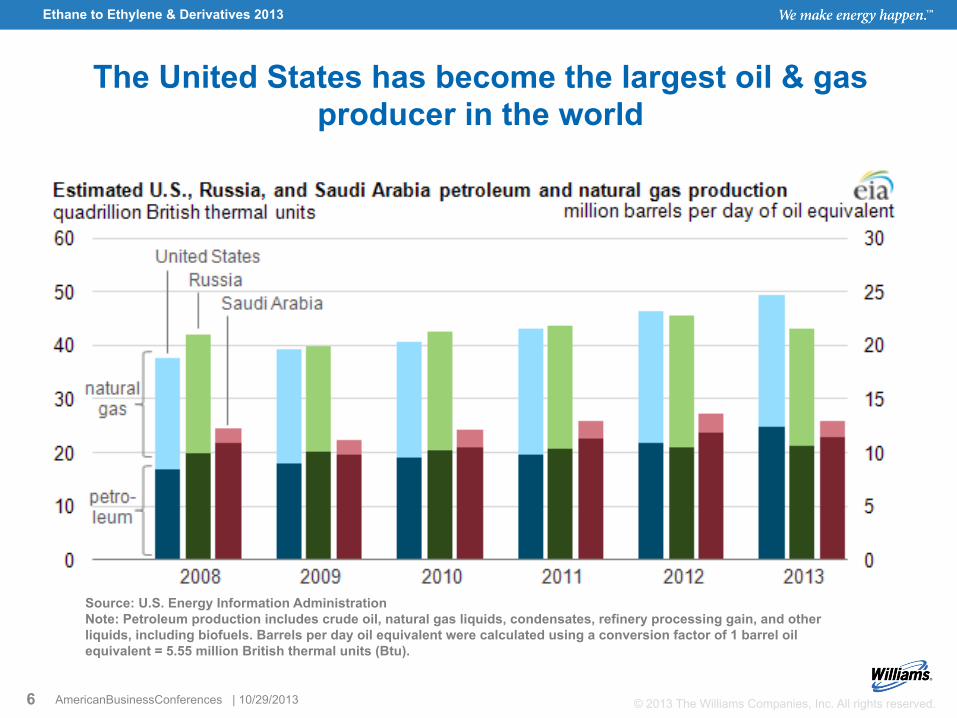
The United States has become the largest oil & gas producer in the world

Ethane to Ethylene & Derivatives 2013

Source: U.S. Energy Information Administration Note: Petroleum production includes crude oil, natural gas liquids, condensates, refinery processing gain, and other liquids, including biofuels. Barrels per day oil equivalent were calculated using a conversion factor of 1 barrel oil equivalent = 5.55 million British thermal units (Btu).

© 2013 The Williams Companies, Inc. All rights reserved. 7 AmericanBusinessConferences | 10/29/2013

Major swing from gas drilling to crude oil drilling

Ethane to Ethylene & Derivatives 2013

© 2013 The Williams Companies, Inc. All rights reserved. 8 AmericanBusinessConferences | 10/29/2013

Will the US maintain the gas-based advantage as crude oil experiences similar development growth?

Ethane to Ethylene Derivatives 2013

© 2013 The Williams Companies, Inc. All rights reserved. 9 AmericanBusinessConferences | 10/29/2013

US NGL supply doubles over the next decade

Ethane to Ethylene Derivatives 2014

-­‐

1,000,000  

2,000,000  

3,000,000  

4,000,000  

5,000,000  

6,000,000  

7,000,000  

US  Total  NGL  Supply  by  Source(barrels  per  day)

Refinery Natural  Gas Imports Inventory  Change

-­‐

1,000,000  

2,000,000  

3,000,000  

4,000,000  

5,000,000  

6,000,000  

7,000,000  

US  Total  NGL  Supply  by  Product(barrels  per  day)

Ethane Propane Iso-­‐Butane Normal  Butane Natural  Gasoline

Source: Williams proprietary research; assumes total production with no infrastructure constraints

© 2013 The Williams Companies, Inc. All rights reserved. 10 AmericanBusinessConferences | 10/29/2013

NGL “export” volumes have potential for development of advantaged petchem assets

Ethane to Ethylene Derivatives 2013

-­‐

1,000,000  

2,000,000  

3,000,000  

4,000,000  

5,000,000  

6,000,000  

7,000,000  

US  Total  NGL  Demand  from  All  Sources(barrels  per  day)

Residential/Commercial Utility,  Farm,  Other

Industrial Fuel

Refinery Chemical

C3+  Supplies  available  for  export Ethane  Export/Rejection  Potential

Source: Williams proprietary research; assumes total production with no infrastructure constraints

© 2013 The Williams Companies, Inc. All rights reserved. 11 AmericanBusinessConferences | 10/29/2013

Additional ethane available after 2018

Ethane to Ethylene Derivatives 2013

-­‐

500,000  

1,000,000  

1,500,000  

2,000,000  

2,500,000  

3,000,000  

US  Ethane  Supply  by  Source(barrels  per  day)

Natural  Gas Refinery Imports Inventory  Change

-­‐

500,000  

1,000,000  

1,500,000  

2,000,000  

2,500,000  

3,000,000  

US  Ethane  Demand  from  All  Sources(barrels  per  day)

Chemical Utility,  Farm,  Other Industrial Ethane  Rejection  Potential

Source: Williams proprietary research; assumes total production with no infrastructure constraints

© 2013 The Williams Companies, Inc. All rights reserved. 12 AmericanBusinessConferences | 10/29/2013

The NE ethane drives the incremental growth opportunities

Ethane to Ethylene Derivatives 2013

-­‐

500,000  

1,000,000  

1,500,000  

2,000,000  

2,500,000  

3,000,000  

1990

1991

1992

1993

1994

1995

1996

1997

1998

1999

2000

2001

2002

2003

2004

2005

2006

2007

2008

2009

2010

2011

2012

2013

2014

2015

2016

2017

2018

2019

2020

2021

2022

2023

2024

2025

2026

2027

2028

2029

2030

US  Ethane  Supply  from  Natural  Gas  by  Region(barrels  per  day)

Gulf  Coast Midwest Rockies West  Coast Northeast

Source: Williams proprietary research; assumes total production with no infrastructure constraints

© 2013 The Williams Companies, Inc. All rights reserved. 13 AmericanBusinessConferences | 10/29/2013

Ethane margin is gone & may not return until 2017+

Ethane to Ethylene Derivatives 2013

© 2013 The Williams Companies, Inc. All rights reserved. 14 AmericanBusinessConferences | 10/29/2013

NGL Production: How big is BIG?

>  NGL supply doubles over the next decade

>  Exports are required to balance demand with supply –  Timing constraints to building infrastructure and consuming plants –  Difficult to commit to downstream investments without certainty of supply

>  Ethane could remain in rejection for an extended period of time

>  Wildcard: Will crude oil production growth change the economics of ethane cracking?

>  Infrastructure constraints will limit growth at times

Ethane to Ethylene & Derivatives 2013

© 2013 The Williams Companies, Inc. All rights reserved. 15 AmericanBusinessConferences | 10/29/2013

NGL Infrastructure: The challenge of linking supply with demand

Ethane to Ethylene & Derivatives 2013

© 2013 The Williams Companies, Inc. All rights reserved. 16 AmericanBusinessConferences | 10/29/2013

Balancing NGL supply & petchem demand will result in price volatility over the next decade

Ethane to Ethylene & Derivatives 2013

Nat Gas Plants in US Relative To Shale Plays

Supply develops incrementally, well-by-well, but Demand increments are step changes

•  Ethylene Cracker world-scale plant size increases from 60,000 bpd to 90,000 bpd of ethane

•  LPG export terminal designs increase to accommodate VLGCs

•  Propane Dehydrogenation (PDH) world-scale plant size increases from 18,000 bpd to 33,000 bpd of propane

Source: EIA

© 2013 The Williams Companies, Inc. All rights reserved. 17 AmericanBusinessConferences | 10/29/2013

Williams Marcellus Position: Linking Producers to High Value Markets

•  Laurel Mountain Midstream

•  Susquehanna Supply Hub

•  Ohio Valley Midstream

•  Blue Racer Midstream

•  Three Rivers Midstream

•  Constitution Pipeline – 2015*

•  Proposed Leidy Southeast – 2015*

Williams Marcellus Overview

© 2013 The Williams Companies, Inc. All rights reserved. 18 AmericanBusinessConferences | 10/29/2013

Williams Marcellus Focus: Timing and Scale

>  Bluegrass provides producers a timely solution to gets NGLs to the highest valued market available.

>  Using existing pipeline assets will reduce the development time (late 2015 completion date).

>  Configuration of NGL gathering (north end) and fractionation and distribution (south end) are under development.

© 2013 The Williams Companies, Inc. All rights reserved. 19 AmericanBusinessConferences| 1029/2013

| 5/29/2013

Ethane infrastructure in the NE – options are developing

Ethane to Ethylene Derivatives 2013

Bluegrass Pipeline Williams/Boardwalk JV

200-400,000 bpd Y-Grade In-Service = End of 2015

PA MB

LC Geismar

Local Demand? Shell or other cracker projects

ATEX Pipeline Enterprise (EPD)

175,000 bpd C2/C3 In-Service = Q1 2014

Marcus Hook

Mariner East 1 Energy Transfer (ETE)

72,000 bpd C2/C3 In-Service = 1st Half

2015

Mariner West Energy Transfer (ETE)

50,000 bpd Ethane In-Service = Q4 2013

Sarnia

Export to NW Europe

© 2013 The Williams Companies, Inc. All rights reserved. 20 AmericanBusinessConferences | 10/29/2013

Supply > Demand: NE Nat Gas & NGLs

Ethane to Ethylene Derivatives 2013

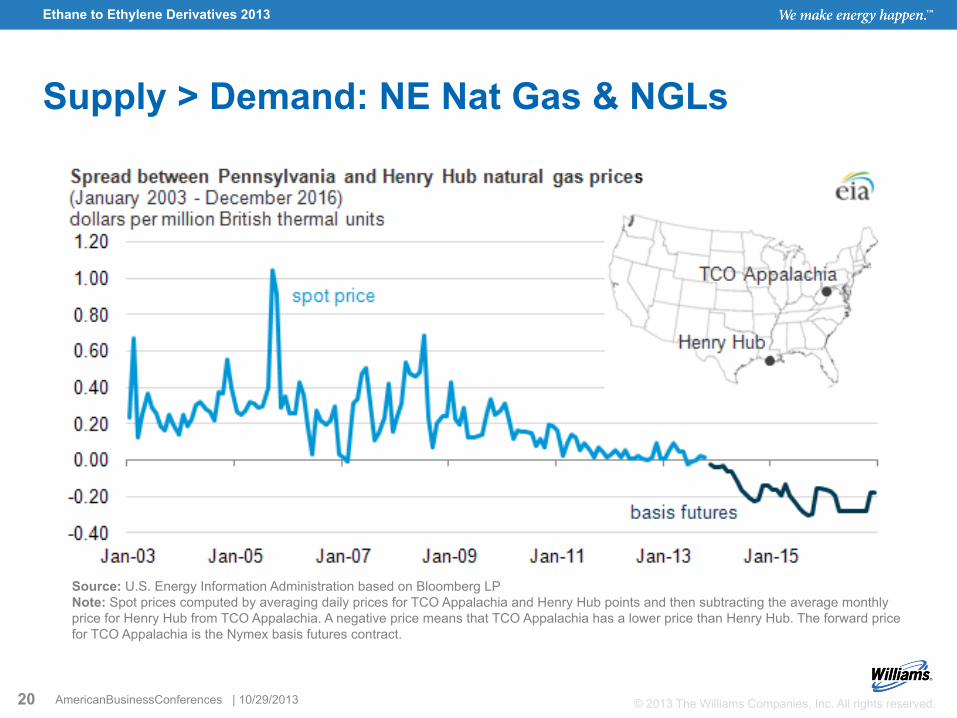
Source: U.S. Energy Information Administration based on Bloomberg LP Note: Spot prices computed by averaging daily prices for TCO Appalachia and Henry Hub points and then subtracting the average monthly price for Henry Hub from TCO Appalachia. A negative price means that TCO Appalachia has a lower price than Henry Hub. The forward price for TCO Appalachia is the Nymex basis futures contract.

© 2013 The Williams Companies, Inc. All rights reserved. 21 AmericanBusinessConferences | 10/29/2013

Current major projects

>  Under construction: −  Ethane pipeline system expansion

• First customer deliveries April, 2013 −  Texas Belle Pipeline:

Isobutane and Normal Butane

>  Under development: −  Promesa Pipeline: Ethylene

Pipeline and Storage Hub −  Jackrabbit Pipeline: PGP Pipeline

and Storage Hub Development

Williams Petchem Services: Open access solutions for the petrochemicals industry

Petrochemical Products Markets

© 2013 The Williams Companies, Inc. All rights reserved. 22 AmericanBusinessConferences | 10/29/2013

NGL Infrastructure: The challenge of linking supply with demand

>  Lead time to complete infrastructure is growing –  Competition for resources: labor, engineering, equipment –  Permitting backlog –  Company limitations on project management and focus

>  Multiple solutions are developing –  Domestic consumption vs. export –  Northeast vs. Gulf Coast

>  US has a unique advantage: existing infrastructure to redeploy

>  Infrastructure buildout has just started with much work left to be done

© 2013 The Williams Companies, Inc. All rights reserved. 23 AmericanBusinessConferences | 10/29/2013

Globalization: Will exports change our economic outlook?

Ethane to Ethylene & Derivatives 2013

© 2013 The Williams Companies, Inc. All rights reserved. 24 AmericanBusinessConferences | 10/29/2013

Exports are required to meet growth expectations

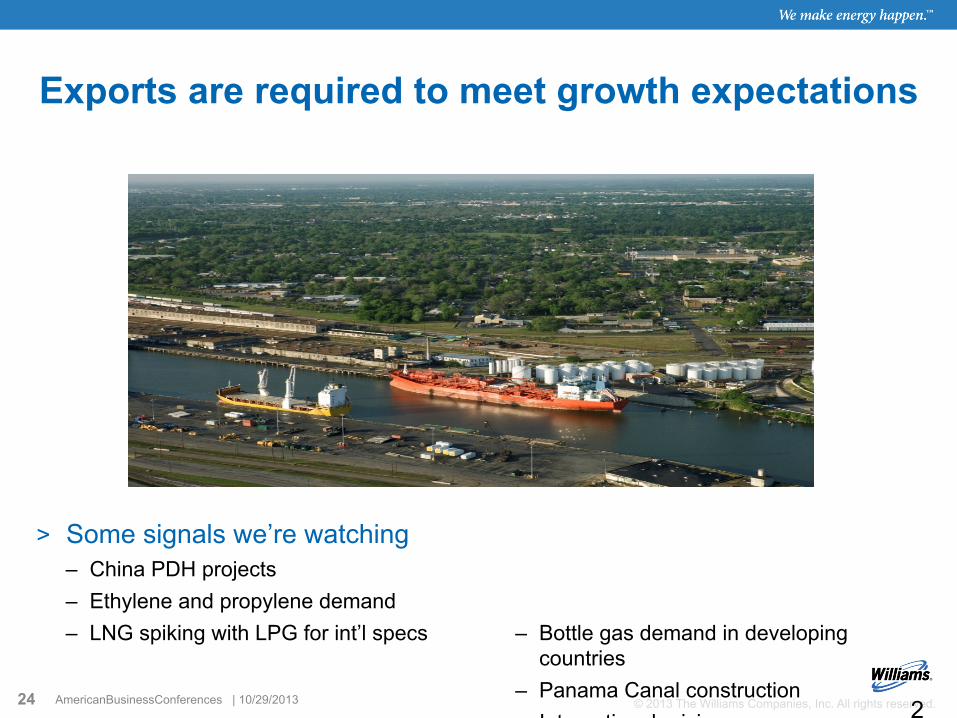
>  Some signals we’re watching –  China PDH projects –  Ethylene and propylene demand –  LNG spiking with LPG for int’l specs –  Bottle gas demand in developing

countries –  Panama Canal construction –  International pricing 2

4

© 2013 The Williams Companies, Inc. All rights reserved. 25 AmericanBusinessConferences | 10/29/2013

The World Needs our LPG… >  At 2011 prices, regular users of LPG would need a monthly household

income in excess of US$350 >  IEA estimates 40% of households gaining access to modern energy by

2030 will do so by switching to LPG

From “The Role of Liquified Petroleum Gas in Reducing Energy Poverty”,

The World Bank, Extractive Industries for Development Series,

Dec. 2011

© 2013 The Williams Companies, Inc. All rights reserved. 26 AmericanBusinessConferences | 10/29/2013

Bluegrass Project Structure

Ø  1,200 Miles of existing and new pipeline to be placed in Y-Grade NGL service

Ø  200,000 Bbls/d of capacity, expandable to 400,000 Bbls/d

Ø  LPG export facility with refrigerated storage for expedited loading

Ø  Capable of loading VLGC’s for international markets

Ø  Intracoastal barge loading facility for access to local Gulf Coast refinery markets

Bluegrass Project (in service 4Q-2015)

Ø  2 - 100,000 Bbls/d fractionation trains capable of making HD-5 and International grade propane

Ø  Y-Grade and purity product storage

Ø  Access to pipelines with markets in Lake Charles, Mont Belvieu, Beaumont and the Mississippi River Corridor

© 2013 The Williams Companies, Inc. All rights reserved. 27 AmericanBusinessConferences | 10/29/2013

Williams NGL & Petchem growth strategy is focused on linking new supplies with markets

Canada Petchem

Petrochemical Product Markets

Redwater PDH

© 2013 The Williams Companies, Inc. All rights reserved. 28 AmericanBusinessConferences | 10/29/2013

Alternatives: Are there “new uses” that could change the conventional wisdom?

Ethane to Ethylene & Derivatives 2013

© 2013 The Williams Companies, Inc. All rights reserved. 29 AmericanBusinessConferences | 10/29/2013

How do we bring manufacturing back to the US?

Ethane to Ethylene & Derivatives 2013

© 2013 The Williams Companies, Inc. All rights reserved. 30 AmericanBusinessConferences | 10/29/2013

Ethane to Ethylene Derivatives 2013

0  

1,000  

2,000  

3,000  

4,000  

5,000  

6,000  

2008   2013   2018   2023   2028  

NGLs  –  U.S.  Supply  Growth  (No  refinery  sourced  material)  

Natural  Gasoline  

Isobutane  

Butane  

Propane  

Ethane  

Manufacturing base requires low-cost supply + infrastructure

Source: Williams proprietary research; assumes total production with no infrastructure constraints

MBbls/day

New market

outlets needed

quickly to sustain development

© 2013 The Williams Companies, Inc. All rights reserved. 31 AmericanBusinessConferences | 10/29/2013

Ethane to Ethylene & Derivatives 2013

Additional ethylene expansions will be needed to keep pace with production growth

0

500

1,000

1,500

2,000

2,500

3,000 20

10

2011

2012

2013

2014

2015

2016

2017

2018

2019

2020

2021

2022

2023

2024

2025

2026

2027

2028

2029

2030

MB

PD

Estimated US Ethane Supply

Natural Gas Refinery

Estimated US ethane supply

Source: Williams research

Current Announced

Projects

Additional 6 + Crackers Needed

© 2013 The Williams Companies, Inc. All rights reserved. 32 AmericanBusinessConferences | 10/29/2013

Conclusions >  The answer to the question “Is there going to be enough ethane to support

capacity expansion?”……. Yes, that is the least of our growth challenges –  Other factors will limit our ability to grow before feedstock limits:

•  Infrastructure development, particularly new-build pipelines •  Capital cost escalation for world-scale projects •  Skilled labor availability

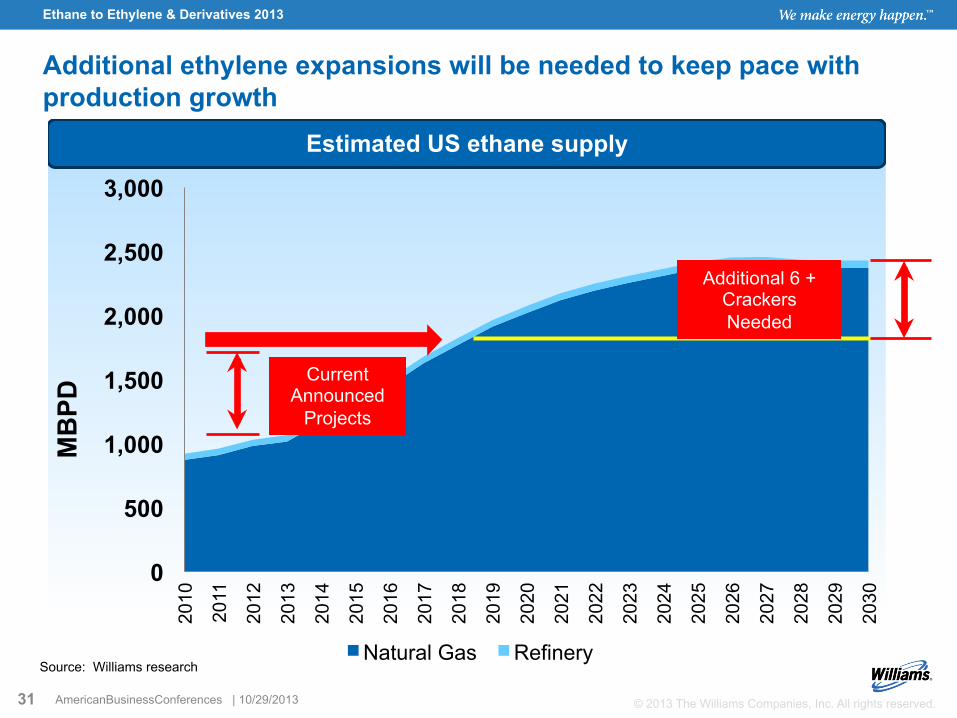
–  Ethane supplies should be sufficient for 6 additional crackers projects after first wave –  Ethane exports could result in additional demand for US production, but transportation

costs are too expensive compared to alternatives to support large volumes

>  LPG export is critical to balance NGL markets –  The US will quickly become the largest player in the LPG market and the most flexible –  LPG export capacity will continue to expand as global demand grows

>  The US has a sustainable advantage that will spur manufacturing growth –  Growth will be limited by infrastructure development and engineering & construction limits –  Combination of US consumer demand and low-cost energy will spur downstream

integration to finished products

Ethane to Ethylene & Derivatives 2013


Recommended