65
EUROCONTROL 2016 PERFORMANCE THROUGH INNOVATION EUROCONTROL MAASTRICHT UPPER AREA CONTROL CENTRE ANNUAL REPORT ///////////////////////////////////////////////////
1
EUROCONTROL
2016PERFORMANCETHROUGH INNOVATION
EUROCONTROL MAASTRICHT UPPER AREA CONTROL CENTRE
ANNUAL REPORT
/ / / / / / / / / / / / / / / / / / / / / / / / / / / / / / / / / / / / / / / / / / / / / / / / / / / / / / / / / / / / / / / / / / / / / / / / / / / / /

2
/ / / / / / / / / / / / / / / / / / / / / / / / / / / / / / / / / / / / / / / / / / / / / / / / / / / / / / / / / / / / / / / / / / / / / / / / /
303
MUAC profile06 Customer
orientation37
Cost-efficiency34
MCG Chairman and Director General’s statement12 MUAC’s contribution to
FABEC performance43
Traffic challenges22 Business outlook55
People51
2016 highlights16 Innovation and development 47
Capacity29
Environment33
Glossary61
Corporate governance08 Interdependencies, revenues
and unit business value39
MUAC Director’s statement14 Optimising airspace design and
usage for sustained performance45
Safety25 Financial accounts56
Key results18
Fast facts04
/ / / / / / / / / / / / / / / / / / / / / / / / / / / / / / / / / / / / / / / / / / / / / / / / / / / / / / / / / / / / / / / / / / / / / / / / /
TABLE OF CONTENTS
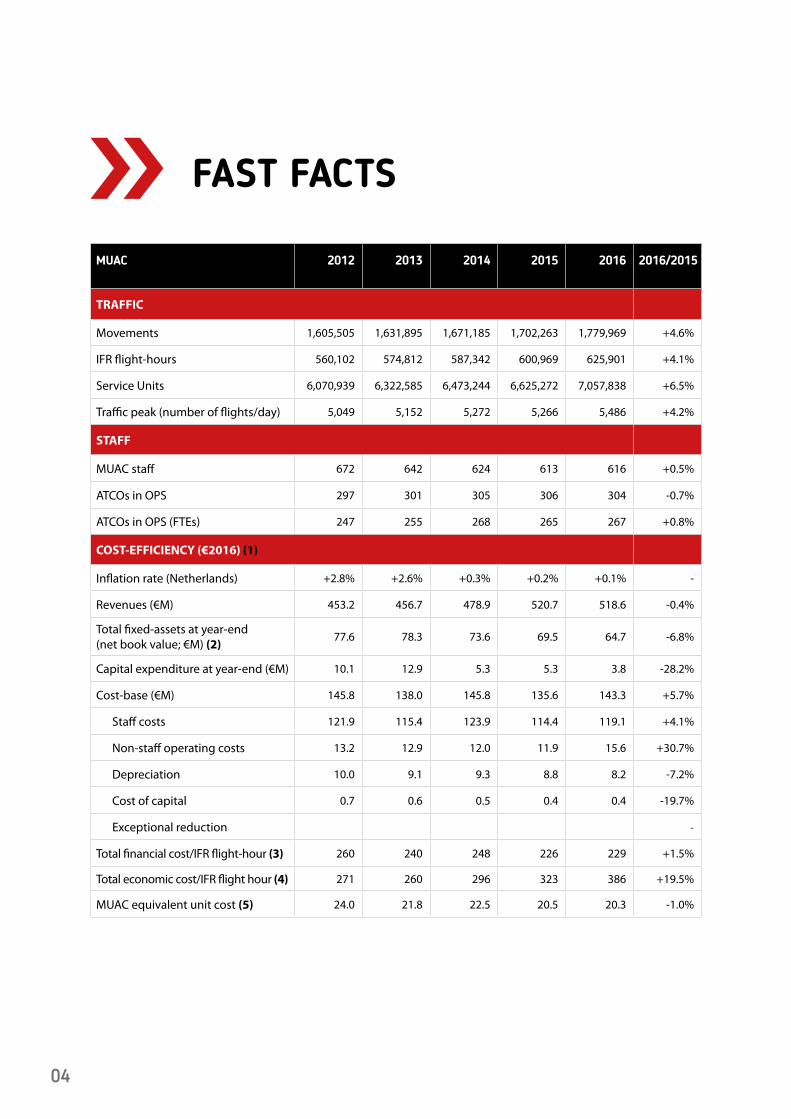
MUAC 2012 2013 2014 2015 2016 2016/2015
TRAFFIC
Movements 1,605,505 1,631,895 1,671,185 1,702,263 1,779,969 +4.6%
IFR flight-hours 560,102 574,812 587,342 600,969 625,901 +4.1%
Service Units 6,070,939 6,322,585 6,473,244 6,625,272 7,057,838 +6.5%
Traffic peak (number of flights/day) 5,049 5,152 5,272 5,266 5,486 +4.2%
STAFF
MUAC staff 672 642 624 613 616 +0.5%
ATCOs in OPS 297 301 305 306 304 -0.7%
ATCOs in OPS (FTEs) 247 255 268 265 267 +0.8%
COST-EFFICIENCY (€2016) (1)
Inflation rate (Netherlands) +2.8% +2.6% +0.3% +0.2% +0.1% -
Revenues (€M) 453.2 456.7 478.9 520.7 518.6 -0.4%
Total fixed-assets at year-end (net book value; €M) (2)
77.6 78.3 73.6 69.5 64.7 -6.8%
Capital expenditure at year-end (€M) 10.1 12.9 5.3 5.3 3.8 -28.2%
Cost-base (€M) 145.8 138.0 145.8 135.6 143.3 +5.7%
Staff costs 121.9 115.4 123.9 114.4 119.1 +4.1%
Non-staff operating costs 13.2 12.9 12.0 11.9 15.6 +30.7%
Depreciation 10.0 9.1 9.3 8.8 8.2 -7.2%
Cost of capital 0.7 0.6 0.5 0.4 0.4 -19.7%
Exceptional reduction -
Total financial cost/IFR flight-hour (3) 260 240 248 226 229 +1.5%
Total economic cost/IFR flight hour (4) 271 260 296 323 386 +19.5%
MUAC equivalent unit cost (5) 24.0 21.8 22.5 20.5 20.3 -1.0%
04
FAST FACTS
05
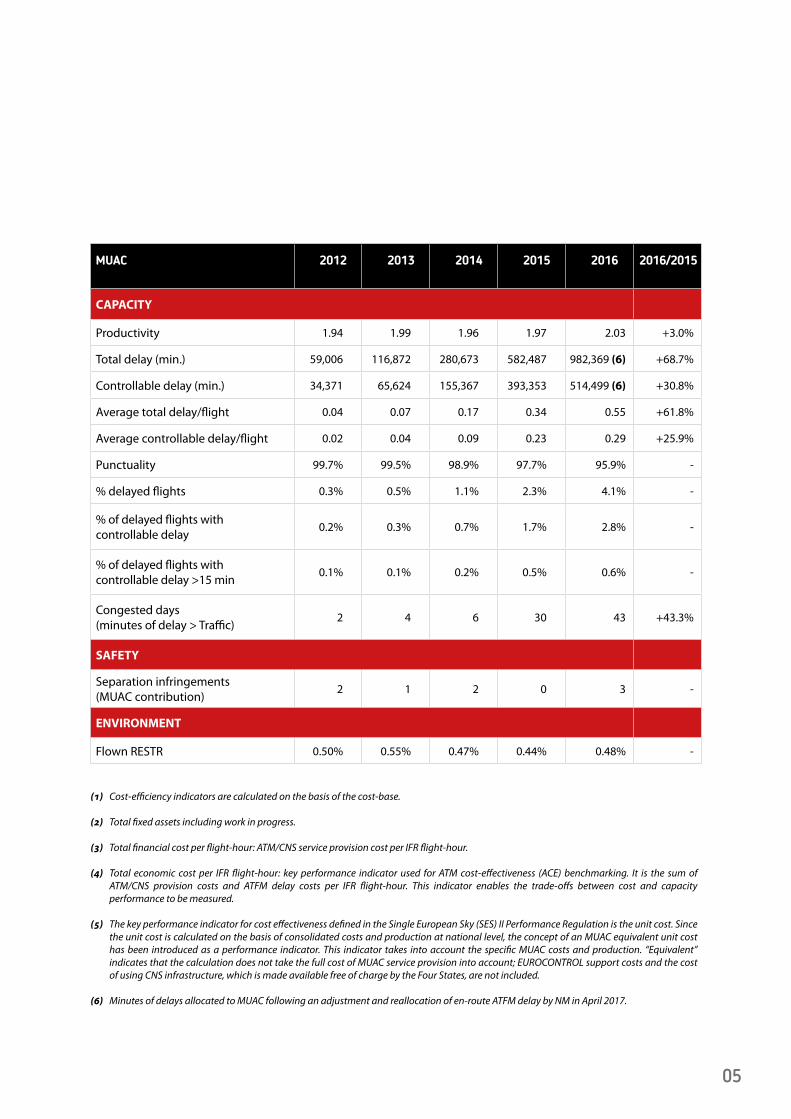
MUAC 2012 2013 2014 2015 2016 2016/2015
CAPACITY
Productivity 1.94 1.99 1.96 1.97 2.03 +3.0%
Total delay (min.) 59,006 116,872 280,673 582,487 982,369 (6) +68.7%
Controllable delay (min.) 34,371 65,624 155,367 393,353 514,499 (6) +30.8%
Average total delay/flight 0.04 0.07 0.17 0.34 0.55 +61.8%
Average controllable delay/flight 0.02 0.04 0.09 0.23 0.29 +25.9%
Punctuality 99.7% 99.5% 98.9% 97.7% 95.9% -
% delayed flights 0.3% 0.5% 1.1% 2.3% 4.1% -
% of delayed flights with controllable delay
0.2% 0.3% 0.7% 1.7% 2.8% -
% of delayed flights with controllable delay >15 min
0.1% 0.1% 0.2% 0.5% 0.6% -
Congested days (minutes of delay > Traffic)
2 4 6 30 43 +43.3%
SAFETY
Separation infringements (MUAC contribution)
2 1 2 0 3 -
ENVIRONMENT
Flown RESTR 0.50% 0.55% 0.47% 0.44% 0.48% -
(1) Cost-efficiency indicators are calculated on the basis of the cost-base.
(2) Total fixed assets including work in progress.
(3) Total financial cost per flight-hour: ATM/CNS service provision cost per IFR flight-hour.
(4) Total economic cost per IFR flight-hour: key performance indicator used for ATM cost-effectiveness (ACE) benchmarking. It is the sum of ATM/CNS provision costs and ATFM delay costs per IFR flight-hour. This indicator enables the trade-offs between cost and capacity performance to be measured.
(5) The key performance indicator for cost effectiveness defined in the Single European Sky (SES) II Performance Regulation is the unit cost. Since the unit cost is calculated on the basis of consolidated costs and production at national level, the concept of an MUAC equivalent unit cost has been introduced as a performance indicator. This indicator takes into account the specific MUAC costs and production. “Equivalent” indicates that the calculation does not take the full cost of MUAC service provision into account; EUROCONTROL support costs and the cost of using CNS infrastructure, which is made available free of charge by the Four States, are not included. (6) Minutes of delays allocated to MUAC following an adjustment and reallocation of en-route ATFM delay by NM in April 2017.
6
/ / / / / / / / / / / / / / / / / / / / / / / / / / / / / / / / / / / / /
The Maastricht Upper Area Control Centre (MUAC) is an international non-profit air navigation service provider, operated by EUROCONTROL on behalf of the Four States – Belgium, Germany, Luxembourg and the Netherlands.
MUAC ensures that aircraft flying in the upper airspace (above 24,500 feet or 7.5 km) over Benelux and north-west Germany can do so safely and efficiently.
To manage this busy and complex airspace, MUAC is organised on a multinational, cross-border basis. It is a working example of how European cooperation, at both civil and military levels, can result in safety, capacity and efficiency benefits for all.
MUAC is uniquely positioned to provide sustainable air navigation services in a large airspace block, satisfying customer expectations and increasing air traffic demand.
/ / / / / / / / / / / / / / / / / / / / / / / / / / / / / / / / / / / / / / / / / / / / / / / / / / / / / / / / / / / / / / / / / / / / / / / / /06
MUAC PROFILE
07
Consolidating airspace across national borders
For more than 40 years, MUAC has played a pivotal role in integrating European airspace on a functional basis, driven not by national boundaries, but by the operational requirements of international traffic flows.
Thanks to its provision of seamless air navigation services to the upper airspace (above 24,500 feet) of Belgium, north-west Germany, Luxembourg and the Netherlands, MUAC enjoys a leading position in the core area of Europe. In order to maintain this position, it continuously strives to deliver safe, efficient, cost-effective and impartial cross-border air navigation services in a dynamic air transport marketplace.
By co-locating a Deutsche Flugsicherung (DFS) unit (Lippe Radar), which controls military operations over north-west Germany on MUAC’s premises, the States have ensured high levels of cooperation and coordination between civil and military air traffic control.
To further improve safety and efficiency, the MUAC Air Traffic Control system has been deployed across different Royal Netherlands Air Force sites. The Shared ATS System (SAS) aims to ensure that all parties have a clear and up-to-date picture of the air situation in the Netherlands, and that synergies are exploited to the maximum extent to improve safety and efficiency. Furthermore, since May 2015, military traffic above 24,500 feet in the Amsterdam FIR is handled on a 24/7 basis by MUAC as General Air Traffic (GAT).
MUAC also provides correlated flight data to Belgium’s Belga Radar Air Traffic Control Centre at Semmerzake.
One of MUAC’s flagship activities is the development and implementation of leading-edge infrastructure and technology solutions to ensure that customers and stakeholders benefit from the highest levels of performance. MUAC’s active involvement in SESAR (Single European Sky ATM Research) is instrumental in meeting this objective.
Mission and vision
MUAC’s mission is to provide cross-border ATM to civil and military airspace users in the core area of Europe and to develop, integrate and provide state-of-the-art ATM systems and services.
MUAC’s vision is to be recognised as an outstanding provider of ATM and ATM-related systems and services. MUAC is a leading innovator in its area of competence.
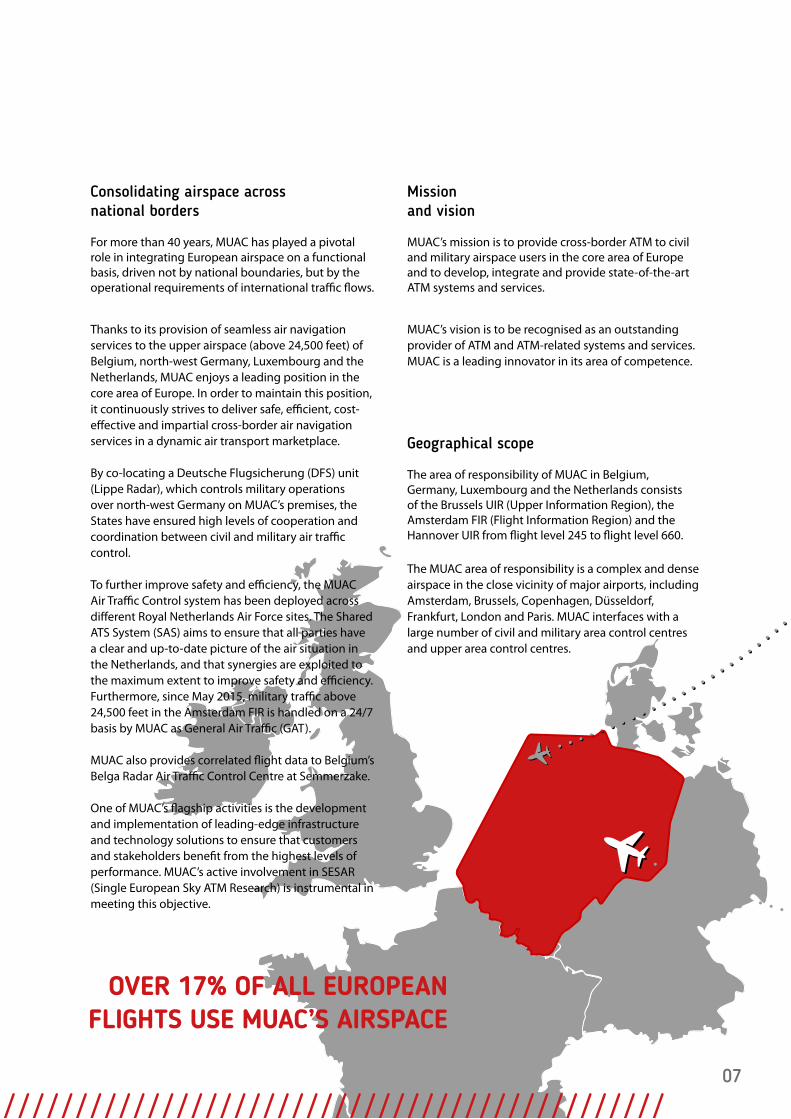
Geographical scope
The area of responsibility of MUAC in Belgium, Germany, Luxembourg and the Netherlands consists of the Brussels UIR (Upper Information Region), the Amsterdam FIR (Flight Information Region) and the Hannover UIR from flight level 245 to flight level 660.
The MUAC area of responsibility is a complex and dense airspace in the close vicinity of major airports, including Amsterdam, Brussels, Copenhagen, Düsseldorf, Frankfurt, London and Paris. MUAC interfaces with a large number of civil and military area control centres and upper area control centres.
/ / / / / / / / / / / / / / / / / / / / / / / / / / / / / / / / / / / / / / / / / / / / / / / / / / / / / / / / / / / / / / / / / / / / / / / / /
OVER 17% OF ALL EUROPEANFLIGHTS USE MUAC’S AIRSPACE
808
/ / / / / / / / / / / / / / / / / / / / / / / / / / / / / / / / / / / / /
/ / / / / / / / / / / / / / / / / / / / / / / / / / / / / / / / /
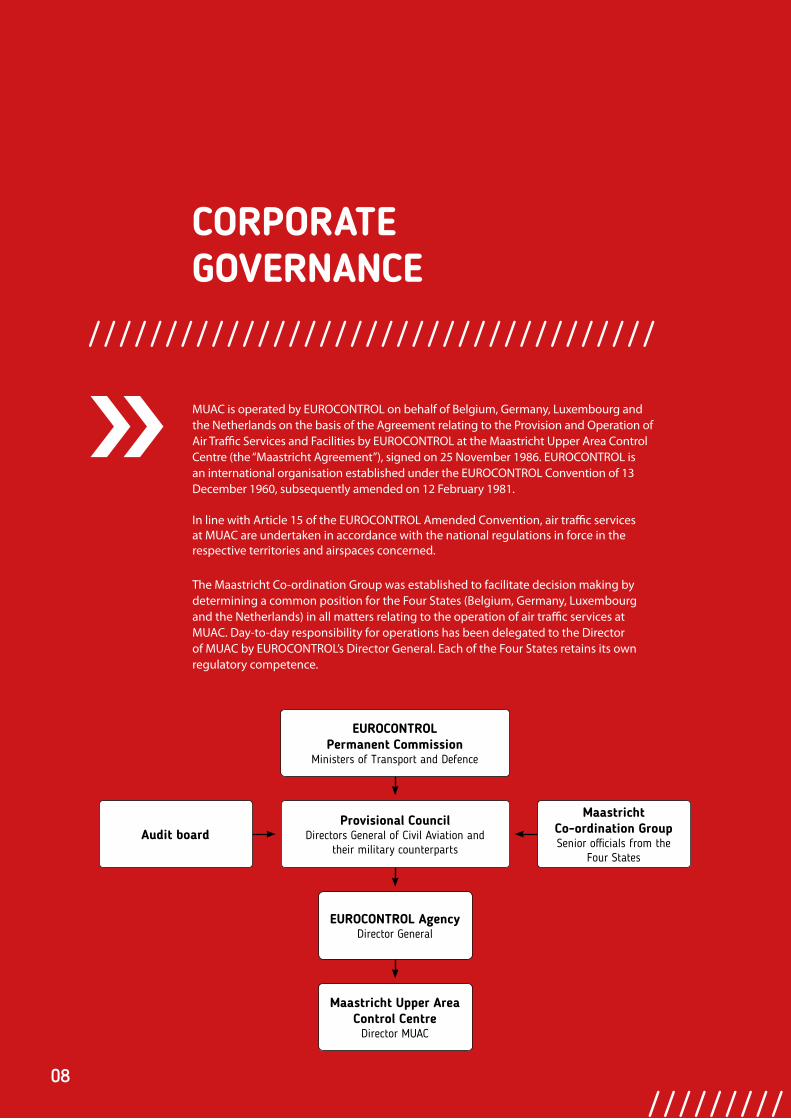
Audit boardProvisional Council
Directors General of Civil Aviation and their military counterparts
EUROCONTROL AgencyDirector General
Maastricht Upper Area Control Centre
Director MUAC
EUROCONTROLPermanent Commission
Ministers of Transport and Defence
Maastricht Co-ordination GroupSenior officials from the
Four States
MUAC is operated by EUROCONTROL on behalf of Belgium, Germany, Luxembourg and the Netherlands on the basis of the Agreement relating to the Provision and Operation of Air Traffic Services and Facilities by EUROCONTROL at the Maastricht Upper Area Control Centre (the “Maastricht Agreement”), signed on 25 November 1986. EUROCONTROL is an international organisation established under the EUROCONTROL Convention of 13 December 1960, subsequently amended on 12 February 1981.
In line with Article 15 of the EUROCONTROL Amended Convention, air traffic services at MUAC are undertaken in accordance with the national regulations in force in the respective territories and airspaces concerned.
The Maastricht Co-ordination Group was established to facilitate decision making by determining a common position for the Four States (Belgium, Germany, Luxembourg and the Netherlands) in all matters relating to the operation of air traffic services at MUAC. Day-to-day responsibility for operations has been delegated to the Director of MUAC by EUROCONTROL’s Director General. Each of the Four States retains its own regulatory competence.
CORPORATE GOVERNANCE
09
/ / / / / / / / / / / / / / / / / / / / / / / / / / / / / / / / /
Regulation
In addition to the international regulatory regime, air navigation service provision at MUAC is subject to four national regulatory regimes, each specifically defining applicable rules and regulations. Over recent years, regulation and oversight of MUAC have been exercised in a coordinated manner by the Four States.
Supervision and oversight
Further to the adoption of Regulation (EC) No 549/2004 of the European Parliament and of the Council of 10 March 2004 laying down the framework for the creation of the Single European Sky (the framework Regulation), each of the Four States has established National Supervisory Authorities (NSAs). In Belgium, it is the Belgian Supervisory Authority for Air Navigation Services (BSA-ANS); in Germany, the Federal Supervisory Authority for Air Navigation Services (BAF); in Luxembourg, the Civil Aviation Authority (CAA Luxembourg) and in the Netherlands, the Human Environment and Transport Inspectorate (ILT) of the Ministry of Infrastructure and the Environment. The Four States’ NSAs have created two bodies to support the oversight of MUAC: the NSA Committee, representing all four NSAs, and having a coordination and advisory role for the relevant national decision-making authorities on oversight issues; and the Common Supervisory Team, composed of personnel from the cooperating NSAs, who have an executive role in performing document examinations, audits and inspections.
Designation of MUAC as an air traffic service provider
In accordance with Article 8 of the Regulation (EC) No 550/2004 of the European Parliament and of the Council of 10 March 2004 on the provision of air navigation services in the Single European Sky (the service provision Regulation), EUROCONTROL was designated as an air traffic service provider in the Netherlands, by amendment to the Aviation Act in October 2007. Belgium, Germany and the Netherlands maintain the designation of EUROCONTROL as an air traffic service provider as per the Maastricht Agreement and the relevant national laws.
Certificates
In line with Single European Sky legislation, MUAC holds the certificate for the provision of air navigation services in the European Community. The certificate was granted in 2006 by the Netherlands’ Transport and Water Management Inspectorate and Directorate General for Civil Aviation and Freight Transport.
In 2009, the Belgian Supervisory Authority for Air Navigation Services certified MUAC for the provision of unit and continuation training for air traffic controllers and for the provision of training to certify the roles of on-the-job training instructor, competence examiner and/or competence assessor of the delivery of air traffic services. This certificate was updated in 2011 pursuant to Commission Regulation (EU) No 805/2011.
In line with Single European Sky legislation, MUAC holds the certificate for the provision of air navigation services in the European Community. MUAC also holds ISO 9001:2008 certification to provide customers with Air Traffic Management, Communications and Surveillance Services consistent with international standards, including the procurement, integration and maintenance of technical systems, and the provision of ATM specific training. The certificate was re-issued on 21 December 2015 and is valid until 14 December 2017, as was confirmed by auditor DNV-GL as a result of a periodic audit in September 2016.
Controller licensing
Since March 2010, the Belgian Civil Aviation Authority has been the licence-issuing authority for air traffic controllers and student air traffic controllers at MUAC. MUAC controllers hold a Belgian ATC licence for the delivery of services in Belgian, Dutch, German and Luxembourg airspace. The licences are issued in accordance with Commission Regulation (EU) 2015/340 of 20 February 2015, laying down technical requirements and administrative procedures relating to air traffic controllers’ licences and certificates pursuant to Regulation (EC) No 216/2008 of the European Parliament and of the Council. The certificate was issued by BSA-ANS 13 December 2016.
10
Maastricht Coordination Group
Belgium
Head of Delegation
Mr Patrick VANHEYSTE Federal Public Service for Mobility and TransportDirector Belgian Supervising Authority for ANS
Other participants
Mr Theo NSENGIMANABelgian Civil Aviation Authority
Maj. Tom VAN HEUVERSWYN Belgian Armed Forces – Air Component
Maj. Ann D’HONDTBelgian Armed Forces – Air Component
Mrs Annabelle BACKSBelgocontrol
Mr Hans PLETSBelgocontrol
Germany
Head of Delegation
Mr Dirk NITSCHKE Federal Ministry for Transport and Digital InfrastructureChair of the Maastricht Coordination Group during 2016
Other participants
Mr Aleksandar VASILEVFederal Ministry for Transport and Digital Infrastructure
Mr Karsten HARTWIGMinistry of Defence
Col. Andreas HOPPEMinistry of Defence
Mr Andreas PÖTZSCH Deutsche Flugsicherung
Luxembourg
Head of Delegation
Mr Pierre JAEGER Director General of Civil Aviation
Other participants
Mr Claude LUJADirectorate of Civil Aviation
Mr Kevin SCHROEDERMinistry of Sustainable Development and Infrastructure
Mr Ender ÜLCÜN Ministry of Sustainable Development and Infrastructure
Netherlands
Head of Delegation
Mr Paul VAN GURPMinistry of Infrastructure and Environment
Other participants
Mr Eric DE VRIESMinistry of Infrastructure and Environment
Lt. Col. Leon CREMERSMinistry of Defence
Mr Bert ROLVINK Luchtverkeersleiding Nederland
Observers
Mr Volker DICKStaff Committee Servant
Mr Frederic DELEAUStaff Committee Servant
11
Management Director General of EUROCONTROL
Mr Frank BRENNER
MUAC Board
Mr Jac JANSENDirector
Mr Ian MIDDLETONHead of Operations Domain Mr Peter NAETS Head of Engineering Domain
Mr Chris STADLERHead of ATM Services Delivery
Mr Niels LOKMANHead of Strategy and Priority Management
Mr Bart VANDERSMISSENHead of Change Management
Mr Onno REITSMAHead of Support Services Delivery
Mr Morten HANSENHead of Safety, Quality & Security
Mr Flemming NYRUPHead of Performance Management
Mr Robin HICKSONHead of Stakeholder Management
Mr Keith CARTMALESafety Manager
Mr Örjan ANDERBERGQuality Manager
12
Dear reader,
MUAC has come a long way in establishing its leading position as an international Air Navigation Service Provider. Certainly, it has not been an easy task, especially taking into consideration the numerous uncontrollable and unpredictable factors which regularly influence the aviation industry, and contributed to making 2016 one of the most challenging years of the last decade.
Not only did MUAC manage to handle a massive volume of traffic in 2016, breaching the previous all-time daily record no less than 43 times, but it was also exposed to the consequences of numerous hard-to-mitigate risks, such as those linked to significant levels of non-forecasted traffic growth.
Last year was marred by the non-achievement of the capacity target levels required for the Single European Sky (SES), albeit agreed with FABEC partners. Additional minutes of delay, generated by a lack of available capacity during peak hours, led to MUAC being accountable for a FABEC financial penalty.
Nevertheless, MUAC has resolutely striven to achieve significant improvements to its operational, financial and environmental performance, whilst keeping safety at remarkable levels – which is not a given, but demands a high level of unrelenting effort.
During 2016, major strides were taken to complete one of the most significant landmarks of civil-military integration in the MUAC airspace - the integration of the service provision to military aircraft in the Hannover Upper Information Region. This historic milestone paved the way to make MUAC the first cross-border
civil-military Air Traffic Service provider in Europe. As the Director General of EUROCONTROL and the MCG Chairman both happened to be Germans in 2016, they should surely be allowed to show a modicum of national pride for the manifest input to this project from their home country resulting from their 22 years of operational experience in civil-military cooperation in ANS (Air Navigation Services).
In another addition to MUAC’s responsibilities, the Agency received an increased mandate for MUAC to also handle military flights in Dutch airspace through the integration of civil-military Air Traffic Control as of 2017.
But, MUAC is not just improving inside its borderless area of responsibility, it is also bridging beyond its airspace. As part of the ‘ATM Data as a Service’ (ADaaS) project, which was co-financed by the European Union, MUAC and the Slovenian Air Traffic Control organisation (Slovenia Control) demonstrated that it is technically feasible to control air traffic from one ATC centre by using remote digital ATM data provided from another ATC centre many hundreds of miles away.
These are just a few highlights of the reporting year, and as you read the rest of this report, we hope you will appreciate the efforts made by MUAC to increase overall efficiency for its stakeholders.
We are convinced that MUAC has made good progress to consolidate its reputation among the aviation community thanks to its staff’s professionalism coupled with high productivity, top-notch technology and an unfailing willingness to respond to customer expectations.
MCG CHAIRMAN AND DIRECTOR GENERAL’S STATEMENT
/ / / / / / / / / / / / / / / / / / / / / / / / / / / / / / / / / / / / / / / / / / / / / / / / / / / / / / / / / / / / / / / / / / / / / / / / / / / /
13
We strongly believe that innovation, forward thinking, transparency and team spirit are paramount for the delivery of excellent services to the European ATM network. We therefore encourage MUAC’s management and employees to keep up this ‘can-do’ spirit and maintain their excellent performance levels over the years to come.
Whilst these positive words about MUAC’s achievements and performance, made possible by its staff and management, should customarily close the statement, this time we cannot conclude without asking one vital question: MUAC, quo vadis?
Why such a question after yet another report on the continued excellent performance of the Centre? This query originates from a very condensed look at MUAC’s history. In 1986, the Four States consciously and deliberately decided to do what six States, ultimately, didn’t dare to do, even though it was the essential reason for their coming together in the international organisation - EUROCONTROL.
The Four States’ courage was rewarded as MUAC quickly became an internationally recognized success story, providing air traffic services in airspace regardless of national borders, designed and dedicated to serve the air traffic and oriented to its flows. Nobody knew at that time, that more than 30 years later such an entity would be referred to as a Functional Airspace Block - a FAB! Ironically, even after the legal basis was implemented, the international airspace block served by MUAC was not able to be nominated as a FAB. Some ‘interests’ did not support such an outcome.
At least, today MUAC and ‘its’ airspace constitutes a major element of FABEC, the functional airspace block in the core of Europe, which is responsible for handling more than 55% of all European air traffic. But, where is MUAC today, and: ‘Quo vadis MUAC’ in an environment, where the debates on performance regularly appear to be reduced down to merely saving money? As our fellow countrymen like to say, “Geiz ist geil”, stinginess is sexy, an unhealthy advertisement slogan in Germany for quite some time, seems to have conquered the sober understanding of ATM performance. Safety: it’s taken for granted, and free. Environment: not cherished, but widely accepted as inescapable. Capacity: shall satisfy actual requirements and not forecasts. Cost efficiency: the cheaper the better. Perhaps the question is wrong. It should rather read: “Quo vadis, SES?”
MUAC was set up nearly 20 years before SES was born. Furthermore, MUAC, to a great extent, consistently achieves what SES is still struggling to accomplish. So why has MUAC’s institutional set-up been put in question and uncertainty placed upon its future? Perhaps, the first question is yet correct: “MUAC, Quo vadis?”. Let’s wait for the next annual report …..
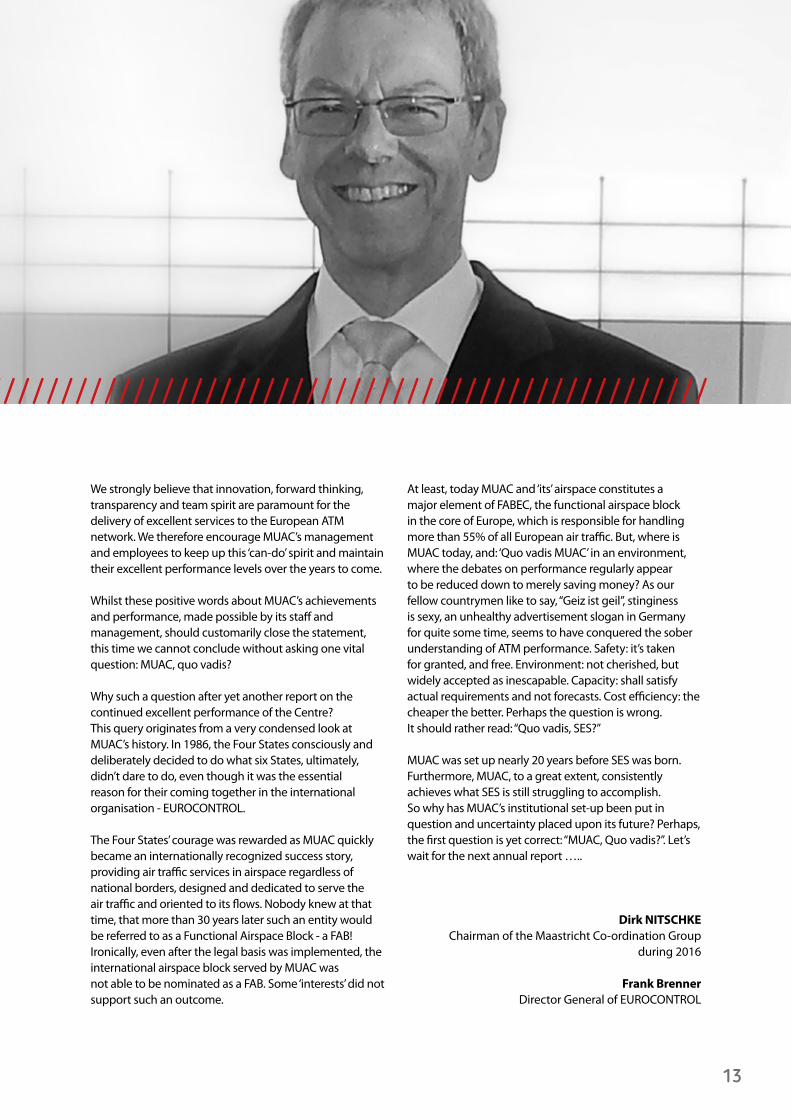
Dirk NITSCHKEChairman of the Maastricht Co-ordination Group
during 2016
Frank BrennerDirector General of EUROCONTROL
/ / / / / / / / / / / / / / / / / / / / / / / / / / / / / / / / / / / / / / / / / / / / / / / / / / / / / / / / / / / / / / / / / / / / / / / / / / / /
14
Similar to 2015, last year was marked by a stronger-than-forecasted air traffic growth across the whole MUAC airspace. As a result of the variations in national Unit Rates, MUAC experienced substantial changes to traffic patterns as airspace users unrelentingly optimised their choice of routes in search of maximum efficiency at minimum cost.
The previous all-time traffic record was broken 43 days in 2016 and reached a new high in September. This was a clear sign that the summer season lasted longer and that, given its low seasonality, MUAC was exposed to unprecedented traffic handling challenges over longer periods of time.
In particular, the DECO and Hannover sector groups were faced with significant traffic demand placing additional pressure on controllers. Continuous high demand in the Brussels sector groups led to a further reliance on the strategy of shifting London inbound flows into the DECO sector group. However, despite this solution successfully mitigating delay in the Brussels sectors to a moderate degree, additional pressure was transferred to the DECO sectors which, as a consequence, experienced an increasing amount of delay.
Furthermore, in summer 2016, unprecedented adverse weather conditions severely impacted operations in the most congested and complex sectors in the Brussels and DECO sector groups. MUAC managed to mitigate the effect of these factors, which were beyond its control, and minimise any deterioration in the quality of service for its customers. Nevertheless, despite the delivery of higher than planned capacity, the aforementioned challenges prevented the Centre from achieving the capacity and economic cost-effectiveness targets which resulted in MUAC having to bear a FABEC financial penalty.
That apart, MUAC overall performance remained strong and balanced in the areas of safety, financial cost-effectiveness and environment. A strong customer-oriented culture supported by a robust and transparent communication process reinforced MUAC’s image among its stakeholder community, despite persistent challenges in the capacity area.
In addition, a large number of operational, technical and managerial programmes were developed and implemented throughout the course of the year to help ensure that high levels of performance could be maintained over the coming years.
Traffic increased significantly by 4.6% on the previous year, and an all-time high of more than 1.7 million flights was reached. MUAC generated 6.5% more service units than in 2015.
Over the course of 2016, the actual number of severity A and B separation infringements attributed to MUAC was three, which is within the self-imposed ceiling that MUAC sets, based on historic trends.
One of the effectiveness indicators for Management Objectives (MOs) within the Safety Management System (SMS) was reduced from level 4 to level 3. All other objectives achieved the Single European Sky (SES) Reference Period 2 (RP2) target requirement of Level 4.
A total of 95.9% of flights were handled delay-free, and although punctuality deteriorated from 97.7% in 2015, only 0.6% of flights experienced more than 15 minutes of delay. Despite the continuous delivery of greater-than-planned capacity, the average delay per flight increased to 0.55 ADM (average en-route ATFM delay per move-ment), thus underlining the need for further capacity
DIRECTOR’S STATEMENT
JAC JANSEN
/ / / / / / / / / / / / / / / / / / / / / / / / / / / / / / / / / / / / / / / / / / / / / / / / / / / / / / / / / / / / / / / / / / / / / / / / / / / /
15
expansion as one of the main areas in need of improve-ment in the near future.
The total economic cost per IFR flight-hour (€2016) was €386 – 19.5% up on 2015, mainly driven by an increase of delay costs. However, total service provision costs were kept at €143.3 M - 3.5% down on the agreed cost-base. Furthermore, thanks to a strong return to traffic growth and despite a downward re-adjustment of the German national Unit Rate, MUAC’s profitability remained high.
Staff numbers slightly increased to 616, a value which is essentially comparable to the previous year. Control-ler productivity remained ‘best in class’, with 2.03 IFR flight-hours per controller-hour on duty – the highest level ever reached by MUAC. The past year also saw the much-awaited cross-training of ATCOs and fresh recruit-ment of ab-initio trainees. The first delivery of the New Unit Training course was a resounding success, with a 100% pass rate thanks to the hard work of all involved.
While in the recent past, managerial efforts have been put on achieving greater financial efficiencies, it has become increasingly clear that, given the current chal-lenges triggered by a general economic recovery, MUAC will be required to invest more resources to meet future demand and to keep and reinforce its market-leading position in the core European area.
Nevertheless, an appropriate balance must be found to facilitate the necessary investment in future technolog-ical improvements, safety enhancements and participa-tion in key SESAR validations.
In 2016, flight-efficiency programmes continued to deliver tangible benefits to airspace users. The provision of detailed free route airspace reports to aircraft
operators resulted in savings of millions of euros by enabling those operators to reduce the amount of fuel carried on each flight as well as by reducing the number of miles flown. Direct route usage by our main customers increased to 78%, generating savings in the order of 989,100 NM for aircraft operators compared to the fixed-route network. For several airlines, total usage of free routes was above 90%.
At the tactical level, the allocation of direct routes resulted in a total flight distance reduction of 7,616,000 NM (or 4.7 NM on average per flight), some 152,000 t lower CO2 emissions and more than 45,000 t of fuel saved, a value which is equivalent to not refueling 1,950 A320 aircraft. In addition to the flight efficiency programmes, MUAC contributed to the reduction of our overall energy impact on the environment with an estimated reduction of electricity consumption of 680,000 KWh/year equivalent to a CO2 reduction in excess of 472 t per year.
Finally, as my mandate has come to an end, I would like to express my sincerest gratitude to all of the MUAC staff for your great work, and particularly for your high levels of motivation, your undoubted dedication, your enduring efforts and the goodwill you have put into the job. Without all these ingredients MUAC would not have been able to continue to provide the high-quality services that our customers and stakeholders are accustomed to. I wish you all a brilliant future, and keep up the good work!
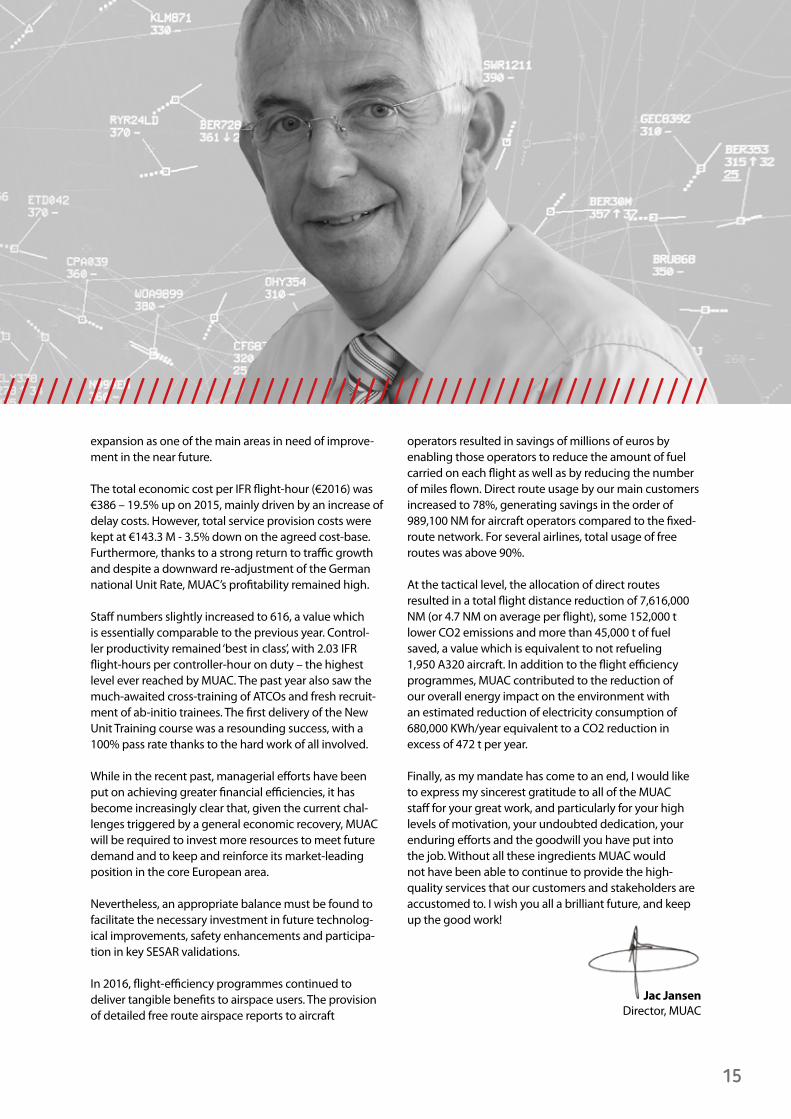
Jac JansenDirector, MUAC
/ / / / / / / / / / / / / / / / / / / / / / / / / / / / / / / / / / / / / / / / / / / / / / / / / / / / / / / / / / / / / / / / / / / / / / / / / / / /
16
01
05
09 10
02
06
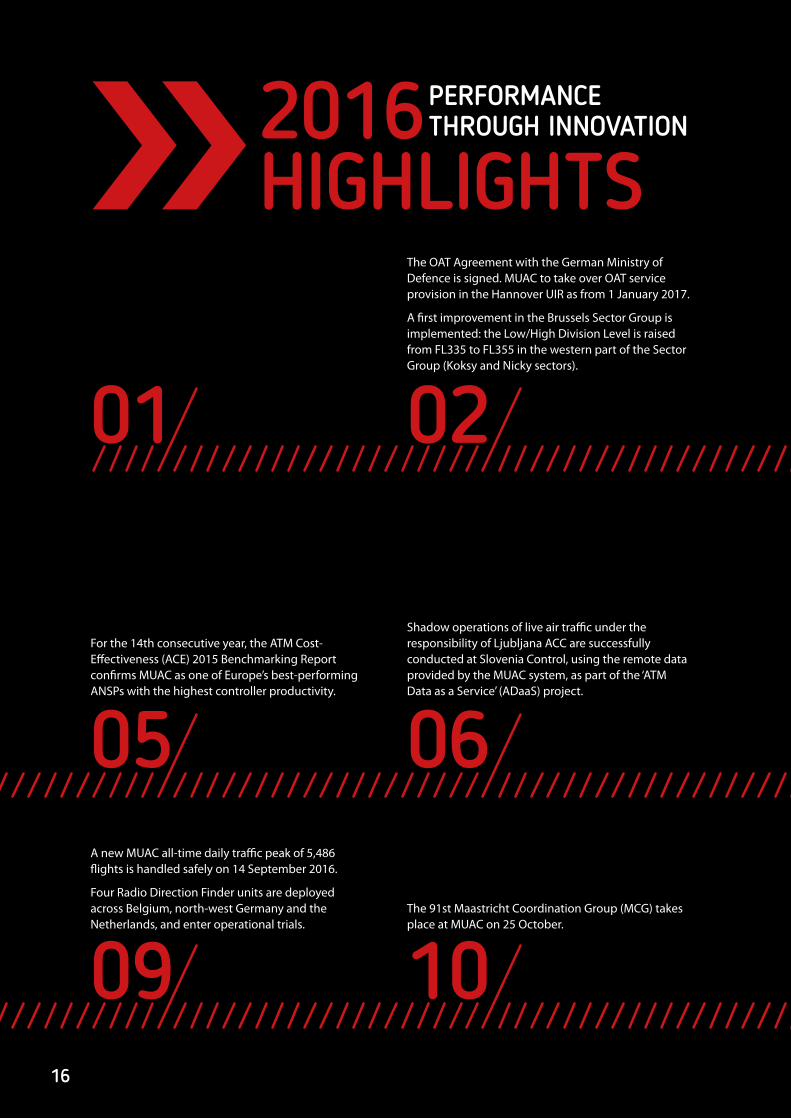
2016 HIGHLIGHTS
PERFORMANCETHROUGH INNOVATION
For the 14th consecutive year, the ATM Cost-Effectiveness (ACE) 2015 Benchmarking Report confirms MUAC as one of Europe’s best-performing ANSPs with the highest controller productivity.
A new MUAC all-time daily traffic peak of 5,486 flights is handled safely on 14 September 2016.
Four Radio Direction Finder units are deployed across Belgium, north-west Germany and the Netherlands, and enter operational trials.
The OAT Agreement with the German Ministry of Defence is signed. MUAC to take over OAT service provision in the Hannover UIR as from 1 January 2017.
A first improvement in the Brussels Sector Group is implemented: the Low/High Division Level is raised from FL335 to FL355 in the western part of the Sector Group (Koksy and Nicky sectors).
Shadow operations of live air traffic under the responsibility of Ljubljana ACC are successfully conducted at Slovenia Control, using the remote data provided by the MUAC system, as part of the ‘ATM Data as a Service’ (ADaaS) project.
The 91st Maastricht Coordination Group (MCG) takes place at MUAC on 25 October.
17
08
11 12
03
07
04
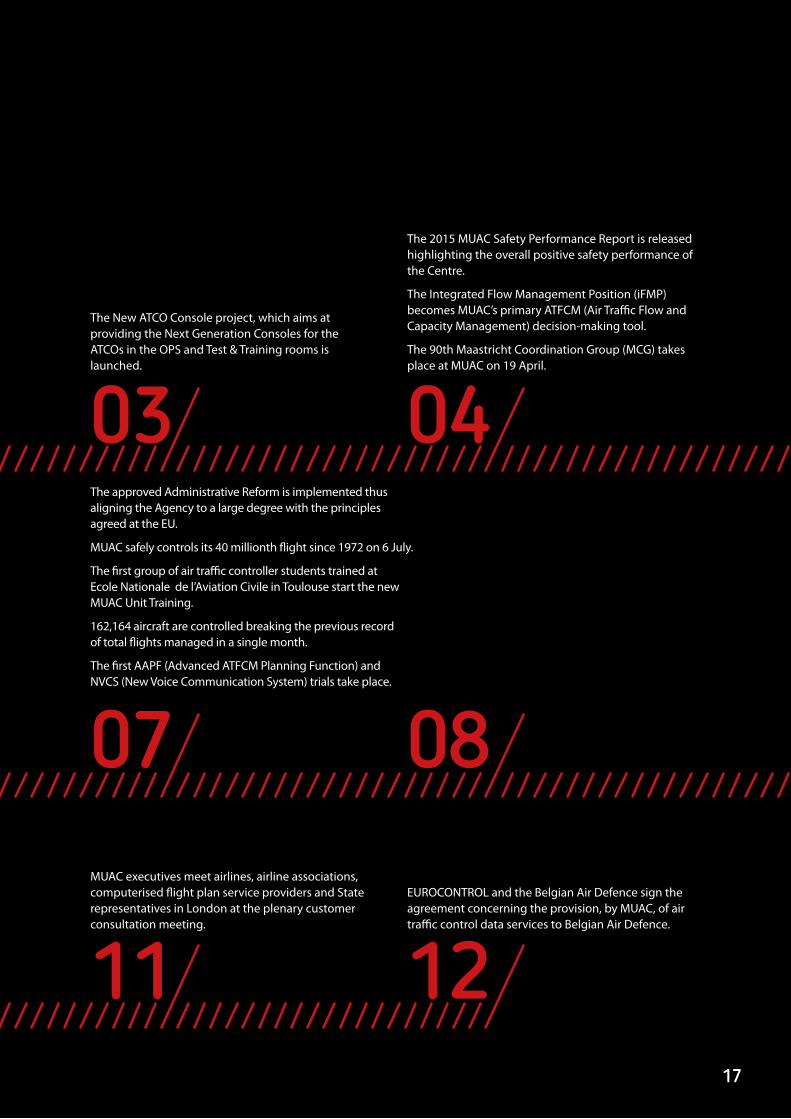
The New ATCO Console project, which aims at providing the Next Generation Consoles for the ATCOs in the OPS and Test & Training rooms is launched.
The approved Administrative Reform is implemented thus aligning the Agency to a large degree with the principles agreed at the EU.
MUAC safely controls its 40 millionth flight since 1972 on 6 July.
The first group of air traffic controller students trained at Ecole Nationale de l’Aviation Civile in Toulouse start the new MUAC Unit Training.
162,164 aircraft are controlled breaking the previous record of total flights managed in a single month.
The first AAPF (Advanced ATFCM Planning Function) and NVCS (New Voice Communication System) trials take place.
MUAC executives meet airlines, airline associations, computerised flight plan service providers and State representatives in London at the plenary customer consultation meeting.
The 2015 MUAC Safety Performance Report is released highlighting the overall positive safety performance of the Centre.
The Integrated Flow Management Position (iFMP) becomes MUAC’s primary ATFCM (Air Traffic Flow and Capacity Management) decision-making tool.
The 90th Maastricht Coordination Group (MCG) takes place at MUAC on 19 April.
EUROCONTROL and the Belgian Air Defence sign the agreement concerning the provision, by MUAC, of air traffic control data services to Belgian Air Defence.
MANAGEMENTREPORT
18
/ / / / / / / / / / / / / / / / / / / / / / / / / / / / / / / / / / / / /
KEY RESULTS
/ / / / / / / / / / / / / / / / / / / / / / / / / / / / / / / / / / / / / / / / / / / / / / / / / / / / / / / / / / / / / / / / / / / / / / / / /
19
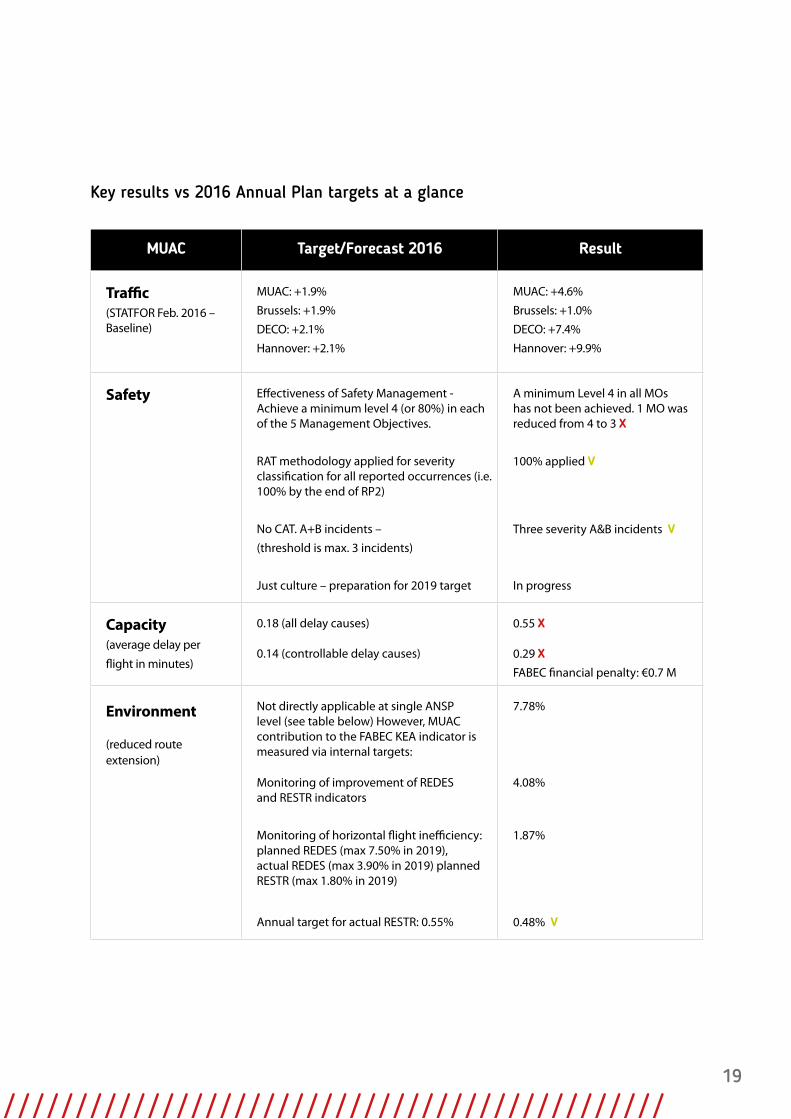
Key results vs 2016 Annual Plan targets at a glance
MUAC Target/Forecast 2016 Result
Traffic
(STATFOR Feb. 2016 – Baseline)
MUAC: +1.9%
Brussels: +1.9%
DECO: +2.1%
Hannover: +2.1%
MUAC: +4.6%
Brussels: +1.0%
DECO: +7.4%
Hannover: +9.9%
Safety Effectiveness of Safety Management - Achieve a minimum level 4 (or 80%) in each of the 5 Management Objectives.
A minimum Level 4 in all MOs has not been achieved. 1 MO was reduced from 4 to 3 X
RAT methodology applied for severity classification for all reported occurrences (i.e. 100% by the end of RP2)
100% applied V
No CAT. A+B incidents –
(threshold is max. 3 incidents)
Three severity A&B incidents V
Just culture – preparation for 2019 target In progress
Capacity (average delay per
flight in minutes)
0.18 (all delay causes) 0.14 (controllable delay causes)
0.55 X 0.29 X
FABEC financial penalty: €0.7 M
Environment
(reduced route extension)
Not directly applicable at single ANSP level (see table below) However, MUAC contribution to the FABEC KEA indicator is measured via internal targets:
7.78%
Monitoring of improvement of REDES and RESTR indicators
4.08%
Monitoring of horizontal flight inefficiency: planned REDES (max 7.50% in 2019), actual REDES (max 3.90% in 2019) planned RESTR (max 1.80% in 2019)
1.87%
Annual target for actual RESTR: 0.55% 0.48% V
/ / / / / / / / / / / / / / / / / / / / / / / / / / / / / / / / / / / / / / / / / / / / / / / / / / / / / / / / / / / / / / / / / / / / / / / / /
20
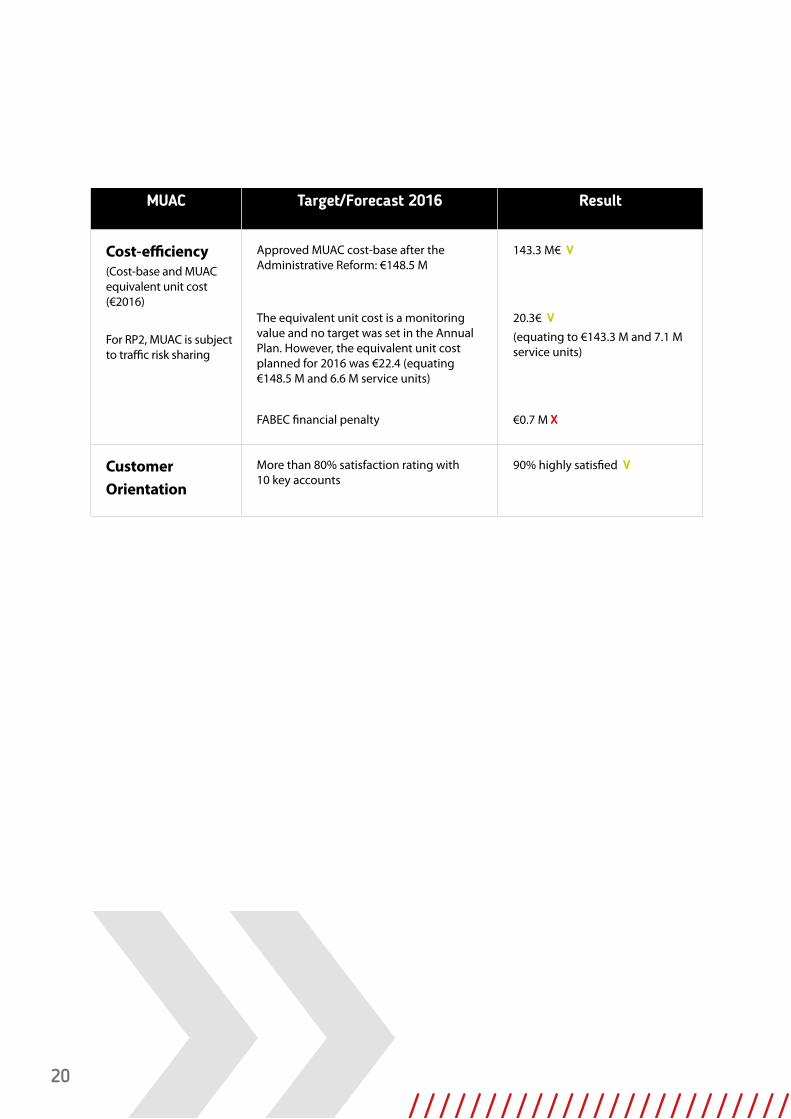
MUAC Target/Forecast 2016 Result
Cost-efficiency
(Cost-base and MUAC equivalent unit cost (€2016)
For RP2, MUAC is subject to traffic risk sharing
Approved MUAC cost-base after the Administrative Reform: €148.5 M
143.3 M€ V
The equivalent unit cost is a monitoring value and no target was set in the Annual Plan. However, the equivalent unit cost planned for 2016 was €22.4 (equating €148.5 M and 6.6 M service units)
20.3€ V
(equating to €143.3 M and 7.1 M service units)
FABEC financial penalty €0.7 M X
CustomerOrientation
More than 80% satisfaction rating with 10 key accounts
90% highly satisfied V
/ / / / / / / / / / / / / / / / / / / / / / / / / / / / / / / / / / / / / / / / / / / / / / / /
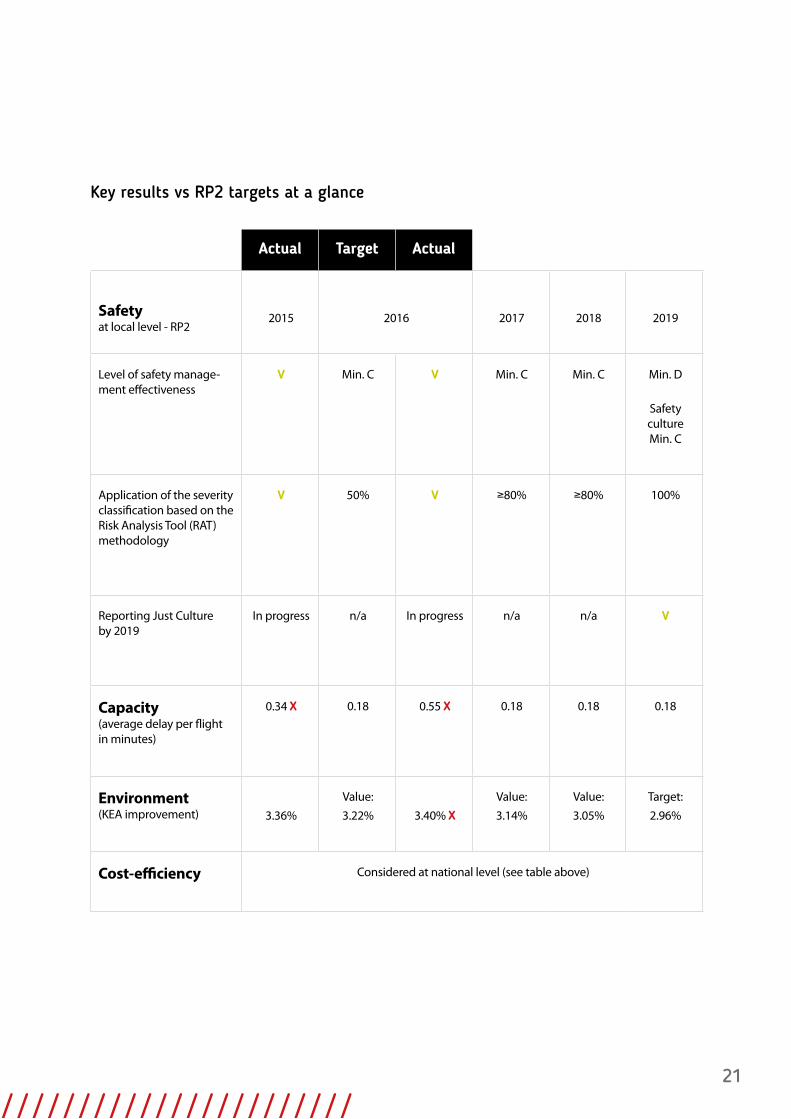
21
Actual Target Actual
Safety at local level - RP2
2015 2016 2017 2018 2019
Level of safety manage-ment effectiveness
V Min. C V Min. C Min. C Min. D
Safety culture Min. C
Application of the severity classification based on the Risk Analysis Tool (RAT) methodology
V 50% V ≥80% ≥80% 100%
Reporting Just Culture by 2019
In progress n/a In progress n/a n/a V
Capacity (average delay per flight in minutes)
0.34 X 0.18 0.55 X 0.18 0.18 0.18
Environment (KEA improvement) 3.36%
Value:
3.22% 3.40% X
Value:
3.14%
Value:
3.05%
Target:
2.96%
Cost-efficiency Considered at national level (see table above)
Key results vs RP2 targets at a glance
/ / / / / / / / / / / / / / / / / / / / / / / / / / / / / / / / / / / / / / / / / / / / / / / /
22
/ / / / / / / / / / / / / / / / / / / / / / / / / / / / / / / / / / / / / / / / / / / / / / /
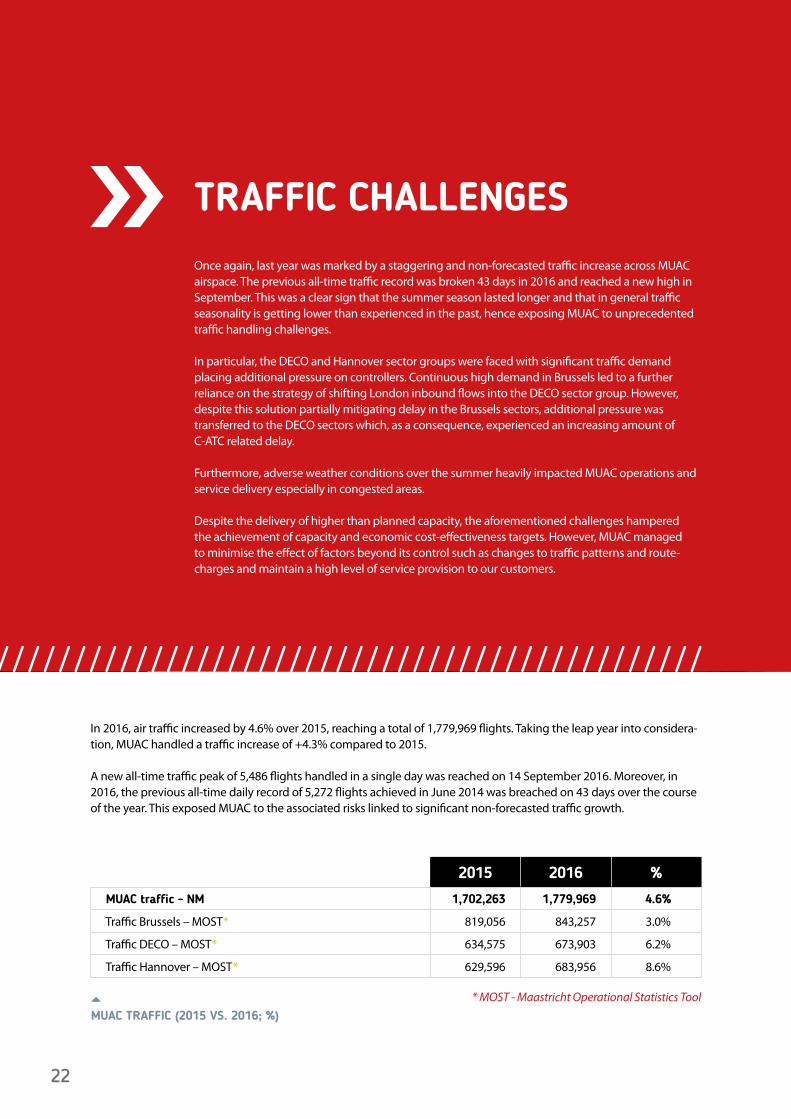
TRAFFIC CHALLENGESOnce again, last year was marked by a staggering and non-forecasted traffic increase across MUAC airspace. The previous all-time traffic record was broken 43 days in 2016 and reached a new high in September. This was a clear sign that the summer season lasted longer and that in general traffic seasonality is getting lower than experienced in the past, hence exposing MUAC to unprecedented traffic handling challenges.
In particular, the DECO and Hannover sector groups were faced with significant traffic demand placing additional pressure on controllers. Continuous high demand in Brussels led to a further reliance on the strategy of shifting London inbound flows into the DECO sector group. However, despite this solution partially mitigating delay in the Brussels sectors, additional pressure was transferred to the DECO sectors which, as a consequence, experienced an increasing amount of C-ATC related delay. Furthermore, adverse weather conditions over the summer heavily impacted MUAC operations and service delivery especially in congested areas.
Despite the delivery of higher than planned capacity, the aforementioned challenges hampered the achievement of capacity and economic cost-effectiveness targets. However, MUAC managed to minimise the effect of factors beyond its control such as changes to traffic patterns and route-charges and maintain a high level of service provision to our customers.
In 2016, air traffic increased by 4.6% over 2015, reaching a total of 1,779,969 flights. Taking the leap year into considera-tion, MUAC handled a traffic increase of +4.3% compared to 2015.
A new all-time traffic peak of 5,486 flights handled in a single day was reached on 14 September 2016. Moreover, in 2016, the previous all-time daily record of 5,272 flights achieved in June 2014 was breached on 43 days over the course of the year. This exposed MUAC to the associated risks linked to significant non-forecasted traffic growth.
2015 2016 %
MUAC traffic - NM 1,702,263 1,779,969 4.6%
Traffic Brussels – MOST* 819,056 843,257 3.0%
Traffic DECO – MOST* 634,575 673,903 6.2%
Traffic Hannover – MOST* 629,596 683,956 8.6%
* MOST - Maastricht Operational Statistics ToolMUAC TRAFFIC (2015 VS. 2016; %)5
23
/ / / / / / / / / / / / / / / / / / / / / / / / / / / / / / / / / / / / / / / / / / / / / / /
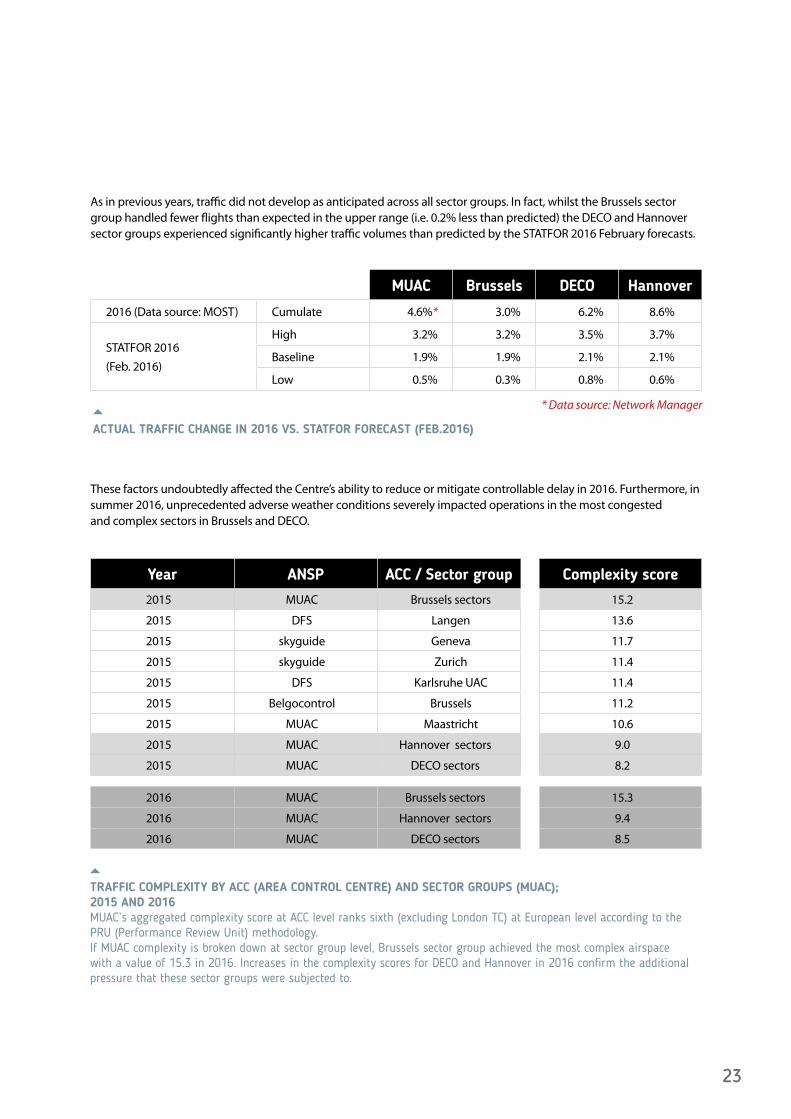
As in previous years, traffic did not develop as anticipated across all sector groups. In fact, whilst the Brussels sector group handled fewer flights than expected in the upper range (i.e. 0.2% less than predicted) the DECO and Hannover sector groups experienced significantly higher traffic volumes than predicted by the STATFOR 2016 February forecasts.
MUAC Brussels DECO Hannover
2016 (Data source: MOST) Cumulate 4.6%* 3.0% 6.2% 8.6%
STATFOR 2016
(Feb. 2016)
High 3.2% 3.2% 3.5% 3.7%
Baseline 1.9% 1.9% 2.1% 2.1%
Low 0.5% 0.3% 0.8% 0.6%
These factors undoubtedly affected the Centre’s ability to reduce or mitigate controllable delay in 2016. Furthermore, in summer 2016, unprecedented adverse weather conditions severely impacted operations in the most congested and complex sectors in Brussels and DECO.
Year ANSP ACC / Sector group Complexity score
2015 MUAC Brussels sectors 15.2
2015 DFS Langen 13.6
2015 skyguide Geneva 11.7
2015 skyguide Zurich 11.4
2015 DFS Karlsruhe UAC 11.4
2015 Belgocontrol Brussels 11.2
2015 MUAC Maastricht 10.6
2015 MUAC Hannover sectors 9.0
2015 MUAC DECO sectors 8.2
2016 MUAC Brussels sectors 15.3
2016 MUAC Hannover sectors 9.4
2016 MUAC DECO sectors 8.5
* Data source: Network Manager
TRAFFIC COMPLEXITY BY ACC (AREA CONTROL CENTRE) AND SECTOR GROUPS (MUAC); 2015 AND 2016MUAC’s aggregated complexity score at ACC level ranks sixth (excluding London TC) at European level according to the PRU (Performance Review Unit) methodology. If MUAC complexity is broken down at sector group level, Brussels sector group achieved the most complex airspace with a value of 15.3 in 2016. Increases in the complexity scores for DECO and Hannover in 2016 confirm the additional pressure that these sector groups were subjected to.
ACTUAL TRAFFIC CHANGE IN 2016 VS. STATFOR FORECAST (FEB.2016)
5
5
24
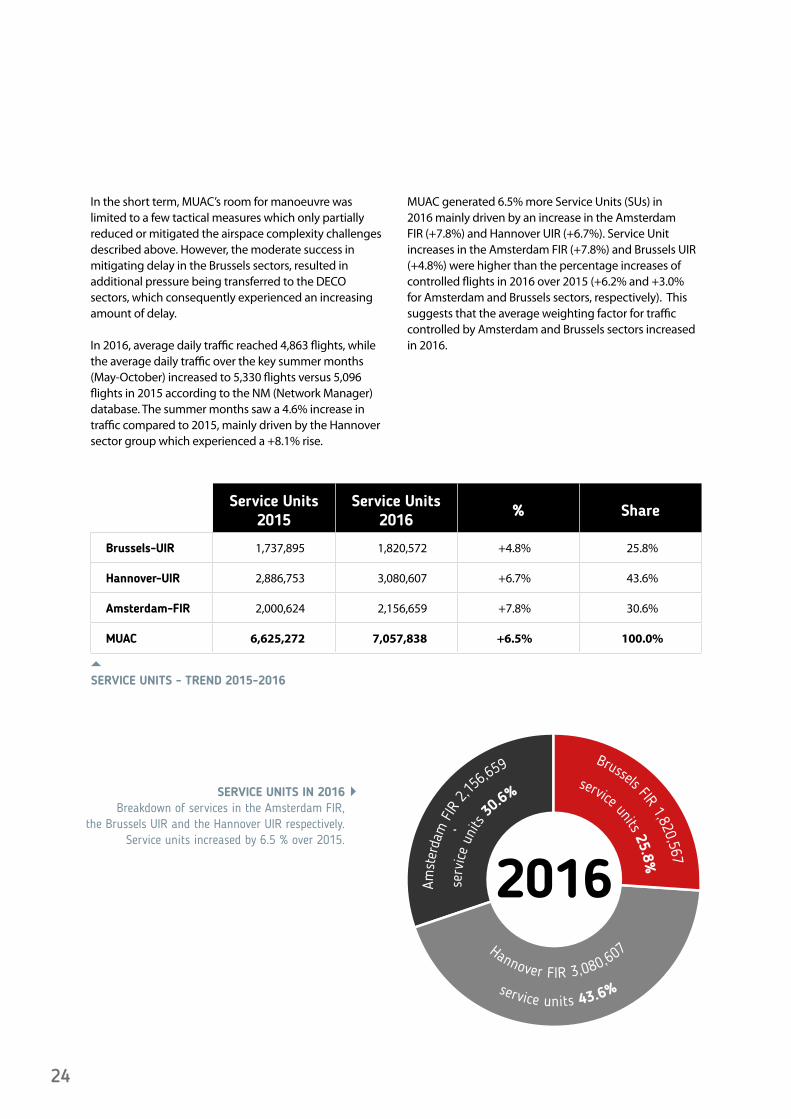
In the short term, MUAC’s room for manoeuvre was limited to a few tactical measures which only partially reduced or mitigated the airspace complexity challenges described above. However, the moderate success in mitigating delay in the Brussels sectors, resulted in additional pressure being transferred to the DECO sectors, which consequently experienced an increasing amount of delay.
In 2016, average daily traffic reached 4,863 flights, while the average daily traffic over the key summer months (May-October) increased to 5,330 flights versus 5,096 flights in 2015 according to the NM (Network Manager) database. The summer months saw a 4.6% increase in traffic compared to 2015, mainly driven by the Hannover sector group which experienced a +8.1% rise.
MUAC generated 6.5% more Service Units (SUs) in 2016 mainly driven by an increase in the Amsterdam FIR (+7.8%) and Hannover UIR (+6.7%). Service Unit increases in the Amsterdam FIR (+7.8%) and Brussels UIR (+4.8%) were higher than the percentage increases of controlled flights in 2016 over 2015 (+6.2% and +3.0% for Amsterdam and Brussels sectors, respectively). This suggests that the average weighting factor for traffic controlled by Amsterdam and Brussels sectors increased in 2016.
Service Units 2015
Service Units 2016
% Share
Brussels-UIR 1,737,895 1,820,572 +4.8% 25.8%
Hannover-UIR 2,886,753 3,080,607 +6.7% 43.6%
Amsterdam-FIR 2,000,624 2,156,659 +7.8% 30.6%
MUAC 6,625,272 7,057,838 +6.5% 100.0%
2016
service units 43.6%
Hannover FIR 3,080,607
Amst
erda
m F
IR 2
,156,6
59
serv
ice
units
3
0.6%
Brussels FIR 1,820,567
service units 25.8%
SERVICE UNITS IN 2016Breakdown of services in the Amsterdam FIR,
the Brussels UIR and the Hannover UIR respectively. Service units increased by 6.5 % over 2015.
SERVICE UNITS - TREND 2015-20165
25
SAFETY
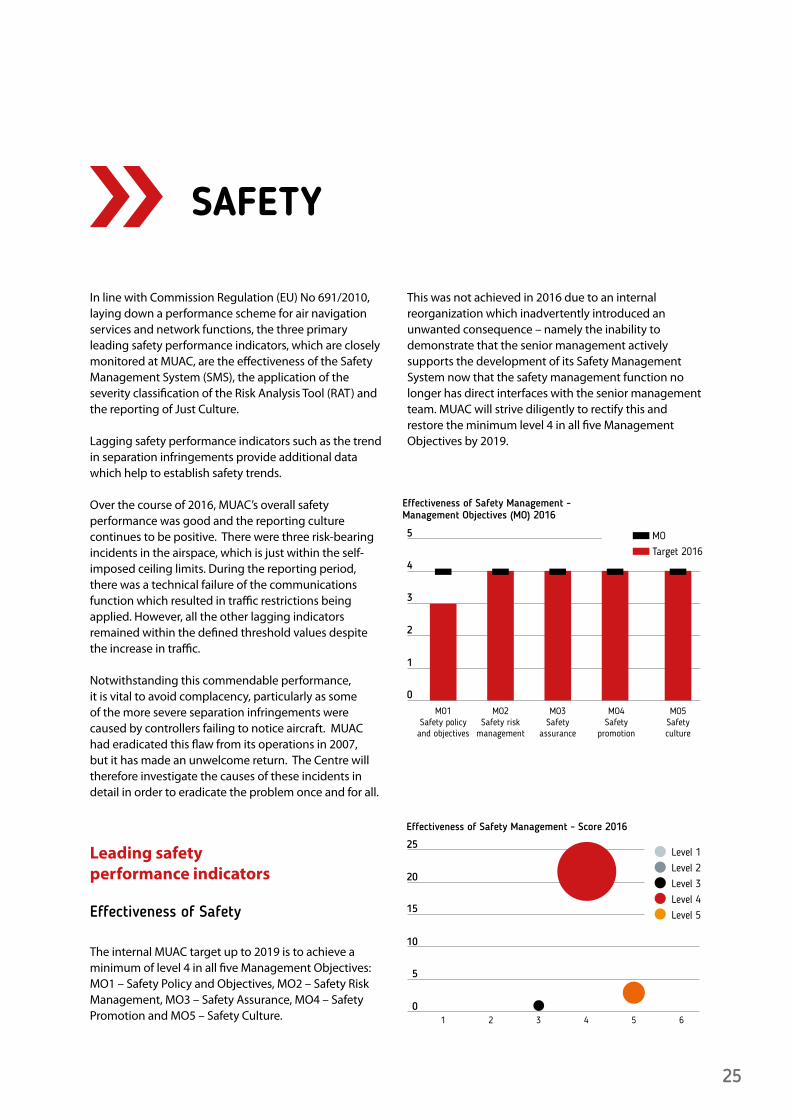
In line with Commission Regulation (EU) No 691/2010, laying down a performance scheme for air navigation services and network functions, the three primary leading safety performance indicators, which are closely monitored at MUAC, are the effectiveness of the Safety Management System (SMS), the application of the severity classification of the Risk Analysis Tool (RAT) and the reporting of Just Culture.
Lagging safety performance indicators such as the trend in separation infringements provide additional data which help to establish safety trends.
Over the course of 2016, MUAC’s overall safety performance was good and the reporting culture continues to be positive. There were three risk-bearing incidents in the airspace, which is just within the self-imposed ceiling limits. During the reporting period, there was a technical failure of the communications function which resulted in traffic restrictions being applied. However, all the other lagging indicators remained within the defined threshold values despite the increase in traffic.
Notwithstanding this commendable performance, it is vital to avoid complacency, particularly as some of the more severe separation infringements were caused by controllers failing to notice aircraft. MUAC had eradicated this flaw from its operations in 2007, but it has made an unwelcome return. The Centre will therefore investigate the causes of these incidents in detail in order to eradicate the problem once and for all.
Leading safety performance indicators
Effectiveness of Safety
The internal MUAC target up to 2019 is to achieve a minimum of level 4 in all five Management Objectives: MO1 – Safety Policy and Objectives, MO2 – Safety Risk Management, MO3 – Safety Assurance, MO4 – Safety Promotion and MO5 – Safety Culture.
This was not achieved in 2016 due to an internal reorganization which inadvertently introduced an unwanted consequence – namely the inability to demonstrate that the senior management actively supports the development of its Safety Management System now that the safety management function no longer has direct interfaces with the senior management team. MUAC will strive diligently to rectify this and restore the minimum level 4 in all five Management Objectives by 2019.
MOTarget 2016
0
1
2
3
4
5
Effectiveness of Safety Management - Management Objectives (MO) 2016
MO1 Safety policy and objectives
MO2Safety risk
management
MO3Safety
assurance
MO4 Safety
promotion
MO5Safety culture
Level 1Level 2Level 3Level 4Level 5
0
5
10
15
20
25
Effectiveness of Safety Management - Score 2016
1 2 3 4 5 6
26
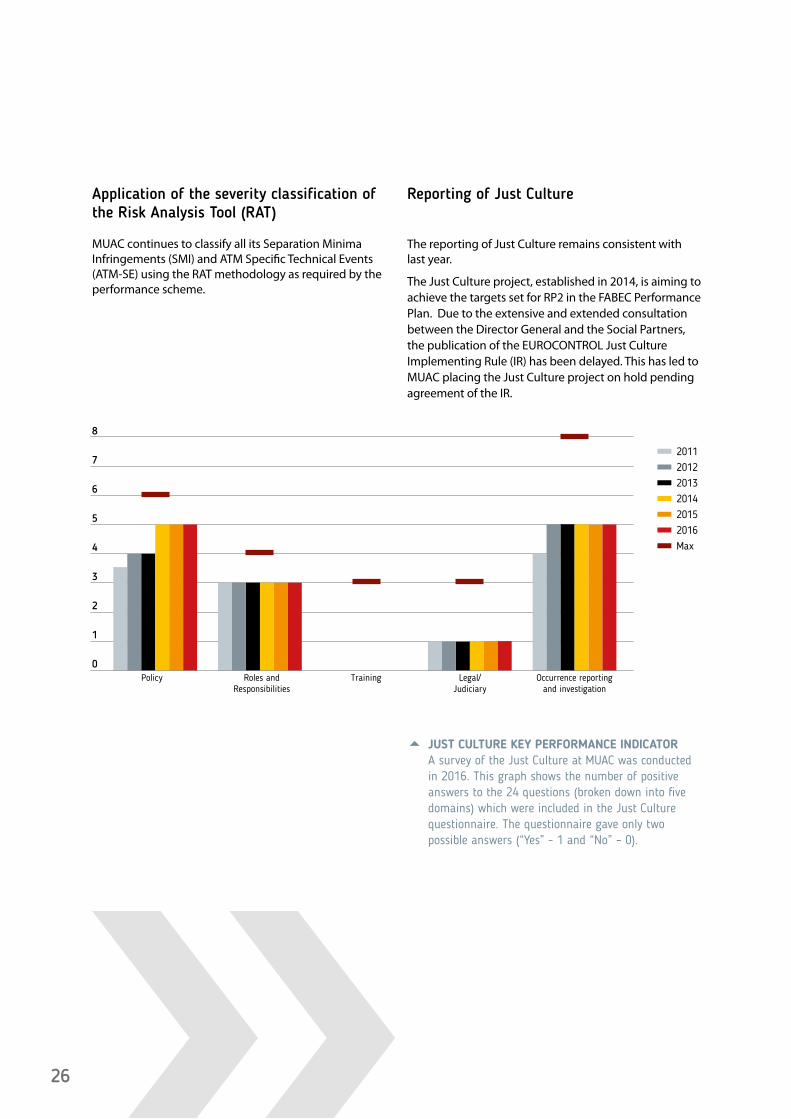
Reporting of Just Culture
The reporting of Just Culture remains consistent with last year.
The Just Culture project, established in 2014, is aiming to achieve the targets set for RP2 in the FABEC Performance Plan. Due to the extensive and extended consultation between the Director General and the Social Partners, the publication of the EUROCONTROL Just Culture Implementing Rule (IR) has been delayed. This has led to MUAC placing the Just Culture project on hold pending agreement of the IR.
Application of the severity classification of the Risk Analysis Tool (RAT)
MUAC continues to classify all its Separation Minima Infringements (SMI) and ATM Specific Technical Events (ATM-SE) using the RAT methodology as required by the performance scheme.
201120122013201420152016Max
0
1
2
3
4
5
6
7
8
Policy Roles and Responsibilities
Training Legal/Judiciary
Occurrence reporting and investigation
JUST CULTURE KEY PERFORMANCE INDICATORA survey of the Just Culture at MUAC was conducted in 2016. This graph shows the number of positive answers to the 24 questions (broken down into five domains) which were included in the Just Culture questionnaire. The questionnaire gave only two possible answers (“Yes” - 1 and “No” – 0).
5
27
Lagging safety performance indicators
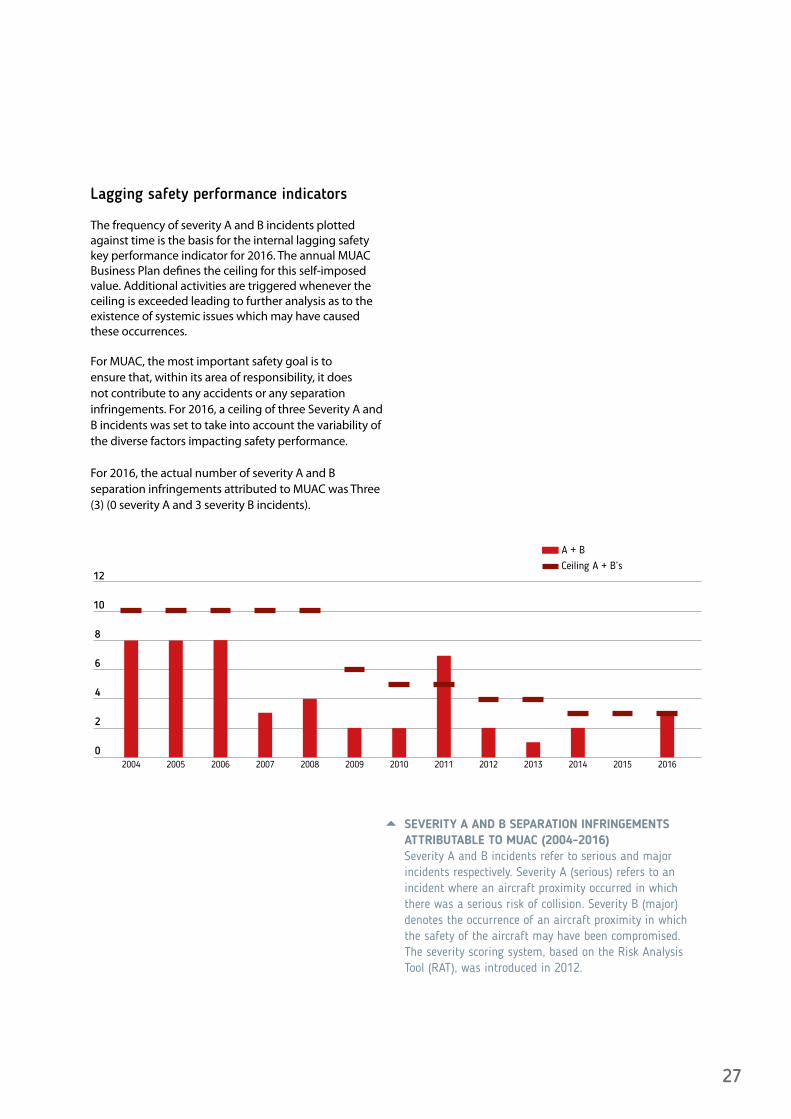
The frequency of severity A and B incidents plotted against time is the basis for the internal lagging safety key performance indicator for 2016. The annual MUAC Business Plan defines the ceiling for this self-imposed value. Additional activities are triggered whenever the ceiling is exceeded leading to further analysis as to the existence of systemic issues which may have caused these occurrences.
For MUAC, the most important safety goal is to ensure that, within its area of responsibility, it does not contribute to any accidents or any separation infringements. For 2016, a ceiling of three Severity A and B incidents was set to take into account the variability of the diverse factors impacting safety performance.
For 2016, the actual number of severity A and B separation infringements attributed to MUAC was Three (3) (0 severity A and 3 severity B incidents).
0
2
4
6
8
10
12
2004 2005 2006 2007 2008 2009 2010 2011 2012 2013 2014 2015 2016
SEVERITY A AND B SEPARATION INFRINGEMENTS ATTRIBUTABLE TO MUAC (2004-2016) Severity A and B incidents refer to serious and major incidents respectively. Severity A (serious) refers to an incident where an aircraft proximity occurred in which there was a serious risk of collision. Severity B (major) denotes the occurrence of an aircraft proximity in which the safety of the aircraft may have been compromised. The severity scoring system, based on the Risk Analysis Tool (RAT), was introduced in 2012.
5
A + BCeiling A + B’s
28
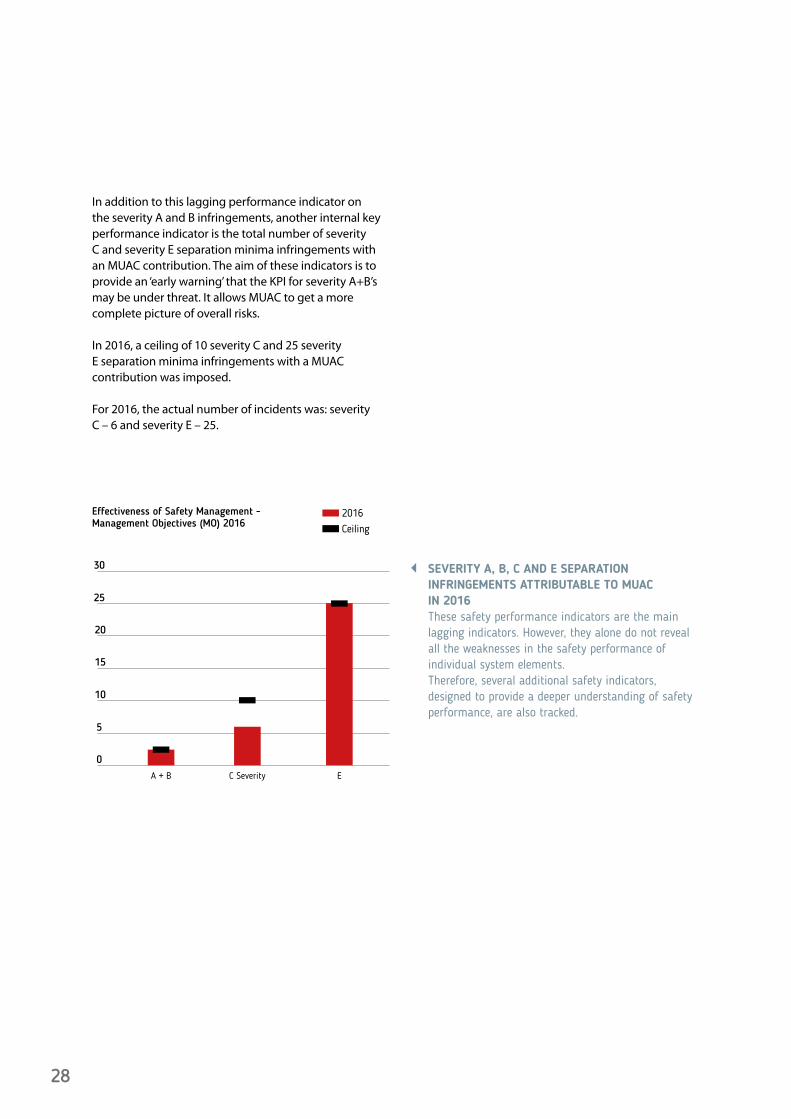
In addition to this lagging performance indicator on the severity A and B infringements, another internal key performance indicator is the total number of severity C and severity E separation minima infringements with an MUAC contribution. The aim of these indicators is to provide an ‘early warning’ that the KPI for severity A+B’s may be under threat. It allows MUAC to get a more complete picture of overall risks.
In 2016, a ceiling of 10 severity C and 25 severity E separation minima infringements with a MUAC contribution was imposed.
For 2016, the actual number of incidents was: severity C – 6 and severity E – 25.
2016Ceiling
0
5
10
15
20
25
30
Effectiveness of Safety Management - Management Objectives (MO) 2016
A + B C Severity E
SEVERITY A, B, C AND E SEPARATION INFRINGEMENTS ATTRIBUTABLE TO MUAC IN 2016These safety performance indicators are the main lagging indicators. However, they alone do not reveal all the weaknesses in the safety performance of individual system elements.Therefore, several additional safety indicators, designed to provide a deeper understanding of safety performance, are also tracked.
29
CAPACITY
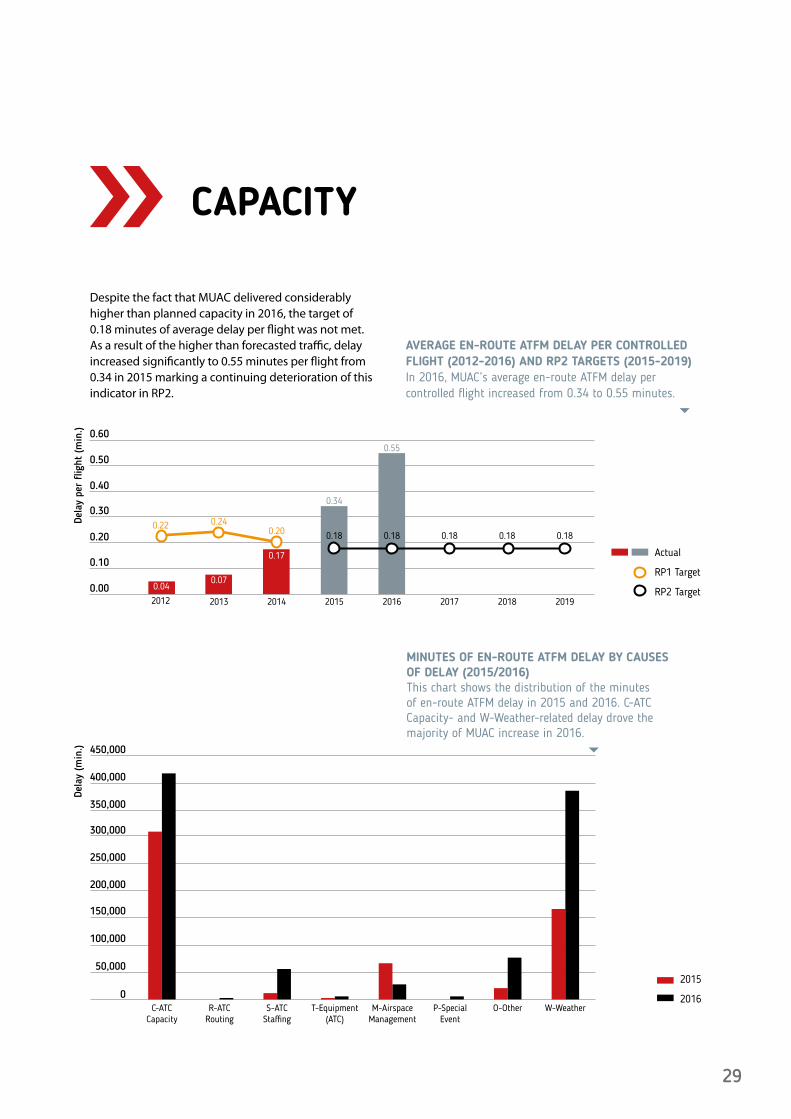
Despite the fact that MUAC delivered considerably higher than planned capacity in 2016, the target of 0.18 minutes of average delay per flight was not met. As a result of the higher than forecasted traffic, delay increased significantly to 0.55 minutes per flight from 0.34 in 2015 marking a continuing deterioration of this indicator in RP2.
AVERAGE EN-ROUTE ATFM DELAY PER CONTROLLED FLIGHT (2012-2016) AND RP2 TARGETS (2015-2019)In 2016, MUAC’s average en-route ATFM delay per controlled flight increased from 0.34 to 0.55 minutes.
0.00
0.10
0.20
0.30
0.40
0.50
0.60
2012
0.22
2013
0.24
2014
0.20
2015
0.34
2016
0.55
2017 2018 2019
Actual
RP1 Target
RP2 Target
5
0.18 0.18 0.18 0.18 0.18
0.040.07
0.17
0
50,000
100,000
150,000
200,000
250,000
300,000
350,000
400,000
450,000
Dela
y (m
in.)
Dela
y pe
r fli
ght
(min
.)
2015
2016
MINUTES OF EN-ROUTE ATFM DELAY BY CAUSES OF DELAY (2015/2016) This chart shows the distribution of the minutes of en-route ATFM delay in 2015 and 2016. C-ATC Capacity- and W-Weather-related delay drove the majority of MUAC increase in 2016.
5
C-ATC Capacity
S-ATC Staffing
R-ATC Routing
T-Equipment (ATC)
M-Airspace Management
O-OtherP-Special Event
W-Weather
30
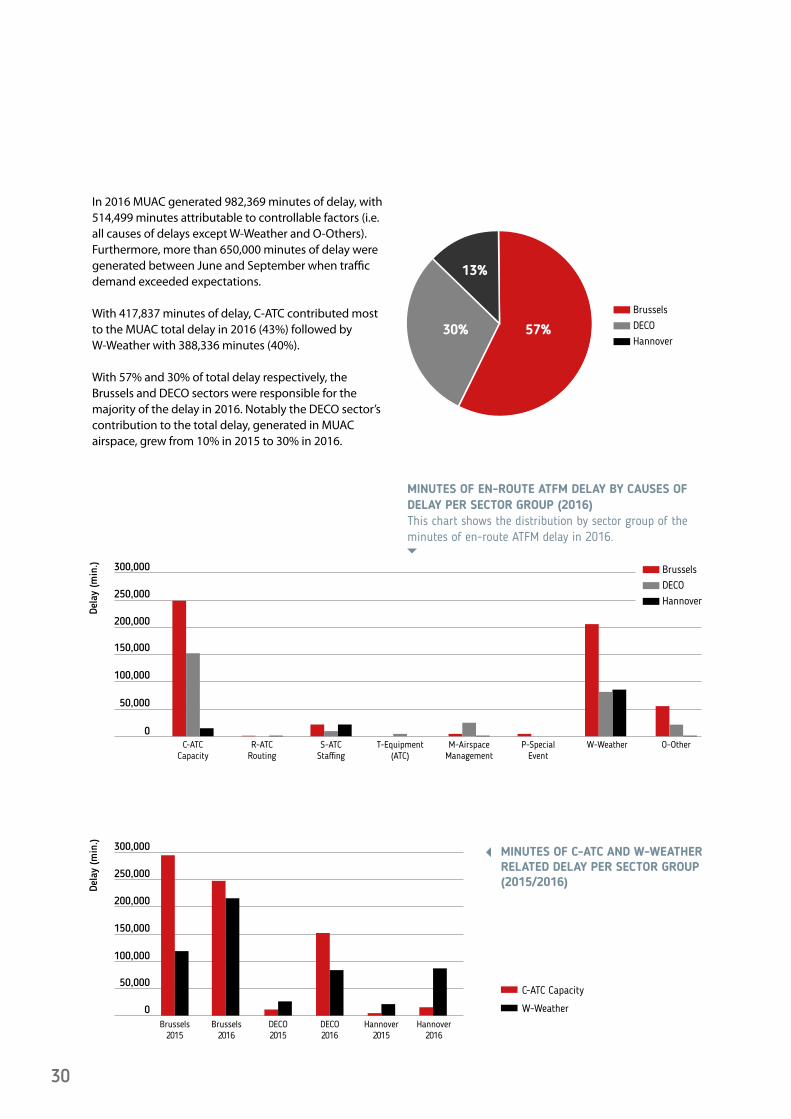
In 2016 MUAC generated 982,369 minutes of delay, with 514,499 minutes attributable to controllable factors (i.e. all causes of delays except W-Weather and O-Others). Furthermore, more than 650,000 minutes of delay were generated between June and September when traffic demand exceeded expectations.
With 417,837 minutes of delay, C-ATC contributed most to the MUAC total delay in 2016 (43%) followed by W-Weather with 388,336 minutes (40%).
With 57% and 30% of total delay respectively, the Brussels and DECO sectors were responsible for the majority of the delay in 2016. Notably the DECO sector’s contribution to the total delay, generated in MUAC airspace, grew from 10% in 2015 to 30% in 2016.
57%
13%
30%
BrusselsDECOHannover
BrusselsDECOHannover
0
50,000
100,000
150,000
200,000
250,000
300,000
Dela
y (m
in.)
Dela
y (m
in.)
C-ATC Capacity
S-ATC Staffing
R-ATC Routing
T-Equipment (ATC)
M-Airspace Management
P-Special Event
W-Weather O-Other
MINUTES OF C-ATC AND W-WEATHER RELATED DELAY PER SECTOR GROUP (2015/2016)
0
50,000
100,000
150,000
200,000
250,000
300,000
C-ATC Capacity
W-WeatherBrussels
2015Brussels
2016DECO2015
DECO2016
Hannover 2015
Hannover 2016
MINUTES OF EN-ROUTE ATFM DELAY BY CAUSES OF DELAY PER SECTOR GROUP (2016)This chart shows the distribution by sector group of the minutes of en-route ATFM delay in 2016.5
31
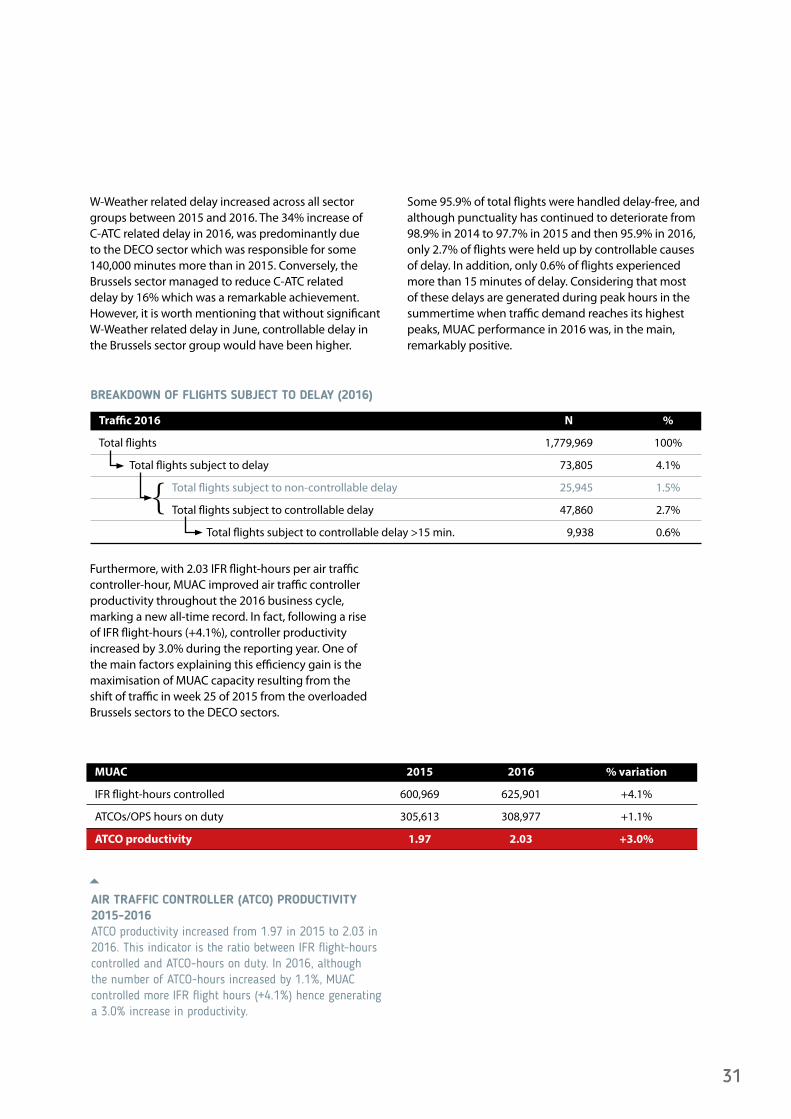
W-Weather related delay increased across all sector groups between 2015 and 2016. The 34% increase of C-ATC related delay in 2016, was predominantly due to the DECO sector which was responsible for some 140,000 minutes more than in 2015. Conversely, the Brussels sector managed to reduce C-ATC related delay by 16% which was a remarkable achievement. However, it is worth mentioning that without significant W-Weather related delay in June, controllable delay in the Brussels sector group would have been higher.
Furthermore, with 2.03 IFR flight-hours per air traffic controller-hour, MUAC improved air traffic controller productivity throughout the 2016 business cycle, marking a new all-time record. In fact, following a rise of IFR flight-hours (+4.1%), controller productivity increased by 3.0% during the reporting year. One of the main factors explaining this efficiency gain is the maximisation of MUAC capacity resulting from the shift of traffic in week 25 of 2015 from the overloaded Brussels sectors to the DECO sectors.
Some 95.9% of total flights were handled delay-free, and although punctuality has continued to deteriorate from 98.9% in 2014 to 97.7% in 2015 and then 95.9% in 2016, only 2.7% of flights were held up by controllable causes of delay. In addition, only 0.6% of flights experienced more than 15 minutes of delay. Considering that most of these delays are generated during peak hours in the summertime when traffic demand reaches its highest peaks, MUAC performance in 2016 was, in the main, remarkably positive.
BREAKDOWN OF FLIGHTS SUBJECT TO DELAY (2016)
AIR TRAFFIC CONTROLLER (ATCO) PRODUCTIVITY 2015-2016ATCO productivity increased from 1.97 in 2015 to 2.03 in 2016. This indicator is the ratio between IFR flight-hours controlled and ATCO-hours on duty. In 2016, although the number of ATCO-hours increased by 1.1%, MUAC controlled more IFR flight hours (+4.1%) hence generating a 3.0% increase in productivity.
2016
625,901
308,977
2.03
2015
600,969
305,613
1.97
MUAC
IFR flight-hours controlled
ATCOs/OPS hours on duty
ATCO productivity
% variation
+4.1%
+1.1%
+3.0%
5
N
1,779,969
73,805
25,945
47,860
9,938
Traffic 2016
Total flights
Total flights subject to delay
Total flights subject to non-controllable delay
Total flights subject to controllable delay
Total flights subject to controllable delay >15 min.
%
100%
4.1%
1.5%
2.7%
0.6%
{
32
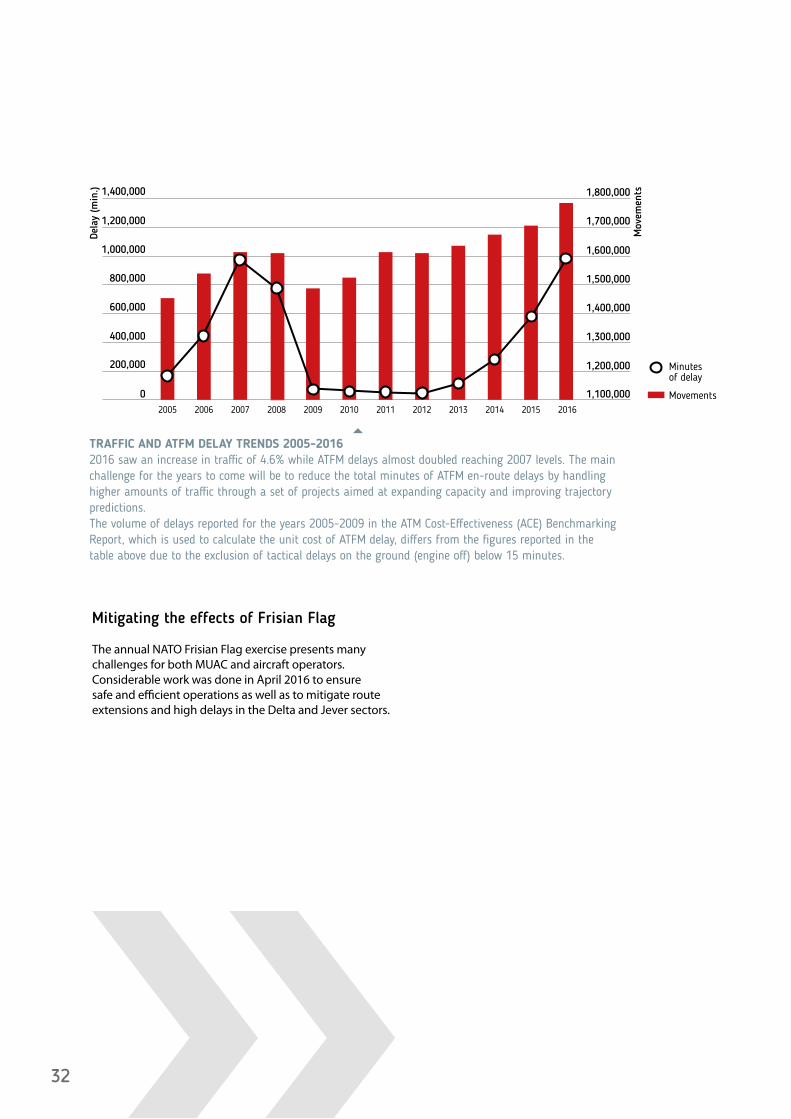
TRAFFIC AND ATFM DELAY TRENDS 2005-20162016 saw an increase in traffic of 4.6% while ATFM delays almost doubled reaching 2007 levels. The main challenge for the years to come will be to reduce the total minutes of ATFM en-route delays by handling higher amounts of traffic through a set of projects aimed at expanding capacity and improving trajectory predictions.The volume of delays reported for the years 2005-2009 in the ATM Cost-Effectiveness (ACE) Benchmarking Report, which is used to calculate the unit cost of ATFM delay, differs from the figures reported in the table above due to the exclusion of tactical delays on the ground (engine off) below 15 minutes.
5
0
200,000
1,100,000
400,000
1,200,000
600,000
1,300,000
800,000
1,400,000
1,000,000
1,500,000
1,200,000
1,600,000
1,400,000
1,700,000
1,800,000
Minutes of delay
Movements20122011201020092008200720062005 2013 2014 2015 2016
Mitigating the effects of Frisian Flag
The annual NATO Frisian Flag exercise presents many challenges for both MUAC and aircraft operators. Considerable work was done in April 2016 to ensure safe and efficient operations as well as to mitigate route extensions and high delays in the Delta and Jever sectors.
Dela
y (m
in.)
Mov
emen
ts
33
ENVIRONMENT
Reducing route extension
During the reporting period, flight efficiency benefits continued to be offered to airspace users at both the strategic and tactical levels in order to meet environ-mental targets.
At the strategic level, the direct routes in MUAC airspace as well as direct cross-border routes offered airspace users the potential to increase the efficiency of their operations by implementing additional DCTs (direct routings) whenever it possible.
Data analysis for 2016 reveals that average Free Route Airspace Maastricht (FRAM) usage exceeded 65% and that the total distance saved by operators amounted to 989,100 NM.
Average FRAM usage for main customers (with more than 25,000 flights a year) reached 78%. Three operators (Air France 63%, Brussels Airlines 69% and Transavia 69%) did not exceed the target of 70% of FRAM usage.
The RESTR indicator shows that no additional efficiencies were achieved for the filed flight plans in 2016. Indeed, the inefficiency value remained stable at 1.87%. For the actual flown routes, MUAC met the target despite a slight deterioration of the horizontal flight inefficiency indicator, RESTR, from 0.44% in 2015 to 0.48% in 2016.
Following an increase up to 7.82% in 2015, in 2016 the cross-border flight inefficiency indicator, REDES, for filed flight plans showed a slight decrease to 7.78%. On the other hand, actual trajectory inefficiency followed an opposite trend - slightly increasing from 4.00% in 2015 to 4.08% in 2016. This is likely to be the effect of route choices made by the airspace users in their search for the optimum/cheapest routes rather than the shortest routes.
At the tactical level the allocation of direct routes in 2016 generated a total route extension improvement of 3.7% calculated as the difference between planned and actual route extension. This resulted in a total flight distance reduction of 7,616,000 NM (or 4.7 NM on average per flight), saving more than 45,000 t of fuel and reducing CO2 emissions by 152,000 t.
Energy-saving initiatives andsustainable building elements
In compliance with the environmental legislation in force in the Netherlands, the local authorities are provided with an evaluation of MUAC’s annual energy consumption. During 2016, the replacement of computer hardware and radiators in the buildings generated an estimated electricity consumption reduction of 680,000 KWh/year as well as a CO2 reduction of over 472 t per year.
34
COST-EFFICIENCY
Increase in economic cost despite performance-driven budget
In 2016, the cost-base amounted to €143.3 M. In real terms, costs were up by 5.7% compared to 2015 mainly driven by higher staff costs (i.e. +€4.7 M) and non-staff operating costs (i.e. +€3.7 M). Despite an expected increase due to the natural career progression of MUAC staff, and even in the context of a lower than planned inflation rate, salary costs overshot the agreed amount by €2.3 M. The main reason for this is the complexity of the salary adjustment method which takes into account not only inflationary changes, but also other factors such as the evolution of the purchasing power of national officials’ salaries and fluctuations in the cost of living in Brussels and Luxembourg. This complex mechanism means that it is difficult to predict salary costs over the short, medium and long term.
Nevertheless, MUAC managed to stay well within its agreed 2016 cost-base of €148.5 M thereby saving €5.3 M, mostly in operating costs. Other costs (i.e. €1.4 M) were saved by postponing or suspending projects, and to a lesser extent, by delays in the procurement process.
Following a 4.1% increase in IFR flight-hours controlled, MUAC scored a total financial cost per IFR flight-hour of €229, a value which is €3 higher than the one in 2015 (€226 in €2016).
The total economic cost per IFR flight-hour (also referred to as ‘unit economic cost’) is used as the main indicator of overall performance as it incorporates both cost of delay and the financial cost of ATM service provision. In this context, it is worth noting that the cost of ATFM delay was updated by the University of Westminster in 2015. Based on this update, the estimated average European ATFM delay costs were adjusted from €88 per minute in 2014 to €100 per minute in 2015. Given the low inflation rate for the EU in 2016, the value of €100 per minute remained unchanged for the year 2016.
Despite a low increase in unit financial costs, ATFM delay costs increased considerably thus bringing the overall MUAC economic cost up to €386 per IFR flight-hour in 2016 – an increase of 19.5%.
This reflects and confirms that an increasing difficulty to manage uneven traffic flows among the three sector groups might lead to a severe deterioration in service quality over SES RP2. The need for up-to-date and accurate traffic forecasts, together with a highly efficient allocation of resources and investments, will therefore be essential for maintaining high standards in this extremely challenging and constantly changing environment.
The key performance indicator for cost-effectiveness, defined in the SES II Performance Regulation, is the Determined Unit Cost. Since this is calculated on the basis of consolidated costs at national level, the concept of an MUAC equivalent unit cost was introduced as a performance indicator taking the specific MUAC service provision costs into account. ‘Equivalent’ indicates that the calculation does not take the full cost of MUAC service provision into account. For example, EUROCONTROL support costs and the cost of using CNS infrastructure (which is made available free of charge by the Four States) are not included. The target was more than achieved with an actual cost per service unit of €20.3 significantly under the €22.4 ceiling. This welcome undershoot was accomplished thanks to the combined impact of a reduction in the MUAC cost-base and a significant increase in the number of service units.
35
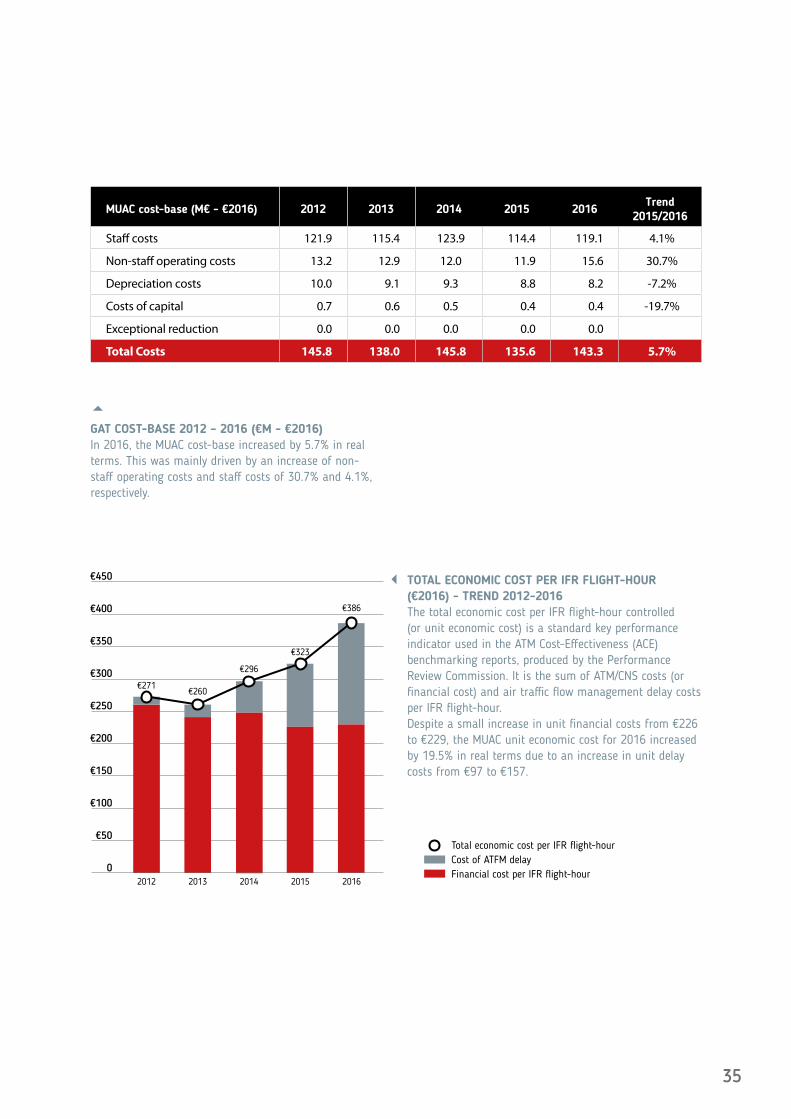
MUAC cost-base (M€ - €2016) 2012 2013 2014 2015 2016Trend
2015/2016
Staff costs 121.9 115.4 123.9 114.4 119.1 4.1%
Non-staff operating costs 13.2 12.9 12.0 11.9 15.6 30.7%
Depreciation costs 10.0 9.1 9.3 8.8 8.2 -7.2%
Costs of capital 0.7 0.6 0.5 0.4 0.4 -19.7%
Exceptional reduction 0.0 0.0 0.0 0.0 0.0
Total Costs 145.8 138.0 145.8 135.6 143.3 5.7%
Total economic cost per IFR flight-hourCost of ATFM delayFinancial cost per IFR flight-hour
TOTAL ECONOMIC COST PER IFR FLIGHT-HOUR (€2016) - TREND 2012-2016The total economic cost per IFR flight-hour controlled (or unit economic cost) is a standard key performance indicator used in the ATM Cost-Effectiveness (ACE) benchmarking reports, produced by the Performance Review Commission. It is the sum of ATM/CNS costs (or financial cost) and air traffic flow management delay costs per IFR flight-hour. Despite a small increase in unit financial costs from €226 to €229, the MUAC unit economic cost for 2016 increased by 19.5% in real terms due to an increase in unit delay costs from €97 to €157.
0
€50
€100
€150
€200
€250
€300
€350
€400
€450
2012
€271
2013
€260
2014
€296
2015
€323
2016
€386
GAT COST-BASE 2012 – 2016 (€M - €2016)In 2016, the MUAC cost-base increased by 5.7% in real terms. This was mainly driven by an increase of non-staff operating costs and staff costs of 30.7% and 4.1%, respectively.
5
36
ACE 2015 report again confirms MUAC’s strong performance
In May 2017, the ATM Cost-Effectiveness (ACE) 2015 Benchmarking Report was released, once again confirming MUAC’s ranking among the top-performing ANSPs in Europe. The economic gate-to-gate cost-effectiveness indicator for MUAC amounted to €323 (€2015) per IFR flight-hour while the European average stood at €501 per composite flight-hour. The economic cost-effectiveness indicator in Europe ranged from €870 to €191. It should be noted that the ACE Benchmarking Report is published in 2015 values while this Annual Report is expressed in 2016 values, taking into account an inflation rate of 0.1%.
Enterprise risk management
During 2016, MUAC has taken the opportunity to further improve its risk management processes. Risk-based thinking is an important component of the new ISO 9001 standard, and preparations to comply with the new requirements were launched in Q4 2016.
The risk management process facilitates risk identification and monitoring at business process and domain levels as well as within SQS (safety, quality and security) standards. Risks, which are assessed to impact the achievement of MUAC’s business objectives, are registered and maintained in MUAC’s corporate risk register. Each identified risk requires a mitigating action reducing the probability of the risk materialising and/or its impact.
MUAC’s risk register is updated every quarter based on assessments by the responsible risk owners and ultimately decided by the MUAC Board. Risks which are escalated to agency level are shared and discussed with the Agency Risk Management Group on a quarterly basis, consolidated in the Agency Risk Register and tabled for discussion at subsequent Agency Board Meetings. Additionally, MUAC’s high level risks were a recurring item for discussion within the Maastricht Coordination Group (MCG).
/ / / / / / / / / / / / / / / / / / / / / / / / / / / / / / / / /
37
Customer relationship management
Customer consultation
In 2016, business information continued to be shared on a regular basis with aircraft operators via various reporting and communication tools as well as visits to/from specific operators.
The November plenary customer consultation meeting saw a record attendance, with various stakeholders participating in the meeting: American Airlines, British Airways, Brussels Airlines, Delta Airlines, Easyjet, European Regions Airline Association (ERA), Jeppessen, Jet2, LIDO, Lufthansa, Monarch Airlines, the Netherlands Ministry of Infrastructure and Environment, the Network Manager Aircraft Operators Liaison, Ryanair, Sabre, Swiss Airlines, Thomas Cook Airlines, United Airlines and the United States Air Force. Alongside a panel discussion and a group exchange on strategic issues, the attendees also discussed an update on MUAC’s 2016 performance, short-term ATFCM measures evolution and reporting, the civil-military integration of the Hannover Upper Information Region and the upper airspace of the Amsterdam Flight Information Region as well as Free Route Airspace and airspace design projects.
In parallel, one-to-one meetings with airline operators were also held, supported by bespoke reports on MUAC’s overall performance and how specific programmes can benefit the airlines’ commercial interests. These bilateral meetings helped to enhance service delivery and efficiency. In particular, they contributed to increased take-up of the direct route network saving airlines several millions of euros. Aircraft operators have also started to work more closely with airspace network experts to achieve a better, more efficient and customer-driven route network.
The collaborative eurSky MUAC customer interface continued to be a major B2B communications and efficiency enabler. The platform allows secure two-way communications and gives access to a range of reports.
The above-mentioned communication initiatives helped to gauge customer satisfaction and identify specific follow-up actions aimed at fully embracing customer needs.
CUSTOMER ORIENTATION
Over the reporting period, dealing with higher-than-predicted traffic growth remained the main focus, alongside the provision of excellent customer service. Business relationships were further reinforced with bespoke and plenary customer consultation meetings. Key account customers’ satisfaction was ensured through a multi-level engagement programme with each company – at daily operations, managerial and political levels.
/ / / / / / / / / / / / / / / / / / / / / / / / / / / / / / / / /
38
Managing ATM services
The ATM Services Delivery process is continuously assessed and refined to maintain excellent service quality, increase controller productivity and enhance safety. Despite a challenging environment, with traffic growth exceeding the forecasts, MUAC continued to provide safe and sustainable ATM services.
As well as technical developments, the external contingency topic was discussed in the MCG with the result that there are three ongoing work packages relating to short-, medium- and long-term contingency options. The result should further secure the stability and long-term availability of MUAC services.
In 2016, MUAC saw a 4.6% increase in traffic. This was well above the STATFOR traffic forecast, released in February 2016, which predicted a highest case increase of +3.2%.
The creation of the 2016 game plan, the operational introduction of iFMP and the standardisation of pre-tactical working practises enabled the Centre to manage the large increase in traffic. However, the combination of a number of days with adverse weather and extremely high peak traffic demand meant that it was not possible to achieve the delay target.
Nevertheless, the fact that MUAC scored a new all-time high traffic peak on 14 September 2016 with 5,486 flights, and that 43 days in 2016 broke the previous all-time record of 5,272 flights (achieved in June 2014) demonstrates that MUAC is continuing its efforts to expand its capacity to handle the persistent traffic growth.
/ / / / / / / / / / / / / / / / / / / / / / / / / / / / / / / / / / / / / / / / / / / / / / / / / / / / / /
/ / / / / / / / / / / / / / / / / / / / / / / / / / / / / / / / /
39
PERFORMANCE INTERDEPENDENCIES, REVENUES AND UNIT BUSINESS VALUE
Managing competing Key Performance Areas (KPAs) under a customer orientation perspective
MUAC is subject to a set of regulatory targets set by the European Commission through its Performance Review Body (PRB). These are grouped into four Key Perfor-mance Areas (KPAs): Safety, Capacity, Environment and Cost-Efficiency. The main objective of the Performance Regulation is “to increase the economic, financial and environmental performance of the provisions of the Air Navigation Services in Europe” keeping safety standards and procedures constantly at their highest levels.
The KPAs are strongly interrelated and consequently exert an influence on each other. For instance, any new project increasing capacity will also impact on the cost-efficiency area. On the other hand, aggressive cost reduction measures might result in a critical loss of capacity.
The existence of direct links between performance areas is intellectually accepted by the aviation community although the establishment of a standard formula which describes these quantitative interdependencies is challenging.
However, for each KPA it is feasible to estimate approximate costs.
Costs attributable to main KPAs
ANSPs are accountable to their stakeholders for the provision of air traffic control services in the most efficient way and in accordance with the highest safety standards. In this context, MUAC’s motto is “Service first, safety always”. However, safety is not easily quantifiable and any attempt to economically measure it presents tangible difficulties and uncertainties.
Moreover, cost-efficiency refers to direct costs borne by the Four States in running ATM activities at MUAC while environmental and delay costs are directly borne by airlines.
Environmental costs refer to the extra cost of the jet fuel burned to fly the route extension between the actual flown route and the theoretical shortest distance (great circle) between departure and arrival points. The cost of extra time to fly longer routes is not considered in this analysis due to the relative small size of MUAC airspace. A sharp decrease in jet fuel price in 2015 reduced the overall economic impact of the route extension in 2015 and 2016. Costs of delay are a linear function of the average cost per minute of delay and the total minutes of ATFM en-route delays generated.
/ / / / / / / / / / / / / / / / / / / / / / / / / / / / / / / / / / / / / / / / / / / / / / / / / / / / / /
/ / / / / / / / / / / / / / / / / / / / / / / / / / / / / / / / /
40
0
20
40
60
80
100
120
140
160
180
200
220
240
260
280
2012 2013 2014 2015 2016
Environment (route extension)DelayMUAC Costbase
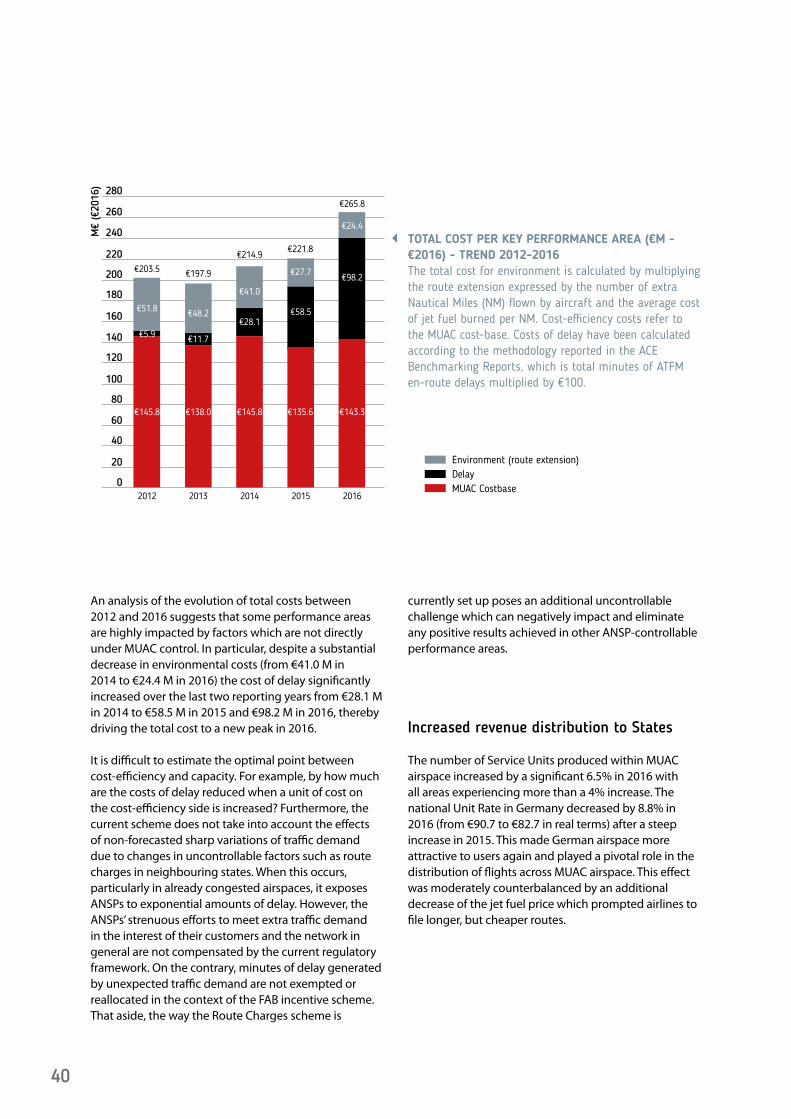
TOTAL COST PER KEY PERFORMANCE AREA (€M - €2016) - TREND 2012-2016The total cost for environment is calculated by multiplying the route extension expressed by the number of extra Nautical Miles (NM) flown by aircraft and the average cost of jet fuel burned per NM. Cost-efficiency costs refer to the MUAC cost-base. Costs of delay have been calculated according to the methodology reported in the ACE Benchmarking Reports, which is total minutes of ATFM en-route delays multiplied by €100.
M€
(€20
16)
€145.8
€203.5
€5.9
€51.8
€138.0
€197.9
€11.7
€48.2
€145.8
€214.9
€135.6
€221.8
€143.3
€265.8
€28.1
€41.0
€58.5
€27.7 €98.2
€24.4
An analysis of the evolution of total costs between 2012 and 2016 suggests that some performance areas are highly impacted by factors which are not directly under MUAC control. In particular, despite a substantial decrease in environmental costs (from €41.0 M in 2014 to €24.4 M in 2016) the cost of delay significantly increased over the last two reporting years from €28.1 M in 2014 to €58.5 M in 2015 and €98.2 M in 2016, thereby driving the total cost to a new peak in 2016.
It is difficult to estimate the optimal point between cost-efficiency and capacity. For example, by how much are the costs of delay reduced when a unit of cost on the cost-efficiency side is increased? Furthermore, the current scheme does not take into account the effects of non-forecasted sharp variations of traffic demand due to changes in uncontrollable factors such as route charges in neighbouring states. When this occurs, particularly in already congested airspaces, it exposes ANSPs to exponential amounts of delay. However, the ANSPs’ strenuous efforts to meet extra traffic demand in the interest of their customers and the network in general are not compensated by the current regulatory framework. On the contrary, minutes of delay generated by unexpected traffic demand are not exempted or reallocated in the context of the FAB incentive scheme. That aside, the way the Route Charges scheme is
currently set up poses an additional uncontrollable challenge which can negatively impact and eliminate any positive results achieved in other ANSP-controllable performance areas.
Increased revenue distribution to States The number of Service Units produced within MUAC airspace increased by a significant 6.5% in 2016 with all areas experiencing more than a 4% increase. The national Unit Rate in Germany decreased by 8.8% in 2016 (from €90.7 to €82.7 in real terms) after a steep increase in 2015. This made German airspace more attractive to users again and played a pivotal role in the distribution of flights across MUAC airspace. This effect was moderately counterbalanced by an additional decrease of the jet fuel price which prompted airlines to file longer, but cheaper routes.
41
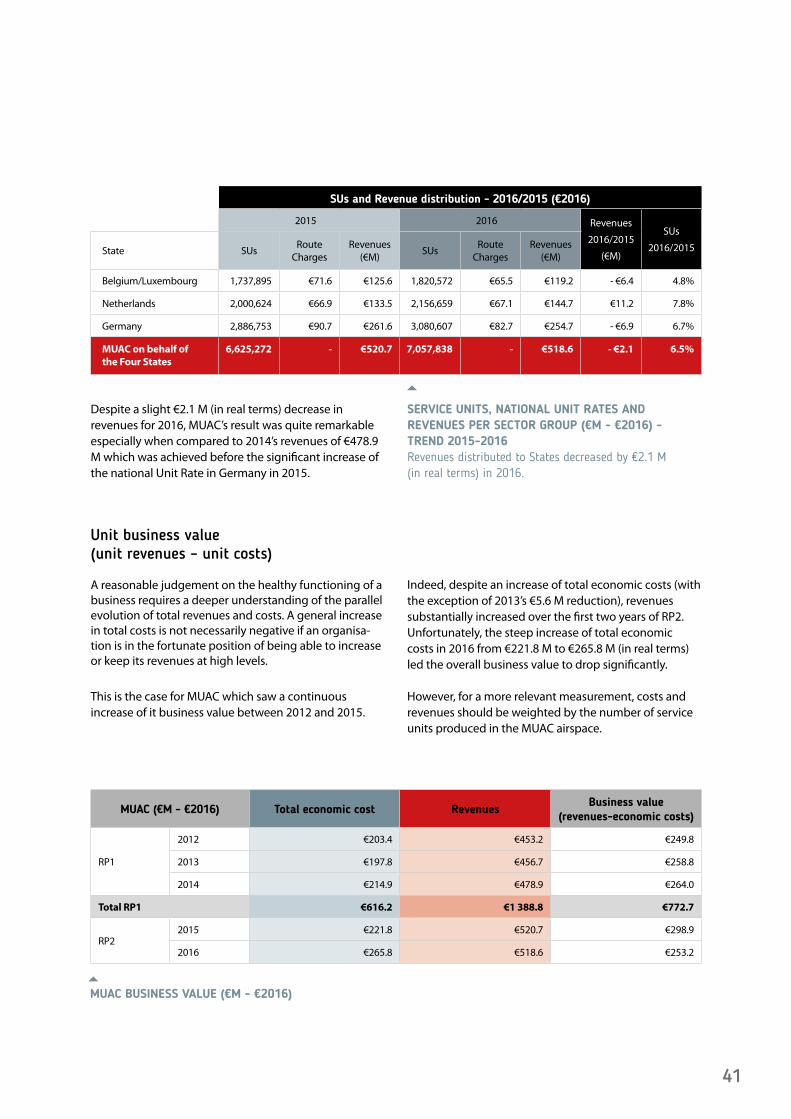
Despite a slight €2.1 M (in real terms) decrease in revenues for 2016, MUAC’s result was quite remarkable especially when compared to 2014’s revenues of €478.9 M which was achieved before the significant increase of the national Unit Rate in Germany in 2015.
Unit business value (unit revenues – unit costs) A reasonable judgement on the healthy functioning of a business requires a deeper understanding of the parallel evolution of total revenues and costs. A general increase in total costs is not necessarily negative if an organisa-tion is in the fortunate position of being able to increase or keep its revenues at high levels.
This is the case for MUAC which saw a continuous increase of it business value between 2012 and 2015.
Indeed, despite an increase of total economic costs (with the exception of 2013’s €5.6 M reduction), revenues substantially increased over the first two years of RP2. Unfortunately, the steep increase of total economic costs in 2016 from €221.8 M to €265.8 M (in real terms) led the overall business value to drop significantly.
However, for a more relevant measurement, costs and revenues should be weighted by the number of service units produced in the MUAC airspace.
SUs and Revenue distribution - 2016/2015 (€2016)
2015 2016 Revenues
2016/2015
(€M)
SUs
2016/2015State SUsRoute
ChargesRevenues
(€M)SUs
Route Charges
Revenues (€M)
Belgium/Luxembourg 1,737,895 €71.6 €125.6 1,820,572 €65.5 €119.2 - €6.4 4.8%
Netherlands 2,000,624 €66.9 €133.5 2,156,659 €67.1 €144.7 €11.2 7.8%
Germany 2,886,753 €90.7 €261.6 3,080,607 €82.7 €254.7 - €6.9 6.7%
MUAC on behalf of the Four States
6,625,272 - €520.7 7,057,838 - €518.6 - €2.1 6.5%
SERVICE UNITS, NATIONAL UNIT RATES AND REVENUES PER SECTOR GROUP (€M - €2016) - TREND 2015-2016Revenues distributed to States decreased by €2.1 M (in real terms) in 2016.
MUAC BUSINESS VALUE (€M - €2016)
5
5
MUAC (€M - €2016) Total economic cost RevenuesBusiness value
(revenues-economic costs)
RP1
2012 €203.4 €453.2 €249.8
2013 €197.8 €456.7 €258.8
2014 €214.9 €478.9 €264.0
Total RP1 €616.2 €1 388.8 €772.7
RP22015 €221.8 €520.7 €298.9
2016 €265.8 €518.6 €253.2
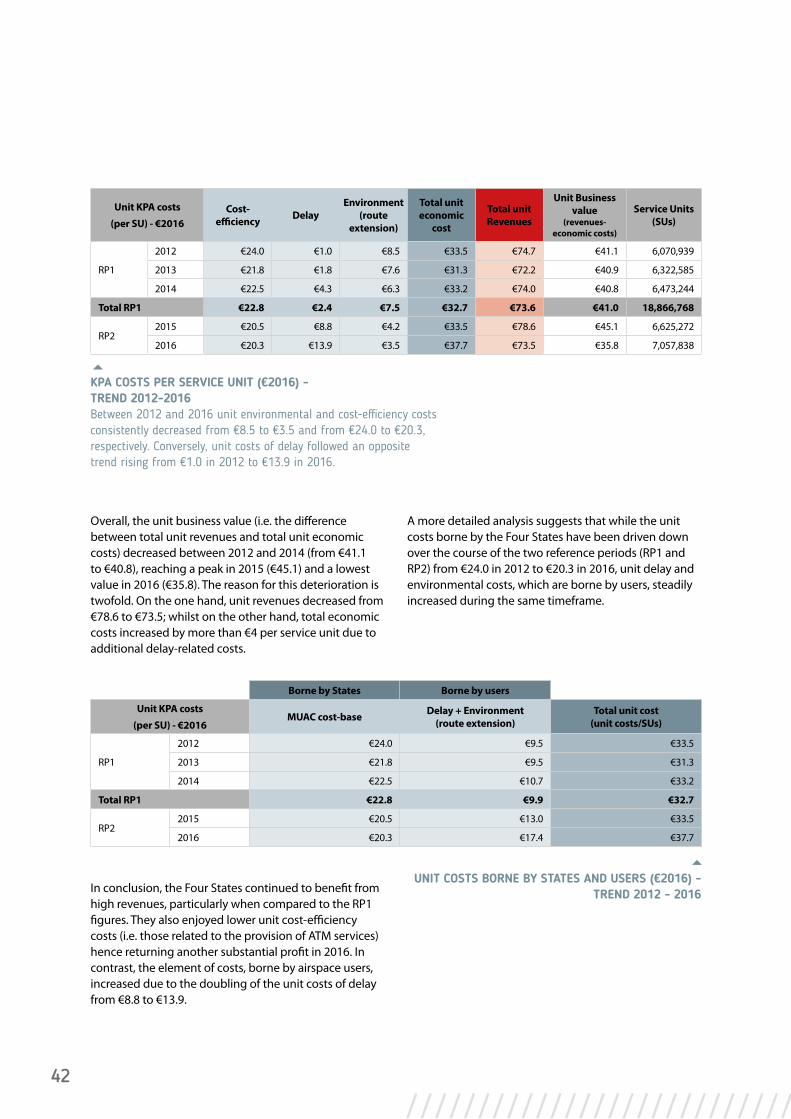
42
Overall, the unit business value (i.e. the difference between total unit revenues and total unit economic costs) decreased between 2012 and 2014 (from €41.1 to €40.8), reaching a peak in 2015 (€45.1) and a lowest value in 2016 (€35.8). The reason for this deterioration is twofold. On the one hand, unit revenues decreased from €78.6 to €73.5; whilst on the other hand, total economic costs increased by more than €4 per service unit due to additional delay-related costs.
In conclusion, the Four States continued to benefit from high revenues, particularly when compared to the RP1 figures. They also enjoyed lower unit cost-efficiency costs (i.e. those related to the provision of ATM services) hence returning another substantial profit in 2016. In contrast, the element of costs, borne by airspace users, increased due to the doubling of the unit costs of delay from €8.8 to €13.9.
A more detailed analysis suggests that while the unit costs borne by the Four States have been driven down over the course of the two reference periods (RP1 and RP2) from €24.0 in 2012 to €20.3 in 2016, unit delay and environmental costs, which are borne by users, steadily increased during the same timeframe.
Unit KPA costs
(per SU) - €2016Cost-
efficiency DelayEnvironment
(route extension)
Total unit economic
cost
Total unit Revenues
Unit Business value
(revenues- economic costs)
Service Units (SUs)
RP1
2012 €24.0 €1.0 €8.5 €33.5 €74.7 €41.1 6,070,939
2013 €21.8 €1.8 €7.6 €31.3 €72.2 €40.9 6,322,585
2014 €22.5 €4.3 €6.3 €33.2 €74.0 €40.8 6,473,244
Total RP1 €22.8 €2.4 €7.5 €32.7 €73.6 €41.0 18,866,768
RP22015 €20.5 €8.8 €4.2 €33.5 €78.6 €45.1 6,625,272
2016 €20.3 €13.9 €3.5 €37.7 €73.5 €35.8 7,057,838
KPA COSTS PER SERVICE UNIT (€2016) - TREND 2012-2016Between 2012 and 2016 unit environmental and cost-efficiency costs consistently decreased from €8.5 to €3.5 and from €24.0 to €20.3, respectively. Conversely, unit costs of delay followed an opposite trend rising from €1.0 in 2012 to €13.9 in 2016.
5
Borne by States Borne by users
Unit KPA costs
(per SU) - €2016MUAC cost-base Delay + Environment
(route extension)Total unit cost
(unit costs/SUs)
RP1
2012 €24.0 €9.5 €33.5
2013 €21.8 €9.5 €31.3
2014 €22.5 €10.7 €33.2
Total RP1 €22.8 €9.9 €32.7
RP22015 €20.5 €13.0 €33.5
2016 €20.3 €17.4 €37.7
UNIT COSTS BORNE BY STATES AND USERS (€2016) -TREND 2012 - 2016
/ / / / / / / / / / / / / / / / / / / / / / / / / / / / / / / / / / / / / / / / / / / / / / / / / / / / / /
5
43
MUAC’S CONTRIBUTION TO FABEC PERFORMANCE
The FABEC performance plan was drawn up to cover SES Performance Plan Reference Period 2 (RP2 - 2015 to 2019). It incorporates the key performance areas of safety, environment and capacity for the whole region while military mission effectiveness and cost-efficiency targets are addressed at national level. MUAC cost-efficiency targets were agreed by the Four States. In 2016, air traffic volumes in FABEC airspace increased by 3.2 percent from 5,612,328 flights in 2015 to 5,791,229 flights in 2016. And, for the first time, all FABEC control centres recorded a traffic increase. That said, there are still some significant variations between control centres and individual sectors. Notably, 2016 FABEC IFR traffic was above the STATFOR low-growth scenario published in February 2015 and used as a reference for the FABEC performance plan.
As in the previous year, FABEC members missed the en-route ATFM delay per flight target. Indeed, the 2016 en-route ATFM delay per flight (all causes) was 1.07 minutes per flight compared with 0.70 minutes per flight in 2015. Not only was the target of 0.49 minutes of ATFM delay per flight not met, in general, the overall operational performance significantly deteriorated. These values incorporate delay related to all possible causes including weather and any other reasons which are outside the ANSP’s control. In the summer, the operational performance for the core FABEC areas (including MUAC airspace) was particularly affected by adverse weather conditions which contributed significantly to an overall
deterioration of the average delay per flight value. Consequently, MUAC overshot its target of 0.18 minutes of delay per controlled flight with a final score of 0.55 minutes.
The en-route ATFM delay caused by ANSPs (also known as ‘controllable delay’) came in at 0.67 minutes per flight. This represents another year of deterioration in performance compared with the previous year’s 0.48 minutes per flight, and exceeds the target value of 0.38 minutes per flight. The main reasons for this development were local issues such as capacity, staffing shortages, the introduction of new technical systems, significant growth in core airports and unpredicted traffic flow changes.
/ / / / / / / / / / / / / / / / / / / / / / / / / / / / / / / / / / / / / / / / / / / / / / / / / / / / / /
/ / / / / / / / / / / / / / / / / / / / / / / / /
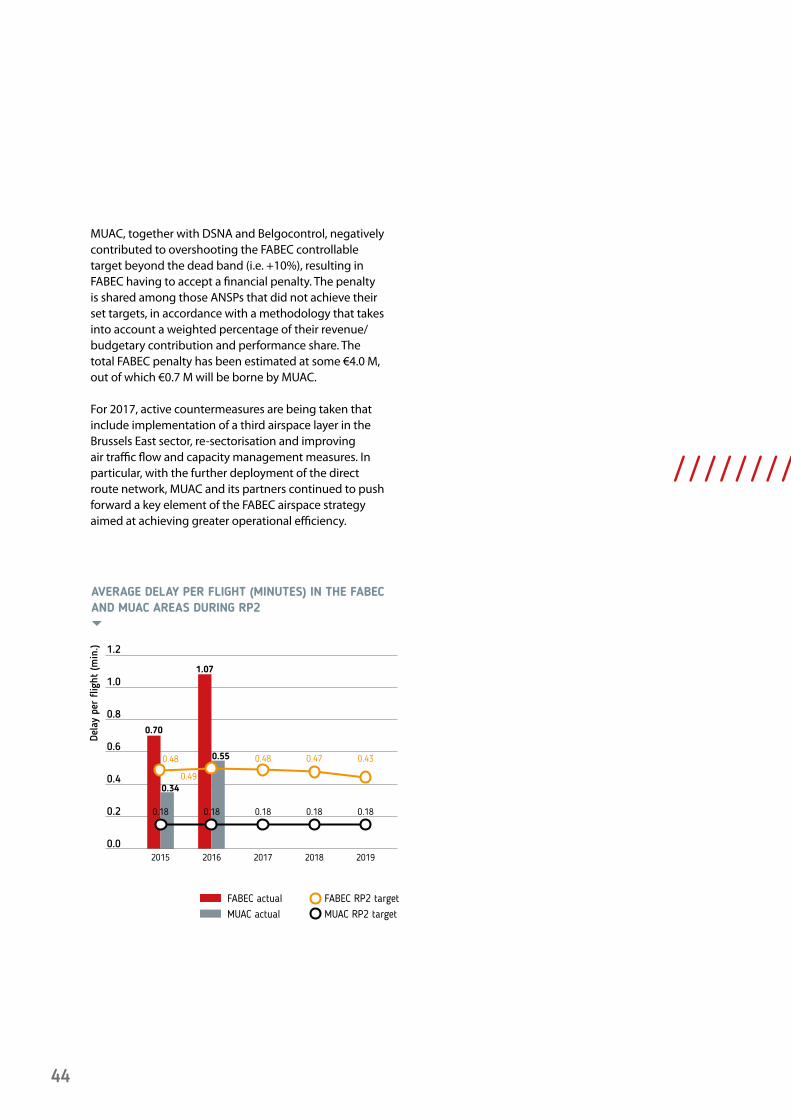
44
MUAC, together with DSNA and Belgocontrol, negatively contributed to overshooting the FABEC controllable target beyond the dead band (i.e. +10%), resulting in FABEC having to accept a financial penalty. The penalty is shared among those ANSPs that did not achieve their set targets, in accordance with a methodology that takes into account a weighted percentage of their revenue/budgetary contribution and performance share. The total FABEC penalty has been estimated at some €4.0 M, out of which €0.7 M will be borne by MUAC.
For 2017, active countermeasures are being taken that include implementation of a third airspace layer in the Brussels East sector, re-sectorisation and improving air traffic flow and capacity management measures. In particular, with the further deployment of the direct route network, MUAC and its partners continued to push forward a key element of the FABEC airspace strategy aimed at achieving greater operational efficiency.
AVERAGE DELAY PER FLIGHT (MINUTES) IN THE FABEC AND MUAC AREAS DURING RP2
0.0
0.2
0.4
0.6
0.8
1.0
1.2
2015
0.70
0.34
1.07
0.55
2016 2017
0.18
0.48
2018
0.18
0.47
2019
0.18
0.43
FABEC actualMUAC actual
FABEC RP2 targetMUAC RP2 target
0.180.18
0.48
0.49
Dela
y pe
r fli
ght
(min
.)
/ / / / / / / / / / / / / / / / / / / / / / / / / / / / / / / / /
5
45
Free Route Airspace Maastricht (FRAM2)
Just as aircraft manufacturers and operators are making considerable advances in reducing their environmental impact, the air traffic management sector is also introducing new concepts and procedures in order to improve its own environmental credentials. Flagship initiatives such as the deployment of a Free Route Airspace provide a potential to significantly reduce aviation’s environmental footprint and improve its overall efficiency and predictability.
Since 2011, a dense network of over 500 direct routes has been implemented in MUAC airspace. Of these, 50% are available during weekends and nights. Some 35% are available 24 hours a day (H24) with the final 15% being available only at night. Furthermore, as part of a close cooperation with our neighbouring ANSPs, the network of direct, flight-plannable cross-border routes was considerably expanded, creating a large-scale direct routing airspace over Belgium, most of Germany, Luxembourg and the Netherlands.
The FABEC Free Route Airspace Programme defines a stepped and gradual implementation approach whereby FABEC area control centres will develop and implement cross-border free route airspace FABEC-wide. In line with these plans, MUAC has embarked on its Free Route Airspace (FRAM2) Project with the aim of introducing free route operations across the MUAC
airspace in a phased approach. The first phase, where free routes will be available at night is planned for the end of 2017. The project completion, with free routes available H24 is planned for 2020. The expected gains for airline operators range from €4.4 M per year for Phase 1 to €26.0 M per year for Phase 3.
Cross-border Arrival Management - XMAN
The goal of XMAN is to decrease aircraft holding times at congested airports by reducing their cruising speeds during the final en-route phase of flight. In doing so, flight efficiency is increased as fuel burn levels and CO2 emissions fall. Moreover, less airborne congestion in terminal areas will also contribute to improved operational safety by reducing pilot/ATC workload.
After the successful implementation of the XMAN London Heathrow concept in November 2015, MUAC continues to support further trials and implementations of XMAN with other airports. The success of the XMAN London Heathrow project was recognised at the 2015 World ATM Congress where it was honoured with a Jane’s Award for its outstanding achievement in the Enabling Technology category.
OPTIMISING AIRSPACE DESIGN AND USAGE FOR SUSTAINED PERFORMANCE
/ / / / / / / / / / / / / / / / / / / / / / / / / / / / / / / / /
46
During 2016, preparations started in the support of the introduction of trials at Frankfurt and Paris Charles de Gaulle airports, both as part of FABEC and SESAR projects. FABEC remains the leading advocate for XMAN implementation and coordination, and additional implementations for Berlin, Dusseldorf and London- Gatwick airports are now being discussed for the medium-term future. In line with the requirements set out in the European Pilot Common Project (PCP) Implementing Rule, the XMAN procedure will be extended to a total of 25 European airports between now and January 2024.
Brussels Sectorisation Study
In 2016, the Brussels Sectorisation study (which was initiated in 2014) focussed on two concrete airspace improvements for the Brussels Sector Group.
The first improvement was aimed at improving traffic distribution in the western part of the Sector Group (Koksy and Nicky sectors). This was implemented on the 4th of February 2016, when the Low/High Division Level was raised from FL335 to FL355.
The second airspace modification concentrated on the eastern part of the Sector Group, where the East-High sector (i.e. combined Olno and Luxembourg sectors above FL335) was split into an East-Middle (FL335-FL375) sector and an East-Upper sector (FL375-FL660). As a consequence, this eastern part can now be divided into a maximum of four sectors as against a previous limit of three, thereby offering more possibilities for better matching the sector configuration with the traffic demand and composition. Controller training was started in 2016 and the new sectorisation was implemented on 6 March 2017.
MUAC Operational Air Traffic Service Provision
During 2016, major strides were made to complete one of the most significant landmarks of civil-military integration in the MUAC airspace - the integration of the service provision to military aircraft in the Hannover Upper Information Region (UIR) and the subsequent recruitment of former DFS-Lippe staff on 1 January 2017 which made MUAC the first cross-border civil-military Air Traffic Services provider in Europe. Over the reporting period, work mainly concentrated on service provision aspects, the recruitment of the staff, and changes to the concept of operations. The integration was also support-ed by several institutional changes such as the con-tractual agreement with Germany, changes to Letters of Agreement and other publications, and changes to internal procedures and human resources management tools.
The integration of the service provision to military aircraft in the Hannover UIR will pave the way for the further integration of the service provision to military aircraft in the upper airspace of the Amsterdam Flight Information Region as of April 2017. During 2016, the contract with the Netherlands was further developed, the operational concept and changes to the airspace structure were defined, training for the military operational staff was prepared and started; and several technical and operational adaptations to the system were implemented.
The overarching objectives of such integration are to improve the air traffic management system for the benefit of both civil and military airspace users and to achieve economies of scale for all. As airspace is a finite resource, an integrated civil-military system will also generate positive effects for the wider European network.
/ / / / / / / / / / / / / / / / / / / / / / / / / / / / / / / / / / / / / / / / / / / / / / / / / / / / / /
47
ATC2ATM
Following the increase in delay and the need to focus on the performance of daily operations, emphasis in 2016 was put on improvements in streamlining the connec-tion between the pre-tactical and tactical ATC phases. The ATC2ATM programme has launched a number of projects expected to deliver benefits over the next few years. Most notably, the:
1. AAPF (Advanced ATFCM Planning Function) project aimed at filling the gap (roles, tools, procedures) between ATFCM and ATC processes,
2. PABI (Post-OPS Analysis and Business Intelligence) project aimed at implementing the data warehouse and business intelligence tools to improve the post-ops analysis and, as a consequence, performance,
3. TPI (Traffic Predictions Improvements) project aimed at improving the traffic predictions by implementing probabilistic demand concept and predictive algorithms to improve departure-time accuracy,
4. OSM (Optimised Sector Manning) project aimed at optimising operational staff usage under specific conditions.
It should be noted, however, that there are limits to what can be achieved when external factors affect traffic flows far beyond forecast predictions.
Radio Direction Finder System (RDFS)
In densely occupied airspace, the Radio Direction Finder assists the controllers in rapidly identifying which aircraft is transmitting on the frequency. This is particularly useful in MUAC’s sectors where controllers handle up to 25 aircraft at any one time, and is a prerequisite for the implementation of the free route airspace which will begin towards the end of this year. The origin of a voice transmission appears clearly on the controller’s integrated Human Machine Interface (HMI) and is totally independent of conventional radar- and GPS-based aircraft localising techniques. This feature contributes to reducing call sign confusion, read-backs from wrong aircraft or crossed transmissions.
To ensure reliable coverage, seven Radio Direction Finder (RDF) units have been deployed across Belgium, north-west Germany and the Netherlands, resulting in a minimum coverage by three Radio Direction Finder units per aircraft throughout MUAC airspace. The RDFS, which is co-financed by the Innovation and Networks Executive Agency (INEA), was put into trial in September 2016, is operational with 4-sites as of February 2017 and is fully operational since 2 June 2017.
/ / / / / / / / / / / / / / / / / / / / / / / / / / / / / / / / / / / / / / / / / / / / / / / / / / / / / /
INNOVATION AND DEVELOPMENT
/ / / / / / / / / / / / / / / / / / / / / / / / /
48
New ATCO Console In March 2016, MUAC launched the New ATCO Console project, which aims at providing the Next Generation Consoles for the ATCOs in the OPS and Test & Training rooms. As a first step, a Human Factors & Ergonomic Study contract was awarded to design the new ATCO consoles and the future lay-out of the outer ring in the OPS-room.
N-VCS – New Voice Communication System
The N-VCS project, which is co-financed by INEA, will deliver an ED-137-compliant VoIP (Voice over Internet Protocol) Voice Communication System (and test system), comprising a redundant communications server, end-user interfaces (touch-input panels) together with telephony and radio interfaces located at MUAC as well as at remote radio sites.
In 2016, site acceptance testing continued and the first operational trials were conducted.
New Beek transmission towers
The scope of this project is to provide two transmitter (Tx) stations, namely Beek-1 Tx and Beek-2 Tx, for use by MUAC OPS and LVNL (Luchtverkeersleiding Nederland) staff, as well as the decommissioning of the current Beek Transmitter stations and the respective antenna installations on the roofs of the building.
The two towers were erected in 2015, and technical readiness was achieved in 2016, with the installation of the radios, antennas, power and associated communication cabling. Integration tests with the N-VCS have progressed and are synchronised with the N-VCS programme implantation schedule.
Air Ground Data Link in operation since 2003
As from 2016, the SESAR Deployment Manager (SDM) began defining activities to re-start the Data Link deployment programme. However, due to the overall slow progress of the project, Data Link deployment at MUAC did not advance as far as had been intended.
Despite these challenging conditions and the absence of further avionics upgrades, MUAC still managed to triple the Data Link LOG-ON rate for both ATN (Aeronautical Telecommunications Network) VDL (VHF Digital Link) Mode 2 and Future Air Navigation System (FANS) 1/A services in 2016. Although Controller-Pilot Data Link Communication (CPDLC) operations via the ATN continued to experience issues, improvements in the communication service provision infrastructure (e.g. multi frequency deployment) significantly reduced the communication drop-outs also referred to as ‘provider aborts’ which were recorded at less than 4 % at the end of the year.
In the absence of any ‘best-in-class avionics’ definition (besides the formal avionics standards) MUAC continued to improve data link performance by calling for upgrades to the latest avionics standards and filtering these through the so called ‘white listing’, coordinated through the Link 2000+ Central Reporting Office (CRO) activities at EUROCONTROL Headquarters.
MUAC re-established confidence in the system at both ends - in the cockpits and the ATC operations room - and LOG-ON as secondary means of communication was mandated for all equipped aircraft with suitably upgraded avionics. With up to 9% of all traffic logging on, Data Link managed to deliver the first safety and capacity benefits.
In 2017, MUAC is optimistic that it will be able to demonstrate the potential for CPDLC elevating traffic peaks during the busy summer period as well as during severe weather conditions, especially once the multi frequency load balancing, which is due to start at the beginning of 2017, has been implemented.
MUAC is therefore, hoping that by working in collaboration with our partners, all remaining technical problems will be resolved by the manufacturers and service providers, in time for the rapidly approaching publication of the amended Data Link Services Implementing Rule (DLS-IR).
49
‘ATM Data as a Service’ (ADaaS) study between MUAC and Slovenia Control
The ADaaS study project is being conducted by MUAC and Slovenia Control to investigate how ATM Data Services can be provided by an interoperable and harmonised ATM system - the ADSP (ATM Data Service Provider) - to one or more civil Air Traffic Service Units (ATSUs).
The project, which is being co-financed by the European Union’s Connecting Europe Facility (CEF) with a €2.45 M contribution, is being monitored by the Innovation and Networks Executive Agency (INEA).
The first part of the study developed and deployed a prototype system to support the provision of ATM data in an operational ATM environment from a single ADSP to one or more civil ATSU. The study also reviews how an existing ANSP’s ICT infrastructure should be upgraded to receive data from an ADSP. Next, the concept of an ‘Open CWP’ (Open Controller Working Position) was demonstrated. A final demonstration in 2017 will deploy a distributed FDPS (Flight Data Processing System) at two different locations. The concept, when implemented, will introduce new services and lead to increased interoperability and contingency solutions.
The overall objective is to collect all the necessary information to enhance higher degrees of efficiency and mitigate the general defragmentation of European ATM systems. A cost-benefit analysis is being developed to justify the implementation of the concept. Further implementation by other European ANSPs will follow, making ADaaS an additional proof-of-concept for SESAR’s ‘Virtual Centre’ vision.
SESAR Deployment Phase MUAC collaborates with the other FABEC partners on the projects needed to satisfy the PCP (Pilot Common Projects) mandates which have due dates running up to January 2025. As part of FABEC, MUAC is involved in the SESAR Deployment Manager (SDM) - SESAR Consultation Platform – Steering Group as well as Thematic Sub-Groups for which the relevant topics are re-assessed each annual cycle. As part of the INEA CEF 2015 call the XMAN project was reworked and reinitiated. The FABEC XMAN project was accepted and is now coordinated by DFS having been formally launched in February 2016. Additionally, a further extension of XMAN airports and supporting systems is proposed under the INEA CEF 2016 call.
MUAC remains involved in the Deployment Plan update which is typically undertaken annually. Among other things, the Deployment Plan also defines the scope for new projects in the upcoming INEA CEF calls. The main projects are Interoperability air-ground and ground-ground (AF5 and AF6), Network Collaborative Management (AF4), Flexible Airspace Management and Free Route (AF3) and support to the Extended Arrival Manager (AF1).
Both of the FABEC Free Route and XMAN projects will continue to evolve and deliver up until at least 2019. Additional projects will be proposed for future calls when deemed mature enough for deployment, and when the SDM timeline fits the MUAC project timeline. For the INEA CEF 2015 call, projects related to the Security Operations Centre (SOC) and new Pan European Network Services (new PENS) have been introduced as part of EUROCONTROL Brussels programmes and Data Link via a multi-ANSP project.
As from the INEA CEF 2016 call, projects have been added to prepare for a European Deployment Roadmap for Flight Object Interoperability (linked to AF5) and to define the future European Data Link Implementation Project (linked to AF6).
50
SESAR2020 validations & demonstrations
MUAC, in cooperation with other ANSPs and industry partners, is contributing to pre-operational validation projects in the context of the SESAR2020 development phase to gain experience with the new concepts and technology as already mandated through the Pilot Common Projects (PCP) up till 2024. MUAC will contribute its know-how in areas of interest to the European ATM network where the Centre can deliver added value. As part of the SESAR development phase, MUAC, in line with the SESAR Joint Undertaking policy, will conduct activities in, or close to, the control room focusing on en-route operations, including links to the terminal areas and the Network Manager. Those activities have been regrouped into four main streams:
• Trajectory Management Framework (TMF) covering the new Data Link (ADS-C) part of the original i4D concept (mainly sharing/downlinking the airborne trajectory),
• Trajectory Management Framework (TMF) covering interoperability ground-ground which introduces a real-time connection between the FDP systems, also known as the SWIM Blue Profile,
• Network Collaborative Management (NCM) in relation to Dynamic Demand and Capacity balancing and implementing electronic STAM (Short-Term ATFCM Measures) coordination,
• Extended Arrival Management (E-AMAN) focussing on receiving and managing incoming individual AMAN requests from airports whose 200-NM range interfaces with MUAC.
MUAC plans to further mature the above mentioned required functionality and systems that have been partially validated under SESAR1. Additional validations and demonstrations to support PCP Deployment have now been planned since the end of 2016 as part of the SESAR2020 programme.
/ / / / / / / / / / / / / / / / / / / / / / / / / / / / / / / / /
51
PEOPLE
The new MUAC Management System certified to be compliant with ISO 9001 requirements
An important milestone in September 2016 was the periodic re-issuing by DNV GL (Det Norske Veritas Germanischer Lloyd) of ISO 9001:2008 certification of the new version of MUAC’s Management System, which covers the provision of Air Traffic Management services consistent with international standards, including the procurement, integration and maintenance of technical systems and the provision of ATM specific training.
Proactive manpower planning
Manpower requirement is continuously being monitored with regards to both the controller and support functions.
MUAC manpower requirement saw sustained growth in traffic demand over the reporting period. To actively prepare for the expected retirement of a significant number of Air Traffic Control Officers (ATCOs) in the near future, regular ab initio training has been restarted.
For the support functions, the objective was to contain, or where possible, lower staff numbers to meet the MCG (Maastricht Co-ordination Group) tasking of assessing the business need for every support function prior to
filling it. Therefore, over the reporting period, internal solutions were pursued instead of external recruitment and outsourcing contracts were awarded wherever possible to focus MUAC resources on core activities.
Although there was an increase of three in the headcount – equating to 0.5% of the previous year’s staff complement – the number of employees working full-time (Full-Time Equivalents – FTEs) actually fell by two units from 591.6 in 2015 to 589.2 in 2016, with most of these efficiencies achieved in the support staff category.
Ab Initio Training at ENAC
At the end of March 2016, all eight Ab Initio 69 (AI69) students successfully passed the ACS Rating examinations and received an ‘ATCO Student Licence’. Unfortunately, one student did not meet the expectations in the Pre-Transition phase (the 11-week training period that fills the gap between rating level and required entry level for the Unit Training at MUAC). Having seven out of eight successful students starting the Unit Training is, however, a great success. The high-quality training, delivered by ENAC, has been confirmed in this first delivery of initial training. The next training group of 10 students for AI70 started at the end of February 2017 and the first ‘milestone’ in the training programme is scheduled for the end of July 2017.
Over the reporting period, the number of employees increased by 0.5% from 613 in 2015 to 616 in 2016, despite a slight reduction in the number of Air Traffic Controllers from 306 to 304. High controller outflow expected in the next 10 years, combined with lengthy ATCO intake procedures and rigidities in the licensing system, pose additional challenges to the achievement of the required level of performance. Nevertheless, the implementation of an integrated and shared information system coupled with an efficient manpower planning policy and an effective stakeholder management strategy is paramount to ensure sustained performance over the SES RP2 period.
/ / / / / / / / / / / / / / / / / / / / / / / / / / / / / / / / /
52
Unit Training at MUAC
The MUAC Training Team delivered the first New Unit Training to the seven students of AI69 between mid-July 2016 and the end of January 2017. The team’s intensely dedicated efforts in designing, developing and delivering this new course has been rewarded with the fact that they enjoyed a 100% success rate in the Transition and Pre-OJT (Pre-On-the-Job Training) modules of the Unit Training - an unprecedented success. A detailed evaluation of the course delivery will lead to further improvements and a next step in the pedagogical design of the training.
Coaching Teams
Following agreement with the Social Partners on the Coaching Concept, all Coaching Teams have been selected in preparation for the OJT Phase of AI69. These Coaching Teams were the first group to receive the ‘OJTI (On-the-Job Instructor) Master Classes’, a course developed and delivered to train the OJTIs to apply a more ‘reflective’ coaching style compared to the past.
MOAT
All Hannover and DECO ATCOs and EOS (Executive Operations Support) Assistants have been trained in preparation for the OAT (Operational Air Traffic) integration planned for February 2017. As the content of the training is new to the MUAC Training Organisation, detailed and constructive cooperation with our Lippe Training Experts was essential. The training was successfully finished in early 2017.
Cross Training Programme
Another pool of four ATCOs has been ‘cross-trained’. Two have obtained a third geographical endorsement and another two have been fully trained for both geographical areas in the Brussels Sector Group. Further initiatives will be investigated to offer more cross training in 2017.
EOS Project
Due to an evolution of roles, and with a view to introduce a competency management scheme for the Executive Operations Support (EOS) group, the EOS Project
was initiated. The intention is to reduce overall staffing levels in the EOS structure as well as the sickness rate which results from the high number of night shifts required. The EOS Project will also improve cost and roster efficiency, productivity and competence levels. These benefits will be mainly achieved by introducing double competencies to replace the present single competency scheme. A corresponding change to the General Conditions of Employment was agreed with the Trade Unions and the new planning principles were implemented in Q4 2016.
Other Training
The Training Organisation has also delivered training for the CSS (Room Supervisors and Assistant Duty Supervisors (AtDSUPs)), recurrent Refresher Training, Adapted Refresher and Unit Training and customised
training in support of project implementations.
Social Dialogue
Social dialogue activities in 2016 continued at both Agency and MUAC levels through the Agency consultation process involving the trade unions and meetings of the Staff Committee Servants, who represent MUAC staff, with MUAC senior management.
On 1 July 2016, the approved Administrative Reform was implemented thus aligning the Agency to a large degree with the principles agreed at the EU. Further effort was spent on implementing these provisions through dedicated Rules of Application which were discussed in the Agency consultation process and supporting technical meetings. In addition, agreement was reached with regards to the specific employment conditions for the recruitment and employment of the former DFS staff, recruited by MUAC, for the service provision to military traffic in the Hannover UIR as of 1 January 2017. Within MUAC, the management provided regular feedback to the Staff Committee Servants on MUAC’s activities and its involvement within FABEC as well as the ongoing review of the Maastricht Agreement with a view to implement the higher management autonomy for MUAC as decided by PC decisions 128 & 129 in December 2015. They also followed up on staff concerns raised by the Staff Committee.
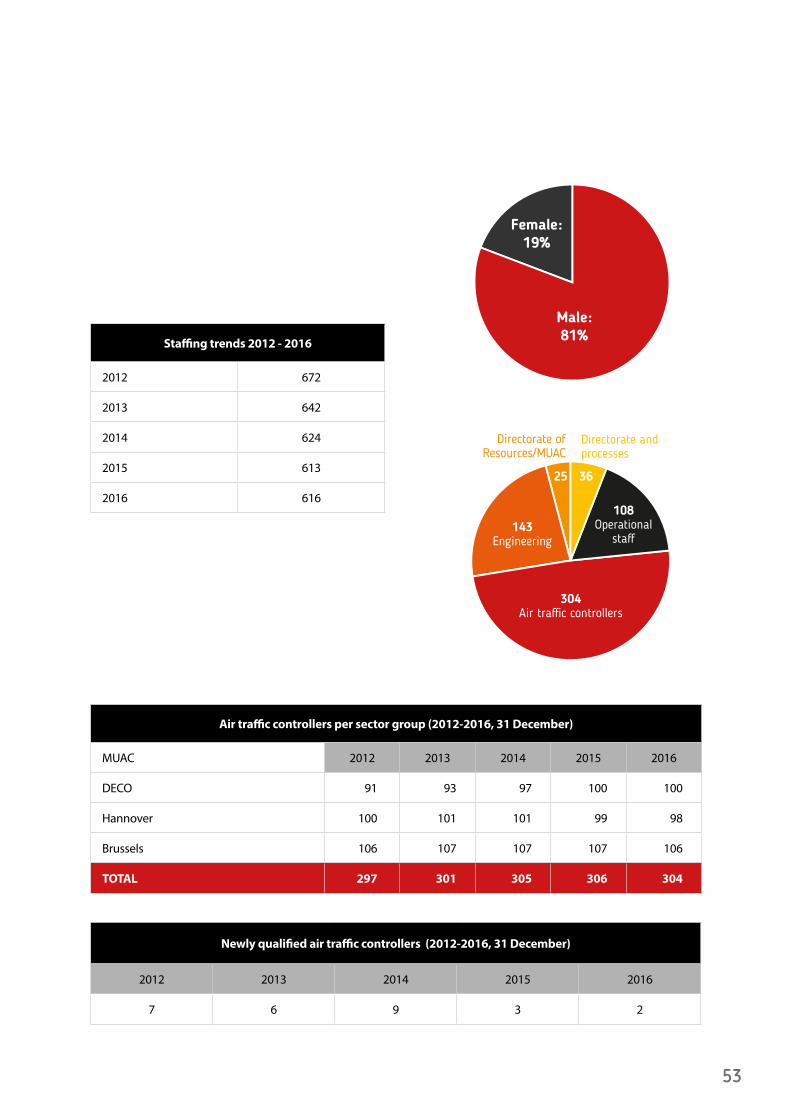
53
Male:81%
Female:19%
304Air traffic controllers
143Engineering
108Operational
staff
3625
Directorate andprocesses
Directorate ofResources/MUAC
Staffing trends 2012 - 2016
2012 672
2013 642
2014 624
2015 613
2016 616
Air traffic controllers per sector group (2012-2016, 31 December)
MUAC 2012 2013 2014 2015 2016
DECO 91 93 97 100 100
Hannover 100 101 101 99 98
Brussels 106 107 107 107 106
TOTAL 297 301 305 306 304
Newly qualified air traffic controllers (2012-2016, 31 December)
2012 2013 2014 2015 2016
7 6 9 3 2
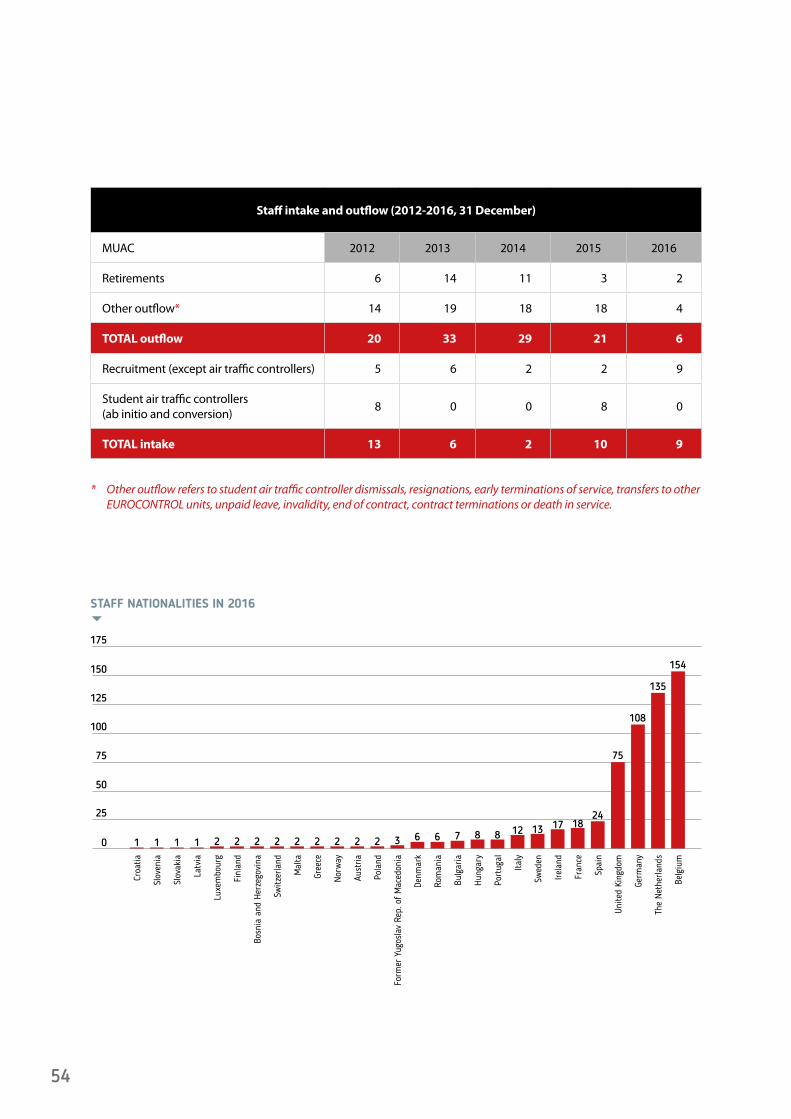
54
Staff intake and outflow (2012-2016, 31 December)
MUAC 2012 2013 2014 2015 2016
Retirements 6 14 11 3 2
Other outflow* 14 19 18 18 4
TOTAL outflow 20 33 29 21 6
Recruitment (except air traffic controllers) 5 6 2 2 9
Student air traffic controllers (ab initio and conversion)
8 0 0 8 0
TOTAL intake 13 6 2 10 9
* Other outflow refers to student air traffic controller dismissals, resignations, early terminations of service, transfers to other EUROCONTROL units, unpaid leave, invalidity, end of contract, contract terminations or death in service.
STAFF NATIONALITIES IN 2016
0 1 1 1 1 2 2 2 2 2 2 2 2 2 3 6 6 7 8 8 12 13
25
50
75
100
125
150
175
Switze
rland
Irela
nd
Latv
ia
Hung
ary
Aust
ria
Germ
any
Slov
enia
Rom
ania
Gree
ce
Spai
n
Finl
and
Italy
Form
er Y
ugos
lav
Rep.
of
Mac
edon
ia
Belg
ium
Croa
tia
Mal
ta
Fran
ce
Luxe
mbo
urg
Port
ugal
Pola
nd
The
Net
herla
nds
Slov
akia
Bulg
aria
Nor
way
Unite
d Ki
ngdo
m
Bosn
ia a
nd H
erze
govi
na
Swed
en
Denm
ark
17 1824
75
108
135
154
5
55
BUSINESS OUTLOOK
2016 has marked a decisive return to growth for the aviation industry. Indeed, the MUAC airspace has experienced a staggering traffic increase and current expectations are that this trend will continue in 2017 until the end of RP2. Undoubtedly, a traffic increase of the same magnitude as the pre-crisis period is currently under way. In fact, year-to-date trends indicate an overall stronger-than-expected traffic growth, especially in the German part of the airspace where users appear to have reacted to the lowered Unit Rate.
Issues with the inaccuracy and unreliability of the STATFOR seven-year traffic forecast are expected to persist over RP2. This is likely to continue in the long term - hence exposing MUAC to additional challenges in providing a solid and sound tool to plan manpower levels and general business activities. The traffic evolution over the first period of RP2 suggests that applying the upper range of the STATFOR traffic scenarios would be a sensible precaution.
It is clear that the main challenge MUAC will face in 2017 and the years beyond is coping with an unbalanced, inaccurately forecasted and more than expected traffic demand. This will undoubtedly necessitate a high level of initiative, proactivity and resourcefulness in all areas of the business in order to maintain MUAC in its market-leading position in the core European area.
To help accommodate the increased traffic demand MUAC will pursue a multifaceted approach, with numerous corrective measures such as ATCO cross-training, airspace optimization projects and ATM system enhancements being proposed. These initiatives will be regularly assessed with regards to the performance benefits each one may bring.
In the short term, alternative approaches are being developed to investigate and establish solutions to the problem of limited availability of OPS resourcing in key projects which require operational expertise for validation. The Four States are ready to co-operate and to accept more flexibility in the area of financial
cost-efficiency, which is performing relatively well, if these additional resources are invested to enhance MUAC handling more traffic by providing a better service to their customers.
Furthermore, an on-going revision of the SES Performance Scheme aimed at increasing flexibility in the interpretation of the principles underlying such a regulation, might contribute to providing MUAC with additional tools to cope with the expected capacity challenges beyond RP2.
From the controller resources perspective, and taking into account the duration of the controller training programme as well as the expected outflow to pension (i.e. retirement) in the coming years, it is essential that the appropriate recruitment measures are maintained in order to ensure that sufficient qualified staff are in place to meet future traffic demand. As well as detrimental effects on the network, any degradation in MUAC’s capacity and delay performance would inevitably result in reduced revenue.
With some of the key FABEC airspace design projects suspended it is clear that at least in the short to medium term, MUAC will not be able to rely on FABEC support in solving the main structural issues at hand. MUAC will instead, either independently or in bi-lateral cooperation with selected partners, address the challenges in order to deliver the required capacity to the network. The FABEC Free Route Airspace will however remain a flagship activity in order to continue the delivery of notable benefits to airspace users.
Our strategy to establish the most efficient civil/military working relationships with our military partners in the Four States will start paying dividends as of 2017 with the integration of the service provision to military aircraft in the Hannover UIR and in the Amsterdam FIR.
The MUAC Board
5656
/ / / / / / / / / / / / / / / / / / / / / / / / / / / / / / / / / / / / /
Annual accounts
EUROCONTROL produces annual accounts which provide a consolidated view of the Agency’s financial performance. In line with the applicable financial regulations, the specific performance of MUAC is identified in Part III of the Agency’s accounts. This report includes an excerpt of the data available in the Agency’s Annual Accounts in order to present a reference Balance Sheet and Statement of Financial Performance for MUAC. The Agency’s Annual Accounts are produced in accordance with the principle of a true and fair view.
The Agency’s accounts, including Part III, which relates to MUAC, are audited by the Audit Board with the assistance of external consultant auditors. The Annual Accounts, including the auditor’s opinion, are subsequently submitted to the Commission via the Provisional Council. The Commission gives a final ruling on the Accounts and decides on the discharge to be given to the Director General in respect of his financial and accounting management.
The figures presented in this report are, therefore, subject to the approval of the Audit Board and the Provisional Council, which was received in June 2017.
FINANCIAL ACCOUNTS
57
Accounting principles and general notes on accounting matters
The main accounting principles, underlying the present financial statements, are set out below.
Since 2011, the financial statements with regard to expenditure and receipts are prepared on the basis of the International Financial Reporting Standards (IFRS), and based on the provisions of the Financial Regulations of the Agency and their Rules of Application. The Agency’s policy, regarding fixed assets, is based on the revised Director General Decision XI/7(2011), dated 17/10/2011 and the Principal Director Resources Decision DR/II/07 (2013). Fixed assets are entered at their historic value and amortised over their useful lifetimes, in accordance with amortisation rates, which apply equally to the calculation of the investment costs to be recovered from the airspace users through the EUROCONTROL part of the cost-base (based on ICAO rules adopted by the Permanent Commission).
Following a decision by the Provisional Council in November 2004, the Agency applies IAS 38 and, as of 1 January 2006, capitalises only intangible assets that fully comply with this standard. Following this principle, only computer software for which EUROCONTROL owns intellectual property rights are capitalised.
Concerning operating expenditure, contributions from the Four Member States participating in MUAC are calculated on the basis of an agreed cost-sharing formula. At year end, the over/under payment of contributions is calculated by comparing the level of expenditure with the level of contributions paid.
Concerning investments, a mechanism for pre-financing investments by the Agency is in place, ensuring that investments are fully financed with bank loans. Therefore, the residual value of fixed assets in the Balance Sheet is fully compensated by an equivalent amount of loans. In the Statement of Financial Performance, the amortisation charge for the year is balanced by contributions from the Four States.
In accordance with Article 23 of the Financial Regulations, any over/under payments of contributions are deducted from/added to contributions for the subsequent year.
In accordance with Article 29 of the Financial Regulations, and, as approved by the Permanent Commission, the Annual Accounts incorporate both the Budgetary and the Financial Accounts.
The 2016 Budgetary Accounts, which determine the amount of contributions due from the Member States in 2016, are based on the IFRS principles (with some exceptions). Similarly, the 2016 EUROCONTROL cost-base, which has been charged to the users through the route charges recovery cost mechanism, is also based on the IFRS principles (with some exceptions).
The exceptions to IFRS are listed in Article 6 of the Rule of Applications to the Financial Regulations in the areas of contributions to social security schemes, compensations of national taxes and provisions.
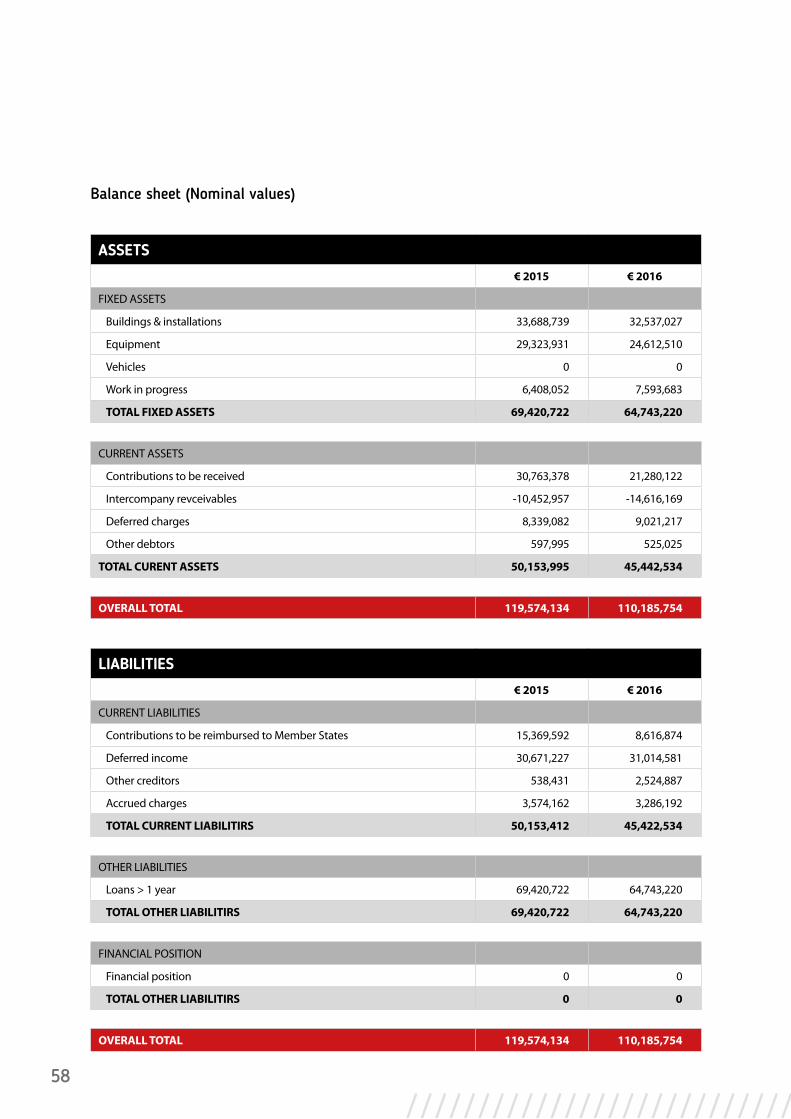
58
ASSETS
€ 2015 € 2016
FIXED ASSETS
Buildings & installations 33,688,739 32,537,027
Equipment 29,323,931 24,612,510
Vehicles 0 0
Work in progress 6,408,052 7,593,683
TOTAL FIXED ASSETS 69,420,722 64,743,220
CURRENT ASSETS
Contributions to be received 30,763,378 21,280,122
Intercompany revceivables -10,452,957 -14,616,169
Deferred charges 8,339,082 9,021,217
Other debtors 597,995 525,025
TOTAL CURENT ASSETS 50,153,995 45,442,534
OVERALL TOTAL 119,574,134 110,185,754
/ / / / / / / / / / / / / / / / / / / / / / / / / / / / / / / / / / / / / / / / / / / / / / / / / / / / / /
LIABILITIES
€ 2015 € 2016
CURRENT LIABILITIES
Contributions to be reimbursed to Member States 15,369,592 8,616,874
Deferred income 30,671,227 31,014,581
Other creditors 538,431 2,524,887
Accrued charges 3,574,162 3,286,192
TOTAL CURRENT LIABILITIRS 50,153,412 45,422,534
OTHER LIABILITIES
Loans > 1 year 69,420,722 64,743,220
TOTAL OTHER LIABILITIRS 69,420,722 64,743,220
FINANCIAL POSITION
Financial position 0 0
TOTAL OTHER LIABILITIRS 0 0
OVERALL TOTAL 119,574,134 110,185,754
Balance sheet (Nominal values)
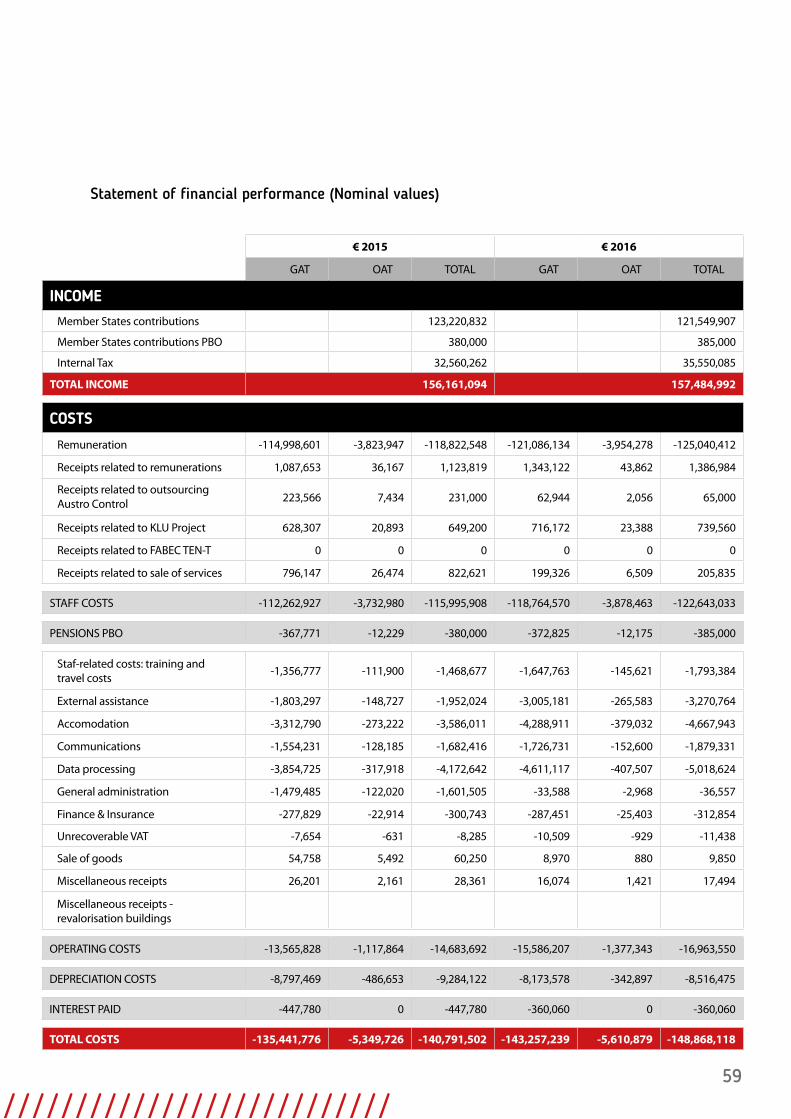
59
/ / / / / / / / / / / / / / / / / / / / / / / / / / / / / / / / / / / / / / / / / / / / / / / / / / / / / /
Statement of financial performance (Nominal values)
€ 2015 € 2016
GAT OAT TOTAL GAT OAT TOTAL
INCOME
Member States contributions 123,220,832 121,549,907
Member States contributions PBO 380,000 385,000
Internal Tax 32,560,262 35,550,085
TOTAL INCOME 156,161,094 157,484,992
COSTS
Remuneration -114,998,601 -3,823,947 -118,822,548 -121,086,134 -3,954,278 -125,040,412
Receipts related to remunerations 1,087,653 36,167 1,123,819 1,343,122 43,862 1,386,984
Receipts related to outsourcing Austro Control 223,566 7,434 231,000 62,944 2,056 65,000
Receipts related to KLU Project 628,307 20,893 649,200 716,172 23,388 739,560
Receipts related to FABEC TEN-T 0 0 0 0 0 0
Receipts related to sale of services 796,147 26,474 822,621 199,326 6,509 205,835
STAFF COSTS -112,262,927 -3,732,980 -115,995,908 -118,764,570 -3,878,463 -122,643,033
PENSIONS PBO -367,771 -12,229 -380,000 -372,825 -12,175 -385,000
Staf-related costs: training and travel costs
-1,356,777 -111,900 -1,468,677 -1,647,763 -145,621 -1,793,384
External assistance -1,803,297 -148,727 -1,952,024 -3,005,181 -265,583 -3,270,764
Accomodation -3,312,790 -273,222 -3,586,011 -4,288,911 -379,032 -4,667,943
Communications -1,554,231 -128,185 -1,682,416 -1,726,731 -152,600 -1,879,331
Data processing -3,854,725 -317,918 -4,172,642 -4,611,117 -407,507 -5,018,624
General administration -1,479,485 -122,020 -1,601,505 -33,588 -2,968 -36,557
Finance & Insurance -277,829 -22,914 -300,743 -287,451 -25,403 -312,854
Unrecoverable VAT -7,654 -631 -8,285 -10,509 -929 -11,438
Sale of goods 54,758 5,492 60,250 8,970 880 9,850
Miscellaneous receipts 26,201 2,161 28,361 16,074 1,421 17,494
Miscellaneous receipts - revalorisation buildings
OPERATING COSTS -13,565,828 -1,117,864 -14,683,692 -15,586,207 -1,377,343 -16,963,550
DEPRECIATION COSTS -8,797,469 -486,653 -9,284,122 -8,173,578 -342,897 -8,516,475
INTEREST PAID -447,780 0 -447,780 -360,060 0 -360,060
TOTAL COSTS -135,441,776 -5,349,726 -140,791,502 -143,257,239 -5,610,879 -148,868,118

60
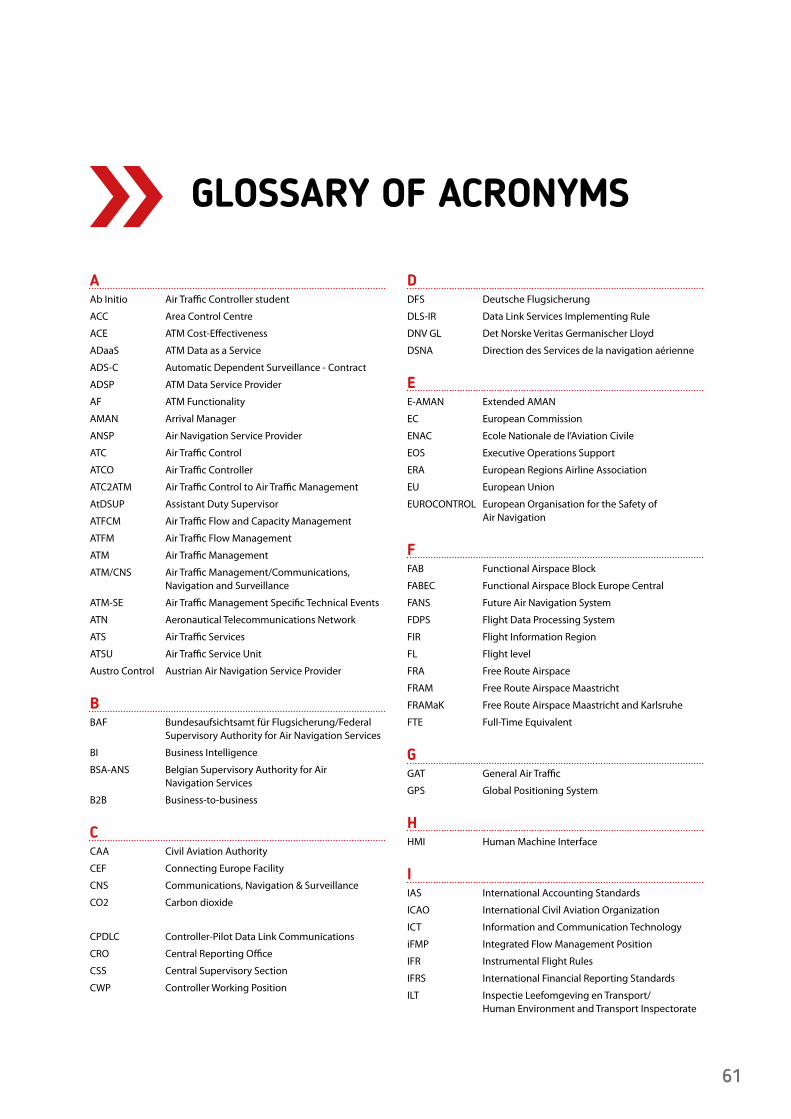
61
GLOSSARY OF ACRONYMS
AAb Initio Air Traffic Controller student
ACC Area Control Centre
ACE ATM Cost-Effectiveness
ADaaS ATM Data as a Service
ADS-C Automatic Dependent Surveillance - Contract
ADSP ATM Data Service Provider
AF ATM Functionality
AMAN Arrival Manager
ANSP Air Navigation Service Provider
ATC Air Traffic Control
ATCO Air Traffic Controller
ATC2ATM Air Traffic Control to Air Traffic Management
AtDSUP Assistant Duty Supervisor
ATFCM Air Traffic Flow and Capacity Management
ATFM Air Traffic Flow Management
ATM Air Traffic Management
ATM/CNS Air Traffic Management/Communications, Navigation and Surveillance
ATM-SE Air Traffic Management Specific Technical Events
ATN Aeronautical Telecommunications Network
ATS Air Traffic Services
ATSU Air Traffic Service Unit
Austro Control Austrian Air Navigation Service Provider
BBAF Bundesaufsichtsamt für Flugsicherung/Federal Supervisory Authority for Air Navigation Services
BI Business Intelligence
BSA-ANS Belgian Supervisory Authority for Air Navigation Services
B2B Business-to-business
CCAA Civil Aviation Authority
CEF Connecting Europe Facility
CNS Communications, Navigation & Surveillance
CO2 Carbon dioxide
CPDLC Controller-Pilot Data Link Communications
CRO Central Reporting Office
CSS Central Supervisory Section
CWP Controller Working Position
DDFS Deutsche Flugsicherung
DLS-IR Data Link Services Implementing Rule
DNV GL Det Norske Veritas Germanischer Lloyd
DSNA Direction des Services de la navigation aérienne
EE-AMAN Extended AMAN
EC European Commission
ENAC Ecole Nationale de l’Aviation Civile
EOS Executive Operations Support
ERA European Regions Airline Association
EU European Union
EUROCONTROL European Organisation for the Safety of Air Navigation
FFAB Functional Airspace Block
FABEC Functional Airspace Block Europe Central
FANS Future Air Navigation System
FDPS Flight Data Processing System
FIR Flight Information Region
FL Flight level
FRA Free Route Airspace
FRAM Free Route Airspace Maastricht
FRAMaK Free Route Airspace Maastricht and Karlsruhe
FTE Full-Time Equivalent
GGAT General Air Traffic
GPS Global Positioning System
HHMI Human Machine Interface
IIAS International Accounting Standards
ICAO International Civil Aviation Organization
ICT Information and Communication Technology
iFMP Integrated Flow Management Position
IFR Instrumental Flight Rules
IFRS International Financial Reporting Standards
ILT Inspectie Leefomgeving en Transport/ Human Environment and Transport Inspectorate
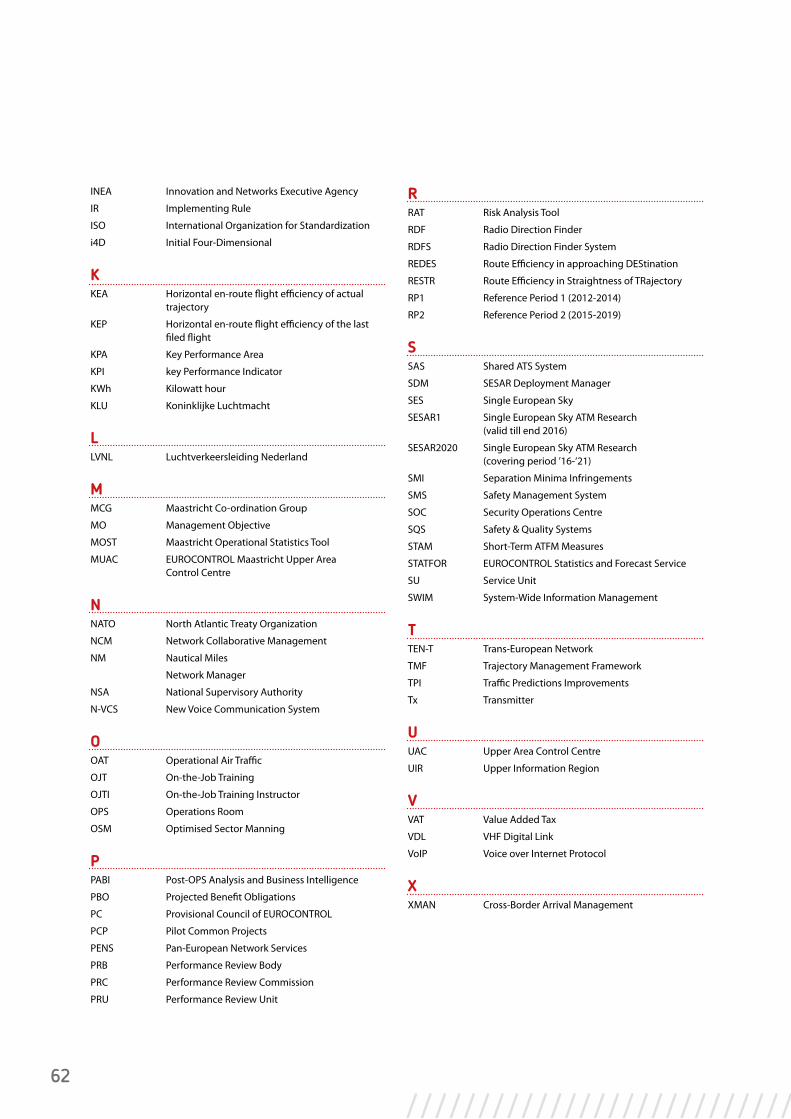
62
INEA Innovation and Networks Executive Agency
IR Implementing Rule
ISO International Organization for Standardization
i4D Initial Four-Dimensional
KKEA Horizontal en-route flight efficiency of actual trajectory
KEP Horizontal en-route flight efficiency of the last filed flight
KPA Key Performance Area
KPI key Performance Indicator
KWh Kilowatt hour
KLU Koninklijke Luchtmacht
LLVNL Luchtverkeersleiding Nederland
MMCG Maastricht Co-ordination Group
MO Management Objective
MOST Maastricht Operational Statistics Tool
MUAC EUROCONTROL Maastricht Upper Area Control Centre
NNATO North Atlantic Treaty Organization
NCM Network Collaborative Management
NM Nautical Miles
Network Manager
NSA National Supervisory Authority
N-VCS New Voice Communication System
OOAT Operational Air Traffic
OJT On-the-Job Training
OJTI On-the-Job Training Instructor
OPS Operations Room
OSM Optimised Sector Manning
PPABI Post-OPS Analysis and Business Intelligence
PBO Projected Benefit Obligations
PC Provisional Council of EUROCONTROL
PCP Pilot Common Projects
PENS Pan-European Network Services
PRB Performance Review Body
PRC Performance Review Commission
PRU Performance Review Unit
RRAT Risk Analysis Tool
RDF Radio Direction Finder
RDFS Radio Direction Finder System
REDES Route Efficiency in approaching DEStination
RESTR Route Efficiency in Straightness of TRajectory
RP1 Reference Period 1 (2012-2014)
RP2 Reference Period 2 (2015-2019)
SSAS Shared ATS System
SDM SESAR Deployment Manager
SES Single European Sky
SESAR1 Single European Sky ATM Research (valid till end 2016)
SESAR2020 Single European Sky ATM Research (covering period ’16-‘21)
SMI Separation Minima Infringements
SMS Safety Management System
SOC Security Operations Centre
SQS Safety & Quality Systems
STAM Short-Term ATFM Measures
STATFOR EUROCONTROL Statistics and Forecast Service
SU Service Unit
SWIM System-Wide Information Management
TTEN-T Trans-European Network
TMF Trajectory Management Framework
TPI Traffic Predictions Improvements
Tx Transmitter
UUAC Upper Area Control Centre
UIR Upper Information Region
VVAT Value Added Tax
VDL VHF Digital Link
VoIP Voice over Internet Protocol
XXMAN Cross-Border Arrival Management
/ / / / / / / / / / / / / / / / / / / / / / / / / / / / / / / / / / / / / / / / / / / / / / / / / / / / / /

/ / / / / / / / / / / / / / / / / / / / / / / / / / / / / / / / / / / / / / / / / / / / / / / / / / / / / /
/ / / / / / / / / / / / / / / / / / / / / / / / / / / / / / / / / / / / / / / / / / / / / / /
EUROCONTROL Maastricht
Horsterweg 11 NL-6199 AC Maastricht-Airport
Phone: +31-43-366 1234
Fax: +31-43-366 1300
www.eurocontrol.int/muac
© July 2017
European Organisation for the Safety of Air Navigation (EUROCONTROL)
This document is published by EUROCONTROL for information purposes. It may be
copied in whole or in part, provided that EUROCONTROL is mentioned as the source and
it is not used for commercial purposes
(i.e. for financial gain). The information in this document may not be modified without
prior written permission from EUROCONTROL.

/ / / / / / / / / / / / / / / / / / / / / / / / / / / / / / / / / / / / / / / / / / / / / / /


