24
European Tyre & Rubber Industry Statistics Edition 2010 N°2
European Tyre & Rubber Industry
StatisticsEdition 2010
N°2

ETRMA members
Tyre Corporate
www.conti-online.com
www.coopertire.com www.goodyear.com
www.michelin.com www.mitas.cz
www.nokiantyres.com www.pirellityre.com
www.hankooktire-eu.com
www.trelleborg.com
National Associations
Affiliated Members
Belgiumwww.federplast.be
Finlandwww.kumiteollisuus.fi
Tyre Corporate – BRISA www.brisa.com.tr
National Association – UK: BTMA www.btmauk.com
Francewww.lecaoutchouc.com
Germanywww.wdk.de
Italy www.federazionegommaplastica.it
The Netherlandswww.vereniging-nvr.nl
Spainwww.consorciocaucho.es
Apollo Vredesteinwww.vredestein.com
www.bridgestone.eu
www.marangoni.com
3
About ETRMA
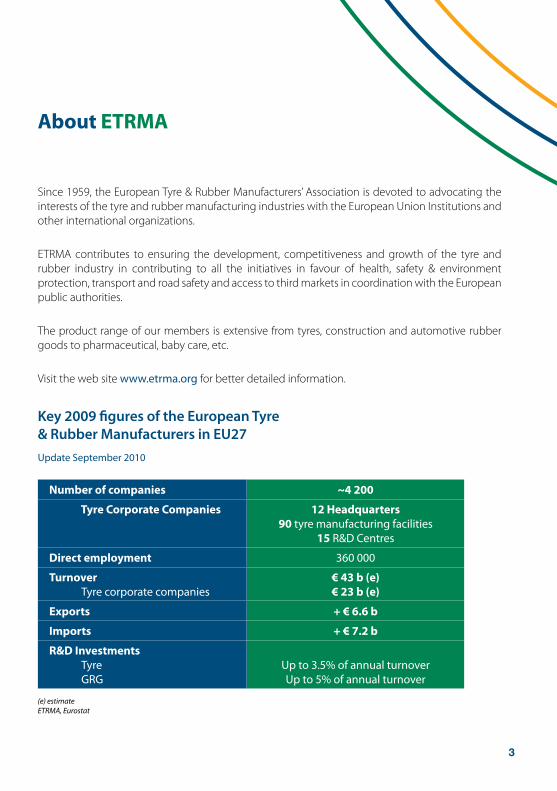
Key 2009 figures of the European Tyre & Rubber Manufacturers in EU27Update September 2010
(e) estimateETRMA, Eurostat
Number of companies ~4 200
Tyre Corporate Companies 12 Headquarters 90 tyre manufacturing facilities
15 R&D Centres
Direct employment 360 000
Turnover Tyre corporate companies
€ 43 b (e)€ 23 b (e)
Exports + € 6.6 b
Imports + € 7.2 b
R&D Investments Tyre GRG
Up to 3.5% of annual turnover Up to 5% of annual turnover
Since 1959, the European Tyre & Rubber Manufacturers’ Association is devoted to advocating the interests of the tyre and rubber manufacturing industries with the European Union Institutions and other international organizations.
ETRMA contributes to ensuring the development, competitiveness and growth of the tyre and rubber industry in contributing to all the initiatives in favour of health, safety & environment protection, transport and road safety and access to third markets in coordination with the European public authorities.
The product range of our members is extensive from tyres, construction and automotive rubber goods to pharmaceutical, baby care, etc.
Visit the web site www.etrma.org for better detailed information.
4
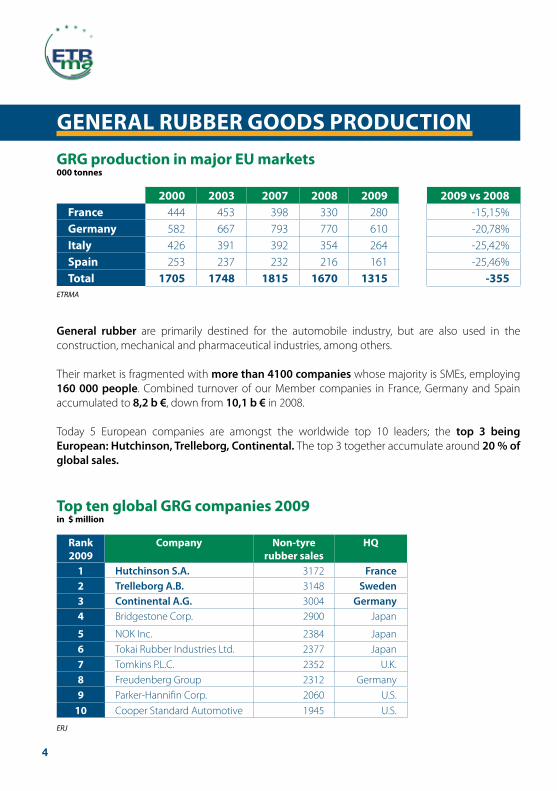
GENERAl RubbER GooDs pRoDuCTIoNGRG production in major Eu markets000 tonnes
General rubber are primarily destined for the automobile industry, but are also used in the construction, mechanical and pharmaceutical industries, among others. Their market is fragmented with more than 4100 companies whose majority is SMEs, employing 160 000 people. Combined turnover of our Member companies in France, Germany and Spain accumulated to 8,2 b €, down from 10,1 b € in 2008. Today 5 European companies are amongst the worldwide top 10 leaders; the top 3 being European: Hutchinson, Trelleborg, Continental. The top 3 together accumulate around 20 % of global sales.
2000 2003 2007 2008 2009 2009 vs 2008France 444 453 398 330 280 -15,15%Germany 582 667 793 770 610 -20,78%Italy 426 391 392 354 264 -25,42%spain 253 237 232 216 161 -25,46%Total 1705 1748 1815 1670 1315 -355
ETRMA
Top ten global GRG companies 2009in $ million
Rank 2009
Company Non-tyrerubber sales
HQ
1 Hutchinson S.A. 3172 France2 Trelleborg A.B. 3148 Sweden3 Continental A.G. 3004 Germany4 Bridgestone Corp. 2900 Japan
5 NOK Inc. 2384 Japan6 Tokai Rubber Industries Ltd. 2377 Japan7 Tomkins P.L.C. 2352 U.K.8 Freudenberg Group 2312 Germany9 Parker-Hannifin Corp. 2060 U.S.
10 Cooper Standard Automotive 1945 U.S.
ERJ
5
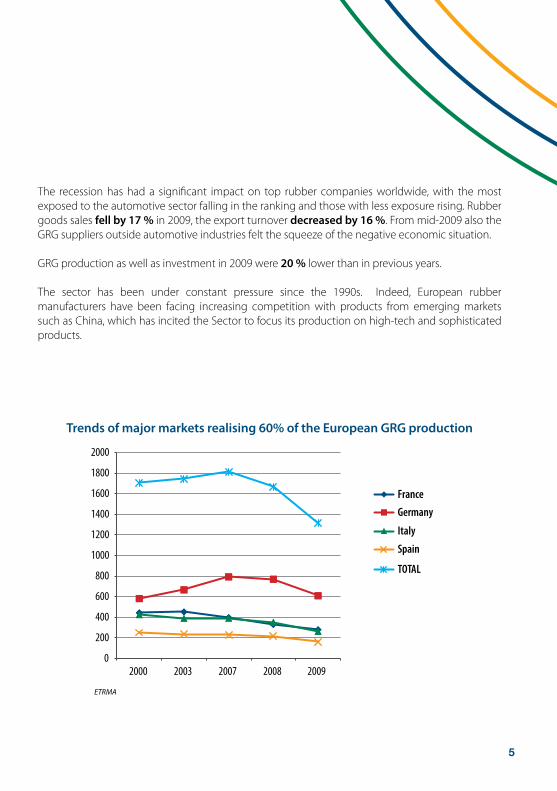
Trends of major markets realising 60% of the European GRG production
France
Germany
Italy
Spain
TOTAL
0
200
400
600
800
1000
1200
1400
1600
1800
2000
2000 2003 2007 2008 2009
ETRMA
The recession has had a significant impact on top rubber companies worldwide, with the most exposed to the automotive sector falling in the ranking and those with less exposure rising. Rubber goods sales fell by 17 % in 2009, the export turnover decreased by 16 %. From mid-2009 also the GRG suppliers outside automotive industries felt the squeeze of the negative economic situation. GRG production as well as investment in 2009 were 20 % lower than in previous years. The sector has been under constant pressure since the 1990s. Indeed, European rubber manufacturers have been facing increasing competition with products from emerging markets such as China, which has incited the Sector to focus its production on high-tech and sophisticated products.
6
TYRE MARKET
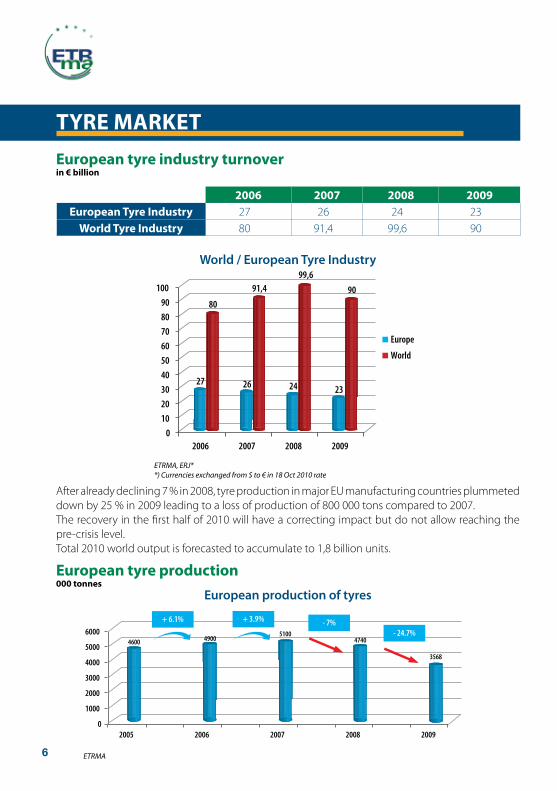
European tyre production000 tonnes
European tyre industry turnoverin € billion
0
1000
2000
3000
4000
5000
6000
2005 2006 2007 2008 2009
4600 4900 5100
4740
3568
+ 6.1% + 3.9% - 7%- 24.7%
ETRMA
After already declining 7 % in 2008, tyre production in major EU manufacturing countries plummeted down by 25 % in 2009 leading to a loss of production of 800 000 tons compared to 2007. The recovery in the first half of 2010 will have a correcting impact but do not allow reaching the pre-crisis level. Total 2010 world output is forecasted to accumulate to 1,8 billion units.
2006 2007 2008 2009European Tyre Industry 27 26 24 23
World Tyre Industry 80 91,4 99,6 90
World / European Tyre Industry
European production of tyres
ETRMA, ERJ**) Currencies exchanged from $ to € in 18 Oct 2010 rate
0
10
20
30
40
50
60
70
80
90
100
2006 2007 2008 2009
Europe
World
23
90
99,6
2426
91,4
80
27
7
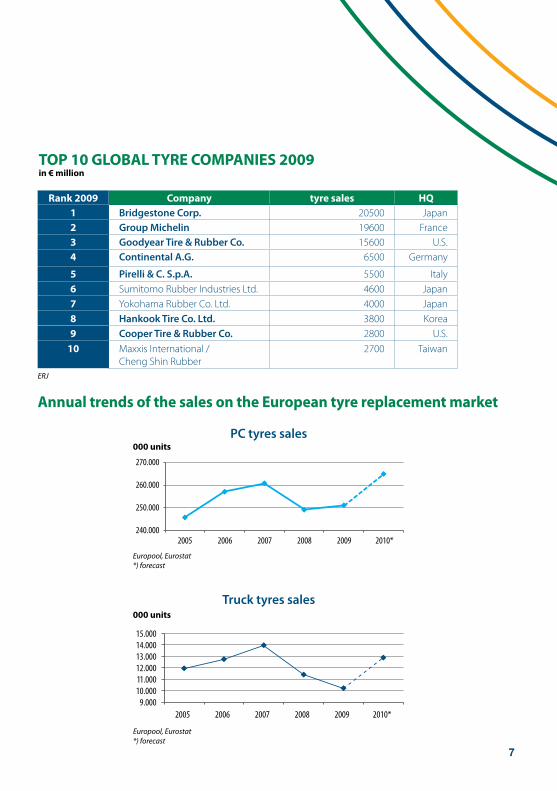
Annual trends of the sales on the European tyre replacement market
PC tyres sales
Truck tyres sales
Europool, Eurostat*) forecast
ERJ
Europool, Eurostat*) forecast
Top 10 GlobAl TYRE CoMpANIEs 2009in € million
000 units
000 units
Rank 2009 Company tyre sales HQ1 Bridgestone Corp. 20500 Japan2 Group Michelin 19600 France3 Goodyear Tire & Rubber Co. 15600 U.S.4 Continental A.G. 6500 Germany
5 Pirelli & C. S.p.A. 5500 Italy6 Sumitomo Rubber Industries Ltd. 4600 Japan7 Yokohama Rubber Co. Ltd. 4000 Japan8 Hankook Tire Co. Ltd. 3800 Korea9 Cooper Tire & Rubber Co. 2800 U.S.
10 Maxxis International / Cheng Shin Rubber
2700 Taiwan
240.000
250.000
260.000
270.000
2005 2006 2007 2008 2009 2010*
9.000 10.000 11.000 12.000 13.000 14.000 15.000
2005 2006 2007 2008 2009 2010*

8
VEHIClE DATA
Vehicle parc on the European market
Vehicle sales on the European market
Passenger car parc
Truck parc
Passenger car sales
West Europe
East Europe
Total Europe 20.000 70.000
120.000 170.000 220.000 270.000
2007 2008 2009
0
2.000
4.000
6.000
2007 2008 2009
West Europe
East Europe
Total Europe
0 5.000
10.000 15.000 20.000
2007 2008 2009
West Europe
East Europe
Total Europe
LMC
LMC
LMC, CCFA
2007 2008 2009
West Europe 232.820 234.969 236.679
East Europe 30.198 31.311 31.999
Total Europe 263.018 266.280 268.678
2007 2008 2009
West Europe 3.665 3.677 3.559
East Europe 830 848 845
Total Europe 4.495 4.525 4.404
2007 2008 2009 8 months 2010
West Europe 16.857 15.380 14.966 n.a.
East Europe 1.254 1.247 945 n.a.
Total Europe 18.111 16.627 15.911 9.022
000 units
000 units
000 units
000 units
000 units
000 units
0
200
400
600
2007 2008 2009
West Europe
East Europe
Total Europe
0
200
400
600
2007 2008 2009
West Europe
East Europe
Total Europe
0
200
400
600
2007 2008 2009
West Europe
East Europe
Total Europe

9
Vehicle production on the European market
Truck sales
Passenger car production
Truck production
0
200
400
600
2007 2008 2009
West Europe
East Europe
Total Europe
0 5.000
10.000 15.000 20.000
2007 2008 2009
West Europe
East Europe
Total Europe
0
200
400
600
800
2007 2008 2009
West Europe
East Europe
Total Europe
LMC, CCFA
LMC, ACEA
LMC, ACEA
000 units
000 units
000 units
2007 2008 2009 8 months 2010
West Europe 376 370 218 n.a.
East Europe 64 57 23 n.a.
Total Europe 440 427 241 113
000 units
2007 2008 2009 8 months 2010
West Europe 16.110 14.579 11.981 n.a.
East Europe 2.833 2.965 2.918 n.a.
Total Europe 18.943 17.544 14.899 4.306
000 units
2007 2008 2009 8 months 2010
West Europe 566 576 227 n.a.
East Europe 13 24 14 n.a.
Total Europe 579 600 241 7
000 units
0
200
400
600
2007 2008 2009
West Europe
East Europe
Total Europe
0
200
400
600
2007 2008 2009
West Europe
East Europe
Total Europe
10
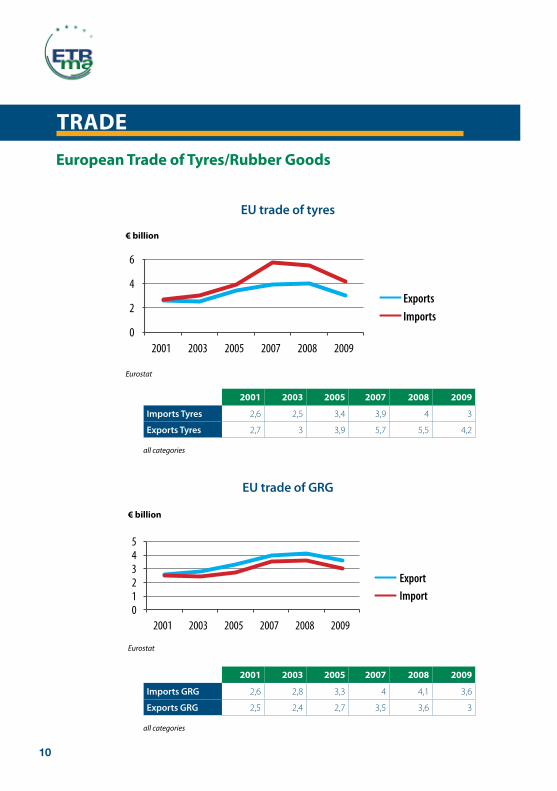
TRADE
European Trade of Tyres/Rubber Goods
EU trade of tyres
EU trade of GRG
0
2
4
6
2001 2003 2005 2007 2008 2009
Exports
Imports
0 1 2 3 4 5
2001 2003 2005 2007 2008 2009
Export
Import
Eurostat
all categories
all categories
Eurostat
2001 2003 2005 2007 2008 2009
Imports Tyres 2,6 2,5 3,4 3,9 4 3
Exports Tyres 2,7 3 3,9 5,7 5,5 4,2
2001 2003 2005 2007 2008 2009
Imports GRG 2,6 2,8 3,3 4 4,1 3,6
Exports GRG 2,5 2,4 2,7 3,5 3,6 3
€ billion
€ billion
11
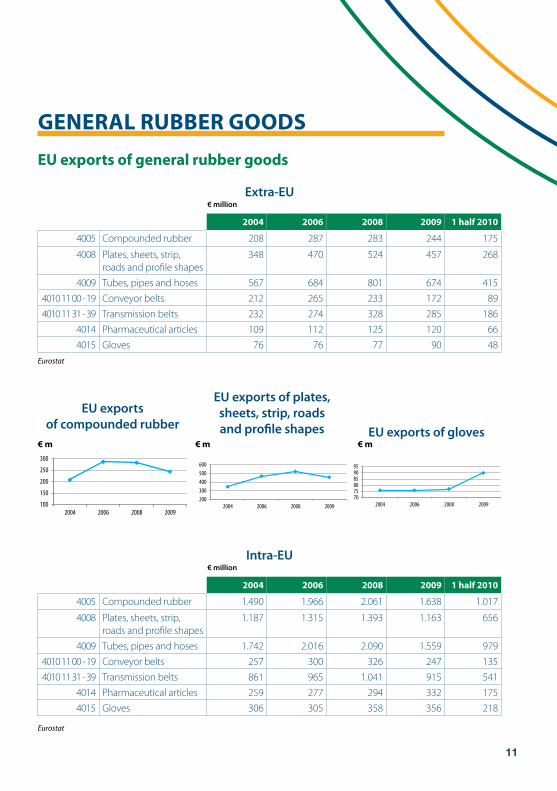
GENERAl RubbER GooDs
Eu exports of general rubber goods
EU exports of compounded rubber
EU exports of plates,sheets, strip, roadsand profile shapes EU exports of gloves
Extra-EU
Intra-EU
100
150
200
250
300
2004 2006 2008 2009
200 300 400 500 600
2004 2006 2008 2009 70 75 80 85 90 95
2004 2006 2008 2009
Eurostat
Eurostat
€ million
€ million
2004 2006 2008 2009 1 half 2010
4005 Compounded rubber 208 287 283 244 175
4008 Plates, sheets, strip, roads and profile shapes
348 470 524 457 268
4009 Tubes, pipes and hoses 567 684 801 674 415
4010 11 00 - 19 Conveyor belts 212 265 233 172 89
4010 11 31 - 39 Transmission belts 232 274 328 285 186
4014 Pharmaceutical articles 109 112 125 120 66
4015 Gloves 76 76 77 90 48
2004 2006 2008 2009 1 half 2010
4005 Compounded rubber 1.490 1.966 2.061 1.638 1.017
4008 Plates, sheets, strip, roads and profile shapes
1.187 1.315 1.393 1.163 656
4009 Tubes, pipes and hoses 1.742 2.016 2.090 1.559 979
4010 11 00 - 19 Conveyor belts 257 300 326 247 135
4010 11 31 - 39 Transmission belts 861 965 1.041 915 541
4014 Pharmaceutical articles 259 277 294 332 175
4015 Gloves 306 305 358 356 218
€ m € m € m
12
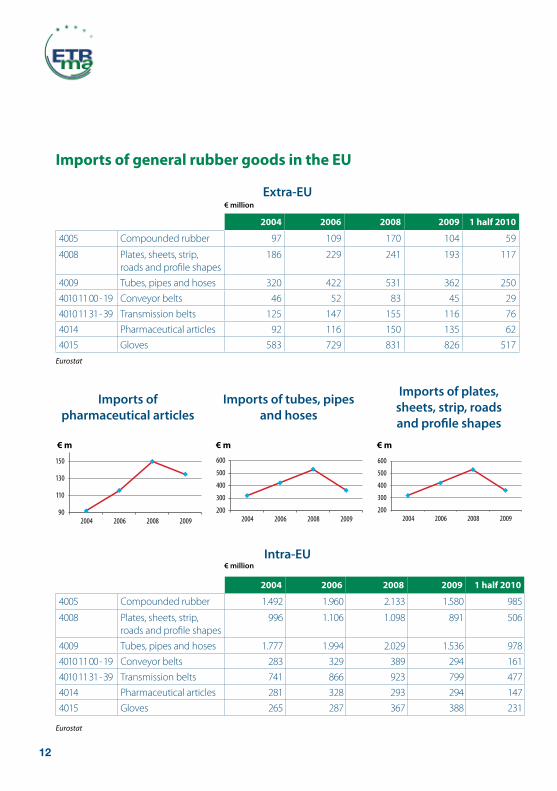
Extra-EU
Eurostat
2004 2006 2008 2009 1 half 2010
4005 Compounded rubber 97 109 170 104 59
4008 Plates, sheets, strip, roads and profile shapes
186 229 241 193 117
4009 Tubes, pipes and hoses 320 422 531 362 250
4010 11 00 - 19 Conveyor belts 46 52 83 45 29
4010 11 31 - 39 Transmission belts 125 147 155 116 76
4014 Pharmaceutical articles 92 116 150 135 62
4015 Gloves 583 729 831 826 517
Imports of general rubber goods in the Eu
Intra-EU
Eurostat
2004 2006 2008 2009 1 half 2010
4005 Compounded rubber 1.492 1.960 2.133 1.580 985
4008 Plates, sheets, strip, roads and profile shapes
996 1.106 1.098 891 506
4009 Tubes, pipes and hoses 1.777 1.994 2.029 1.536 978
4010 11 00 - 19 Conveyor belts 283 329 389 294 161
4010 11 31 - 39 Transmission belts 741 866 923 799 477
4014 Pharmaceutical articles 281 328 293 294 147
4015 Gloves 265 287 367 388 231
Imports of plates,sheets, strip, roadsand profile shapes
Imports of pharmaceutical articles
Imports of tubes, pipes and hoses
90
110
130
150
2004 2006 2008 2009 200
300
400
500
600
2004 2006 2008 2009 200
300
400
500
600
2004 2006 2008 2009
€ million
€ million
€ m € m € m
13
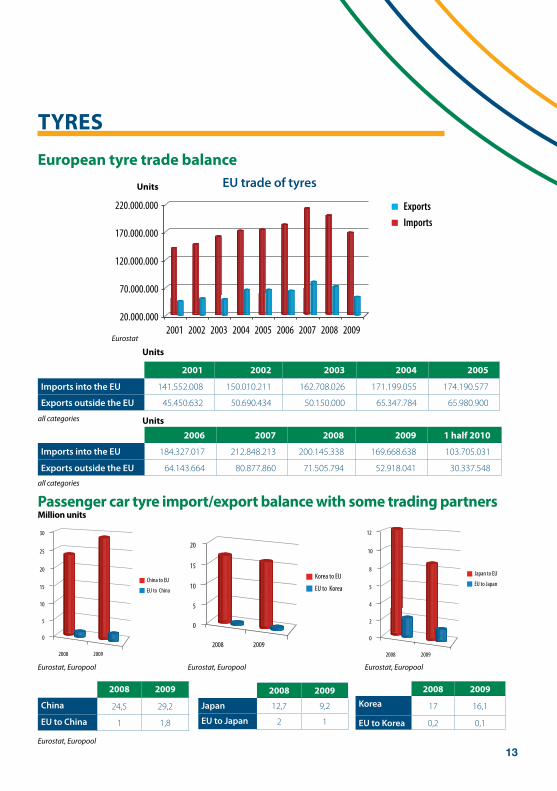
European tyre trade balance
TYREs
EU trade of tyres
20.000.000
70.000.000
120.000.000
170.000.000
220.000.000
2001 2002 2003 2004 2005 2006 2007 2008 2009
Exports
Imports
Eurostat
all categories
all categories
Eurostat, Europool
Eurostat, Europool Eurostat, Europool Eurostat, Europool
2001 2002 2003 2004 2005
Imports into the EU 141.552.008 150.010.211 162.708.026 171.199.055 174.190.577
Exports outside the EU 45.450.632 50.690.434 50.150.000 65.347.784 65.980.900
2006 2007 2008 2009 1 half 2010
Imports into the EU 184.327.017 212.848.213 200.145.338 169.668.638 103.705.031
Exports outside the EU 64.143.664 80.877.860 71.505.794 52.918.041 30.337.548
2008 2009
China 24,5 29,2
EU to China 1 1,8
units
units
units
passenger car tyre import/export balance with some trading partnersMillion units
0
5
10
15
20
25
30
2008 2009
China to EU
EU to China
0
5
10
15
20
2008 2009
Korea to EU
EU to Korea
0
2
4
5
8
10
12
2008 2009
Japan to EU
EU to Japan
2008 2009
Korea 17 16,1
EU to Korea 0,2 0,1
2008 2009
Japan 12,7 9,2
EU to Japan 2 1

14
Eu trade of tyres with China(CN 4011)
Comparison of imports from China into the Eu in 2009 and 2010
FoCus oN TRADE WITH KEY pARTNERs
EU-China Tyre trade balance
EU
China
0 100 200 300 400 500 600 700 800 900
1000
2000 2002 2004 2006 2008 2009 1. Q 2010
2009
Jan
4
3,5
3
2,5
2
1,5
1
0,5
0March May July
2010
EU
China
0
10000
20000
30000
40000
50000
60000
2000 2002 2004 2006 2008 2009 1. Q 2010
EU-China Tyre trade balance
Eurostat Eurostat
€ million
Million units
000 units
2000 2002 2004 2006 2008 2009 1. Q 2010
India 119 158 315 638 953 882 273
EU 3 14 18 45 66 93 30
2000 2002 2004 2006 2008 2009 1. Q 2010
India 20239 33327 43623 50438 58141 54309 17597
EU 18 199 271 854 1114 1703 621
€ million
000 units
Imports of Car and Light Truck Tyres from China increased in the 1st semester 2010 by 55% from 11,9 to 18,5 million Tyres. Total projection for 2010 would be from 29.2 to 45,0. Imports of Truck Tyres increased by 55% from 0,45 to 0,7 million units.
Eurostat

15
India
EU
0 20 40 60 80
100 120 140 160
2000 2002 2004 2006 2008 2009 1. Q 2010
0 2000 4000 6000 8000
10000 12000
2000 2002
2004 2006
2008 2009
1. Q 2010
India
EU
Eu trade of tyres with India(CN 4011)
EU-India Tyre trade balance
Eurostat
Eurostat
EU-India Tyre trade balance
€ million
000 units
2000 2002 2004 2006 2008 2009 1. Q 2010
India 16 30 49 99 160 135 41
EU 5 3 5 8 15 21 4
2000 2002 2004 2006 2008 2009 1. Q 2010
India 4296 3938 6390 6874 11310 6188 1843
EU 134 28 69 70 179 164 71
€ million
000 units
16
Korea
EU
0 100 200 300 400 500 600 700
2000 2002 2004 2006 2008 2009 1. Q 2010
Korea
EU
0
5000
10000
15000
20000
2000 2002 2004 2006 2008 2009 1. Q 2010
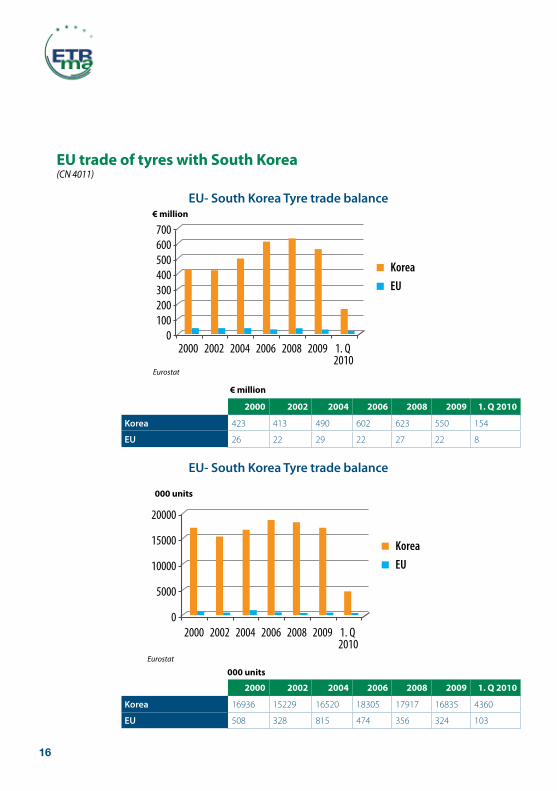
Eu trade of tyres with south Korea(CN 4011)
EU- South Korea Tyre trade balance
Eurostat
Eurostat
EU- South Korea Tyre trade balance€ million
000 units
2000 2002 2004 2006 2008 2009 1. Q 2010
Korea 423 413 490 602 623 550 154
EU 26 22 29 22 27 22 8
2000 2002 2004 2006 2008 2009 1. Q 2010
Korea 16936 15229 16520 18305 17917 16835 4360
EU 508 328 815 474 356 324 103
€ million
000 units
17
0
10
20
30
40
50
2000 2004 2008 2009
Indonesia
Thailand
Malaysia
Singapore
ASEAN
EU
Vietnam
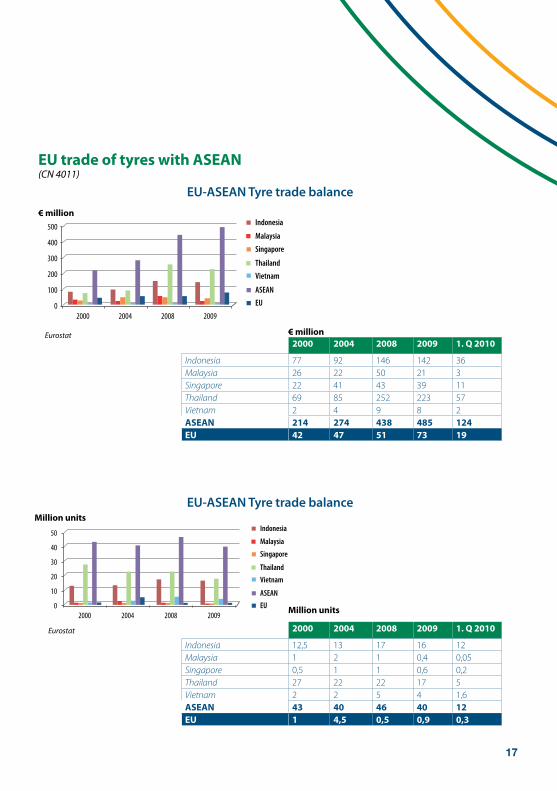
Eu trade of tyres with AsEAN(CN 4011)
EU-ASEAN Tyre trade balance
EU-ASEAN Tyre trade balance
0
100
200
300
400
500
2000 2004 2008 2009
Indonesia
Thailand
Malaysia
Singapore
ASEAN
EU
Vietnam
2000 2004 2008 2009 1. Q 2010
Indonesia 77 92 146 142 36Malaysia 26 22 50 21 3Singapore 22 41 43 39 11Thailand 69 85 252 223 57Vietnam 2 4 9 8 2AsEAN 214 274 438 485 124Eu 42 47 51 73 19
2000 2004 2008 2009 1. Q 2010
Indonesia 12,5 13 17 16 12Malaysia 1 2 1 0,4 0,05Singapore 0,5 1 1 0,6 0,2Thailand 27 22 22 17 5Vietnam 2 2 5 4 1,6AsEAN 43 40 46 40 12Eu 1 4,5 0,5 0,9 0,3
Eurostat
Eurostat
Million units
Million units
€ million
€ million
18
0
50
100
150
200
250
2000 2002 2004 2006 2008 2009 1. Q 2010
GCC
EU
0 500
1000 1500 2000 2500 3000 3500
2000 2002 2004 2006 2008 2009 1. Q 2010
GCC
EU
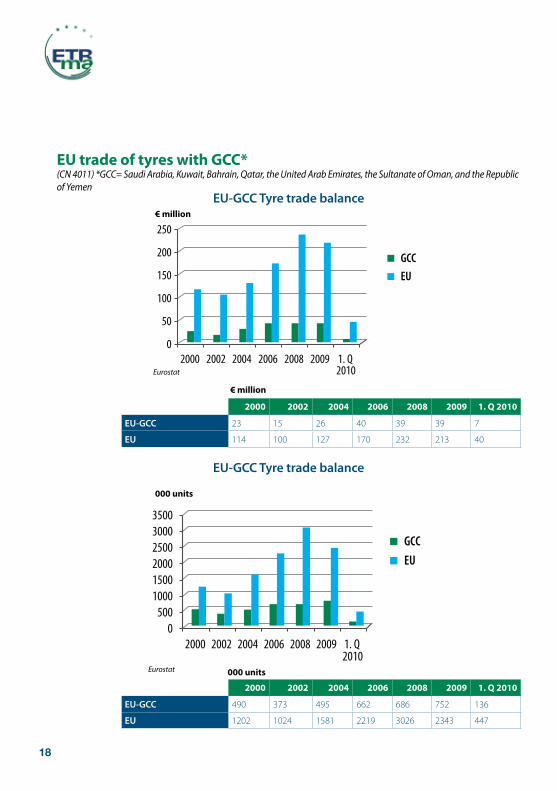
Eu trade of tyres with GCC*(CN 4011) *GCC= Saudi Arabia, Kuwait, Bahrain, Qatar, the United Arab Emirates, the Sultanate of Oman, and the Republic of Yemen
EU-GCC Tyre trade balance
Eurostat
Eurostat
EU-GCC Tyre trade balance€ million
000 units
2000 2002 2004 2006 2008 2009 1. Q 2010
EU-GCC 23 15 26 40 39 39 7
EU 114 100 127 170 232 213 40
2000 2002 2004 2006 2008 2009 1. Q 2010
EU-GCC 490 373 495 662 686 752 136
EU 1202 1024 1581 2219 3026 2343 447
€ million
000 units

19
Eurostat
0 50
100 150 200 250 300 350 400 450
2000 2002 2004 2006 2008 2009 1. Q 2010
Russia
EU
0 1000 2000 3000 4000 5000 6000 7000 8000 9000
10000
2000 2002 2004 2006 2008 2009 1. Q 2010
Russia
EU
Eu trade of tyres with Russia(CN 4011)
EU-Russia Tyre trade balance
Eurostat
EU-Russia Tyre trade balance
€ million
000 units
2000 2002 2004 2006 2008 2009 1. Q 2010
Russia 26 30 34 94 105 149 30
EU 65 99 200 239 440 173 53
2000 2002 2004 2006 2008 2009 1. Q 2010
Russia 752 790 1000 2476 1864 3055 599
EU 1545 2435 4412 5519 9004 3078 1005
€ million
000 units
20
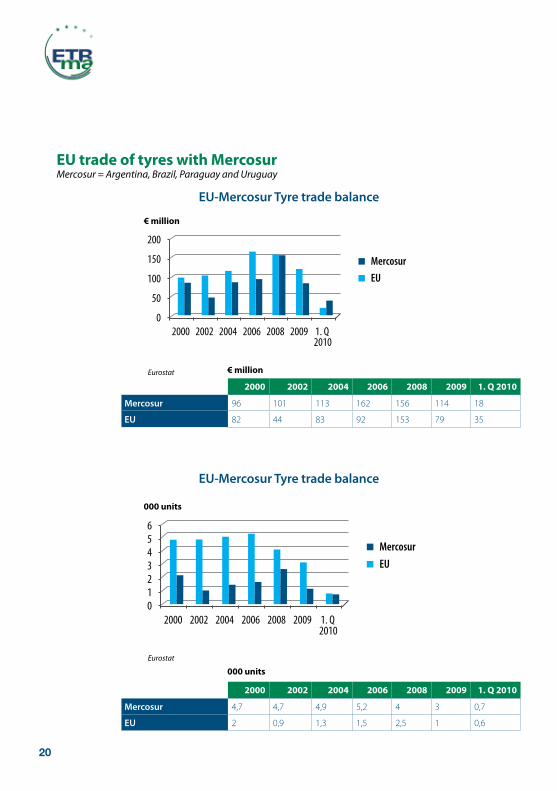
Eu trade of tyres with MercosurMercosur = Argentina, Brazil, Paraguay and Uruguay
EU-Mercosur Tyre trade balance
Mercosur
EU
0
50
100
150
200
2000 2002 2004 2006 2008 2009 1. Q 2010
0 1 2 3 4 5 6
2000 2002 2004 2006 2008 2009 1. Q 2010
Mercosur
EU
2000 2002 2004 2006 2008 2009 1. Q 2010
Mercosur 96 101 113 162 156 114 18
EU 82 44 83 92 153 79 35
2000 2002 2004 2006 2008 2009 1. Q 2010
Mercosur 4,7 4,7 4,9 5,2 4 3 0,7
EU 2 0,9 1,3 1,5 2,5 1 0,6
Eurostat
Eurostat
EU-Mercosur Tyre trade balance
€ million
€ million
000 units
000 units

21
Eu Natural Rubber and synthetic Rubber consumption 2009
Worldwide rubber consumption000 tonnes
RubbER CoNsuMpTIoN
31%
69%
NR
SRTyre
GRG
79%
21%
Tyre
GRG43%
57%
IRSG
IRSG
IRSG
IRSG
EU rubber consumption in 2009 NR consumption by Sector
SR consumption by Sector
2008 2009 2010 2011 2012 2013 2014
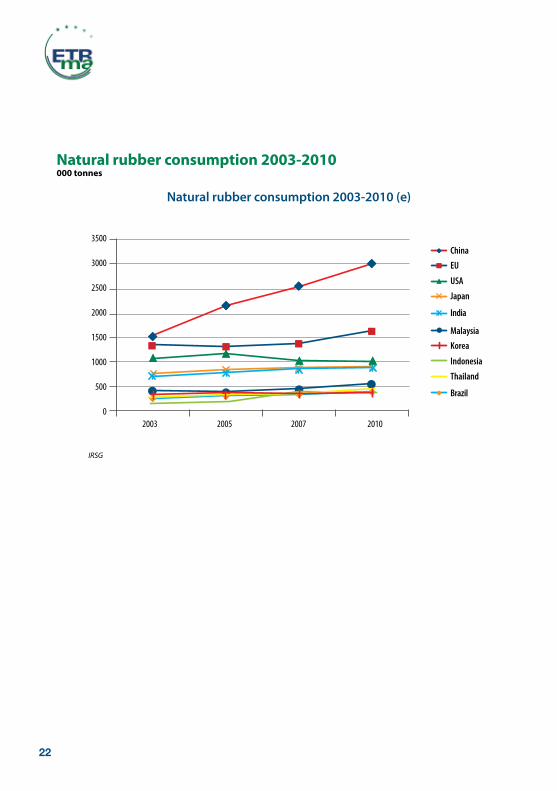
North America 3077 2395 2761 3010 3077 3092 3067
Latin America 1417 1215 1379 1478 1538 1581 1615
Europe, excluding Russia 4251 3129 3543 3870 4095 4195 4214
Russia 572 399 476 560 615 647 675
China 6420 7726 8662 9064 9609 10173 10715
Japan 2016 1468 1726 1814 1867 1912 1932
India 1175 1252 1361 1458 1560 1653 1726
Other Asia 3348 3256 3433 3637 3786 3880 3933
Middle East/Africa 389 325 352 369 377 375 367
WORLD 22776 21145 23674 25241 26504 27487 28225
22
Natural rubber consumption 2003-2010000 tonnes
2003
3500
3000
2500
2000
1500
1000
500
02005 2007 2010
China
EU
USA
Japan
India
Malaysia
Korea
Indonesia
Thailand
Brazil
IRSG
Natural rubber consumption 2003-2010 (e)

23
Tyre manufacturing facilities in Europe

24
Avenue des Arts 2 box 12 • B-1210 Brussels
Tel. +32 2 218 49 40 • Fax: +32 2 218 61 62
[email protected] • www.etrma.org


