The Euro’s Three Crises Brookings Papers on Economic Activity Spring 2012 March 12 th 2012 Jay C. Shambaugh McDonough School of Business, Georgetown University and NBER abstract: The euro area faces three interlocking crises that together challenge the viability of the currency union. There is a banking crisis – where banks are undercapitalized and have faced liquidity problems. There is a sovereign debt crisis – where a number of countries have faced rising bond yields and challenges funding themselves. Lastly, there is a growth crisis – with both a low overall level of growth in the euro area and an unequal distribution across countries. Crucially, these crises connect to one another. Bailouts of banks have contributed to the sovereign debt problems, but banks are also at risk due to their holdings of sovereign bonds that may face default. Weak growth contributes to the potential insolvency of the sovereigns, but also, the austerity inspired by the debt crisis is constraining growth. Finally, a weakened banking sector holds back growth while a weak economy undermines the banks. This paper details the three crises, their interconnections, and possible policy solutions. Unless policy responses take into account the interdependent nature of the problems, partial solutions will likely be incomplete or even counterproductive.
Transcript
The Euro’s Three Crises
Brookings Papers on Economic Activity Spring 2012
March 12th
2012
Jay C. Shambaugh
McDonough School of Business, Georgetown University
and NBER
abstract: The euro area faces three interlocking crises that together challenge the viability of the
currency union. There is a banking crisis – where banks are undercapitalized and have faced liquidity
problems. There is a sovereign debt crisis – where a number of countries have faced rising bond yields
and challenges funding themselves. Lastly, there is a growth crisis – with both a low overall level of
growth in the euro area and an unequal distribution across countries. Crucially, these crises connect to
one another. Bailouts of banks have contributed to the sovereign debt problems, but banks are also at
risk due to their holdings of sovereign bonds that may face default. Weak growth contributes to the
potential insolvency of the sovereigns, but also, the austerity inspired by the debt crisis is constraining
growth. Finally, a weakened banking sector holds back growth while a weak economy undermines the
banks. This paper details the three crises, their interconnections, and possible policy solutions. Unless
policy responses take into account the interdependent nature of the problems, partial solutions will
likely be incomplete or even counterproductive.
1
I. Introduction1:
The prospect of a breakup of the euro is increasingly viewed as possible. The online betting
market intrade currently suggests the probability that a country currently using the euro will leave the
euro area by the end of 2013 is roughly 40% and these odds peaked at over 65% as recently as
November 2011 (see figure 1). Recently, the head of the European Central Bank (ECB) has
acknowledged the possibility of some country ceasing to use the euro. He did so critically, arguing
leaving the euro would have serious negative consequences, but this is a shift in rhetoric from simply
calling a break-up an absurd notion.2 In short, the euro area is not merely in a period of slow growth
attempting to recover from a financial crisis; it is in a full-fledged crisis at present. In fact, this paper
will argue the euro area is really in three crises. All three are difficult to solve, but crucially, all are
interdependent, such that a solution to one crisis will prove undone by the others unless all three are
resolved.
The euro area is currently involved in a banking crisis, where banks face a capital shortfall,
interbank liquidity is restrained, and future losses are uncertain. It faces a sovereign debt crisis, where
at least one country (Greece) will not pay its debts in full, and bondholders are displaying increasing
concern about other sovereigns. It also, though, faces a macroeconomic crisis, where slow growth and
relative uncompetitiveness in the periphery add to the burden of some of the indebted nations. This
last crisis is one primarily about the level and distribution of growth within the euro area. Current
account deficits in peripheral economies leading into the crisis were a symptom of credit booms and a
growing disparity in competitiveness within the euro area. These gaps grew over a decade and will be
very hard to reverse quickly with no changes in exchange rates across member states possible, helping
hold back growth in the periphery.
1 I thank the editors and discussants for extremely helpful feedback at early stages of the paper. I also thank Maury
Obstfeld, Olivier Blanchard, and Philip Lane as well as the political economy working lunch at Georgetown for comments.
Disclosure: I am a part-time visiting scholar at the IMF, but the views expressed should in no way be attributed to the IMF. 2 See for example, “Draghi warns on eurozone break-up” Financial Times, 12-18-2011. The next week, though, Draghi
made clear he believed the euro was permanent, “I have no doubt whatsoever about the strength of the euro, about its
permanence, about its irreversibility. Let's not forget, this was a key word at the time of the Maastricht treaty. The one
currency is irreversible." Again, though, the very need for the head of the ECB to discuss the permanence of the euro in
front of the European Parliament shows the stresses on the system.
2
The crises are interlinked as the sovereign debt holdings of the banks suggest that if the stressed
sovereigns (this paper will use the acronym GIPSI to refer to Greece, Ireland, Portugal, Spain, and
Italy) cannot pay their debts, the banking system is insolvent. At the same time, though, attempts at
austerity due to sovereign stress are slowing growth. Without growth – especially in the stressed
sovereigns – it is likely that the sovereign debt crisis will persist. To complete the circle, continued
troubles for the banks could bankrupt certain sovereigns who would struggle under the weight of
supporting their banks, and a broken credit channel can be a constraint on growth. (Figure 2 shows the
circular nature of the three crises).
The creation of the euro meant that boundaries that used to keep problems in one country have
been erased. It also meant, though, that some of the tools available to solve problems at the national
level are gone. In some cases, the tools to solve the issues at the supranational level have either not
been developed or have not been used. This puts extreme stress on individual countries facing a shock
and puts others at risk as they have less capacity to insulate themselves. When the global financial
crisis was initially under way, some observers argued that the euro area was weathering the storm
relatively well, and in fact, if anything, the euro was more stable now than before as countries had seen
the damage that can accrue facing a financial crisis as a small open economy with an independent
currency.3 In the next two years of the crisis, though, Europe and the euro in particular have moved to
center stage of the crisis.4
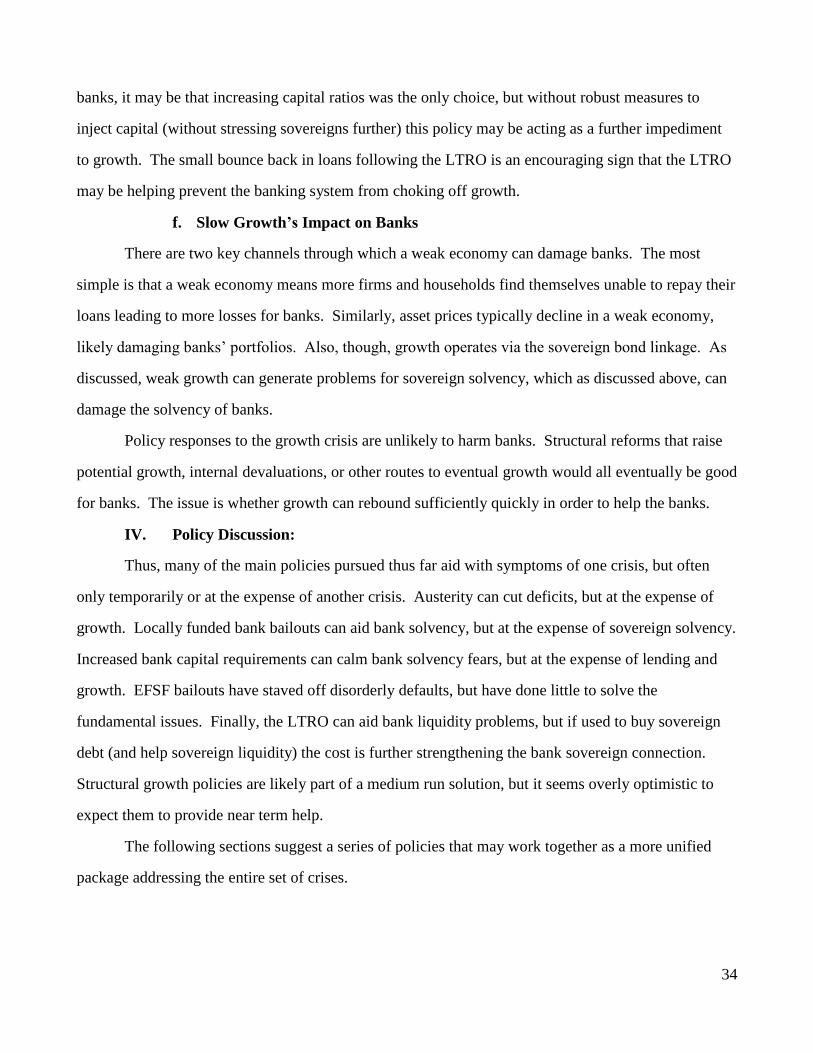
Many of the policy approaches have been limited to particular symptoms of individual crises:
nation states bailing out a banking system, austerity to balance budgets, massive liquidity allowing
banks to buy more sovereign debt. Often though, these policies have the potential to make matters
worse. In particular, the growth crisis has often received insufficient attention (especially the question
of short run growth). Recent liquidity provision by the ECB may be an important step towards a
broader solution, but a more comprehensive solution is needed.
3 See for example the introduction and some essays in Alesina and Giavazzi (2010).
4 Google searches for “financial crisis” spiked rapidly in September 2008, and these searches continued to dominate “euro
crisis” for 2 more years. In May of 2010, though, the first hints of trouble are reflected in a surge of euro crisis searches,
and by the end of 2011, there were roughly the same number of searches for “euro crisis” as “financial crisis”.
3
The challenges in responding to these three crises reflect difficulties of having a monetary
union of somewhat disparate economies without political and economic institutions to manage various
shocks. The euro area lacks sufficient institutions to deal with banking problems at the supranational
level (that is, at the level of the entire euro area instead of at the national level). It lacks a unified debt
market and as such, investors who want to hold euro area debt to must pick and choose amongst
various national debt issues, making a possible default of one of the nation states more consequential
than a default by a state or province within a country. Most importantly, it lacks the ability to manage
shocks that hit different parts of the euro area economy differently. This last feature – the lack of
shock absorbers to handle asymmetric shocks – is not a new revelation. It has been a persistent
concern of economists who have questioned whether the euro area is really what economists would
call an “optimal currency area,” an area that should logically have one currency. Institutional change
that fixes at least the first two problems (the last is much more difficult) are likely to be more helpful to
the functioning of the currency union than a fiscal compact that simply places limits on deficits.
In this paper, I describe the three crises affecting the euro area and their relationships with a
particular emphasis on the way in which the macroeconomic growth and competitiveness challenges
may undermine any efforts that focus on the liquidity concerns of the banks and sovereigns. The lack
of tools for adjustment at the national level, and the difficulty and high cost of adjustment via “internal
devaluation” make any solution that ignores the growth and competitiveness problem doomed to fail.
The paper will not provide a blow by blow of every event in the last two years. They are too numerous
and ever changing. Instead, it will try to lay out a general framework for evaluating the current crises.
Given its importance to the world economy, the current crisis in the euro area has attracted a
great deal of attention in academic, policy, and media circles. For example, Roubini (2011a, 2011b)
has written in various outlets how the euro project is unlikely to survive, often emphasizing the
problems of long run external imbalances and the need for growth in the periphery. Wolf (2011, 2012)
and Krugman(2012a, 2012b) have also emphasized problems with austerity, the need for growth to
escape the crisis, and the importance of current account imbalances across countries. The euro-nomics
group (2011) (academics from various euro nations providing policy advice) have dubbed the
connection between banks and sovereigns the diabolical loop. Eichengreen (2012) highlights the joint
4
nature of the banking and sovereign crises and notes the connection from austerity to growth. This
paper will try to add to this rapidly growing and changing literature by providing evidence as to how
the three crises are interlinked and the special policy challenges this generates.
II. The Three Crises
a. The Banking Crisis in the Euro Area
i. Euro Area Banks
The banking system in the euro area – and in the EU more broadly – is both large and global.
Total assets of the banking system as a share of the overall economy were over 300% in the euro area
in 2007 and under 100% in the United States. Data comparability is not perfect, and some have argued
that a proper figure would show the two systems to be closer to the same size.5 The large size of the
banking system, relative to other parts of the financial system, highlights another important fact: firms
in the euro area relies more on the banking system for financing than American firms (who are more
likely to use capital markets directly), making the health of the banking system particularly important
in Europe. Furthermore, the largest individual banks in the U.S. and Europe are roughly the same size,
and thus the largest euro-area banks are roughly the same share of euro area GDP as the U.S. banks are
of U.S. GDP, but this implies the largest euro area banks are a much larger share of any individual
national economy in the euro area. ING bank in the Netherlands is smaller than a number of U.S.
banks, but given that the Netherlands economy is roughly 5% the size of the U.S. economy, it is huge
relative to its home economy. In fact, ING has more assets than the entire GDP of its host country; no
U.S. bank has more than 1/8th
. It is massive relative to the economy of the government that would be
responsible to help it in times of distress.
In addition to being large as a share of GDP, these banks are highly global in their orientation
(see McGuire and von Peter 2009 or Shin 2012). The global and trans-European nature of the banks is
part of why they can be so large as a share of GDP, but also makes the national supervision and
backing of the banks all the more problematic.
5 U.S. data are for commercial banks and thus do not include money market funds, commercial paper markets, and other
non-bank parts of the U.S. financial system. As this “shadow banking” system is larger in the United States than in Europe,
this can make a fair comparison of EU and U.S. banking systems difficult.
5
ii. The Nature of Bank Crises
Banks typically fund themselves with short term liabilities, demand deposits being the ultimate
short term liability as they can be withdrawn at any time. Banks take these funds and invest them by
making loans or holding securities. Thus, they are constructed in a way that leaves them vulnerable to
a bank run, where depositors or other providers of short term funds withdraw deposits or refuse to roll
over short term credit. If a bank has lost money on loans or investments, it may become insolvent –
where it owes more money to depositors and other creditors than its assets are worth. Because
information is imperfect, depositors or other creditors have difficulty knowing if a bank is in fact
solvent. If they fear a problem, they may try to withdraw their funds before the bank defaults. If too
many short term creditors withdraw funds at once, even a healthy bank may have trouble meeting the
demand for funds as many of its assets are loans or other securities that are hard to liquidate quickly.6
Far from being a flaw in the design of the banking system, this is part of the nature of banks: providing
a liquidity service and channeling funds from savers who may want access to their money to borrowers
who need funds over longer horizons.7
Thus, problems in a banking sector can either be those of liquidity – where solvent banks
cannot get funds – or of solvency – where banks simply do not have assets of enough value to pay off
creditors. The dividing line can blur, though, if due to liquidity pressure, a bank is forced to sell assets
for “fire sale” prices or borrow at cripplingly high rates to replace funds that had been provided more
cheaply until the crisis. In these cases, an institution that was illiquid may become insolvent. In a
liquidity crisis, a central bank can stand in as a “lender of last resort” providing funds that the market is
unwilling or unable to provide. If a bank becomes truly insolvent, it may need to wound down with
losses that must be taken, either by the equity investors of a bank, the creditors, taxpayers, or some
combination. If instead, there is simply a threat of insolvency, it may be that an injection of capital
could guarantee solvency by providing the bank a bigger cushion against losses. This still imposes
6 While a classic bank run by depositors is in many ways forestalled by deposit insurance, other sources of funds – such as
repurchase agreements – are still vulnerable to bank run like behavior. 7 See Diamond and Dybvig (1983) for the classic treatment of the problem of a bank run and the structure of the banking
system.
6
losses on equity holders (as their share of owning the bank is diluted) and possibly costs to taxpayers
(if the injection comes from public funds).
Despite the uptick in global banking activity, bank supervision and resolution of banking
solvency problems is still primarily a national activity – even in the euro area where funds can flow
freely in the same currency across borders. The creation of the European Banking Authority has
centralized some functions, but supervision and especially fiscal support is still at the national level.
The provision of liquidity, though, is a central bank activity as only the central bank can instantly
create as much liquidity as needed. In theory, this leaves the role of liquidity provision to banks to the
ECB – a euro area wide institution – but the ECB has no statutory responsibility to serve as the lender
of last resort. It can act as one but is not formally charged with the responsibility (Obstfeld, 1998).
iii. The Bank Crisis of 2007-??
In 2007, liquidity problems surfaced in both the United States and in Europe. U.S. house prices
had started to decline and assets that were tied to U.S. mortgages became questionable in value. It
became increasingly difficult for banks to borrow as there was uncertainty regarding the quality of
their assets.8 One indicator of the difficulty of banks finding funds can be seen in a basic indicator of
financial stress, the difference between the rate banks charge one another for short term funds in
comparison to a “safe” overnight rate. Figure 3 shows this spread for the euro banking market. One
sees an increase in the summer of 2007, followed by another increase in the spring of 2008 after Bear
Sterns collapsed, followed by an extreme spike in the fall of 2008 after the failure of Lehman Brothers.
The pattern is similar for U.S. or UK banking markets.
Central banks stepped in to solve these problems in a number of ways. First, they cut the
interest rates they charged banks to borrow, second, many central banks dramatically increased the
amount of assets they held on their own balance sheet and the volume of loans they made to the
banking sector. Finally, due to the particular difficulties of non-U.S. banks that needed dollar funds
(because they had borrowed short term in dollars and held illiquid U.S. assets), central banks arranged
8 See Fender and Gyntleberg (2008) for a real time discussion of the progression of the liquidity crunch and Gorton (2008)
for a description of how bank and non-bank funding problems led to a bank-run like crunch in liquidity. Housing bubbles
also built in a number of EU countries as well, leaving some euro area banks exposed to their own real estate markets as
well.
7
a number of “liquidity swaps” where the Federal Reserve provided funds in dollars to other central
banks that then provided collateral to the Federal Reserve. This allowed the ECB and other non-U.S.
central banks to provide funds in dollars directly to their banks that needed them.9
The initial response of the ECB differed somewhat from those of other major central banks.
While the ECB eventually did cut rates like its counterparts, it did not cut rates in response to the initial
funding problems in the summer of 2007 and in fact raised rates in July of 2008 before cutting them
following Lehman’s collapse. It also did not dramatically increase the assets it was holding. That is, it
did not dramatically increase the size of its own balance sheet in the first few years of the crisis. Early
on, one might argue that given the focus on U.S. asset markets, this was understandable, but over time,
as euro area banks continued to face problems, the ECB did not increase its balance sheet more until
the end of 2011 (discussed later). Figure 4 shows comparative central bank responses of the Federal
Reserve and ECB. The ECB increased the size of its balance sheet moderately at the peak of the crisis
and then held at that level, with its assets rising by 39% between August 2008 and August 2011. That
paled in comparison to the actions of the Federal Reserve, though; the Fed’s assets increased nearly
210% in that time. Despite the different responses, as can be seen in figure 3, the initial liquidity crush
on banks did calm down. Rates charged in interbank markets returned to more normal levels.
The bank crisis was not settled, though. The losses that helped trigger liquidity problems also
helped generate solvency problems. Euro area banks required a series of bailouts and guarantees and
continue to struggle with undercapitalization. These issues and the way in which the bank crisis and
problems in sovereign debt markets are linked are discussed in sections III.b. and III.c. below.
b. The Sovereign Debt Crisis
i. Recent pressure in sovereign debt markets
The sovereign debt crisis in the euro area has gone through a number of acute phases where the
yields on some euro area government bonds jumped to very high levels. In particular, market
participants tend to focus on the difference (or spread) between the various countries’ bonds and those
9 In this transaction, the Federal Reserve takes on no risk from other country’s banking system – just from the other central
bank - and holds collateral from the other central bank and a guarantee to re-swap currency at the same exchange rate as
well. See Obstfeld et al (2008) for early analysis.
8
of Germany’s as an indicator of the stress in the sovereign debt market. Investors might demand a
different interest rate on the bonds from two countries for two different reasons. First, if one currency
is expected to strengthen against the other, then the asset in the strengthening currency will be worth
more over time and investors would be willing to hold it even if it pays a lower interest rate.
Alternatively, investors may worry that the government will default, that is, simply not repay its debt.
If the chance of default differs between two countries, the country more likely to default will have to
pay a higher interest rate to compensate investors for the risk.
Figure 5 shows interest rates on long term government debt over the last two decades. The
influence of the euro is unmistakable. Prior to the introduction of the euro, interest rates across future
euro members showed wide gaps. As the possibility of changes in currencies was removed and an
assumption that no euro area country would default was built in, the spreads went to zero. As Greece
joined the euro in 2001 (not 1999), its interest rate converged slightly later than the other members.
Interest rate gaps did not reappear until the crisis. The first year of the crisis still had relatively low
spreads (Figure 6 focuses on spreads in the recent period). In 2010, though, spreads began to grow,
first for Greece, and then for a number of other countries. In many cases, a policy announcement by
euro area policy makers has calmed markets and brought spreads down, but they have reappeared time
and again.
Because a default means a country cannot pay back its borrowing, the sovereign debt crisis in
the euro area is often viewed through the lens of fiscal profligacy. This tendency is heightened by the
fact that the first country to experience pressure in the markets was Greece, and Greece’s problems
have centered around problems with spending and inaccurately reported government finances. In this
conception, the root cause is irresponsible fiscal policy, all that is needed is to ratchet down deficits via
austerity, and if budgets cannot be balanced immediately, some short term financing from other
governments or the IMF may be needed. Section IIIa. considers the causes of the sovereign debt crisis
in more detail and challenges this view of the sovereign debt crisis.
ii. The nature of debt sustainability
The basic equation for debt sustainability is that:
(1) ΔDt = (Rt-gt)*Dt-1 + primary
9
Where D is the debt to GDP ratio, R is the nominal interest rate, g is the nominal growth rate, and
primary represents the primary (non interest) budget deficit scaled to GDP. The intuition is that this
year’s debt scaled to GDP is the same as last year’s (the debt we still owe) plus interest plus any new
borrowing (or saving) beyond interest, minus the degree to which GDP (the denominator) grows to
offset increases in the debt (the numerator). If the interest rate paid on the outstanding debt is greater
than the growth rate of the economy, even if the primary (not including interest) portion of the budget
is in balance, debt as a share of GDP will grow. Importantly, the converse holds. Even a country with
a primary budget deficit of 2% of GDP could have a shrinking debt to GDP ratio if the growth rate of
the economy exceeds the interest rate by a sufficient amount. The larger the stock of outstanding debt,
the more important the interest rate and growth rate will be. A country with high debt (roughly 100%
of GDP) that cuts its government spending will face an increasing debt to GDP ratio the following year
if the multiplier on government spending is at least 1. A higher multiplier (or higher debt to GDP
ratio) will generate an even bigger effect.10
In this sense, a sovereign debt crisis can act much like a bank crisis. A country that can fund
itself with low interest rates is solvent, but the very same country forced to pay a higher interest rate is
suddenly feared insolvent, even if its primary budget is in balance. Furthermore, though, low growth
can doom an otherwise solvent country to insolvency.
c. The Euro Area Growth Crisis
i. The Current Slowdown and Gaps in Performance
The euro area, along with most of the world emerged from recession in 2009. Growth started
again, and at various points in time, the euro area appeared to be recovering from the financial crisis
more quickly than the U.S. or Japan. Even as recovery for the area overall proceeded, though, there
was evidence of a problem with the distribution of growth across the currency union. Euro area
economic sentiment (a combination of consumer and business confidence reported by the European
10
The precise impact will depend on the initial growth rate, the interest rate, and whether the interest rate in anyway
responds to the budget cuts. If the cuts are permanent, and only have a growth impact in the first year, then over time the
debt to GDP ratio will be improved by making cuts, but in the first year, they may not just lower growth, but even make the
debt load worse. Cuts phased in over time can lead to a lower debt to GDP ratio despite the additional spending in the
intervening years if the multiplier is lower later in the cycle when the economy is stronger.
10
Commission) demonstrates the issue clearly (see Figure 7). At the start of the crisis, sentiment in
Germany dropped more than the average of Greece, Italy, Portugal, and Spain, and after the peak of the
crisis, sentiment rebounded relatively uniformly across the entire currency area through 2009. While
the euro area as a whole appeared to continue this steady improvement through 2010, with just a brief
slowdown around the first sovereign debt scare in the spring of 2010, the area average masked wide
disparity. German economic sentiment was rising and by September 2010 had in fact surpassed its
pre-crisis peak. The Southern tier countries in the euro, though, remained stuck at a very low level of
business and consumer confidence. By the early 2011, sentiment was falling everywhere.
This sluggish confidence is understandable given the performance of unemployment. By June
2010, the German unemployment rate was already below its pre-crisis level, and in a number of other
northern tier countries, unemployment rates were falling steadily. The euro area average, though,
remained stuck at 10% as the unemployment rates in the GIPSIs continued to climb long after the
official recession had ended. By the 4th
quarter of 2011, the euro area wide rate reached a new high as
the unemployment rate kept rising in the GIPSIs, pulling the overall euro area unemployment rate to
10.7%. It is not clear that the unemployment rate in the periphery (which includes youth
unemployment near 50% in some countries) is politically sustainable.
Weighed down by weak performance in the GIPSIs, the euro area on net is growing slowly –
just 0.7% over the four quarters of 2011. The weighted average of growth in the GIPSI countries was
roughly -1% over that time. The rest of the euro area grew roughly 1.5%. As the crisis worsened in
the countries undergoing severe austerity, the overall euro area has likely slid back into recession.
GDP contracted for the overall euro area in the 4th
quarter by more than 1% at an annual rate.
Contraction occurred not just in the GIPSI countries, but in Germany, the Netherlands, Belgium, and
Austria as well. The IMF January 2012 forecast suggests the overall euro area will contract during the
four quarters of 2012 with Spain and Italy shrinking by more than 2%. Thus, the euro area has in a
sense two aspects of a growth crisis. First, the overall area is growing too slowly to reduce
unemployment and support debt levels. Facing historically high unemployment and in the midst of a
second recession within 3 years, the overall area needs faster growth. At the same time, though, the
distribution of growth across the area is unbalanced with those economies facing pressure in bond
11
markets growing most slowly. As the previous section showed, this means these countries are quite
likely to continue to struggle with their debt burden because they need growth to become solvent.
Thus, regardless of what is done to meet their liquidity and funding needs and even if the banking
system avoids collapse, without growth in the GIPSIs, the overall crisis cannot end.
ii. Imbalances:
This imbalance of growth is often described as a problem of current account imbalances within
the euro area.11 In that conception, the chief problem in the GIPSIs is their large current account
deficits prior to the crisis and the buildup of overall debt (not just government debt), in particular debt
owed to foreigners (the external debt). The current account deficit and growth crisis are clearly linked.
The current account imbalances prior to the crisis signaled competitiveness problems in the periphery,
and the present day current account deficits are a drag on demand. In addition, the capital inflows
helped increase prices, reducing the competitiveness of the borrowing countries. Further, as prices
increase in peripheral countries, this meant their real interest rates fell relative to other euro countries,
leading to more borrowing.12 Improved exports or reduced imports could increase GDP given how far
the economies are from full employment. Further, the imbalances ahead of the crisis highlighted the
buildup of debt that now requires painful deleveraging. Blanchard and Giavazzi (2002) argued the
current account deficits (just growing at the time) may not be a problem within the euro area as they
may simply represent poorer countries with higher expected growth rates increasing their consumption
in a newly unified market. More recently, with ten more years of experience to monitor, Obstfeld
(2012) has argued policymakers should remain wary of current account deficits even within a currency
union (especially if national governments are responsible for national financial stabilization).
At the same time, while current account imbalances within a monetary union may be a
symptom of problems, they are different than those in a standalone economy. A country with a current
account deficit may face a liquidity problem if foreign investors refuse to continue lending (i.e. a
sudden stop can occur), and domestic residents may pull capital out of the economy as well, with the
11
See Wolf (2011, 2012), Krugman (2012b), and Avent (2011) for writings along these lines. 12
See Lane (2006) for a discussion of the early impacts of the introduction of the euro across countries.
12
entire economy, not just the sovereign, facing a liquidity run. This generally results in a crash of the
currency or a closing of international financial mobility.13 In the euro area, payments crises cannot
manifest as currency runs. Furthermore, money continues to flow to the borrowing countries via
internal ECB channels.14 Payments problems can still exist. If no one will lend to the banks or
government, outside aid must be sought (as in Greece, Portugal, and Ireland), but a full-fledged
currency crisis has not happened as there is no currency on which to run. Thus, in many ways, the
acute part of the imbalances is the demand side. Given the deleveraging in the private sector and the
austerity restrained fiscal policy, these countries desperately need improved current account balances
to provide extra demand.
For the peripheral economies to increase their growth based on exports (or shift consumption
towards domestic goods and away from imports), they need their relative prices to fall compared to
other goods and services on world and euro area markets.15 The within euro area comparisons are
relevant for two reasons. First, due to high levels of trade within the euro area, a substantial
percentage of GIPSI export markets are within the euro area. More importantly, the overall euro
exchange rate will fluctuate based on the overall economy of the union. If all countries in the euro area
were struggling with a lack of competitiveness on world markets, one would expect the euro to fall in
value. Competitiveness is not something intrinsic to a society or an economy, it is about relative
prices. An uncompetitive economy whose currency weakens can be suddenly competitive on world
markets overnight. The overall euro exchange rate will be determined by the overall euro area, thus, a
lack of competitiveness within the monetary union means a country will remain overvalued.
iii. Currency Area Theory and Asymmetric Shocks:
13
Insolvency for a country or entire economy, though, is more complex. One can generate an aggregate balance sheet for a
country, but it is just that: aggregate. Asset holders are not responsible for debtors and there is no direct question of
solvency. Further, many liabilities may be in the form of equity or FDI, not debt (where money must be repaid regardless
of outcomes). 14
There has been capital flight as bank deposits in some GIPSIs have declined substantially, but the within euro area central
bank transfer system (TARGET2) has meant that banks within the GIPSIs still have enough liquidity as they borrow from
the ECB via their national central bank. There has been some controversy over the importance of the TARGET2 system
and the implications it has for credit risk at the surplus national central banks. See Sinn and Wollmershaeuser (2011) and
ECB (2011) for two sides of this issue. 15
Assuming that trade elasticities operate such that a fall in relative price is made up for with an increase in the volume of
exports relative to imports. If the volume of trade is not responsive, making imports more expensive and exports less
valuable could actually worsen the trade balance.
13
The problem of adjusting to asymmetric shocks within the euro area is not an issue that was
unexpected. For more than fifty years, economists have studied the question of what constitutes a
sensible currency union.16 At the time of the creation of the euro, many economists (especially outside
the euro area) worried that the lack of labor mobility and fiscal policy offsets within the euro area
would mean that when different shocks hit different parts of the currency union, there would be no
policy levers to offset the shocks.17 Countries could no longer run their own monetary policy and
exchange rates could not adjust, leaving the potential for one region to remain mired with high
unemployment and another region to have a strong economy.18 The hope was that before the area was
truly tested by a severe shock, euro area labor flexibility and mobility would improve or cross country
fiscal transfers would rise as euro area political institutions grew. Now however, countries are
struggling with high unemployment and no policy lever to combat it. The only possible policy lever –
fiscal spending to combat the recession – has been taken away by the pressure in the sovereign debt
markets and the lack of cross country support beyond measures to forestall default (policies to increase
labor market flexibility are discussed in section IIIa.).
Comparison to the United States is informative. The United States certainly has disparate
shocks hit the economy. Much like Spain and Ireland, Nevada and Florida saw massive real estate
booms followed by busts. The United States also has large differences in the economic nature of
different regions. New York acts as a financial center, Hawaii a tourism center, the gaps across
manufacturing concentration from the Midwest the Northeast are similar to the gaps from Germany to
Greece. Still, despite similar circumstances, the United States has not seen persistence in labor market
outcomes that have appeared in the euro area. In contrast to the euro area, unemployment rates are
falling in the highest unemployment rate states in the United States at present, and the range of
unemployment rates is falling not rising. The range of unemployment rates across U.S. states has
fallen from 11 to 9.3 percentage points from its peak in mid-2010 to the end of 2011 (this is still
roughly double the pre-crisis range). In contrast, the range of unemployment rates across euro area
16
The classic reference is Mundell (1961) 17
See Jonung and Drea (2009) for a review of U.S. economists’ view of the euro area. 18
See Obstfeld (1997) for the typical concerns voiced by some U.S. academics
14
countries has grown from 15.7 percentage points to 18.9 over the same time period (more than two and
a half times the pre-crisis range).19
Labor mobility across regions can provide adjustment to shocks, as people move from areas
without jobs towards areas with jobs. While the exact degree of labor mobility in the United States is a
matter of debate, it is typically accepted that mobility across U.S. states and regions is higher than
across countries of the euro area. Blanchard and Katz (1992) argue that unemployment rates tend to
return to the national average in the United States after a shock not because employment improves or
participation rates change, but rather because workers leave the state.20 Obstfeld and Peri (1998)
warned that even intra euro area country mobility (that is, within Italy or within Germany) is lower
than in the United States, suggesting that even after currency union, the euro area would be left with
little ability to adjust to shocks.
The United States also has a large degree of fiscal shock absorbers across regions – when an
individual loses a job, their state is now sending less money to the Federal government, but receiving
more back in transfers.21 It is true that a fiscal cushion cannot last forever. If a country faces a need
for adjustment (either due to a permanent shock or imbalances that built over time), it could cushion
the shock with fiscal policy, but eventually, some mechanism must generate adjustment (see Blanchard
(1998) for discussion). But, GIPSI countries are currently left with no cushion and no immediate path
of adjustment.22 As Obstfeld and Peri note, European countries and Canada are more likely to have
permanent fiscal transfer flows where adjustment does not take place, but permanent streams of
19
The comparison is not apples to apples as it uses 50 U.S. states and the 17 current euro area countries. But, splitting the
U.S. into more regions should make the range of unemployment rates wider than it would be if one were to collapse the
U.S. into a smaller number of regions. The comparison also highlights the fact that the range of unemployment rates in the
euro area is considerably higher than in the United States. 20
Decressin and Fatas (1995) also argue that migration absorbs shocks in the U.S. such that unemployment returns to
normal. In Europe, though, they argue labor participation not migration changes after a shock. Rowthorn and Glyn (2006)
argue there are estimation concerns with the original Blanchard and Katz results and that there is less evidence that
unemployment rates across states converge after a shock. Feyrer, Sacerdote, and Stern (2007) provide a detailed analysis of
the impact of shocks to the auto and steel industries and find similar results to those of Blanchard and Katz. 21
See Sala-i-Martin and Sachs (1992) for a high estimate of the offset in the U.S. and Fatas (1998) for a more conservative
estimate. 22
Blanchard’s (2007) consideration of Portugal is an important contribution as it highlights that these problems were often
clear before the crisis took hold. Furthermore, the solutions were not easy then, with a stronger external environment and
less sovereign debt pressure.
15
payments from one region to another cushion bad outcomes. The euro area does not have a large
system of transfers across countries.
III. Connections across Crises and Incomplete Policy Approaches
The discussion above demonstrates there are connections across these crises. The following
sections highlight these linkages. Often, the linkages come from the policies used to combat the
individual crises and these policies are discussed as well. The discussion also highlights the
institutional holes left at the time the euro was created. The ECB was given a 2% inflation target and
nothing else. The responsibility for supporting banks with liquidity was ambiguous and for
supervising banks was absent. While labor was now in theory mobile, mobility was low and there was
no other mechanism to offset shocks. The only institution added as part of the Maastricht treaty and its
refinements was the Stability and Growth Pact which restricted countries’ public budget deficits. A
combination of politics and ideology meant that public sector borrowing and inflation were supposed
to be controlled but private borrowing, banking system issues, unemployment, and other
macroeconomic challenges were left unattended at the euro area level. The politics of such choices are
beyond the scope of this paper, but the choices made at the creation of the euro have left great
challenges for current policymakers.
a. Growth and the Sovereign Debt Crisis
Examining which countries are currently facing pressure in sovereign debt markets
demonstrates the importance of adequate growth and macroeconomic fundamentals. Panel A of Figure
8 shows the 2010 level of debt compared to the 2011:Q4 spread of the 10 year bond rate relative to
Germany for the 12 countries that were in the euro area from 2002 on. As can be seen, in general,
higher debt countries face higher spreads, but the relationship is in no way perfect. Spain has a lower
debt to GDP level than Germany, France, or Austria, and yet pays a substantially higher rate on its
debt. One could instead look at the deficit in 2010, to see if it is the change not the level that has
markets worried. Here, the relationship again looks broadly sensible.23 Still, both the level of debt and
the current deficit may simply be related to the depth of the shock countries faced or the amount of
23
Ireland’s outlier level of deficit is generated by the huge costs associated with its bank bailout.
16
private sector liabilities they absorbed during the crisis. Thus, one may instead prefer to look at the
development of public finances prior to the crisis to see if fiscally irresponsible governments are the
ones being punished by markets. This is also the appropriate test to see if a failure of euro area
institutions to reign in poor fiscal behavior in the first decade of the currency union was the problem
(and consequently if a new fiscal pact limiting deficits is likely to prevent future problems). Looking
at panel C, the idea that profligate governments took advantage of low rates to behave irresponsibly,
and they are now being punished seems to fall apart. The relationship is not statistically significant.
Prior to the crisis, Spain and Ireland were both cutting public debt as a share of GDP. Portugal was
certainly running up an increasing level of public debt, but France and Germany stand 2nd
and 3rd
in the
increase in public debt and currently have very low bond yields.
Instead, one might look to the depth of the shock itself to consider the fear markets have for
certain countries ability to repay. Panel D shows the current level of unemployment across countries
relative to the spread on sovereigns. The relationship has the same significance and explanatory power
as the level of debt in 2010. Again, though, causality could run in either direction. It may be that
countries currently being challenged by markets have had to tighten budgets so much that the
unemployment rate has responded to the austerity, but the picture using unemployment rates from the
end of 2009 is quite similar, suggesting the depth of the shock may be a determinant of current bond
spreads.
A different picture is found by looking not at fiscal deficits prior to the crisis but current
account deficits. The current account deficit represents the trade deficit, but it also represents the net
borrowing by all participants in the economy from the rest of the world (if a country buys more than it
sells it must borrow the money from elsewhere.) If in a crisis many private sector debts wind up
becoming public debts (due to bank bailouts or other aid to the economy), one would expect that large
borrowing prior to the crisis anywhere in the economy will lead to problems with sovereign repayment
today because previous private borrowing may increase current fiscal risk. This, though, suggests that
the problem is with total borrowing in the economy, and borrowing from outside the economy in
particular, not with government borrowing per se. Alternatively, one could view the large current
account deficits as a representation that a country’s goods and services are mispriced on world
17
markets. In this case, one might assume that countries with large current account deficits prior to the
crisis have large spreads because investors fear their ability to grow enough to repay the debt. Panel E
shows a nearly perfect relationship between the current account in 2007 and the spread over German
debt paid today. Those countries that were borrowing (as opposed to governments borrowing) are
currently under attack (2007 is not a fluke, the picture is nearly identical if one looks at the sum of
current accounts over the period of 2001-7).
Figure F looks at the change in prices from 2001 to 2007. Again, there is a fairly strong
relationship across current spreads and pre-crisis loss of competitiveness. Thus, one concern in
sovereign debt markets may be that some countries simply face very bad growth dynamics in the near
future. They have borrowed too much in the private sector and are not cost competitive with the rest of
the currency union. The slow growth is seen in the high levels of unemployment and suggests that
without a very low interest rate, their debt burden is likely to grow.24 With only 12 countries under
study, one cannot separate the possibility that the problem the current account demonstrates is a loss of
competitiveness as opposed to simply a preference for borrowing, they are both imbedded in the
current account. Given the small sample, it is difficult to meaningfully test different potential causes
of the increased spreads in a multivariate regression framework, but the current account in 2007
appears to be the variable most closely connected to current spreads as it has high statistical
significance, the most explanatory power, and is the variable that retains significance if other variables
are included in a regression together.25 The pictures in Figure 8 suggest that the current sovereign debt
crisis may have as much to do with growth and problems in the private sector as they do with fiscally
irresponsible governments.
Policy Response: Internal Devaluation:
24
The next section will deal more directly with changes in cost competitiveness within a currency union. 25
If one includes debt in 2010 (or 2007) and the current account in 2007 in a regression on the spread over Germany, one
finds that the coefficient on debt levels is not significantly different from zero while the coefficient on the current account is
statistically significantly different from zero at the 99% level. The simple regression with two explanatory variables
explains roughly 80% of the variation in spreads. Dropping the debt level variable only reduces the explanatory power to
0.76. Including the spread over Germany in 1993 to see if some countries have simply never been trusted by the market
does not reduce the explanatory power of the 2007 current account. Attinasi et al (2009) examine the initial widening of
spreads and find both banking bailouts and projected deficits are related to rising spreads. They use the current budget
deficit forecast which is affected by economic conditions and do not examine the current account or pre-crisis fiscal
balance.
18
As noted, the growth crisis requires some sort of demand shift towards the GIPSI countries.
But, the euro area has surrendered the classic means of adjusting to shocks across countries – an
exchange rate change – without other means of adjustment. Recent emphasis has been put on the need
for deficit countries to have an “internal devaluation” that is, to have the price of their goods and
services fall relative to other countries without a nominal depreciation.26 This can occur if wages and
local prices fall while the exchange rate remains constant. Both theory and evidence, though, suggests
that this may be a difficult road for the euro area.
Internal devaluation or revaluation should be more complicated and difficult than a simple
change in the exchange rate. This is the original argument in favor of flexible exchange rates running
back to Friedman (1953). Why change thousands of wage and price contracts when one can simply
change the exchange rate? An internal devaluation presents a further problem. Economic theory –
especially that of a Keynesian or New Keynsian bent – gives an explanation of why an internal
revaluation should be easier than an internal devaluation. It is often more difficult and costly to change
prices down than it is up. In particular, wages are difficult to adjust downward, a result long
understood in economics (see Akerlof et al (1996) for a discussion and Barattieri et al (2010) for recent
evidence on wage rigidity and downward inflexibility). Thus, unless prices are rising quickly in a
countries’ trading partners’ economies, it may be slow and costly for an internal devaluation to occur.
One can evaluate the possibility of an internal devaluation in a number of ways.27 First, we can
examine how often countries experience a real exchange rate depreciation (relative prices getting
cheaper on world markets) without a nominal depreciation (the currency getting cheaper on world
markets). Shambaugh (2012) uses BIS narrow trade weighted exchange rate indices for a sample of 26
mostly advanced countries stretching back to 1964.28 Defining an internal devaluation as a 3% change
26
See for example, Aslund (2010). See Roubini (2011) for skepticism of the viability of such a path. 27
These results draw from Shambaugh (2012) 28
Looking at much wider indices introduces potential problems. Even in a geometric index, a hyperinflation can generate
an outsized weight in the calculations. Thus, broad trade weighted indices that include countries that went through
hyperinflations may generate gaps from the nominal to real exchange rate index for any partner country if the price level
and exchange rate do not move in perfect lock step month to month or year to year in the hyperinflation countries. Also,
these indices use consumer prices to generate real exchange rates. One could use export prices, but if a country is a price
taker in export markets, even if its prices rise, its export prices may not. Instead, less cost effective firms may simply stop
(continued)
19
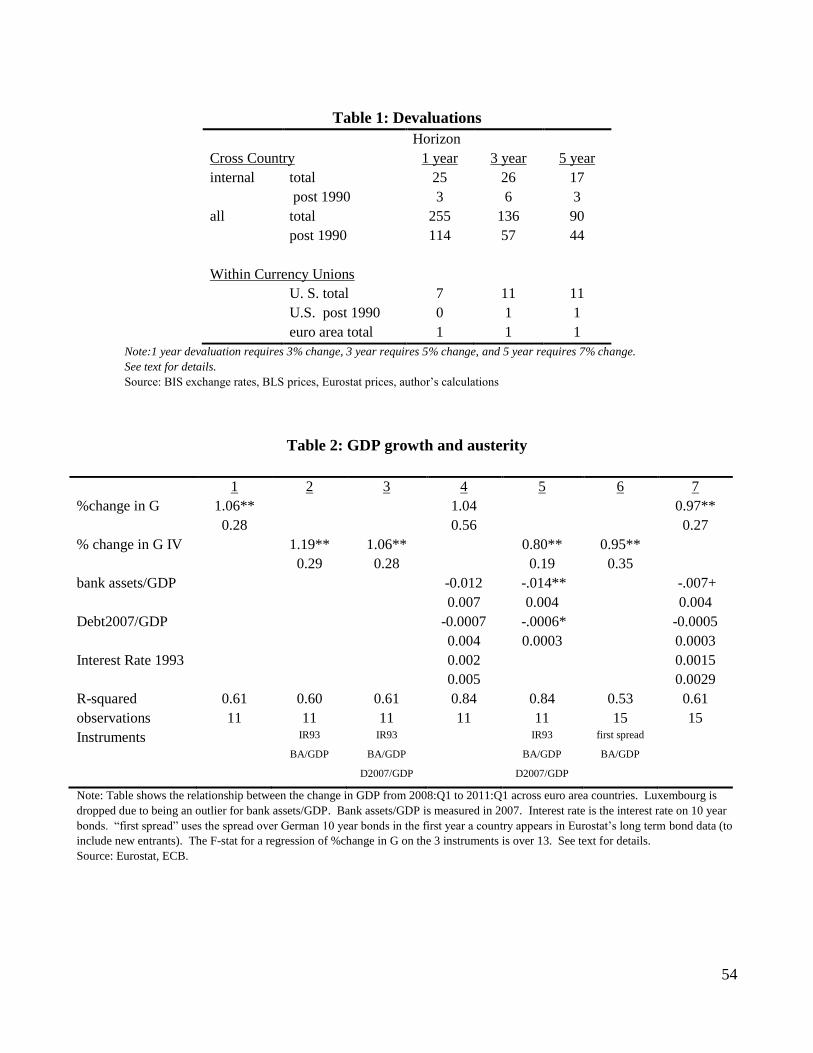
in 1 year, a 5% change over 3 years, or a 7% change over 5 years, the paper finds that roughly half of
the countries in the sample experience an internal devaluation.29 Nearly all, though, happen in eras of
generalized higher inflation before 1991 (see Table 1).30 When world prices are rising 10% a year, a
country can have a substantial real depreciation by simply having lower (but still positive) inflation
compared to its trading partners. Prices and wages do not need to fall to become substantially cheaper
on world markets. Internal revaluations, where prices increase faster than in trading partners, are
roughly twice as common as internal devaluations.
Since 1990, there are broadly only three examples of an internal devaluation: Hong Kong in the
early 2000s (when a drop in demand for Hong Kong goods and services following the merger with
China led to a fall in prices while the nominal exchange rate was pegged to the U.S. dollar), Japan in
the late 1990s and early 2000s (when deflation meant Japanese prices were falling, but the exchange
rate was relatively constant or depreciating slowly) and Ireland during the current crisis (when wages
and prices fell, and the euro was relatively constant in value). In the different categories of 1, 3, and 5
year devaluations, sometimes one of these episodes shows up more than once (3 of the 3 year periods
are part of the sustained shift in Japan) making the actual count greater than 3, and in some cases, one
of these episodes does not qualify (no single year in Japan’s deflation reaches a 3% real depreciation,
the 3 episodes are in Hong Kong twice and once in Ireland), but no episode shows up outside of these
three. Latvia is not in the sample, but its current experience would certainly qualify as its real
exchange rate depreciated 7% in 2010 from 2009 while the nominal exchange rate depreciated just 3%.
Due to an appreciation in 2009, Latvia’s real exchange rate is now just slightly below its 2008 level.31
In contrast, real depreciations associated with changes in the nominal exchange rate are
common before and after 1990. As the table shows, there are over 250 episodes of a real depreciation
exporting reducing quantity rather than raising prices for the country as a whole. For this reason and for comparability to
U.S. city prices, this paper uses consumer price based measures. 29
Technically, the requirement is that the real exchange rate depreciate 3%, that it depreciate 3 percentage points more than
the nominal exchange rate, and that the nominal exchange rate not depreciate substantially. Thus, a 3% real depreciation
with a 2% nominal depreciation would not count (the gap is too small). A 15% real depreciation with a 12% nominal
depreciation would also not count as the bulk of the adjustment is coming from the nominal exchange rate. 30
After 1990, advanced country inflation remains below 5% a year. One can also shift the date back to 1986 with little
change in the results as inflation was below 5% for most of the period 1986-90. 31
Other Baltic nations pursued policies aimed at exchange rate stability and price adjustment, but none had sufficient
changes in prices to be considered an internal devaluation.
20
if one does not constrain the depreciation to be an internal one – 10 times the number seen if the
depreciation must come only via prices. Similarly, there are over 100 at the 3 year horizon and over 90
at the 5 year horizon. At all three horizons, depreciations after 1990 are plentiful. This is not to
suggest that all these changes in the real exchange rate are needed or desired, simply that it is a much
more common phenomenon.
It may be that a nominal depreciation is simply a path of least resistance compared to an
internal devaluation, and internal devaluations are still quite feasible. That is, in many cases where a
nominal depreciation generated a real depreciation, perhaps a real depreciation would have occurred
even if the exchange rate were fixed. One can turn to within currency union price evidence to see
whether there are substantial relative price adjustments. Again, the evidence is not encouraging for
countries hoping to pursue this strategy.
Shambaugh (2012) uses price data for 27 U.S. metro areas from 1961 to 2010 (not all regions
are available at the beginning of the sample) to see if metro areas can have falling prices relative to the
rest of the U.S. currency union.32 Using the same standards for an internal devaluation, but comparing
each metro area to the median inflation rate for the nation, Table 1 shows that in the U.S., internal
devaluations do take place prior to 1991, albeit rarely. With 2 exceptions, though, they do not happen
at all after the U.S. moved to a lower inflation period post 1990.33 U.S. inflation averaged over 5%
from 1968 to 1990 but averaged 2.5% from 1991 to 2010. There were also no internal devaluations in
the period 1961-8 when inflation averaged just 1.7%. Just as nominal devaluations may be a path of
least resistance, labor mobility in the U.S. may take place before internal devaluation is needed.
Finally, one can look at relative prices within the euro area since its launch, again comparing
inflation in each country to the median. Since its inception in 1999, only Ireland’s experience post
2008 has qualified as a substantial internal devaluation. An interesting omission is Germany’s
experience in the 2000s. Much discussion of current imbalances focuses on Germany’s dramatic shift
from slow growth and balanced trade in 1999 to better economic performance and a sizable trade
32
See Obstfeld and Peri (1998) for a review of the literature on inter-regional price variability. This section differs by
focusing on the frequency of internal devaluation as opposed to the general level of variability. 33
The two cases are Denver over the 3 years ending in 2004 and Honolulu over the 5 years ending in 1999
21
surplus by 2006. Examining panel F of figure 7, one sees Germany did have the lowest inflation in the
euro area from 2001 to 2007, suggesting its relative prices were falling. But, many other countries are
clustered relatively close to Germany. Figure 9 shows the price levels of the GIPSIs, Germany,
France, and the euro area (ex Germany) inflation rate since the euro’s inception. Certainly the GIPSIs
– especially Greece and Spain – have lost competitiveness relative to the euro area and Germany in
particular. But, Germany has gained only a modest amount against the euro area overall.34 Its
principal gains are against the outliers. This, in a sense, is the corollary of all the other results.
Internal devaluations tend to only be successful against the backdrop of higher inflation elsewhere.
These results suggest that a rapid substantial shift in relative prices via wage or price
compression is unlikely. Some GIPSI countries have lost considerable cost competitiveness in the last
decade. Greek prices rose roughly 30% since 1999 relative to Germany (20% compared to the euro
area ex-Germany). Spain’s prices rose by 20% and 10% respectively. To regain competitiveness at a
rate of 5% over 3 years would require a decade of internal devaluation in Greece. Further, the three
countries that have had internal devaluations in a low inflation setting (as well as the internal
devaluation of Latvia, who is not in the data set) have tended to be in the midst of severe recession /
depression. Unemployment rates increase substantially over prior levels, and nominal GDP stays flat
or declines for a number of years; this is not true on average for internal devaluations prior to 1991.
One should not attribute the cause of the economic weakness to the internal devaluation; the important
point is that these devaluations tend not to happen absent severe economic contractions with
unemployment substantially above trend.35
It should be noted that an internal devaluation comes with one further challenge. If wages and
prices fall, this means even if there is real GDP growth, nominal GDP could fall. Thus, the
denominator in the debt to GDP ratio does not grow. The fact that Japan’s nominal GDP is the same in
2010 as it was in 1992 (despite real GDP growth of 16% over that period) is one reason that its debt to
34
There were some three year periods where Germany gained 3% against the median and some 5 year periods where it
gained 5%, but never more. The total gain from 1999 to 2011 was 8%. Finland is the only other country in the euro area to
meet the 5% in 5 years hurdle. 35
The current account in Latvia and Ireland have returned to zero, but it is unclear if one should credit the more competitive
relative prices or the massive decline in imports as consumption is down substantially in both countries. See Darvis (2011).
22
GDP ratio has climbed so much. Thus, even if the GIPSI countries restart real growth via internal
devaluation, it is not until they restart nominal growth that it will help their debt sustainability. The
IMF’s end of 2011 report on Greece is not overly optimistic about the pace of Greek internal
devaluation, calling for 1% a year for 10 years. Such a pace seems reasonable based on past evidence
unless faster inflation happens in the rest of Europe, but also suggests Greece will not regain
competitiveness for many years and will likely not have substantial nominal GDP growth for a number
of years, implying continued strains on solvency.
In many ways, these results are simply an extension of Mussa (1986). Mussa found that in
floating exchange rate environments, real and nominal exchange rates tended to track one another
closely. The results presented here suggest two corollaries. First, deviations where real exchange rates
depreciate absent a nominal depreciation are extremely rare in a low inflation environment. Second,
those deviations tend to be accompanied by extreme economic dislocation. Blanchard and Muet
(1993) also note that while attempts to bring down inflation can stop real appreciations against trading
partners in a fixed exchange rate regime, generating substantially lower inflation to create a real
devaluation can be quite difficult and nominal exchange rate changes appear much lower cost.
The important implication for euro area policy is that to increase the odds of a successful
internal devaluation (both the odds it happens and the odds it is not accompanied by massive long term
economic dislocation), it would be very helpful for the GIPSIs to be trying to improve competitiveness
against a group of countries that are running faster than 2% inflation. The ECB is committed to its 2%
inflation target. At the very least, the important implication is that if inflation is close to zero in the
GIPSIs, it must be allowed to run faster than 2-3% in the core countries (so the overall average is 2%).
The GIPSI countries are roughly one third of euro area GDP, so if their inflation rate is 1%, the rest of
the euro area inflation rate would have to be 2.5% to achieve a 2% target, leaving a gap of only 1.5% a
year. If the GIPSIs had inflation of 0%, the rest of the union could have 3% inflation and still hit the
target. A likely easier way to achieve the 3% spread, though, would be 1% inflation in the GIPSI
countries and 4% in the rest of the area, but that would lead to inflation of 3% in the euro area overall.
While such an outcome would violate the ECB’s goal of 2% inflation in the short term, faster inflation
23
would likely help facilitate relative price changes, as well as faster nominal GDP growth throughout
the euro area and a likely depreciation of the euro overall.
Policy Response: Structural Growth Policies
Internal devaluation is not the only route of adjustment countries are being encouraged to take
to restore growth. Countries could take a number of steps (often referred to as structural reforms) to
try to increase growth. This might include deregulating product or retail markets, streamlining rules
for investment or starting businesses, policies aimed at improving innovation, or removing barriers to
entry in various services professions. Any step that increased growth could help achieve debt
sustainability and lower unemployment. Policies to make labor markets more flexible might help
either increase productivity or lower wages leading to lower production costs. There are a number of
concerns, though. Such reforms are not typically rapid in their implementation. More so, if the
economies are struggling from a lack of demand – with household balance sheets stressed and
sovereigns that cannot spend – improving potential output will not lift the economies from their current
recession. It may help in the long run, but not at present. This does not mean such reforms should be
ignored, they are likely good policy, but they may not be sufficient to deliver these economies from
their current slumps.36 Reforms such as these have been an important part of the aid packages thus far.
They obviously have not, though, delivered rapid near term growth in the face of budget cuts and tax
increases.
The evidence on the impact of reforms in the short-term is limited. In a series of studies,
researchers at the OECD suggest that over a long horizon, countries with poor structural policies could
raise potential GDP (see OECD (2012) for discussion). The results suggest, though, that the impact in
the near term is likely to be limited. Policies that spend money to reduce labor market problems
(active labor market policies) may lower unemployment, but are unlikely to be pursued in the face of
austerity. Further, many policies that remove labor market rigidities appear to have limited impact in
the first few years. Policies that limit unemployment insurance generosity may lower unemployment
36
A cautionary note is that in the summer of 2010, Greece was enthusiastically praised for its rapid implementation of
structural reforms (see Financial Times, “Greece praised for swift structural reforms” 8-5-2010). Its unemployment rate
has continued climbing and economy continued contracting since then.
24
rates in some settings, but the impact appears to be negative when the economy is weak (likely due to
negative impact on demand). Finally, product market reforms may increase the labor force over time,
and again increase potential GDP, but in the face of constrained demand and high unemployment,
increasing the labor force participation rate is unlikely to be helpful in the short run. Thus, structural
reforms would likely help over time and should be pursed as part of long run packages, but evidence is
not encouraging that they can be a route to a near term resolution to the growth crisis.
b. The Sovereign Debt Crisis Impact on Banks
As the crisis has worn on, the initial concern of exposure to bad assets based on U.S. mortgages
has broadened. In particular, for euro area banks, a crucial question has become their exposure to the
bonds of their own governments (exposure to local real estate markets is also an issue in countries that
had large real estate bubbles like Ireland and Spain). European banks hold large amounts of euro area
sovereign debt on their balance sheets.37 Based on data from the stress tests of 91 significant banks
(discussed later)38, Greek commercial banks hold roughly 25% of GDP in the form of Greek
government bonds. Spanish banks hold local sovereign debt equivalent to roughly 20% of GDP while
Italian and Portuguese banks hold closer to 10% of GDP in domestic government bonds. Further,
banks in the euro area hold considerable volumes of bonds of other European sovereigns such that the
total exposure to stressed sovereigns is even higher. The banks in other euro area countries also face
sizable exposure with the banks in France and Germany holding roughly 5% of GDP worth of assets in
the sovereign debt of the GIPSI countries. The IMF estimates that the in the largest Greek banks,
Greek sovereign debt holdings are over 100% of the core tier 1 capital (the equity and retained
earnings of the bank which is essentially the cushion banks have to face losses before liabilities exceed
37
The reasons for these holdings are beyond the scope of this paper. Some may be due to pressure from governments that
encourages banks to buy their debt. In other cases, it may be a response to regulatory incentives where highly rated
government debt counted as essentially riskless and hence did not require large capital buffers in regulatory frameworks
that risk weighted assets for the purposes of capital requirements. See euro-nomics 2011 for discussion. 38
See http://www.piie.com/realtime/?p=1711 for a spreadsheet that compiles the sovereign debt holdings of the 91 tested
banks by country from the July 2011 stress tests. This is an underestimate of the total holdings of the banking system as it
only adds up the holdings of the major banks, not the entire system. Based on information in December 2011, it appears
some banks had shed sovereign debt exposure by the end of the third quarter of 2011. Conversely, since the Long Term
Refinancing Operations in December and February (discussed below), there is evidence that euro area banks have increased
their holdings (see “Sovereign Bond Market Gorges Itself on ECB Christmas Present” Wall Street Journal 12-20-2011)
making a precise estimate at this point difficult until new official figures are released.
Note: All regressions simple OLS, constant is included. ** signifies coefficient is statistically significantly different from zero at the 99% confidence
level, * at the 95% level, + at the 90% level.
Source: Eurostat
52
Figure 9: Euro Area Price Levels 1999-2011
(rolling 12 month averages of HICP indexed to 1999=100)
Source: Eurostat
Figure 10: Change in Government Spending (dg) and Change in GDP 2008:Q1 to 2011:Q1
Belgium
Germany
Estonia
Ireland
Greece
Spain
France
Italy
Cyprus
Luxembourg
Malta
Netherlands
Austria
Portugal
Slovenia
Slovakia
Finland
-.1
-.0
5
0
.05
.1dy
-.1 -.05 0 .05dg
Source: Eurostat
53
Figure 11: Change in loans to the private sector:
Source: ECB Monetary Statistics
54
Table 1: Devaluations
Horizon
Cross Country 1 year 3 year 5 year
internal total 25 26 17
post 1990 3 6 3
all total 255 136 90
post 1990 114 57 44
Within Currency Unions
U. S. total 7 11 11
U.S. post 1990 0 1 1
euro area total 1 1 1
Note:1 year devaluation requires 3% change, 3 year requires 5% change, and 5 year requires 7% change.
See text for details.
Source: BIS exchange rates, BLS prices, Eurostat prices, author’s calculations
Table 2: GDP growth and austerity
1 2 3 4 5 6 7
%change in G 1.06** 1.04 0.97**
0.28 0.56 0.27
% change in G IV 1.19** 1.06** 0.80** 0.95**
0.29 0.28 0.19 0.35
bank assets/GDP -0.012 -.014** -.007+
0.007 0.004 0.004
Debt2007/GDP -0.0007 -.0006* -0.0005
0.004 0.0003 0.0003
Interest Rate 1993 0.002 0.0015
0.005 0.0029
R-squared 0.61 0.60 0.61 0.84 0.84 0.53 0.61
observations 11 11 11 11 11 15 15
Instruments IR93 IR93 IR93 first spread
BA/GDP BA/GDP BA/GDP BA/GDP
D2007/GDP D2007/GDP
Note: Table shows the relationship between the change in GDP from 2008:Q1 to 2011:Q1 across euro area countries. Luxembourg is
dropped due to being an outlier for bank assets/GDP. Bank assets/GDP is measured in 2007. Interest rate is the interest rate on 10 year
bonds. “first spread” uses the spread over German 10 year bonds in the first year a country appears in Eurostat’s long term bond data (to
include new entrants). The F-stat for a regression of %change in G on the 3 instruments is over 13. See text for details.