EVALUATING METHODS FOR IMPROVING NITROGEN USE EFFICIENCY IN CORN AND HARD RED WINTER WHEAT By ROGER KEITH TEAL Bachelor of Science University of Tennessee at Martin Martin, Tennessee 2000 Master of Science Oklahoma State University Stillwater, Oklahoma 2002 Submitted to the Faculty of the Graduate College of the Oklahoma State University in partial fulfillment of the requirements for the Degree of DOCTOR OF PHILOSOPHY May, 2005
Transcript
EVALUATING METHODS FOR IMPROVING
NITROGEN USE EFFICIENCY IN CORN AND HARD
RED WINTER WHEAT
By
ROGER KEITH TEAL
Bachelor of Science University of Tennessee at Martin
Martin, Tennessee 2000
Master of Science Oklahoma State University
Stillwater, Oklahoma 2002
Submitted to the Faculty of the Graduate College of the
Oklahoma State University in partial fulfillment of the requirements for
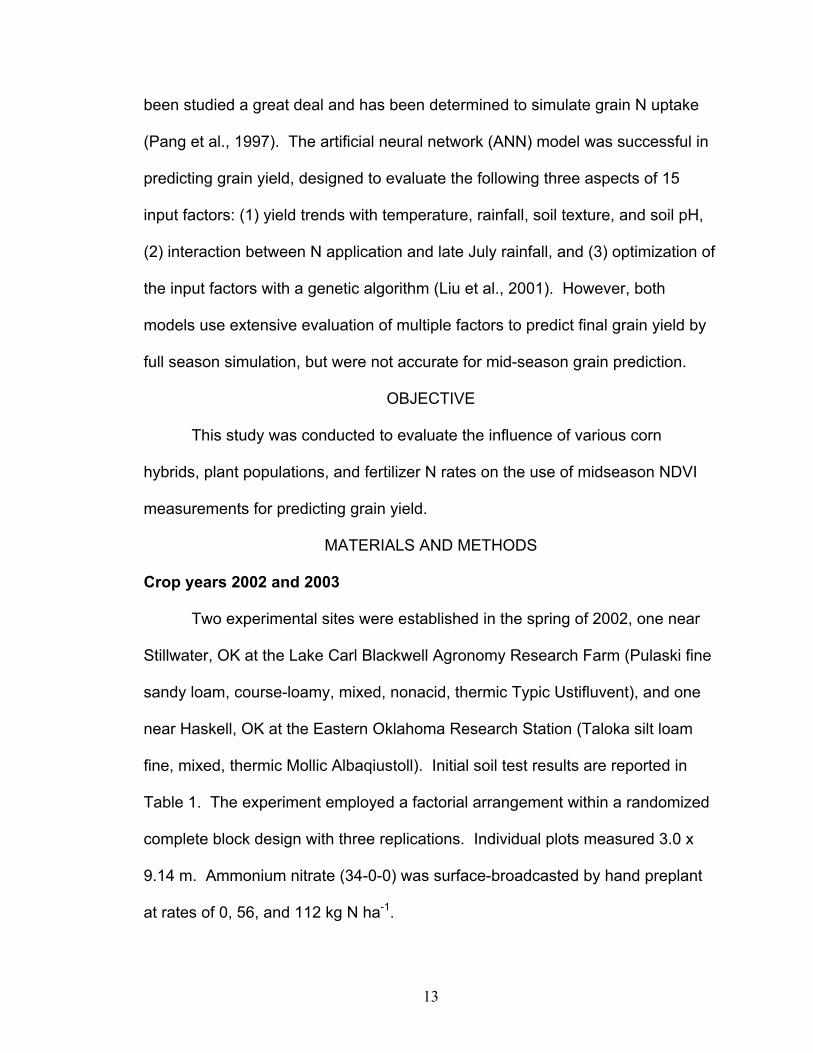
the Degree of DOCTOR OF PHILOSOPHY
May, 2005
ii
EVALUATING METHODS FOR IMPROVING
NITROGEN USE EFFICIENCY IN CORN AND HARD
RED WINTER WHEAT
Dissertation Approved:
Dr. William Raun Dissertation Adviser
Dr. Gordon Johnson
Dr. John Solie
Dr. Hailin Zhang
Dr. Gordon Emslie Dean of the Graduate College
iii
ACKNOWLEDGEMENTS First of all I would like to thank God for giving me the strength and dedication to
complete this degree, fore without His love and patience this work would not
have been possible. I am also very grateful to my fiancée, Charity Sizelove,
and my family, who’s support and encouragement made my efforts much more
effective to this research. I would also like to think the Department of Plant and
Soil Sciences for the opportunity to work and study at Oklahoma State
University. I would especially like to thank the Soil Fertility Project for their
continued support and aid in accomplishing my goals and most of all for their
friendship. Specifically, I would like to thank the following graduate and
undergraduate members of the Soil Fertility Project: Robert Mullen, Wade
Thomason, Kyle Freeman, Kent Martin, Brian Arnall, Kefyalew Girma, Jason
Lawles, Brenda Tubana, Chung Byungkyun, Shambel Moges, Paul Hodgen,
Keri Brixey, Aaron Witt, and Starr Holtz. To my committee members, Dr.
Gordon Johnson, Dr. John Solie, and Dr. Hailin Zhang, I thank you for your
assistance and guidance throughout my pursuit of this degree. Finally, but
certainly not least, I would like to thank my major adviser Dr. Bill Raun for:
allowing me to be a part of the project, an incredible amount of patience, and
the chance to make a difference.
iv
TABLE OF CONTENTS
Chapter Page
I. INFLUENCE OF HYBRID, POPULATION, AND NITROGEN RATE ON SPECTRAL PREDICTION OF CORN GRAIN YIELD
Abstract....................................................................................................1 Introduction ..............................................................................................2 Objective................................................................................................13 Materials and Methods...........................................................................13 Crop Years 2002 and 2003 Experimental sites ....................................................................13 Treatment design .....................................................................13 Sensing method .......................................................................14 Harvest method ........................................................................14 Crop Year 2004 Experimental sites ....................................................................14 Treatment design .....................................................................15 Sensing method .......................................................................15 Harvest method ........................................................................16 Data Analysis.................................................................................16 Results and Discussion..........................................................................17 Hybrid and plant population ...........................................................17 Nitrogen response .........................................................................21 Grain yield prediction .....................................................................27 Conclusions ...........................................................................................31
References ............................................................................................33 II. EFFECT OF TILLAGE AND ANHYDROUS AMMONIA APPLICATION ON
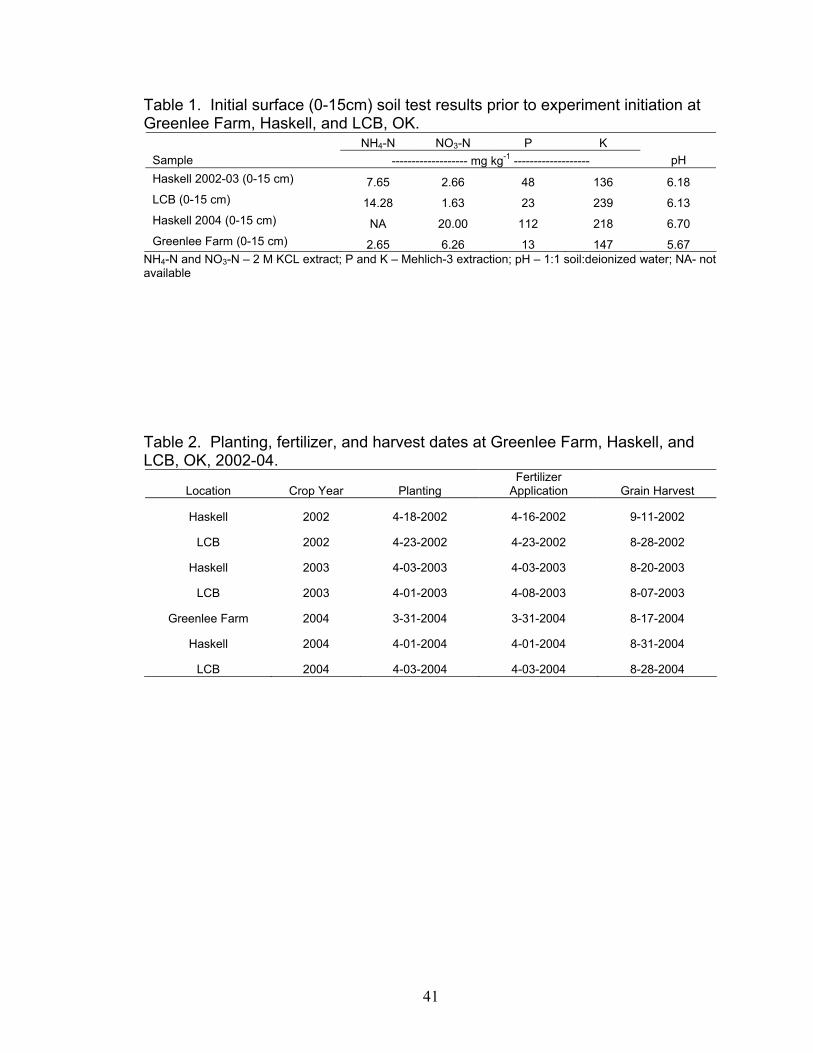
1. Initial surface (0-15cm) soil test results prior to experiment initiation at Greenlee Farm, Haskell, and LCB, OK...............................................41
2. Planting, fertilizing, and harvest dates at Greenlee Farm, Haskell, and LCB, OK, 2002-04............................................................................41
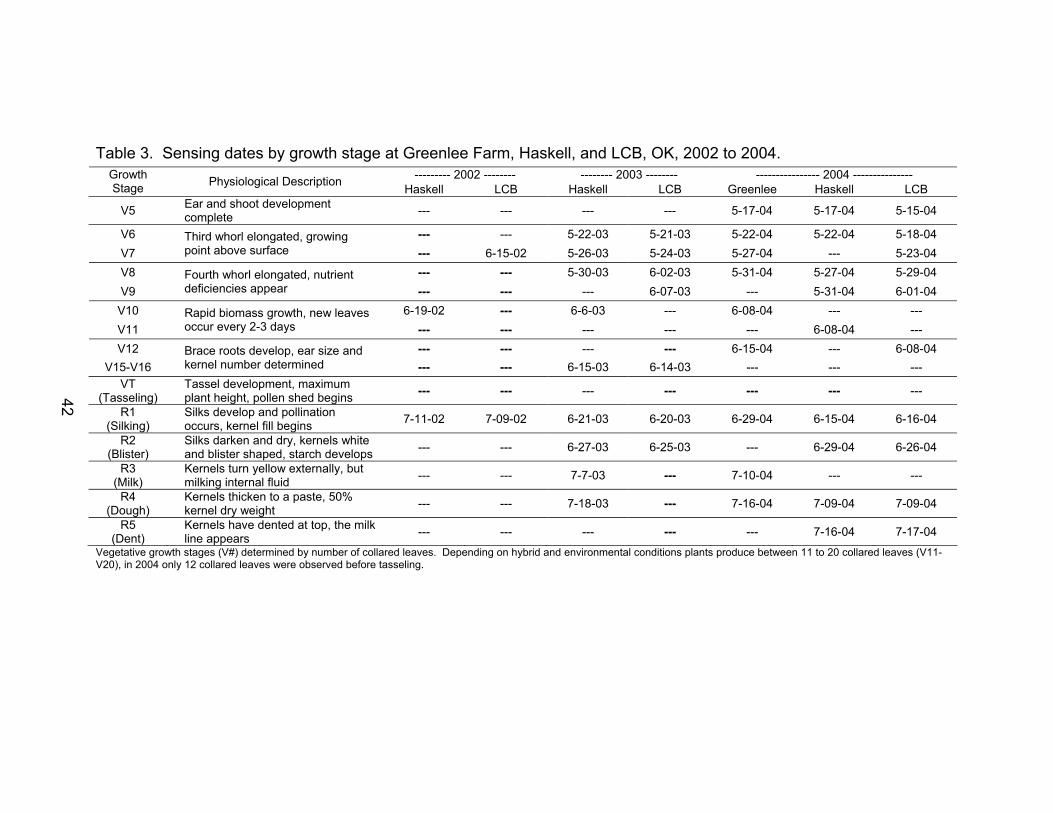
3. Sensing dates by growth stage at Greenlee Farm, Haskell, and
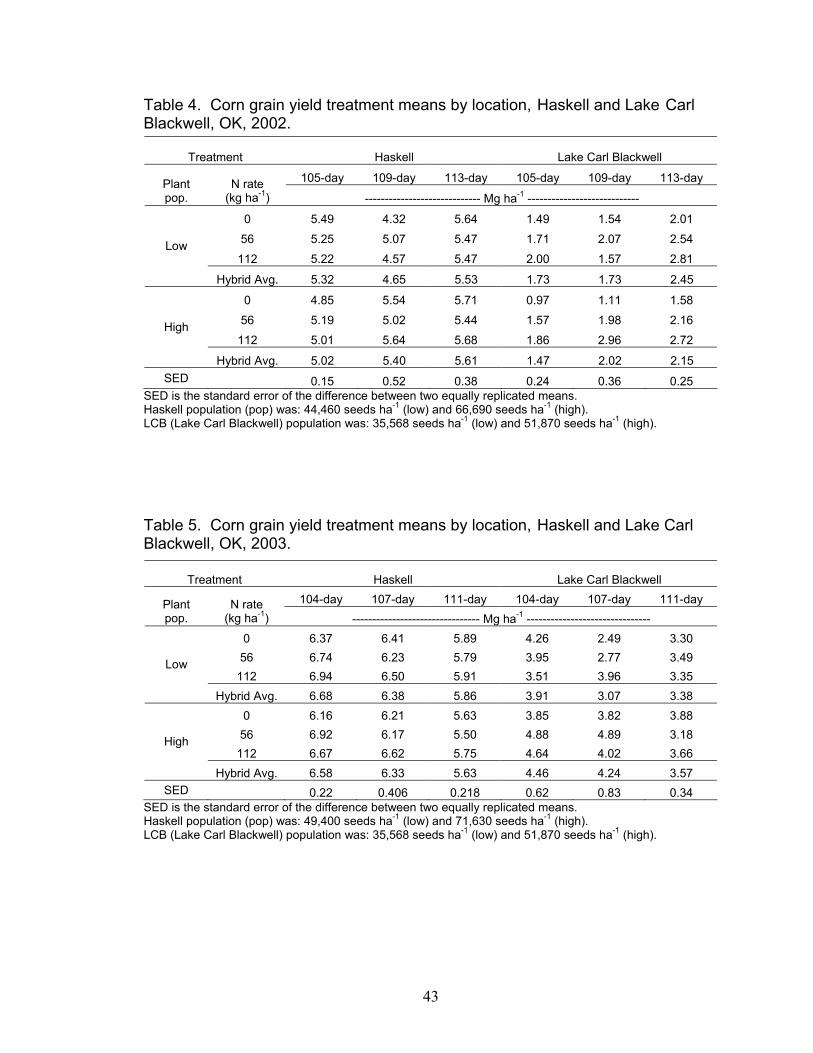
4. Corn grain yield treatment means by location, Haskell and LCB, OK, 2002.................................................................................................43
5. Corn grain yield treatment means by location, Haskell and LCB,
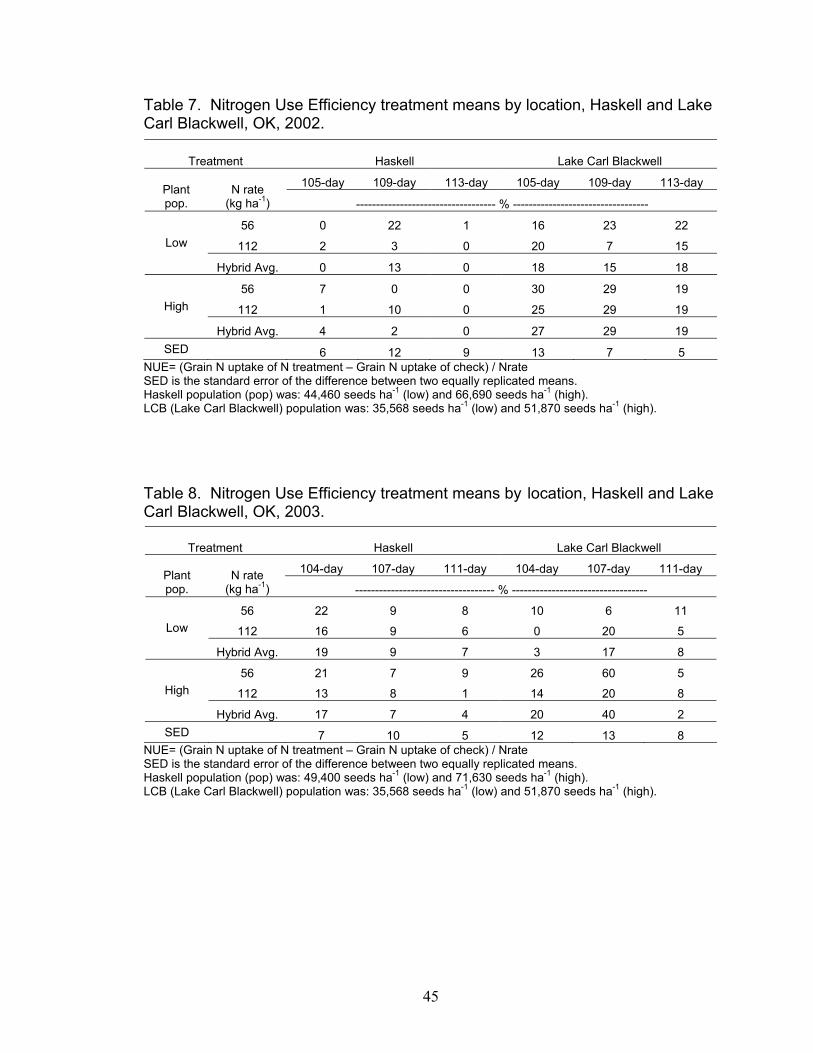
8. Nitrogen Use Efficiency treatment means by location, Haskell and LCB, OK, 2003........................................................................................45
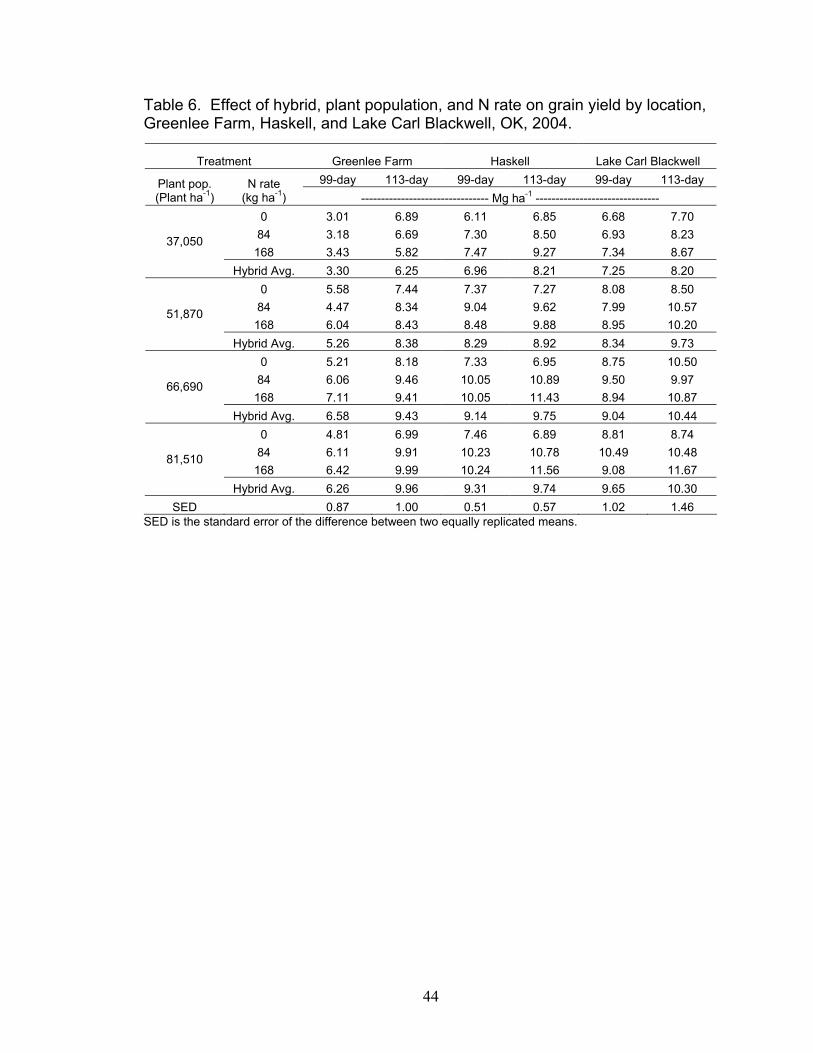
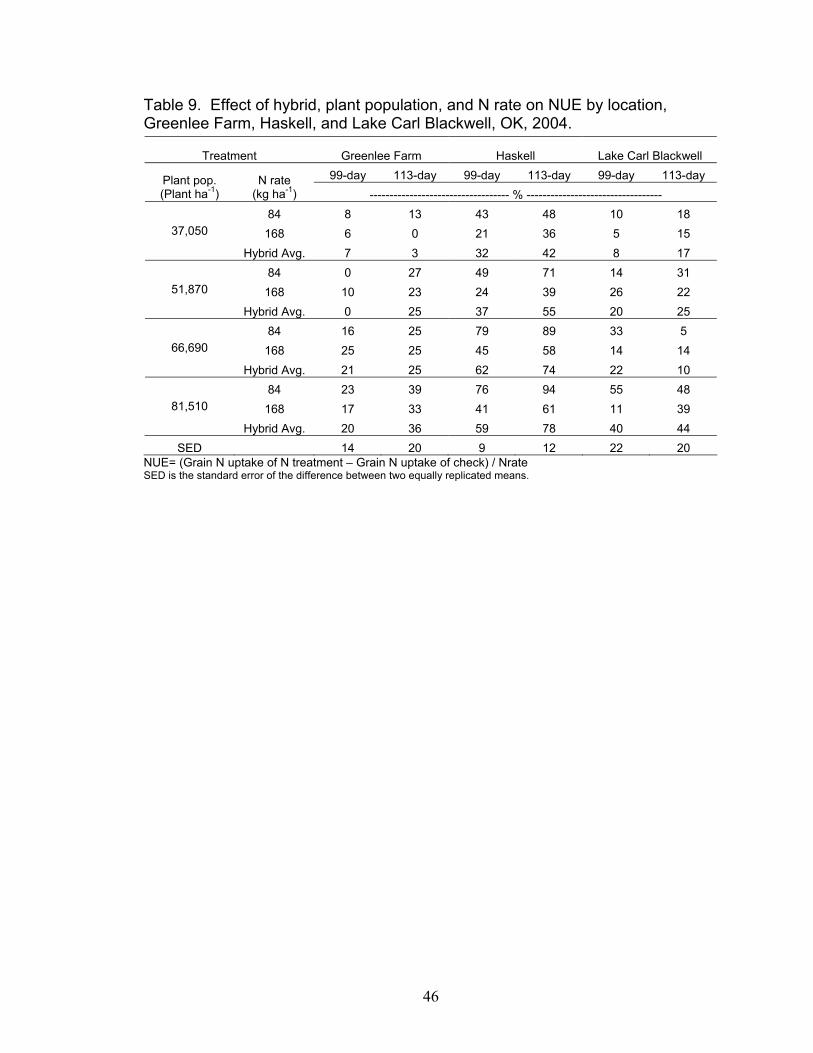
9. Nitrogen Use Efficiency treatment means by location, Greenlee
Farm, Haskell, and LCB, OK, 2004.........................................................46
CHAPTER II
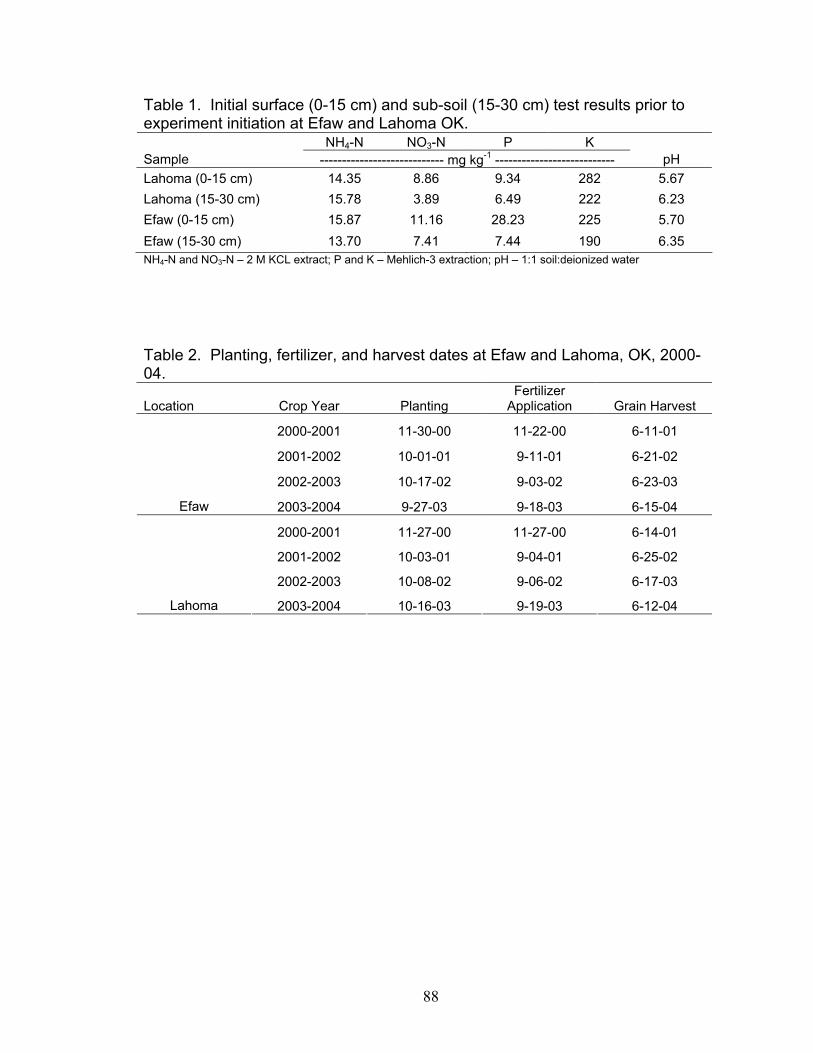
1. Initial surface (0-15 cm) and sub-soil (15-30 cm) test results prior to
experiment initiation at Efaw and Lahoma OK........................................88
vii
2. Planting, fertilizer, and harvest dates at Efaw and Lahoma, OK, 2000-04...................................................................................................88
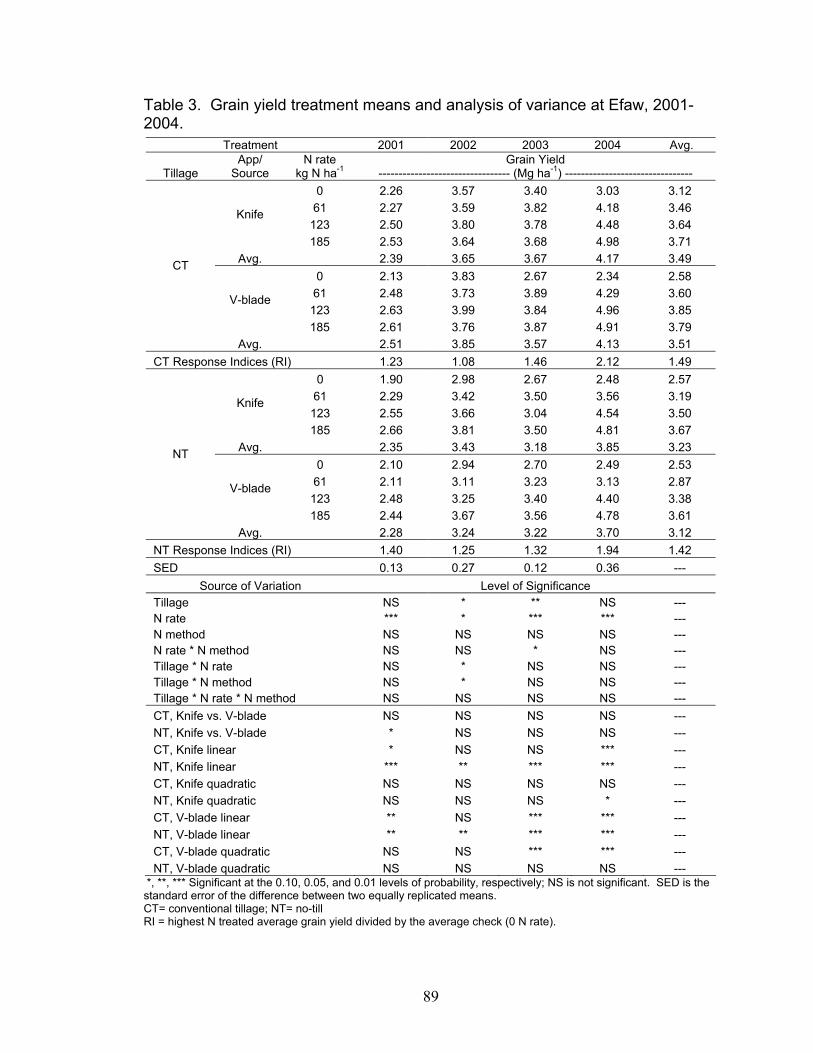
3. Grain yield treatment means and analysis of variance at Efaw,
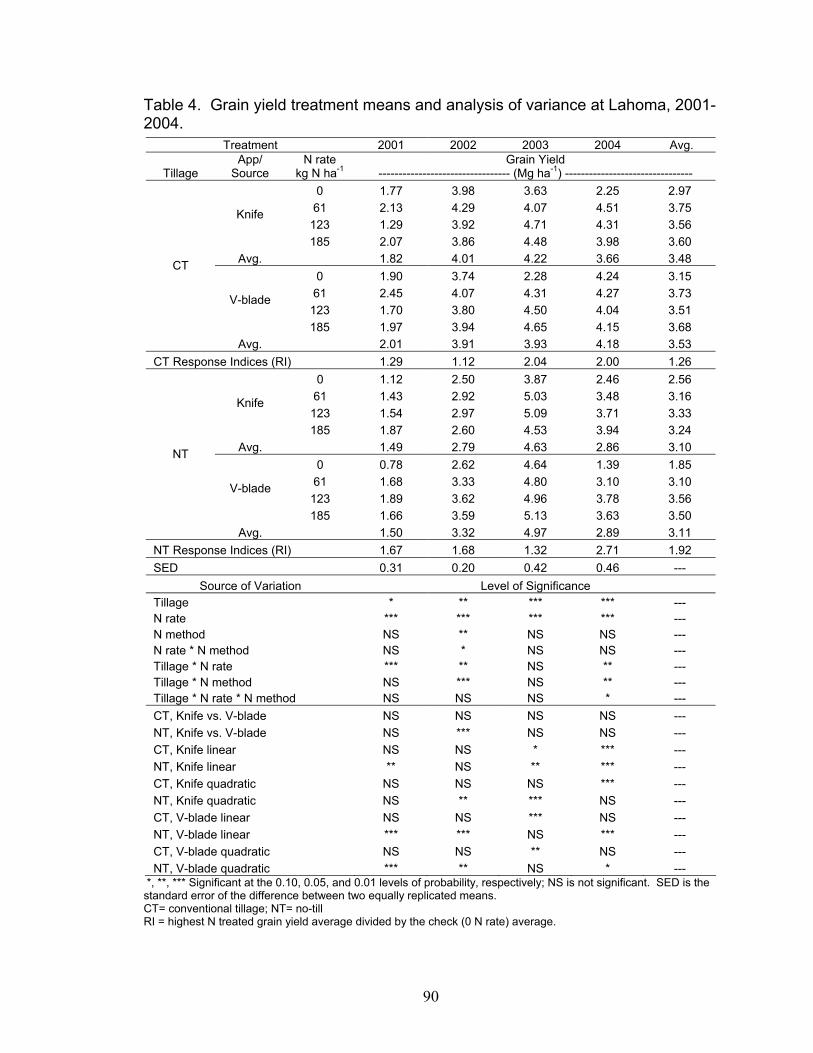
4. Grain yield treatment means and analysis of variance at Lahoma, 2001-2004...............................................................................................90
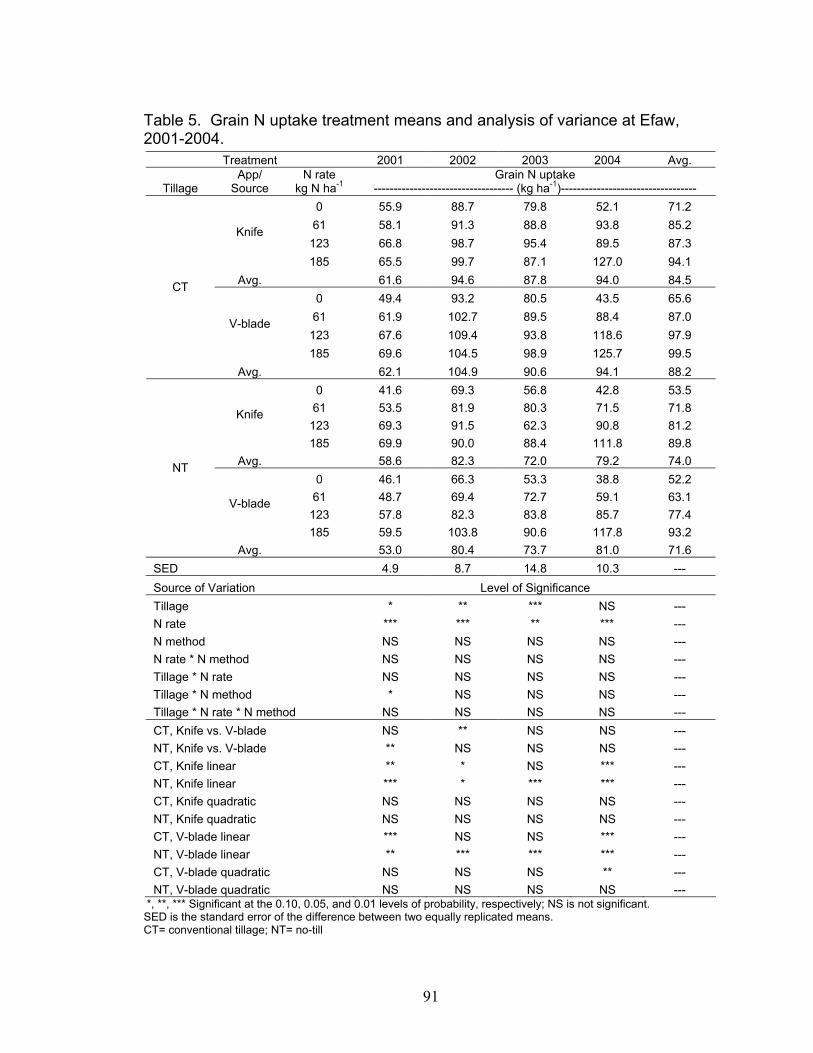
5. Grain N uptake treatment means and analysis of variance at Efaw, 2001-2004...............................................................................................91
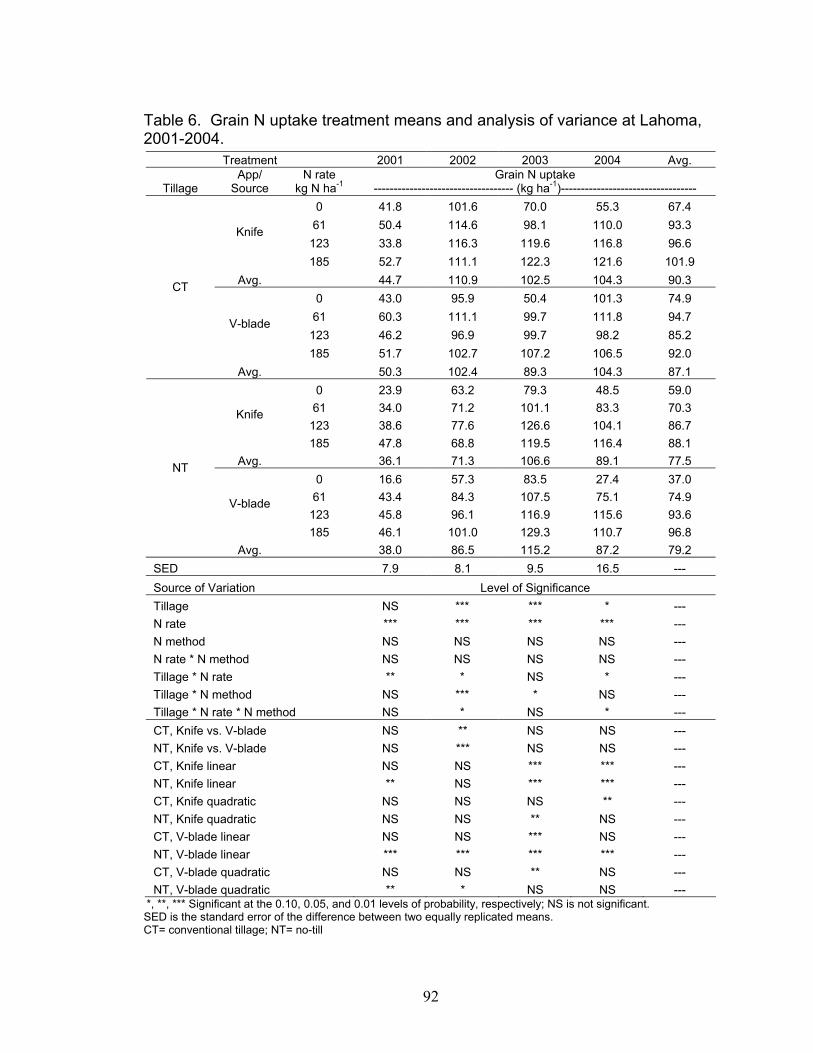
6. Grain N uptake treatment means and analysis of variance at Lahoma, 2001-2004................................................................................92
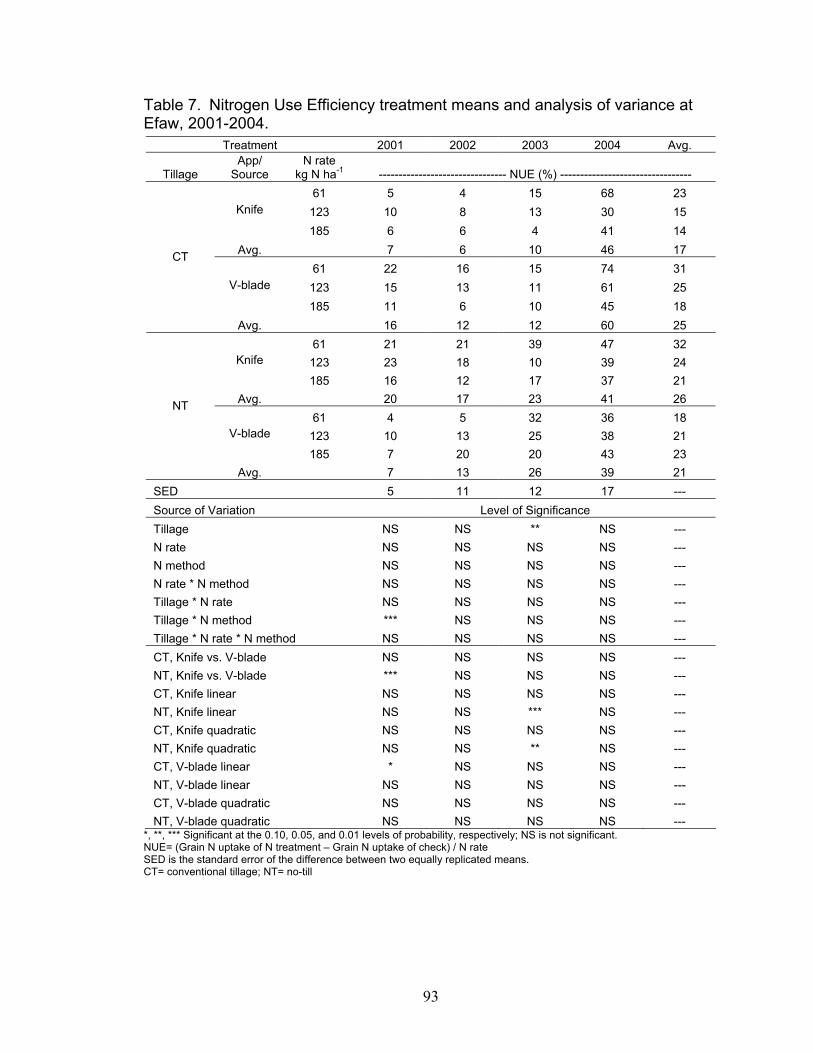
7. Nitrogen Use Efficiency treatment means and analysis of variance at Efaw, 2001-2004.................................................................................93
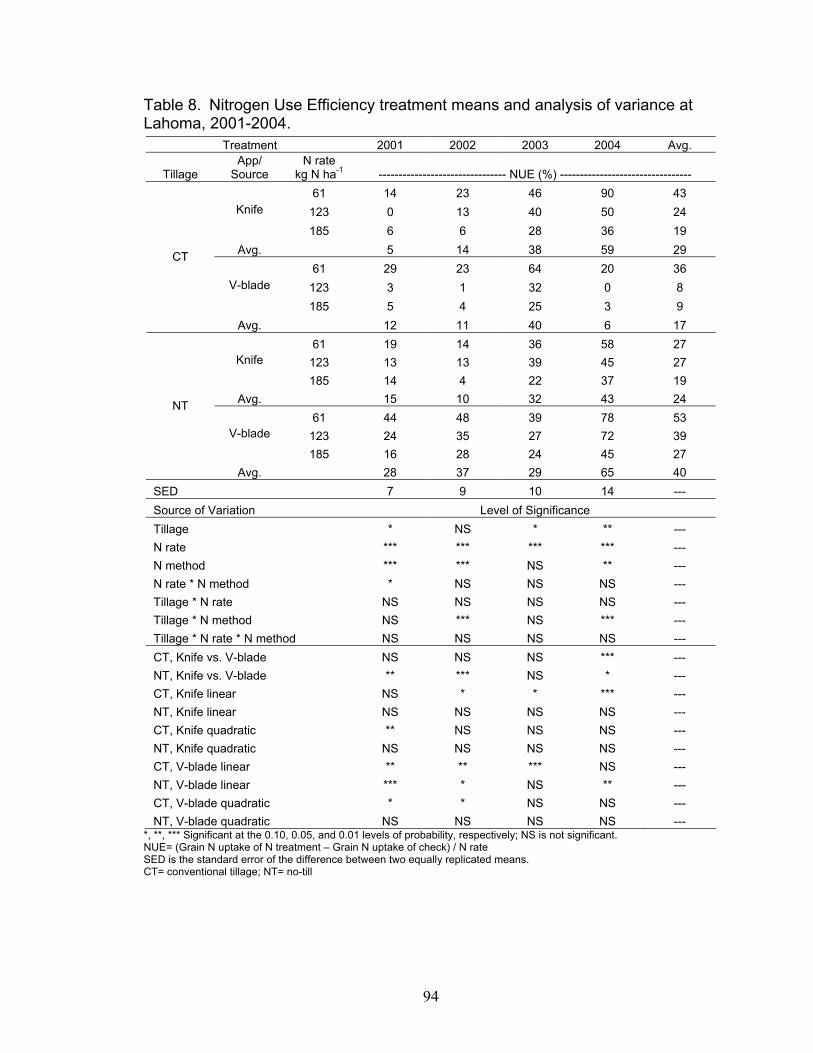
8. Nitrogen Use Efficiency treatment means and analysis of variance at Lahoma, 2001-2004............................................................................94
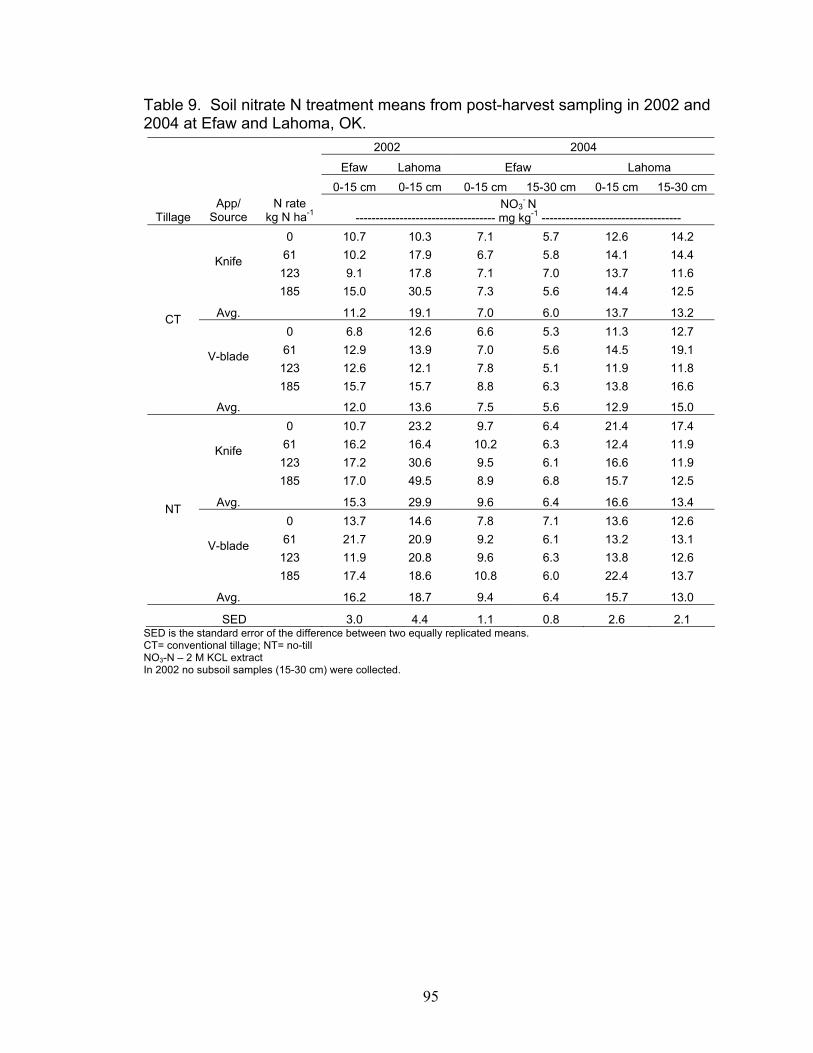
9. Soil nitrate N treatment means from post-harvest sampling in 2002
and 2004 at Efaw and Lahoma, OK........................................................95
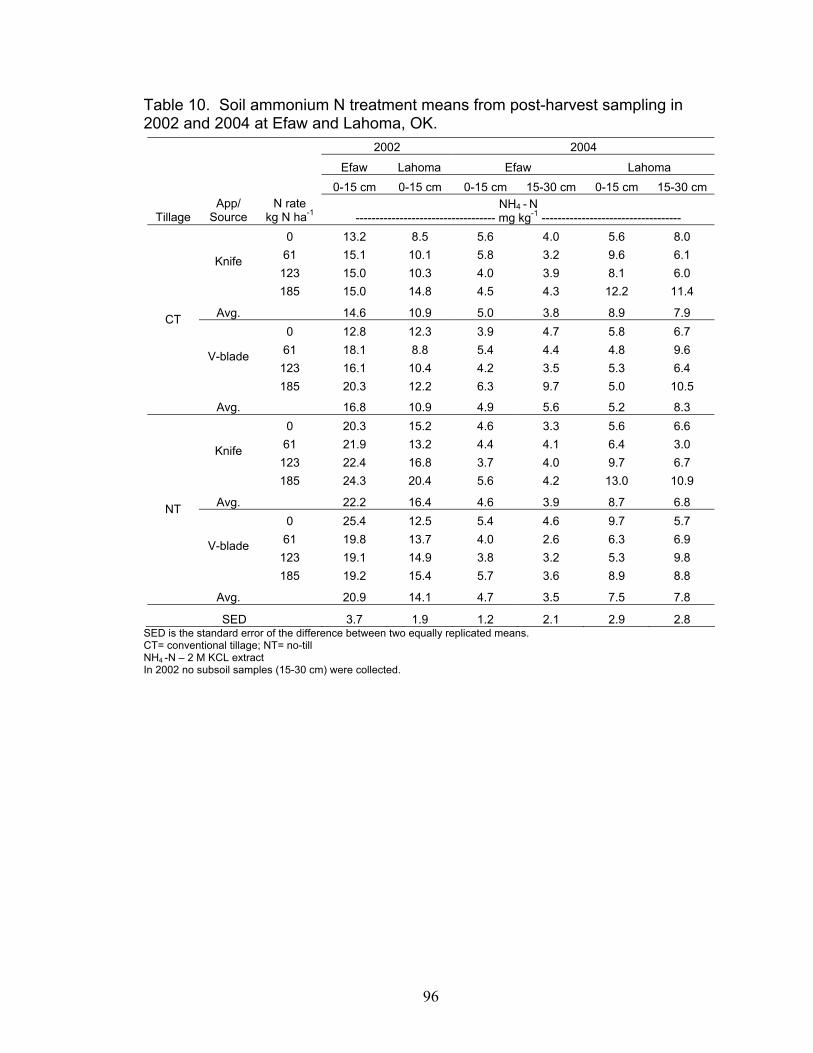
10. Soil ammonium N treatment means from post-harvest sampling in 2002 and 2004 at Efaw and Lahoma, OK...............................................96
viii
LIST OF FIGURES
CHAPTER I Figure Page
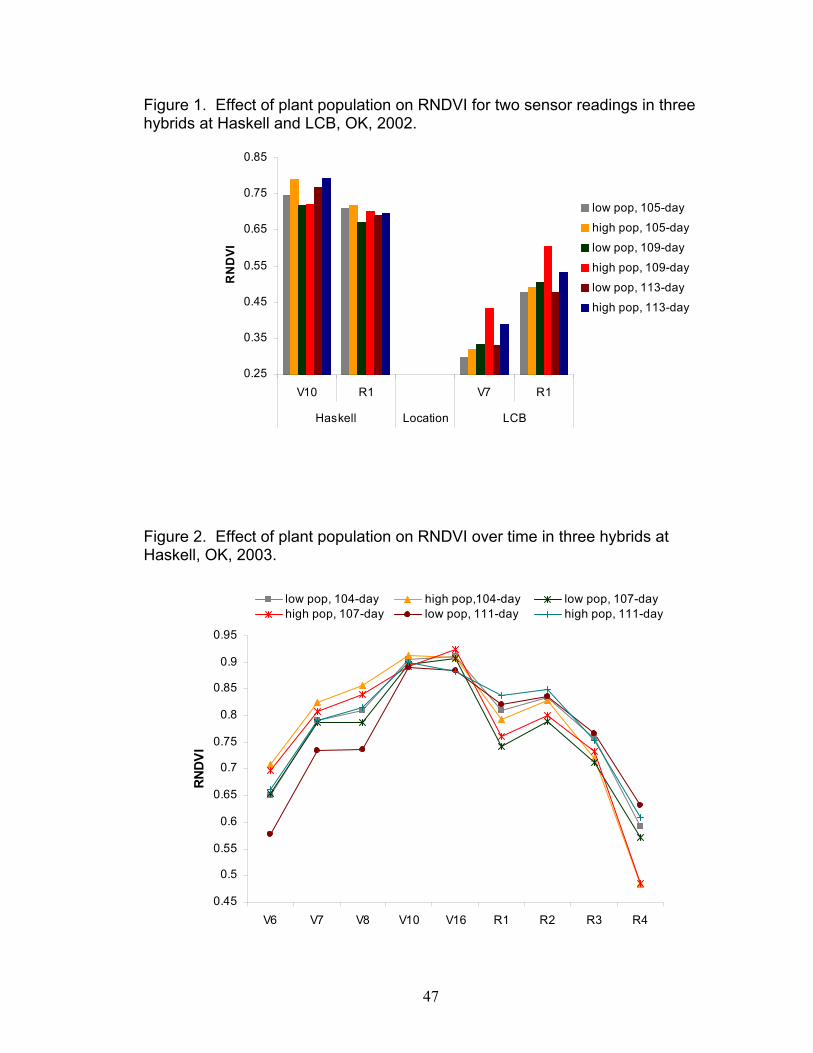
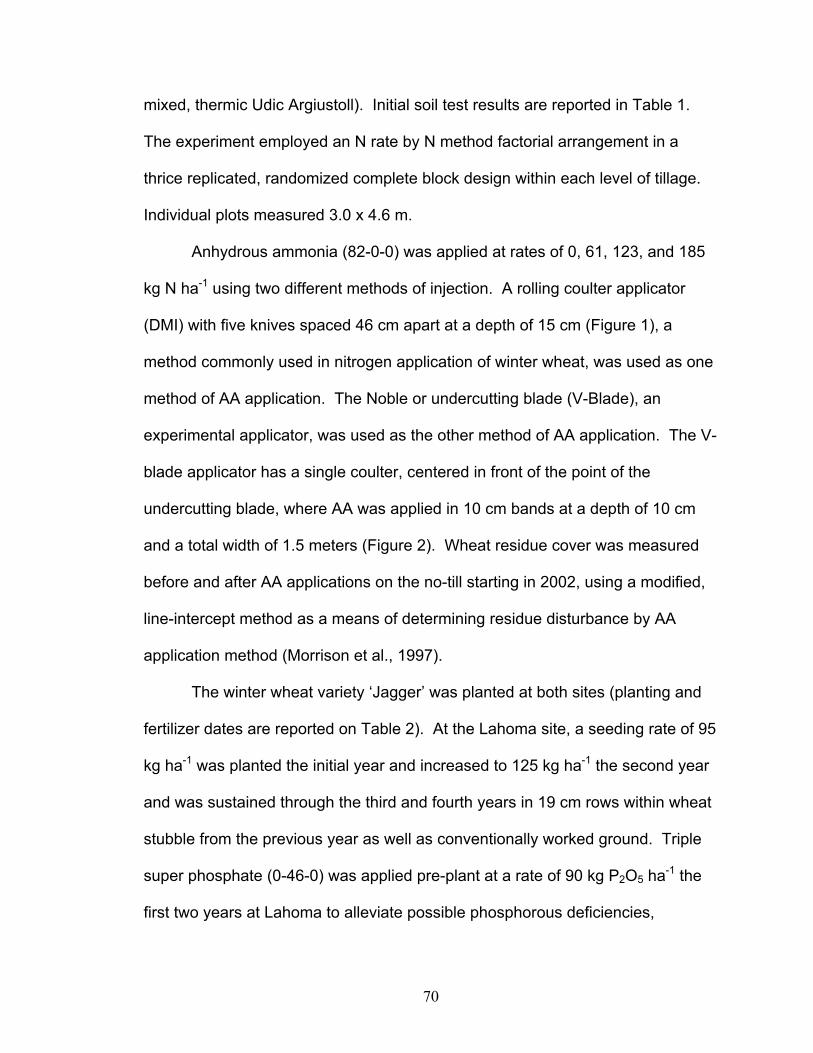
1. Effect of plant population on red NDVI (RNDVI) over two sensor readings in three hybrids at Haskell and LCB, OK, 2002........................47
2. Effect of plant population on RNDVI over time in three hybrids at
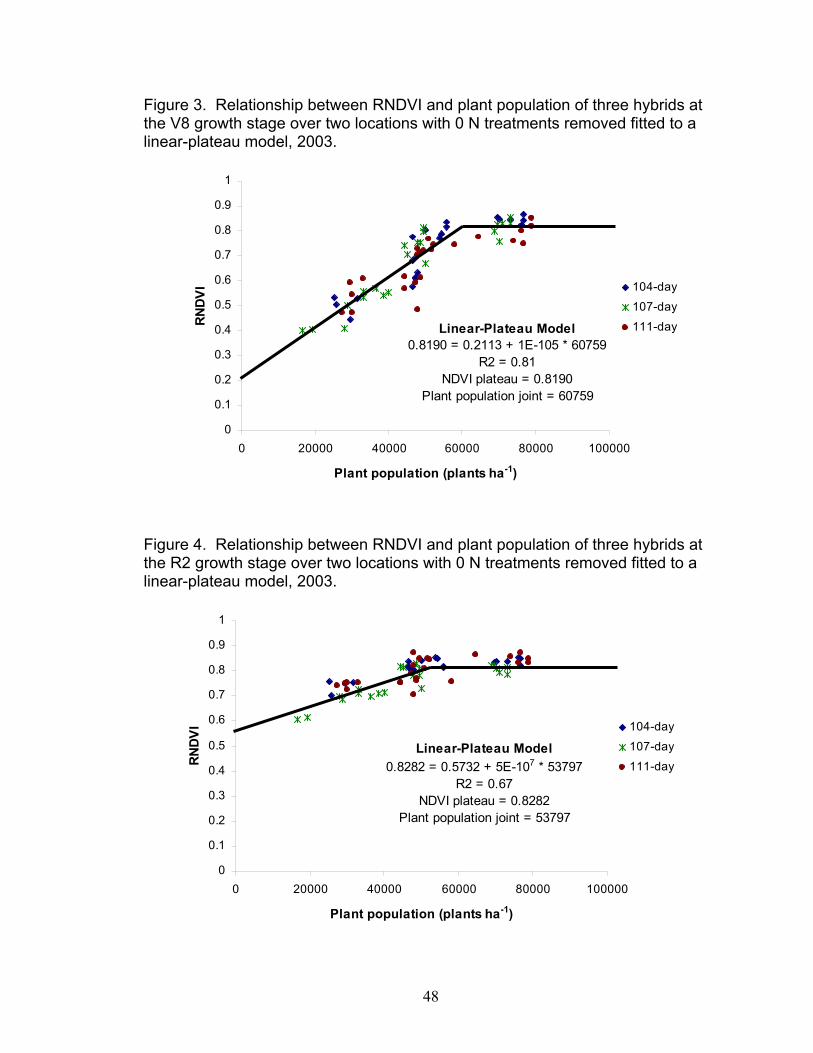
3. Relationship between RNDVI and plant population of three hybrids at the V8 growth stage over two locations with 0N treatments removed fitted to a linear-plateau model, 2003.......................................48
4. Relationship between RNDVI and plant population of three hybrids
at the R2 growth stage over two locations with 0N treatments removed fitted to a linear-plateau model, 2003.......................................48
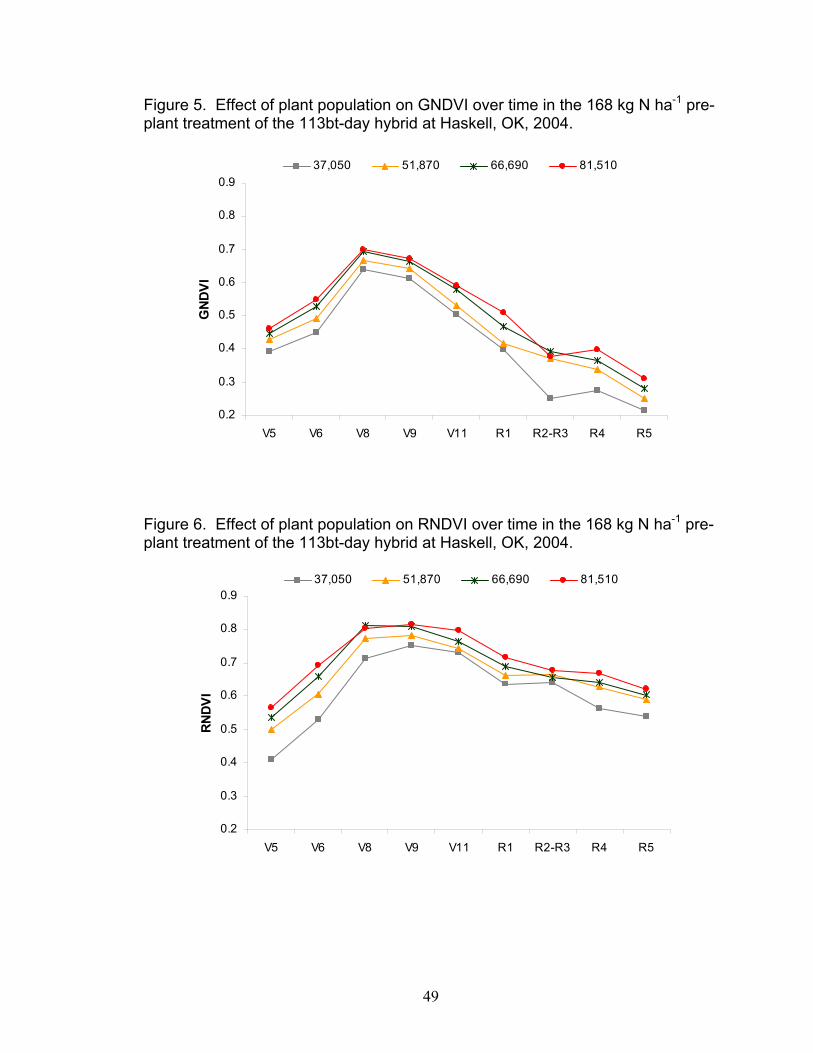
5. Effect of plant population on GNDVI over time in the 168 kg N ha-1
pre-plant treatment of the 113-day hybrid at Haskell, OK, 2004 .............49
6. Effect of plant population on RNDVI over time in the 168 kg N ha-1 pre-plant treatment of the 113-day hybrid at Haskell, OK, 2004 .............49
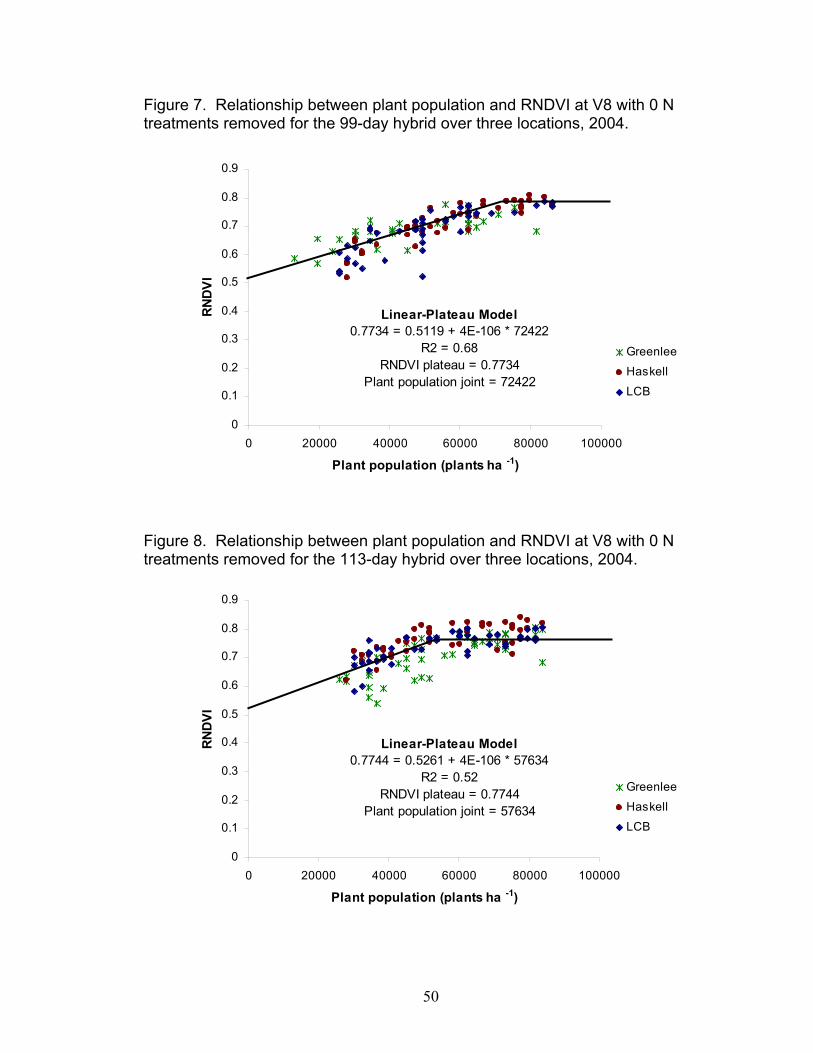
7. Relationship between RNDVI and plant population for the 99-day
hybrid at the V8 growth stage over three locations with 0N treatments removed fitted to a linear-plateau model, 2004.....................50
8. Relationship between RNDVI and plant population for the 113-day
hybrid at the V8 growth stage over three locations with 0N treatments removed fitted to a linear-plateau model, 2004.....................50
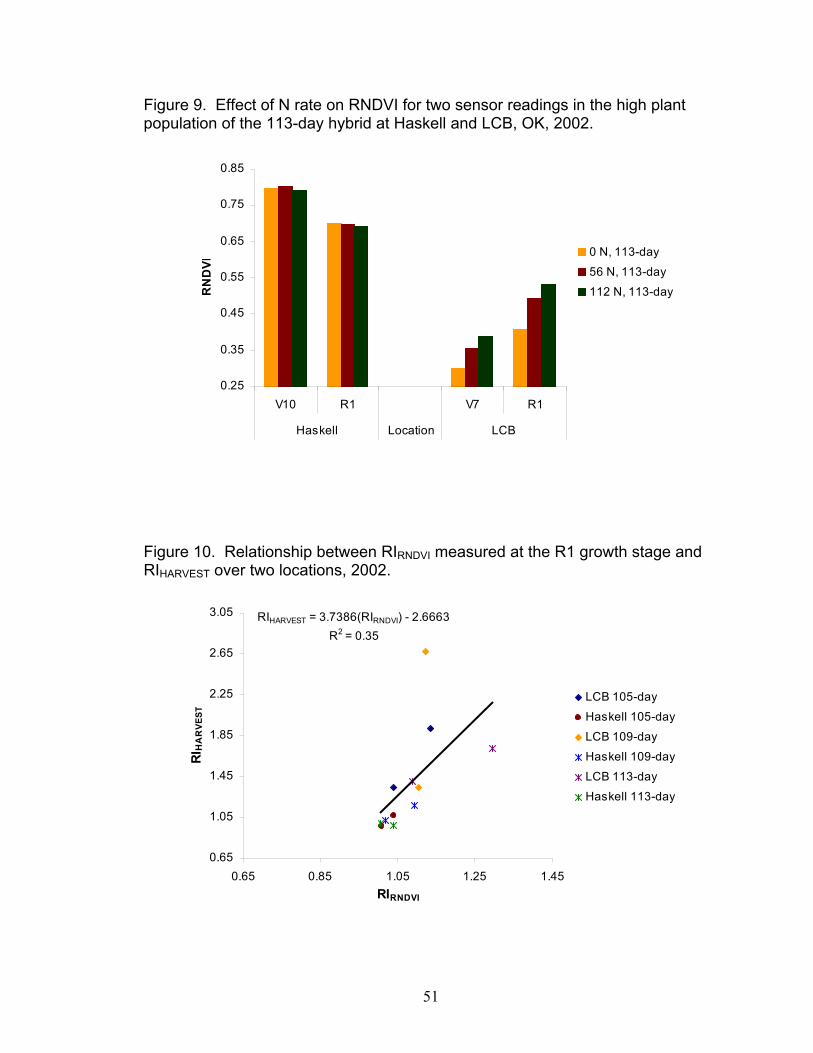
9. Effect of N rate on RNDVI over two sensor readings in the high
plant population of the 113-day hybrid at Haskell, OK, 2002..................51
10. Relationship between RIRNDVI measured at the R1 growth stage and RIHARVEST over two locations, 2002 .........................................................51
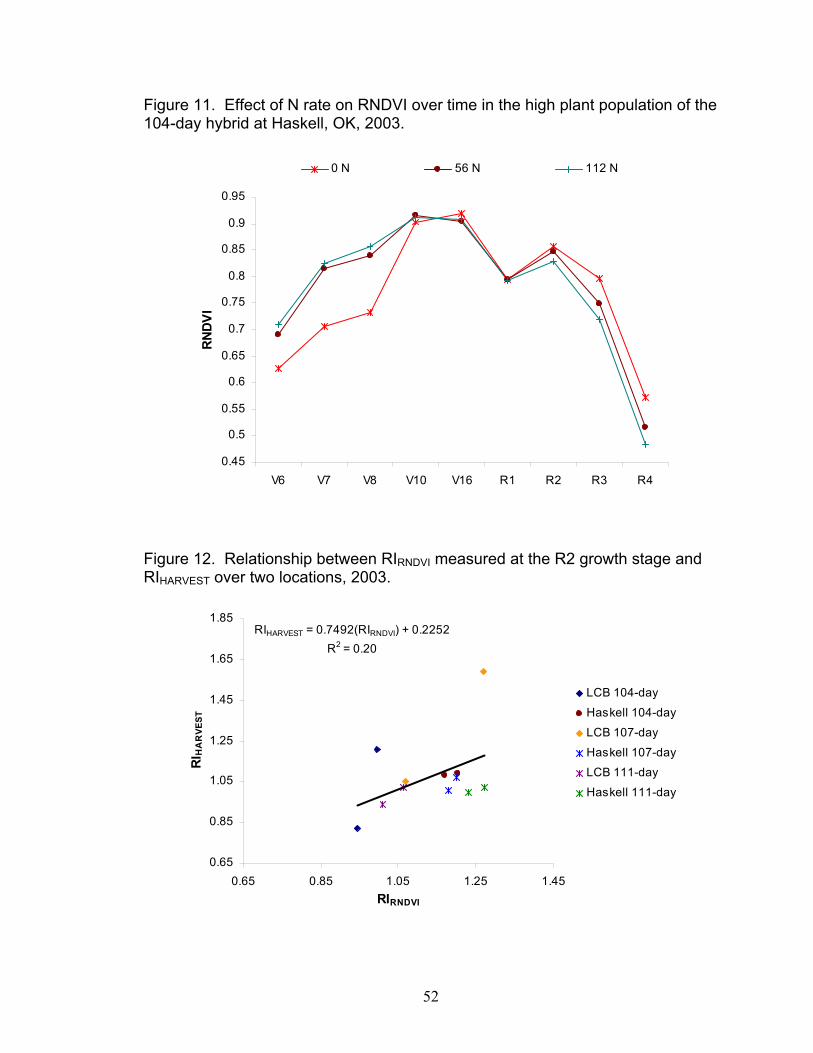
11. Effect of N rate on RNDVI over time in the high plant population of
the 104-day hybrid at Haskell, OK, 2003 ................................................52 12. Relationship between RIRNDVI measured at the R2 growth stage and
RIHARVEST over two locations, 2003 .........................................................52
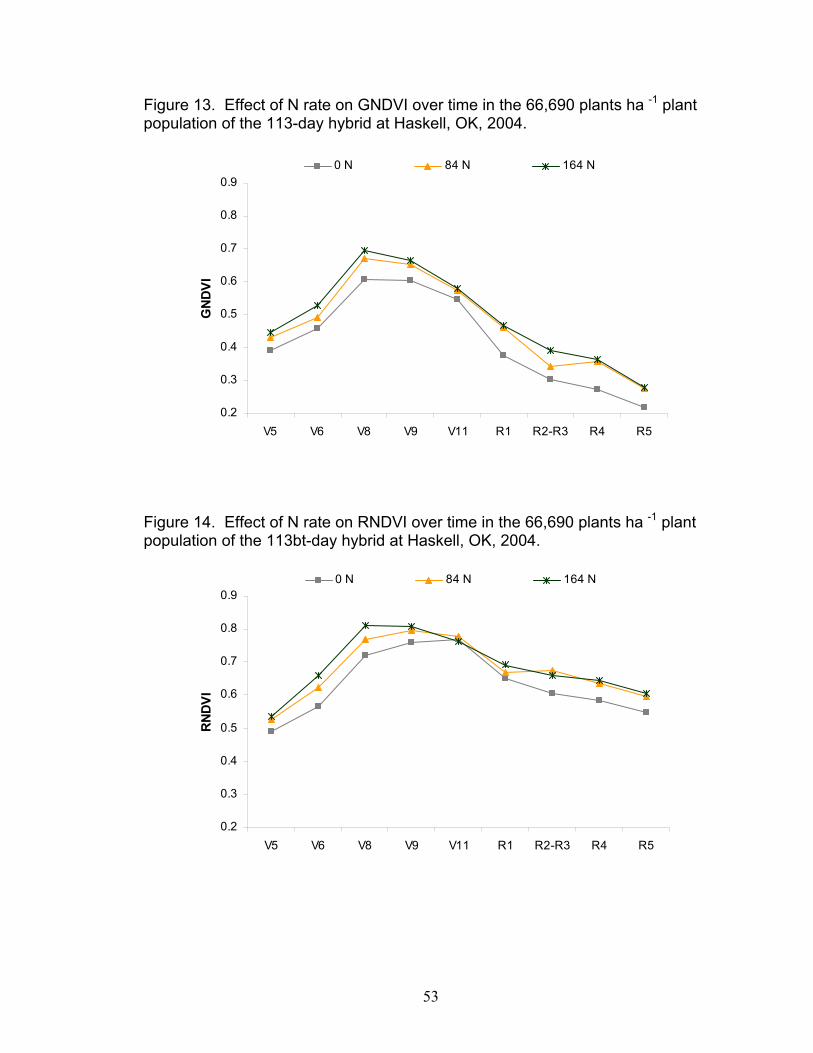
13. Effect of N rate on GNDVI over time in the 66,690 plants ha-1 plant population of the 113-day hybrid at Haskell, OK, 2004...........................53
ix
14. Effect of N rate on RNDVI over time in the 66,690 plants ha-1 plant
population of the 113-day hybrid at Haskell, OK, 2004...........................53
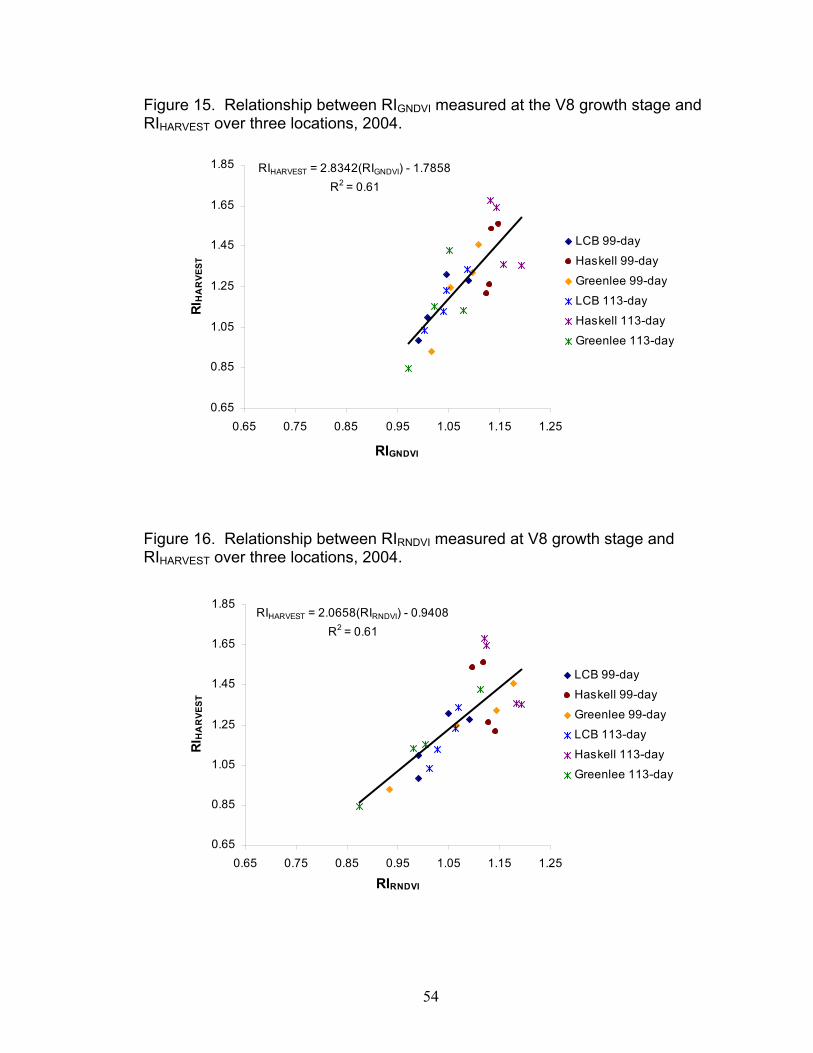
15. Relationship between RIGNDVI measured at the V8 growth stage and RIHARVEST over three locations, 2004.......................................................54
16. Relationship between RIRNDVI measured at the V8 growth stage and
RIHARVEST over three locations, 2004.......................................................54
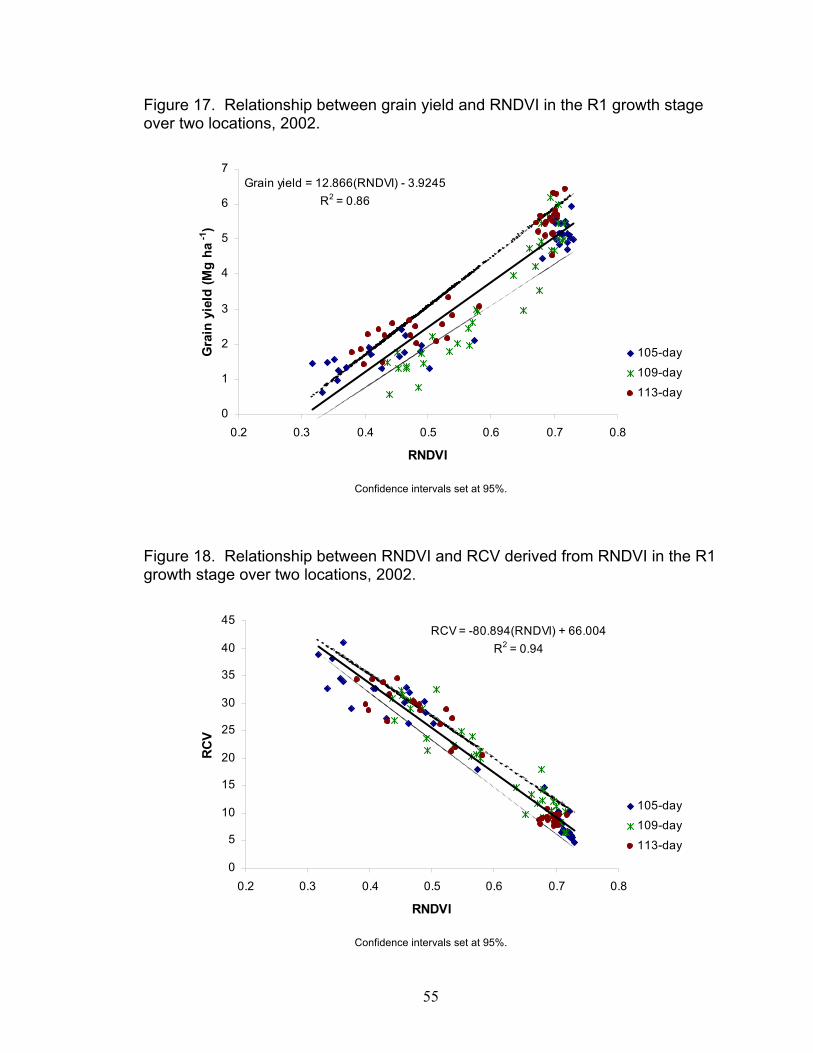
17. Relationship between grain yield and RNDVI in the R1 growth stage over two locations, 2002 ...............................................................55
18. Relationship between RNDVI and RCV derived from RNDVI in the
R1 growth stage over two locations, 2002..............................................55
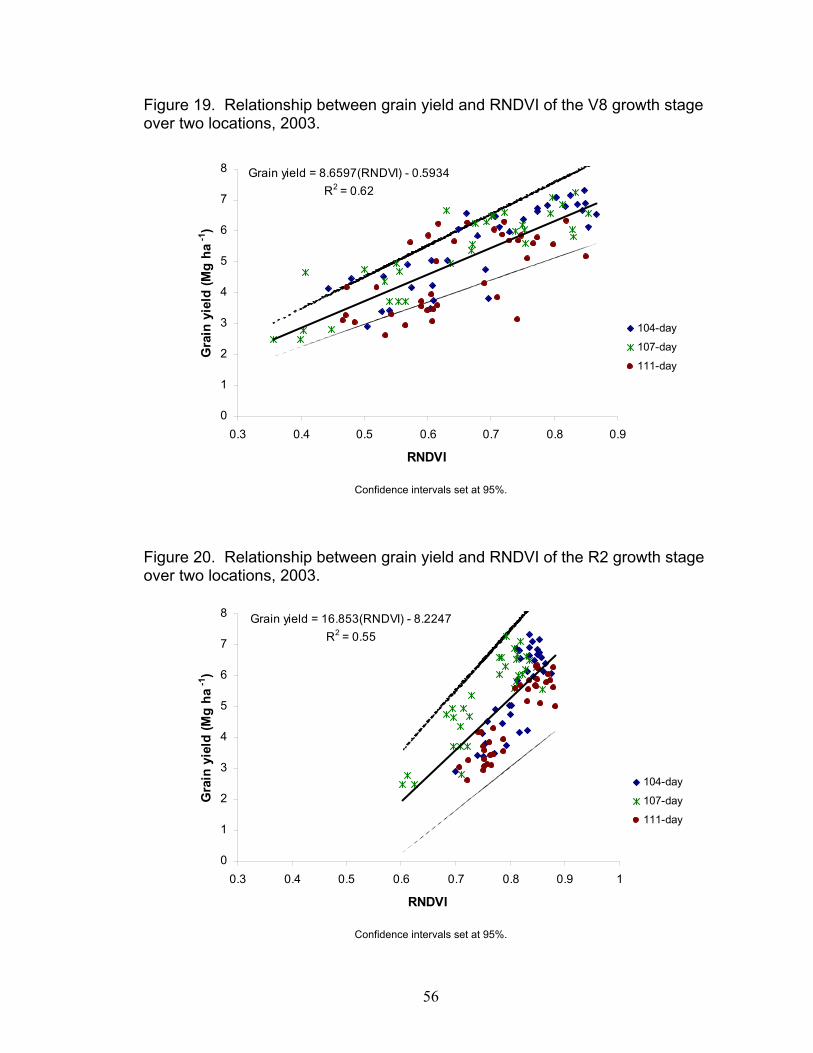
19. Relationship between grain yield and RNDVI of the V8 growth stage over two locations, 2003 ...............................................................56
20. Relationship between grain yield and RNDVI of the R2 growth
stage over two locations, 2003 ...............................................................56
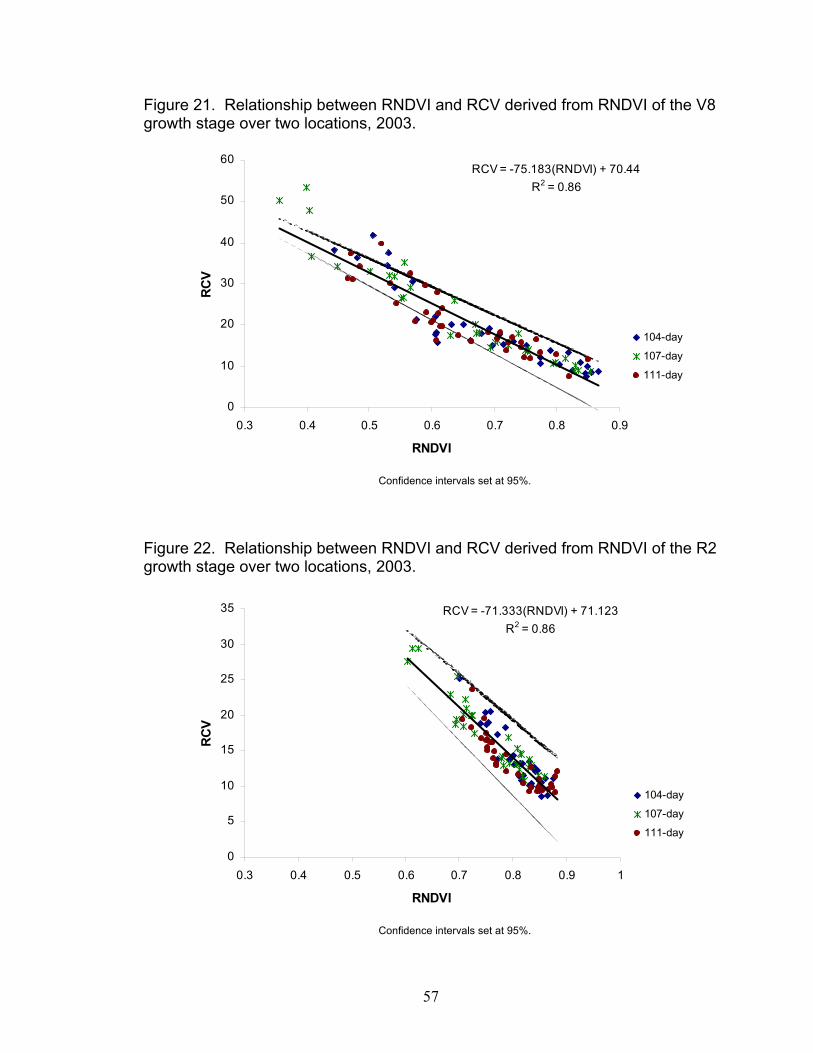
21. Relationship between RNDVI and RCV derived from RNDVI of the V8 growth stage over two locations, 2003 ..............................................57
22. Relationship between RNDVI and RCV derived from RNDVI of the
R2 growth stage over two locations, 2003..............................................57
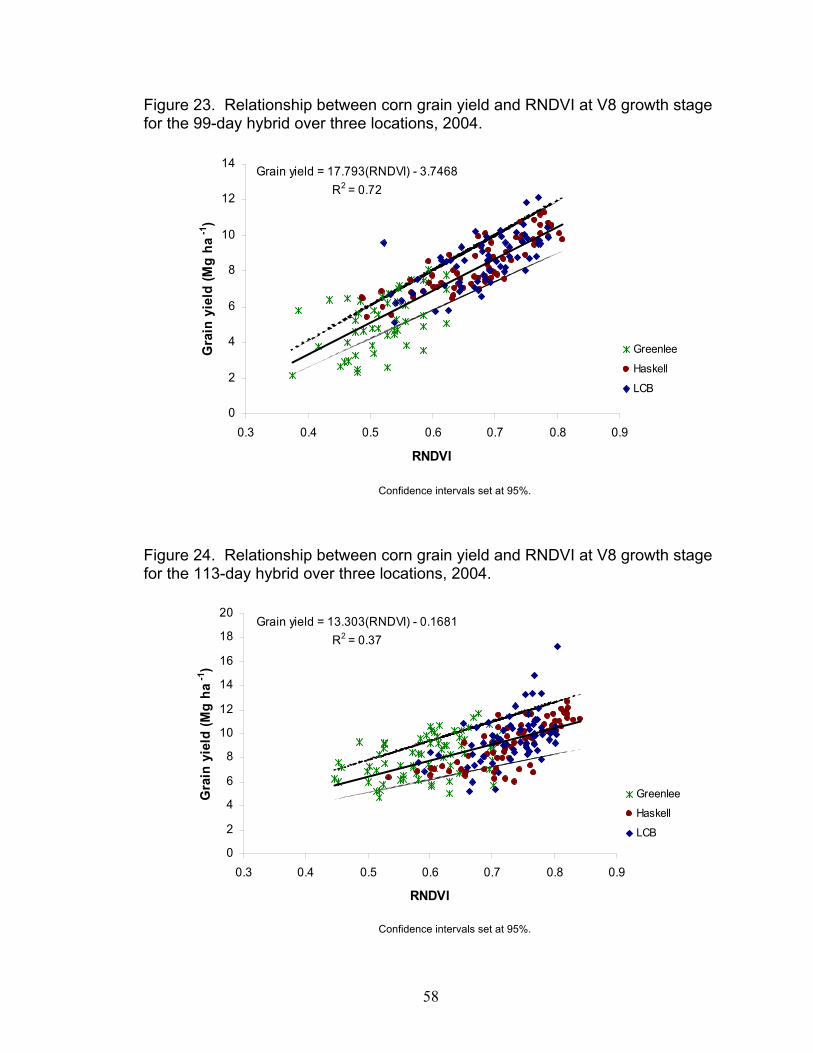
23. Relationship between corn grain yield and RNDVI at V8 growth stage for the 99-day hybrid over three locations, 2004...........................58
24. Relationship between corn grain yield and RNDVI at V8 growth
stage for the 113-day hybrid over three locations, 2004.........................58
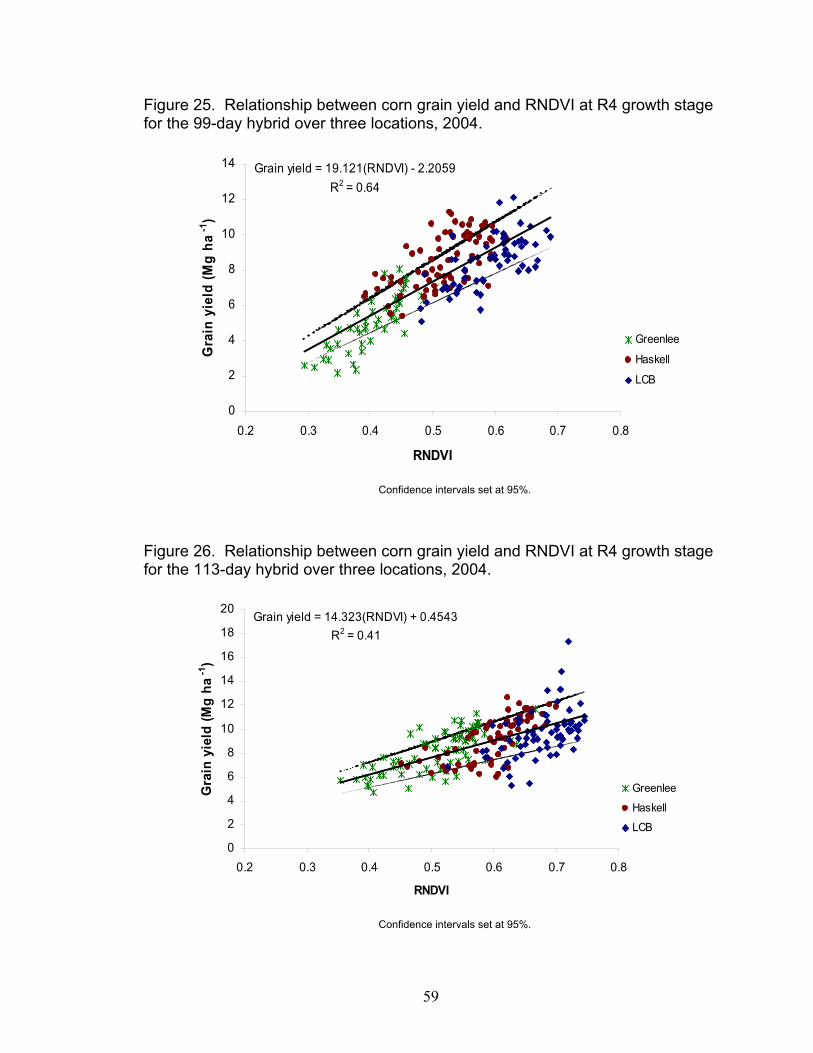
25. Relationship between corn grain yield and RNDVI at R4 growth stage for the 99-day hybrid over three locations, 2004...........................59
26. Relationship between corn grain yield and RNDVI at R4 growth stage for the 113-day hybrid over three locations, 2004.........................59
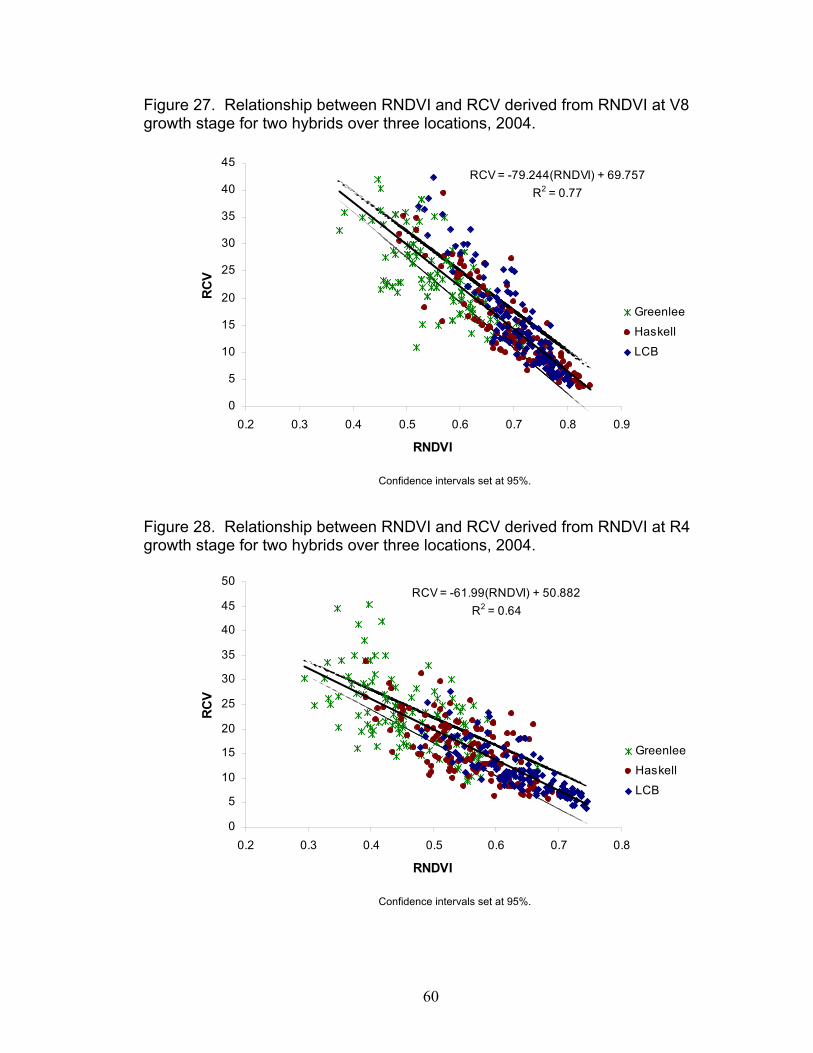
27. Relationship between RNDVI and RCV derived from RNDVI at V8
growth stage for two hybrids over three locations, 2004.........................60
28. Relationship between RNDVI and RCV derived from RNDVI at R4 growth stage for two hybrids over three locations, 2004.........................60
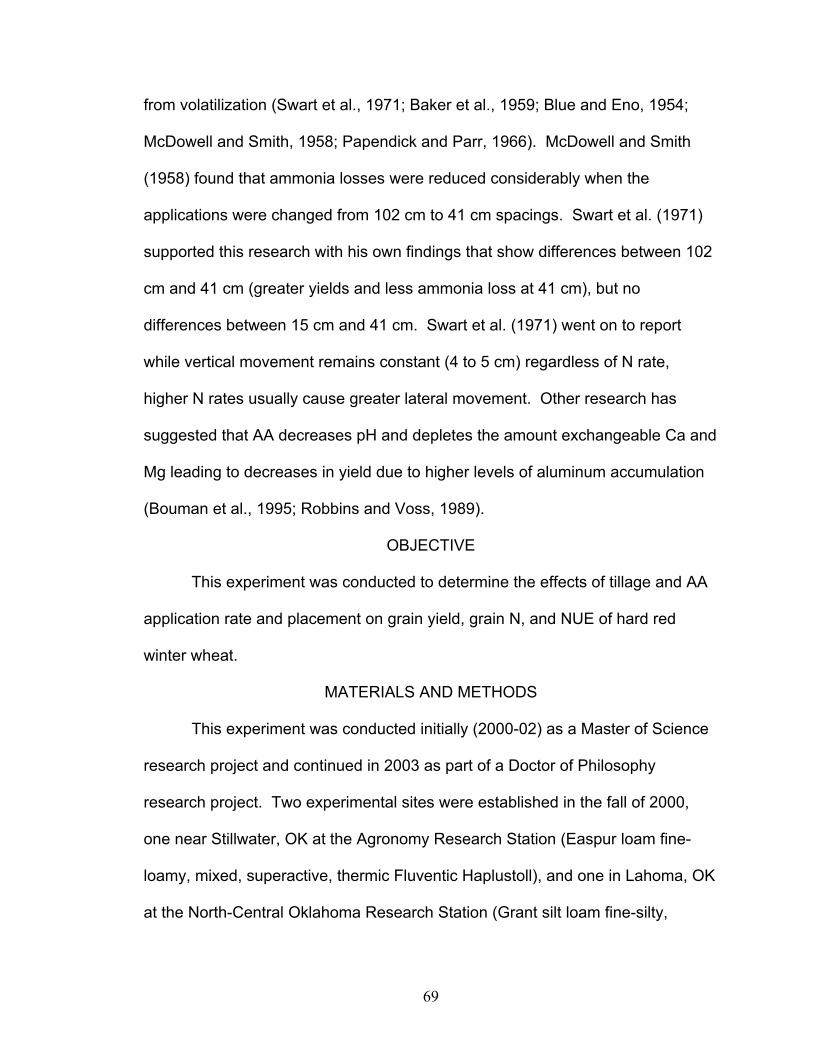
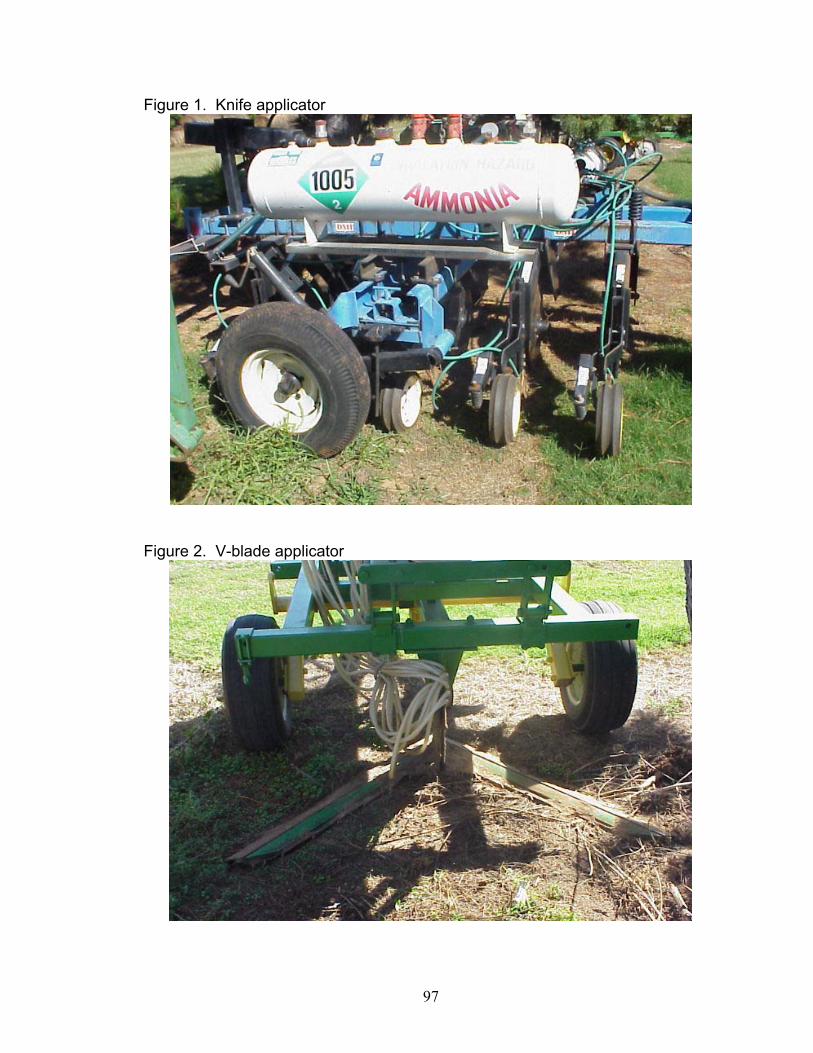
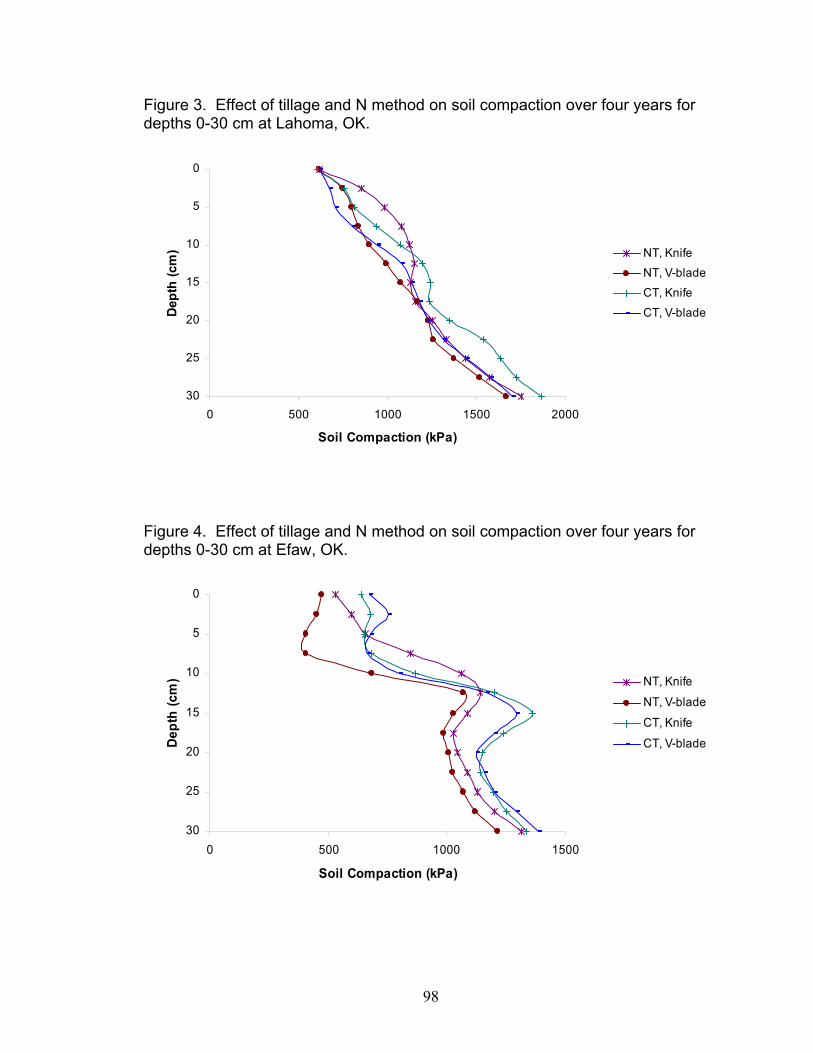
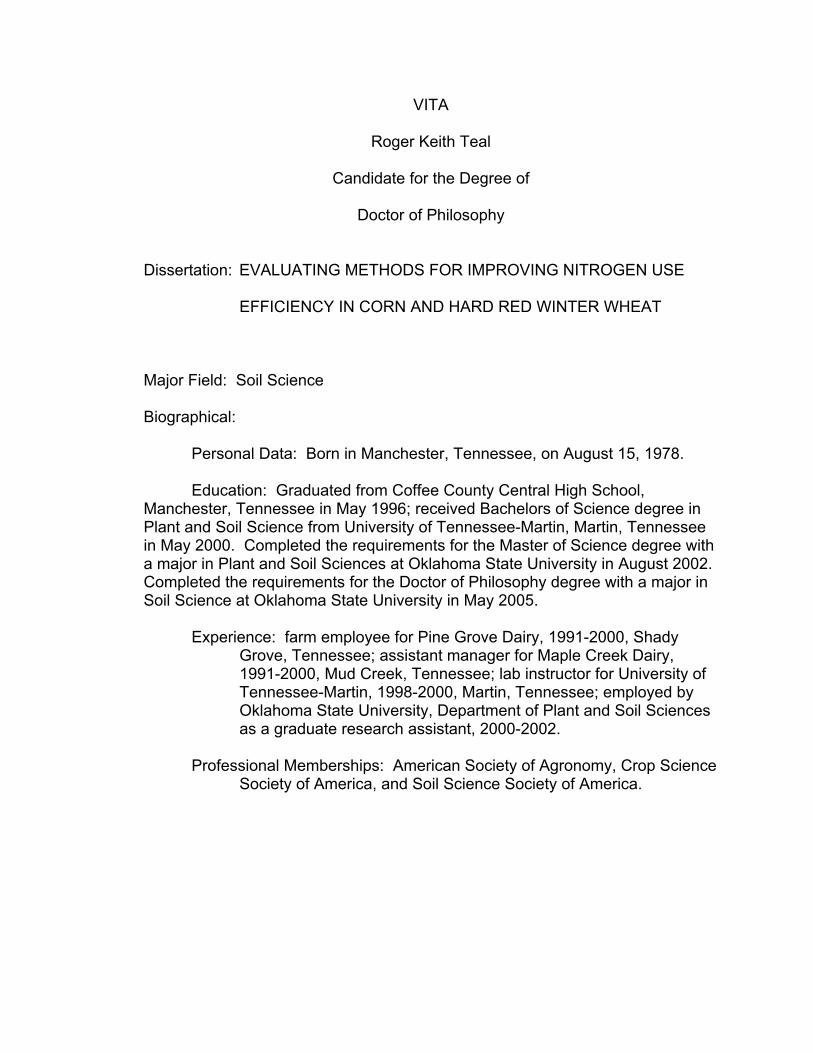
3. Effect of tillage and N method on soil compaction over four years for depths 0-30 cm at Lahoma, OK.........................................................98
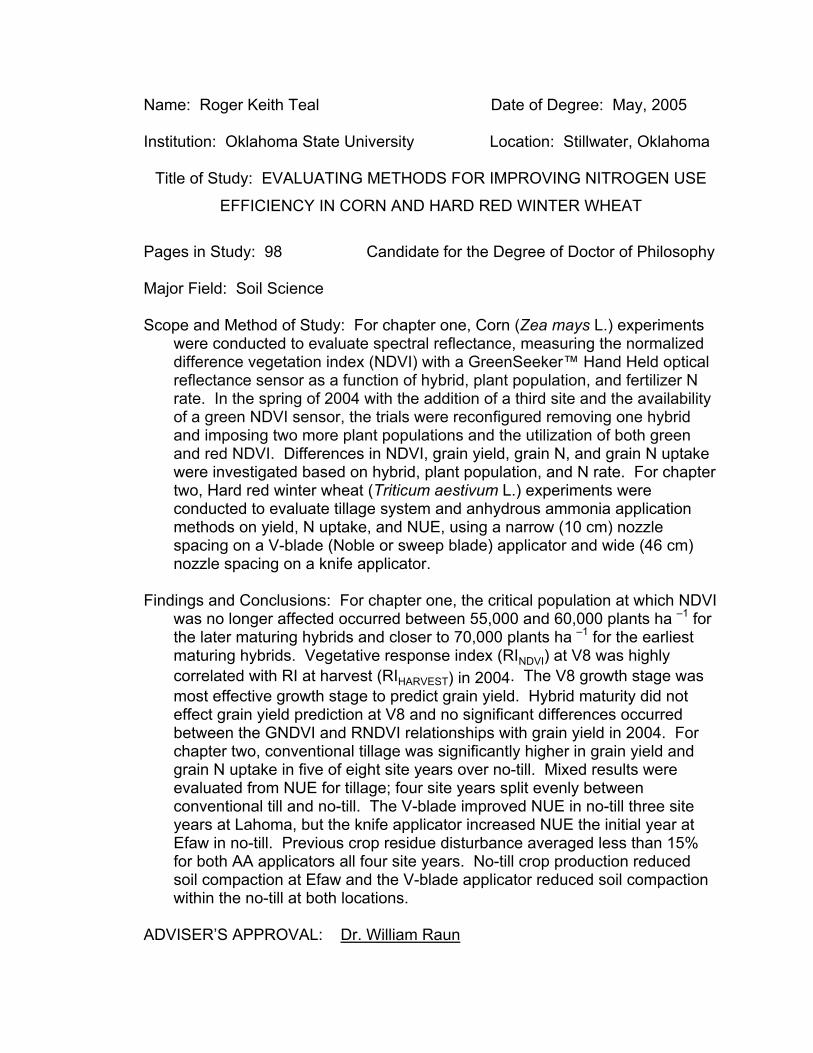
4. Effect of tillage and N method on soil compaction over four years
for depths 0-30 cm at Efaw, OK..............................................................98
1
INFLUENCE OF HYBRID, POPULATION, AND NITROGEN RATE ON
SPECTRAL PREDICTION OF CORN GRAIN YIELD
ABSTRACT
With the escalation in environmental concern and cost of production,
researchers have recently focused on investigating more efficient means of
increasing grain yield while reducing fertilizer use. This study evaluated spectral
reflectance, measuring the normalized difference vegetation index (NDVI) with a
GreenSeeker™ Hand Held optical reflectance sensor as a function of corn (Zea
mays L.) hybrid, plant population, and fertilizer N rate. A linear-plateau model
existed between NDVI and plant population and the critical population at which
NDVI was no longer affected occurred between 55,000 and 60,000 plants ha –1
for the later maturing hybrids and closer to 70,000 plants ha –1 for the earliest
maturing hybrids. Vegetative response index (RINDVI) peaked between V8 and
V9 at responsive locations each year and was highly correlated with RI at harvest
(RIHARVEST) in 2004. Regression analysis indicated that the V8 growth stage was
most effective growth stage to predict grain yield, presumably because the
highest variability in NDVI occurs at the V8 growth stage. Hybrid maturity did not
effect grain yield prediction at V8, but reproductive growth stage yield prediction
will require hybrid maturity categorization. Comparisons made between the
GNDVI and RNDVI relationships with grain yield in 2004 showed no significant
differences over three locations. However, separate yield prediction models for
GNDVI and RNDVI will be required, since GNDVI values are about 10% lower
than RNDVI and would underestimate yield potential using the same model.
2
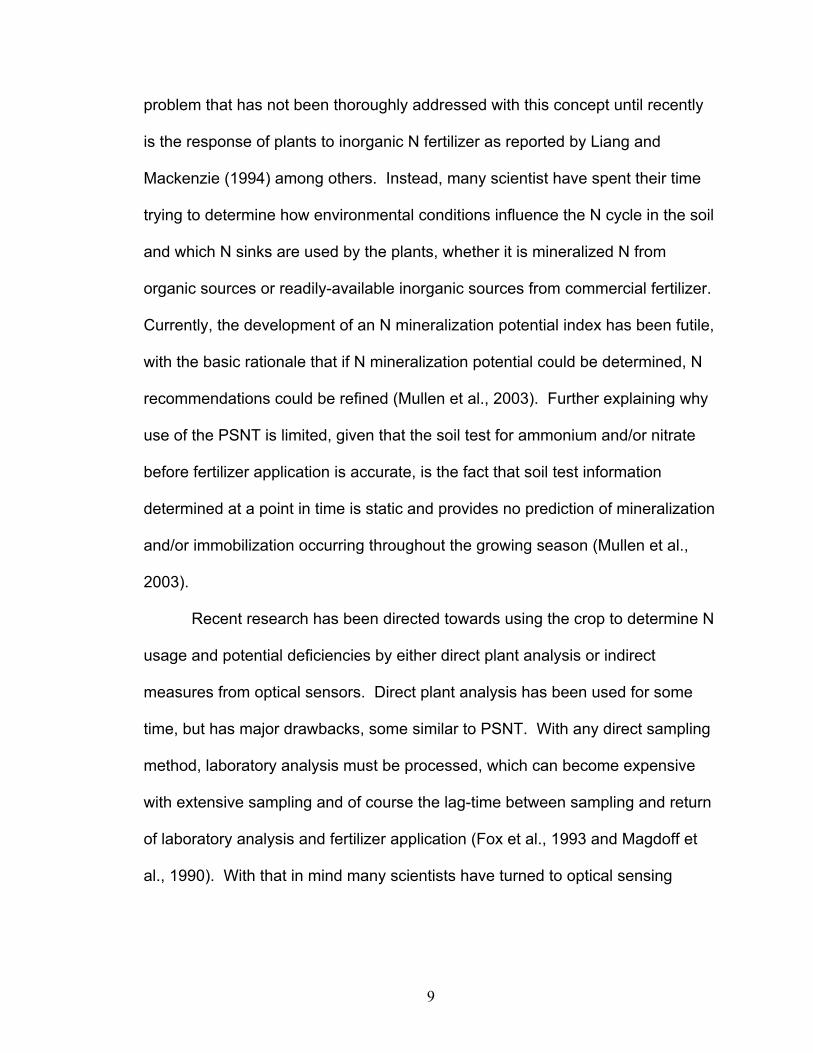
INTRODUCTION
As environmental concerns continue to escalate and agriculture
production becomes more scrutinized, new fertilizer application practices will
continue to be researched with the goal of increasing fertilizer use efficiency.
Currently, the Environmental Protection Agency (EPA) is reporting that
watersheds in all 48 states of the continental U.S. tested for nitrate nitrogen
(NO3-) groundwater contamination levels above the maximum contaminant level
(MCL), of which Oklahoma is ranked 14th (EPA, 1999a). Production of cereal
grains has largely been held responsible for this groundwater contamination, in
particular corn (Zea mays L.) production, where high nitrogen (N) rates have
been applied in high yielding environments. However, most of the corn-belt
states have lower NO3- groundwater levels than surrounding states with minimal
corn acreage. Excessive N applications to cereal grain crops continue to pollute
the environment, increasing human health risk and costing farmers needless
additional expense along with negative publicity. This exemplifies the need for
continued research to improve fertilizer use efficiency. As a function of
increasing nitrogen use efficiency (NUE) research, this study was conducted to
evaluate the potential of using a spectral reflectance normalized difference
vegetation index (NDVI) to determine N response and predict grain yield in corn.
The effects of corn hybrid, plant population, and fertilizer N rate on NDVI were
also evaluated to establish what adaptations might be necessary to use NDVI
over a wide range of field conditions.
LITERATURE REVIEW
3
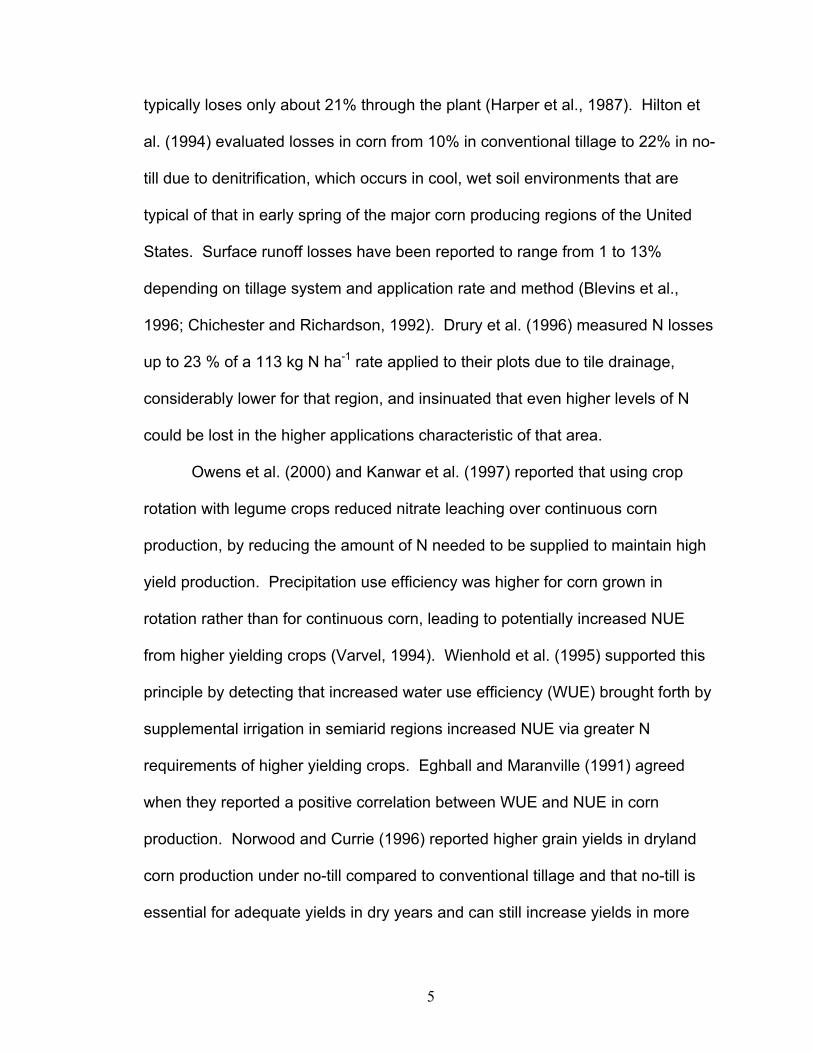
Nitrogen contamination of ground water has been linked to ill effects in
humans. Short-term exposure to nitrate (NO3-) through ingestion can cause a
serious illness in infants due to the conversion of NO3- to nitrite (NO2
-) by the
body, which can interfere with the oxygen-carrying capacity of the child’s blood
(EPA, 1999b). Most cases of infant methemoglobinemia (blue baby syndrome)
are associated with exposure to NO3- in drinking water used to prepare infants'
formula at levels >20 mg/L of nitrate-nitrogen (Bosch et al., 1950; Walton, 1951).
With symptoms including shortness of breath and blueness of the skin, this can
be an acute condition in which health deteriorates rapidly over a period of days
(EPA, 1999b). Lifetime exposure at levels above the maximum contaminant
(Greenref/Greeninc)]} and RNDVI {RNDVI = [(NIRref/NIRinc) – (Redref/Redinc)] /
[(NIRref/NIRinc) + (Redref/Redinc)]} was measured at different vegetative and
reproductive growth stages at all sites (sensing dates and growth stages
presented in Table 3) with a GreenSeeker™ Hand Held optical reflectance
sensor (Ntech Industries, Ukiah, CA). The center two rows of each corn plot
16
were sensed separately with the sensor nadir to the ground and approximately
70 cm above the crop canopy. Corn grain was harvested (picked and shucked)
by hand from the center two rows of each plot separately and ear weights were
recorded for each row. Four random ears from each row were collectively
weighed, dried in a forced air oven at 66oC, and weighed again to determine
moisture levels. Following the measurement of dry weights, the four ears were
shelled by hand using a Root-Healey Manufacturing Company (Plymouth, OH)
hand-crank corn sheller and the grain weight was taken to determine an average
cob weight for each row. Finally, a grain yield from each row was calculated by
adjusting grain weight to 15.5% moisture and a grain sub-sample was taken for
total N analysis.
Data analysis
Grain samples were dried in a forced air oven at 66oC, ground to pass a
140 mesh sieve (100 um), and analyzed for total N content using a Carlo-Erba
NA 1500 automated dry combustion analyzer (Schepers et al., 1989). Nitrogen
use efficiency was determined using the difference method: dividing the
difference between the grain N uptake of the N treatment and the grain N uptake
of the check (0 N rate) by the N rate of the N treatment. Vegetative or In-season
RI (RINDVI) was calculated dividing the highest mean NDVI N treatment by the
mean NDVI check treatment. Grain or Harvest RI (RIHARVEST) was calculated
dividing the highest N treated grain yield average by the check average.
Analyses of variance and single degree of freedom contrasts were performed
using SAS (SAS, 1990). Linear and non-linear (linear-plateau) regression
17
models were used to determined the relationships present between grain yield
and NDVI as well as between NDVI and the treatment variables.
RESULTS AND DISCUSION
Hybrid and Plant Population
Crop Year 2002
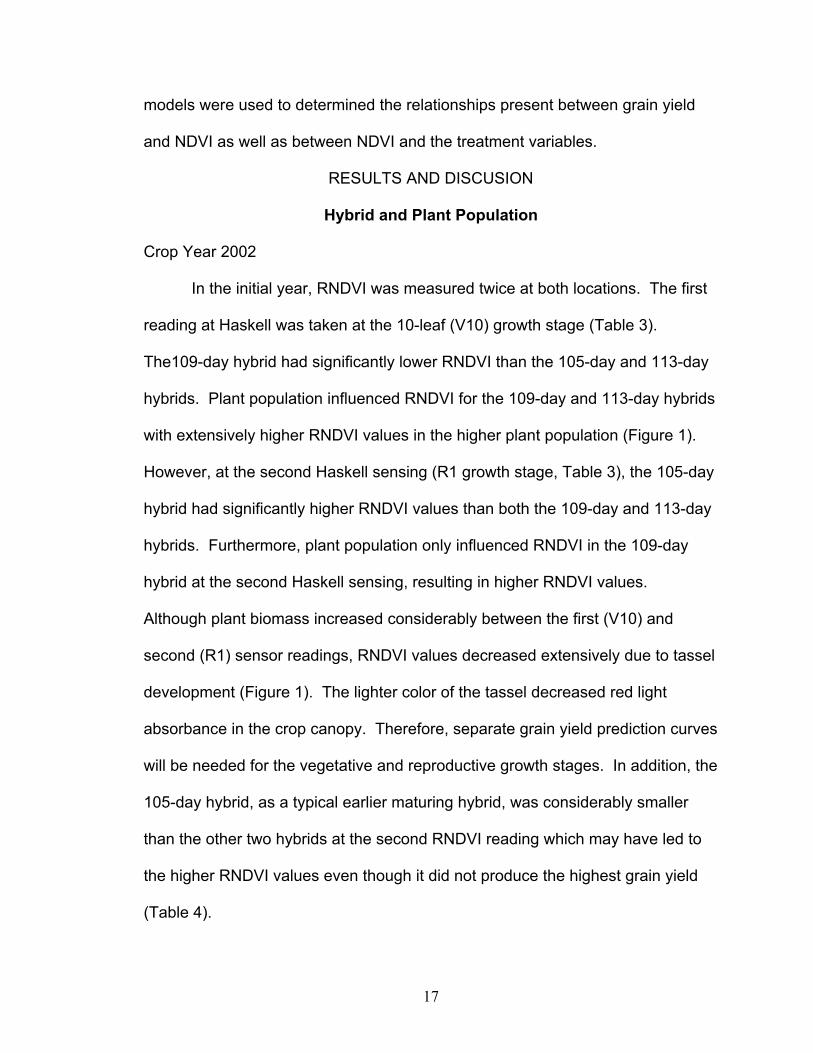
In the initial year, RNDVI was measured twice at both locations. The first
reading at Haskell was taken at the 10-leaf (V10) growth stage (Table 3).
The109-day hybrid had significantly lower RNDVI than the 105-day and 113-day
hybrids. Plant population influenced RNDVI for the 109-day and 113-day hybrids
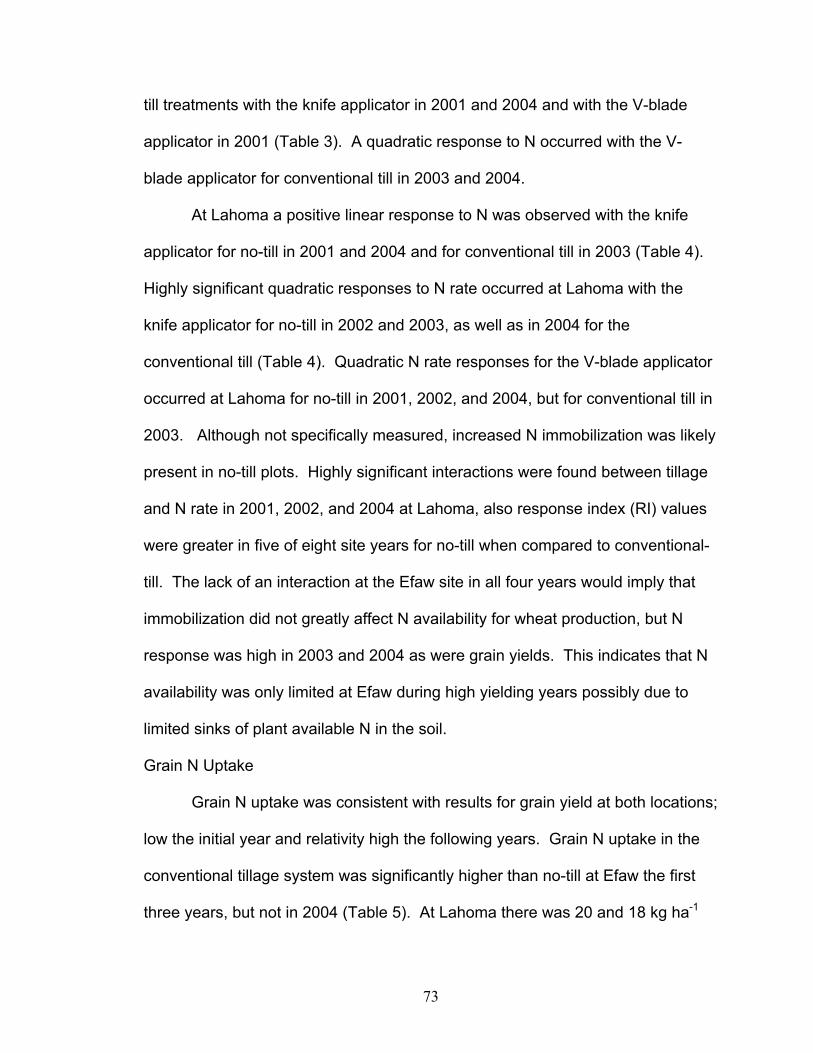
with extensively higher RNDVI values in the higher plant population (Figure 1).
However, at the second Haskell sensing (R1 growth stage, Table 3), the 105-day
hybrid had significantly higher RNDVI values than both the 109-day and 113-day
hybrids. Furthermore, plant population only influenced RNDVI in the 109-day
hybrid at the second Haskell sensing, resulting in higher RNDVI values.
Although plant biomass increased considerably between the first (V10) and
second (R1) sensor readings, RNDVI values decreased extensively due to tassel
development (Figure 1). The lighter color of the tassel decreased red light
absorbance in the crop canopy. Therefore, separate grain yield prediction curves
will be needed for the vegetative and reproductive growth stages. In addition, the
105-day hybrid, as a typical earlier maturing hybrid, was considerably smaller
than the other two hybrids at the second RNDVI reading which may have led to
the higher RNDVI values even though it did not produce the highest grain yield
(Table 4).
18
The sensor measurements at LCB were taken at 7-leaf (V7) and silking
(R1) growth stages (Table 3). The 109-day hybrid was consistently higher in
RNDVI than the other two hybrids at both LCB sensor measurements followed by
the113-day hybrid and then the 105-day which coincided with visual height
observations. Plant population increased RNDVI in all three hybrids at the first
sensing, with no effect on RNDVI at the second reading. Since the LCB site
typically receives lower summer precipitation than Haskell, the site was
considered to support lower grain yields and therefore lower plant populations
were used. The LCB site resulted in considerably lower grain yields (Table 4) as
well as lower RNDVI values. However the RNDVI trends differed from Haskell in
that plant population did not affect RNDVI measured at the R1 growth stage at
LCB, which may be attributed to apparent severe drought stress as revealed by
the exceedingly low grain yields (Table 4).
Crop Year 2003
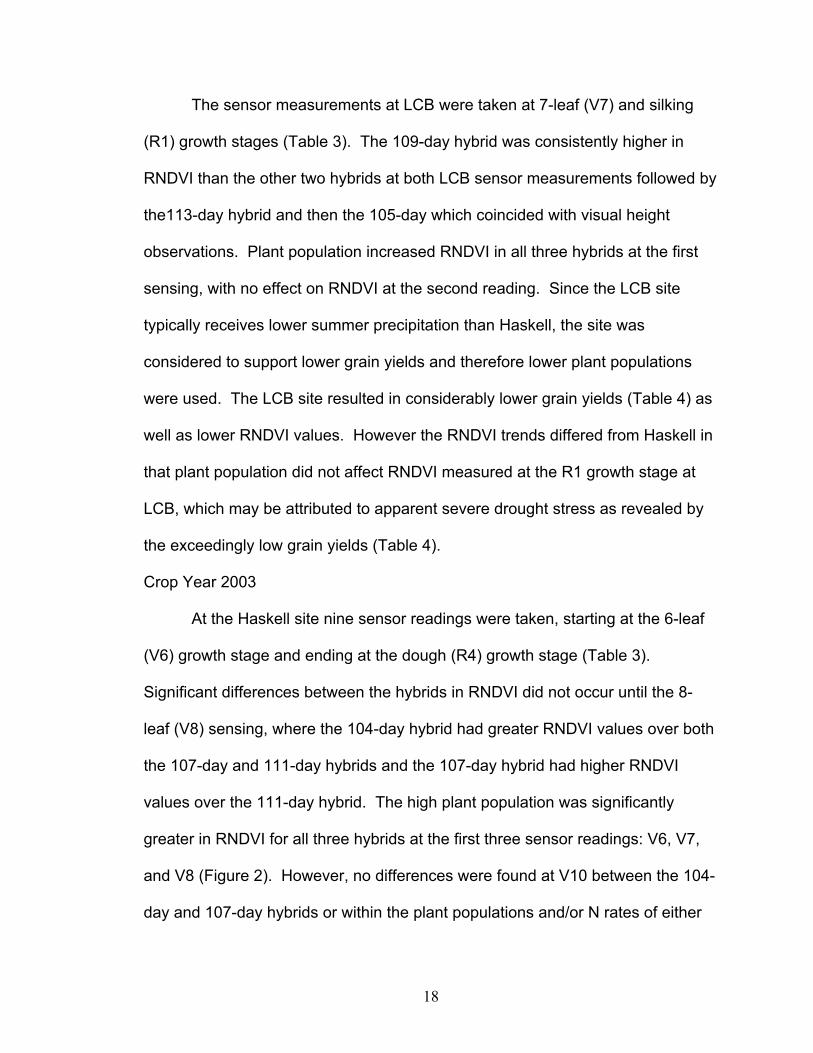
At the Haskell site nine sensor readings were taken, starting at the 6-leaf
(V6) growth stage and ending at the dough (R4) growth stage (Table 3).
Significant differences between the hybrids in RNDVI did not occur until the 8-
leaf (V8) sensing, where the 104-day hybrid had greater RNDVI values over both
the 107-day and 111-day hybrids and the 107-day hybrid had higher RNDVI
values over the 111-day hybrid. The high plant population was significantly
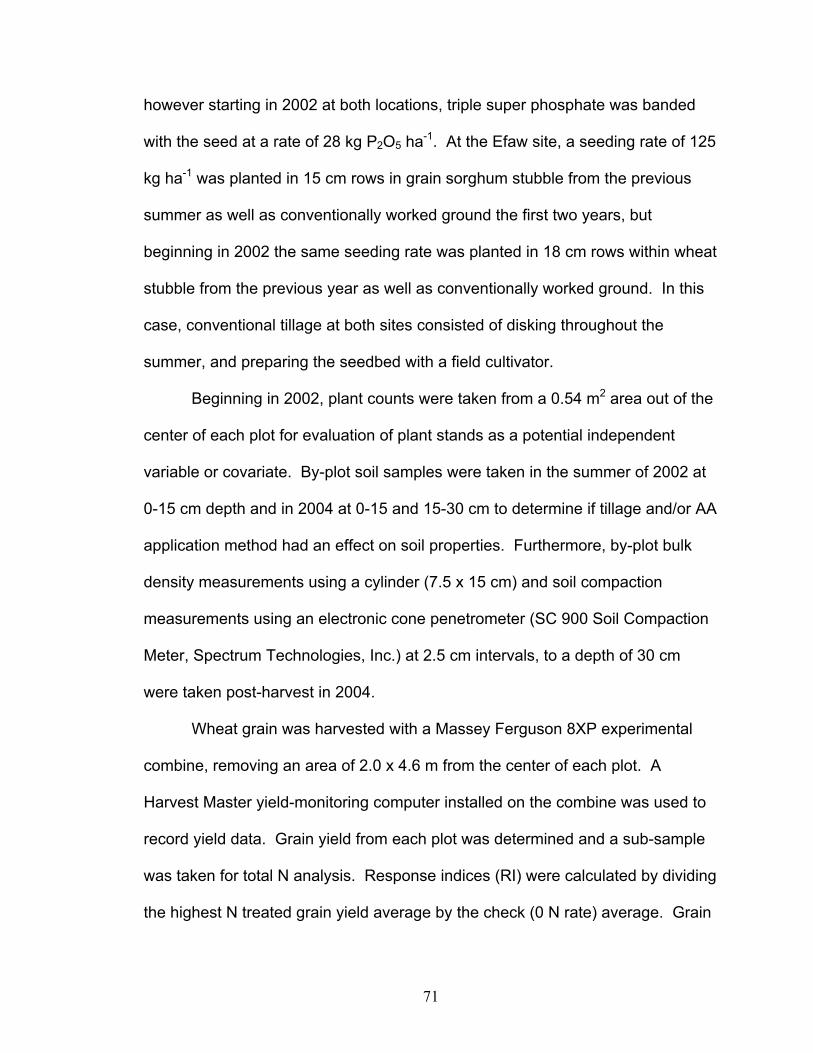
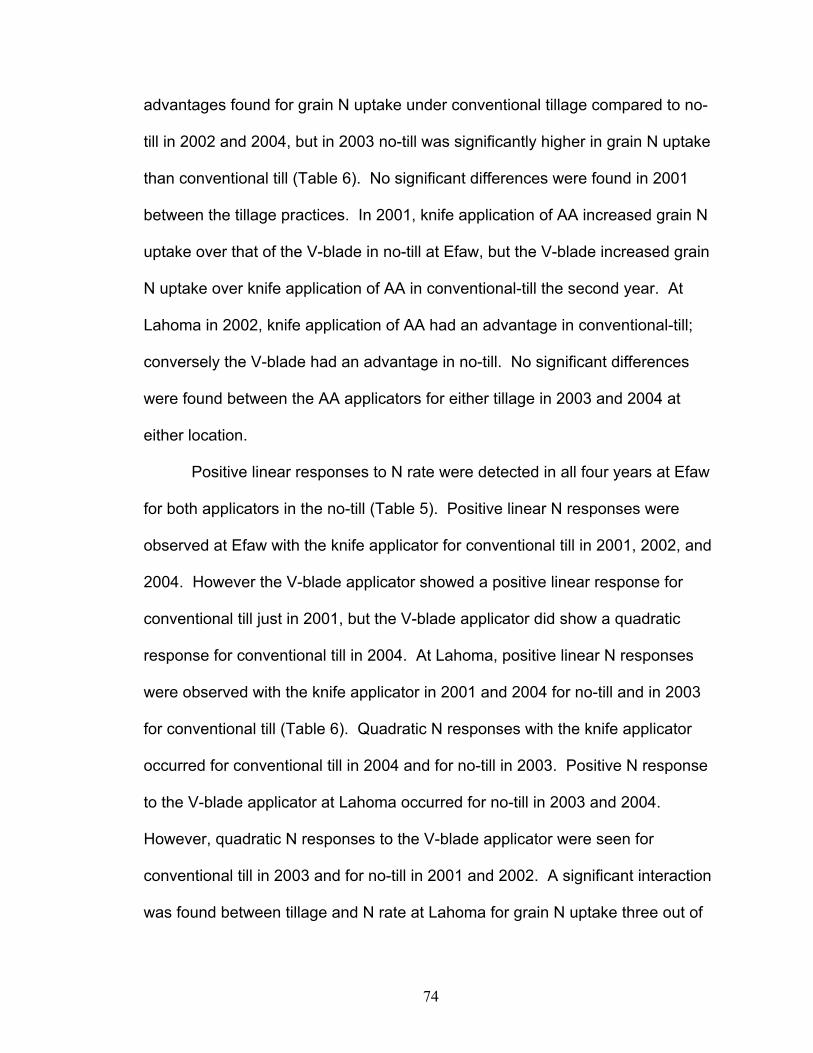
greater in RNDVI for all three hybrids at the first three sensor readings: V6, V7,
and V8 (Figure 2). However, no differences were found at V10 between the 104-
day and 107-day hybrids or within the plant populations and/or N rates of either
19
hybrid. Also, no treatment differences were seen either between any of the
hybrids or within the plant populations and/or N rates of any hybrid at the 16-leaf
(V16) growth stage. Although significant treatment effects were visually present
between V10 and V16 growth stages in all three hybrids, the effects could not be
measured effectively at those stages due to complete absorbance in the red
band that occurred (Figure 2). The 111-day hybrid had higher RNDVI values
than both the 104-day and 107-day hybrids during the silking (R1) and dough
(R4) reproductive growth stages and higher RNDVI values than the 107-day
hybrid at the blister (R2) reproductive growth stage. The 104-day hybrid had
significantly greater RNDVI values than did the 107-day hybrid at R2. The high
plant population actually decreased RNDVI values in the 104-day hybrid at the
R1, milk (R3), and R4 reproductive growth stages as well as the R4 sensing of
the 107-day hybrid. However, the higher plant population increased RNDVI in
the 111-day hybrid at the R1 and R2 growth stages. While the 111-day hybrid
may have obtained significantly higher RNDVI values than either of the other two
hybrids during the reproductive growth stages, it is conceivable that this event
took place because of the maturity differences between the hybrids (as the hybrid
matures RNDVI decreased due to hastened lower leaf senescence (Figure 2),
since the 104-day and 107-day hybrids produced significantly higher grain yields
(Table 5).
At the LCB site seven sensor readings were taken, starting at the V6
growth stage and ending at the R2 growth stage (Table 3). The 107-day hybrid
was significantly lower in RNDVI than the 111-day hybrid throughout all sensor
20
(V6-R2) readings, but no statistical differences were observed between the 104-
day and 107-day hybrids except at R2 when the 104-day hybrid showed higher
RNDVI values (data not shown). The high plant population increased the RNDVI
values of all three hybrids at all sensor (V6-R2) readings (data not shown). The
red complete absorbance effect was not observed at LCB and consequently the
decease in RNDVI did not occur at tassel development, but this was essentially
due to the lower plant populations used. Plant stands were measured mid-
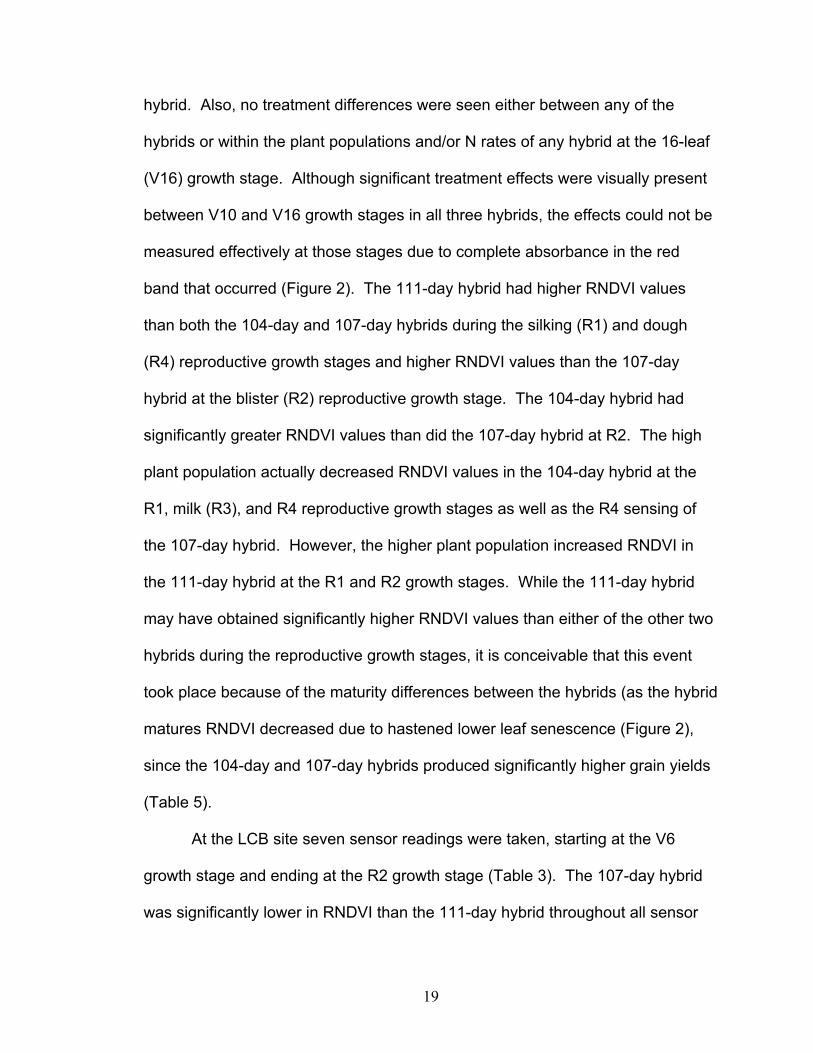
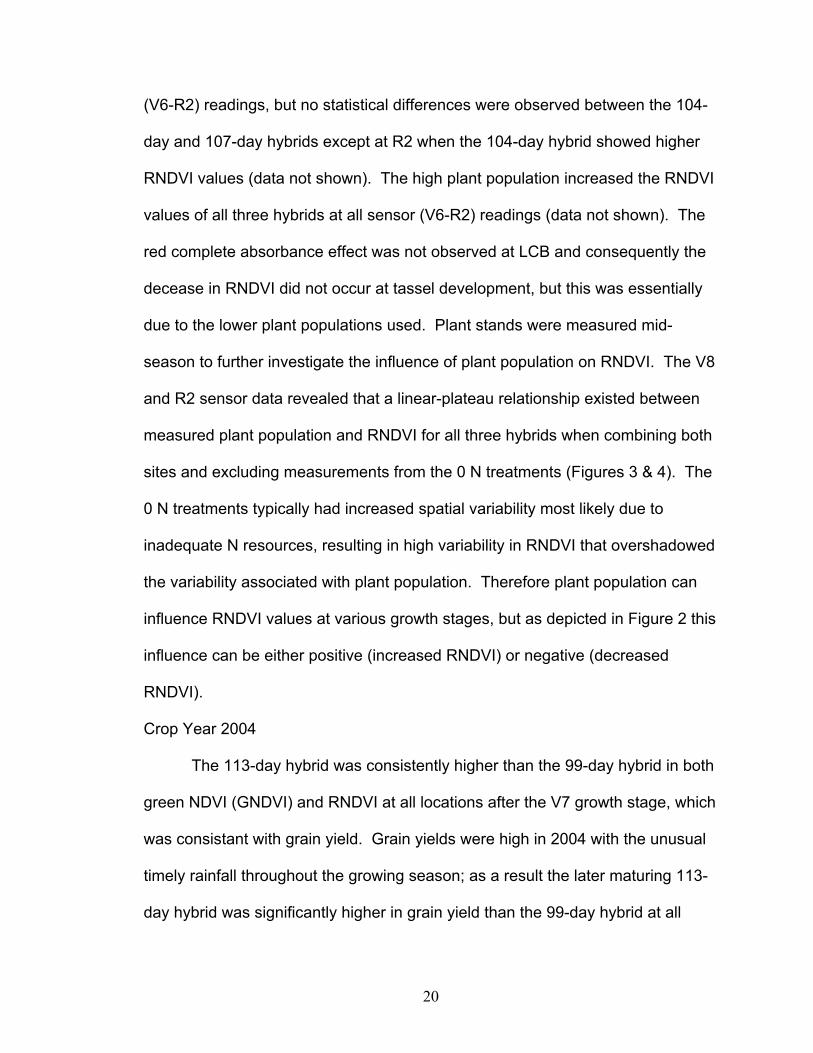
season to further investigate the influence of plant population on RNDVI. The V8
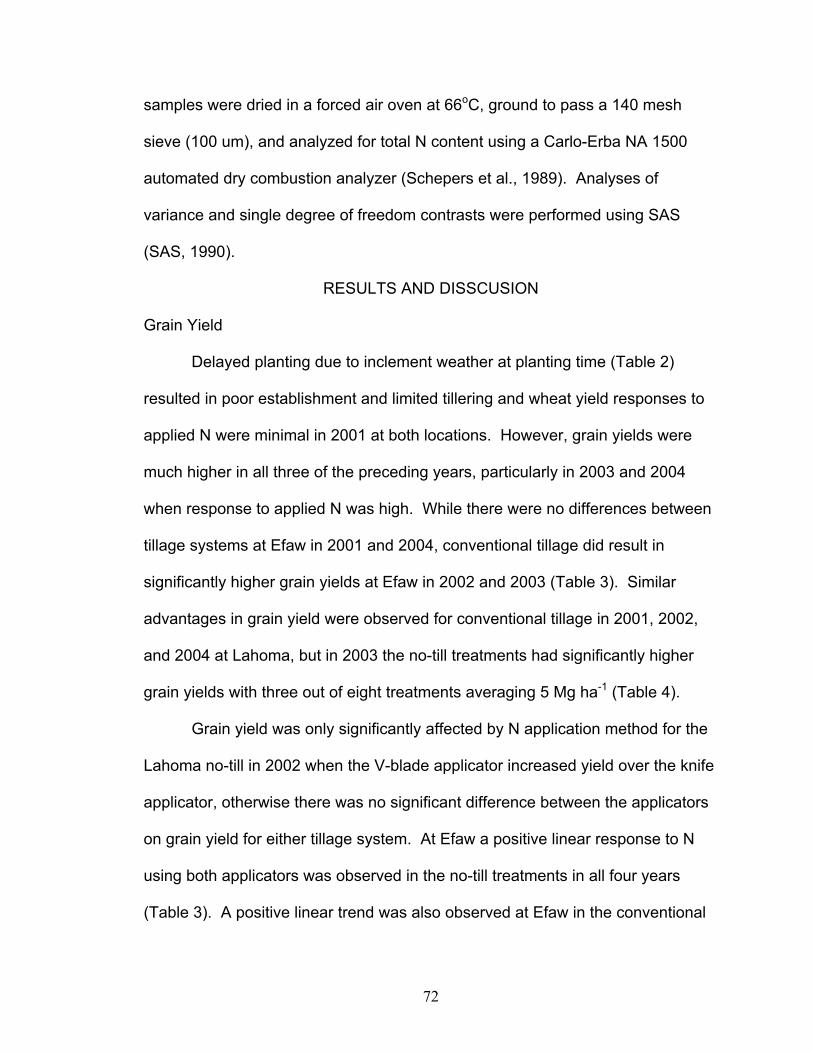
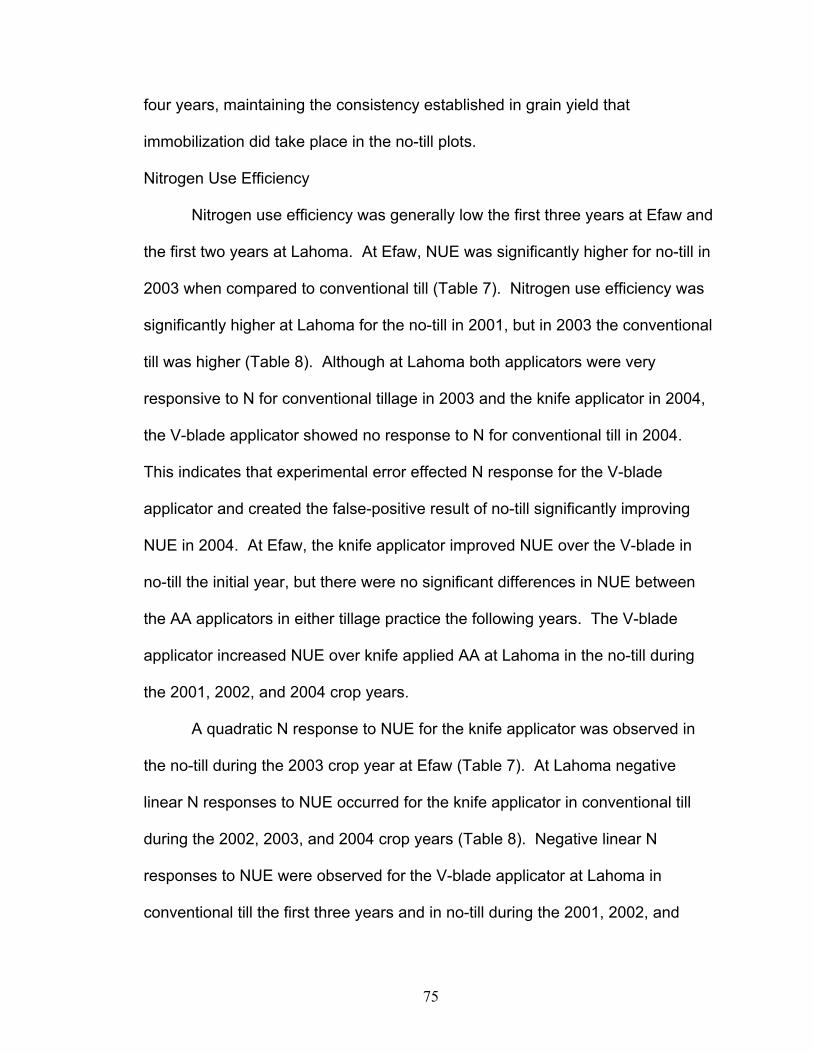
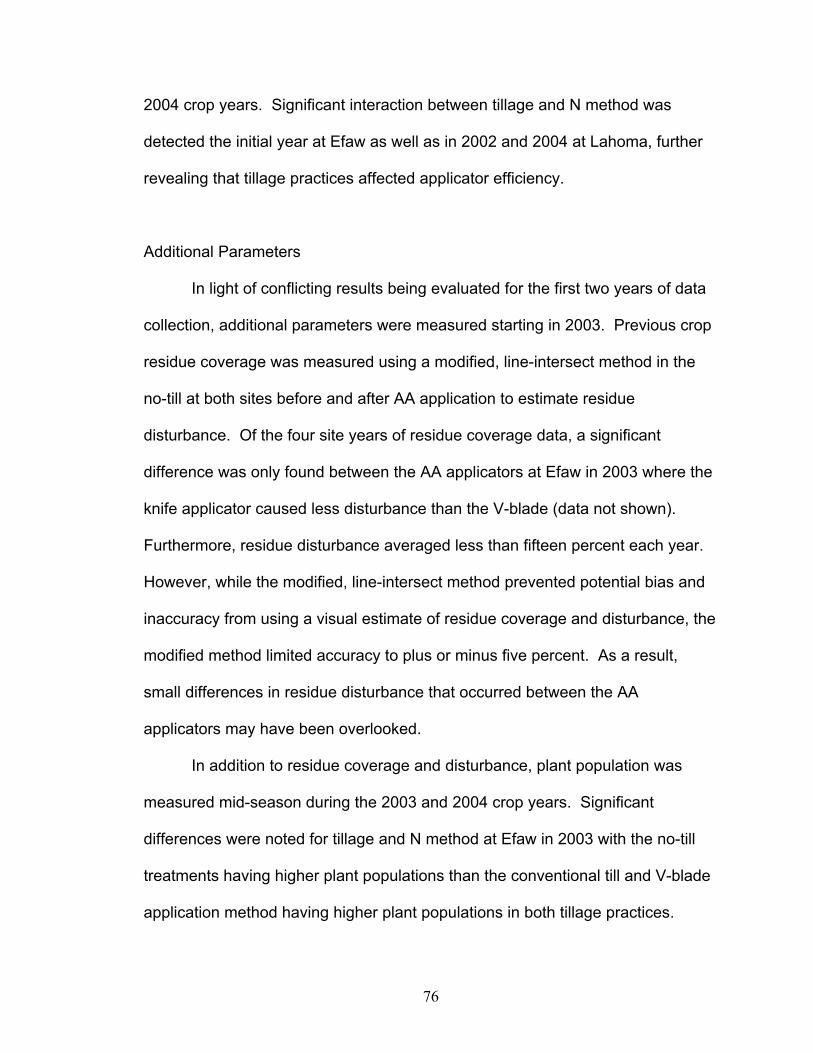
and R2 sensor data revealed that a linear-plateau relationship existed between
measured plant population and RNDVI for all three hybrids when combining both
sites and excluding measurements from the 0 N treatments (Figures 3 & 4). The
0 N treatments typically had increased spatial variability most likely due to
inadequate N resources, resulting in high variability in RNDVI that overshadowed
the variability associated with plant population. Therefore plant population can
influence RNDVI values at various growth stages, but as depicted in Figure 2 this
influence can be either positive (increased RNDVI) or negative (decreased
RNDVI).
Crop Year 2004
The 113-day hybrid was consistently higher than the 99-day hybrid in both
green NDVI (GNDVI) and RNDVI at all locations after the V7 growth stage, which
was consistant with grain yield. Grain yields were high in 2004 with the unusual
timely rainfall throughout the growing season; as a result the later maturing 113-
day hybrid was significantly higher in grain yield than the 99-day hybrid at all
21
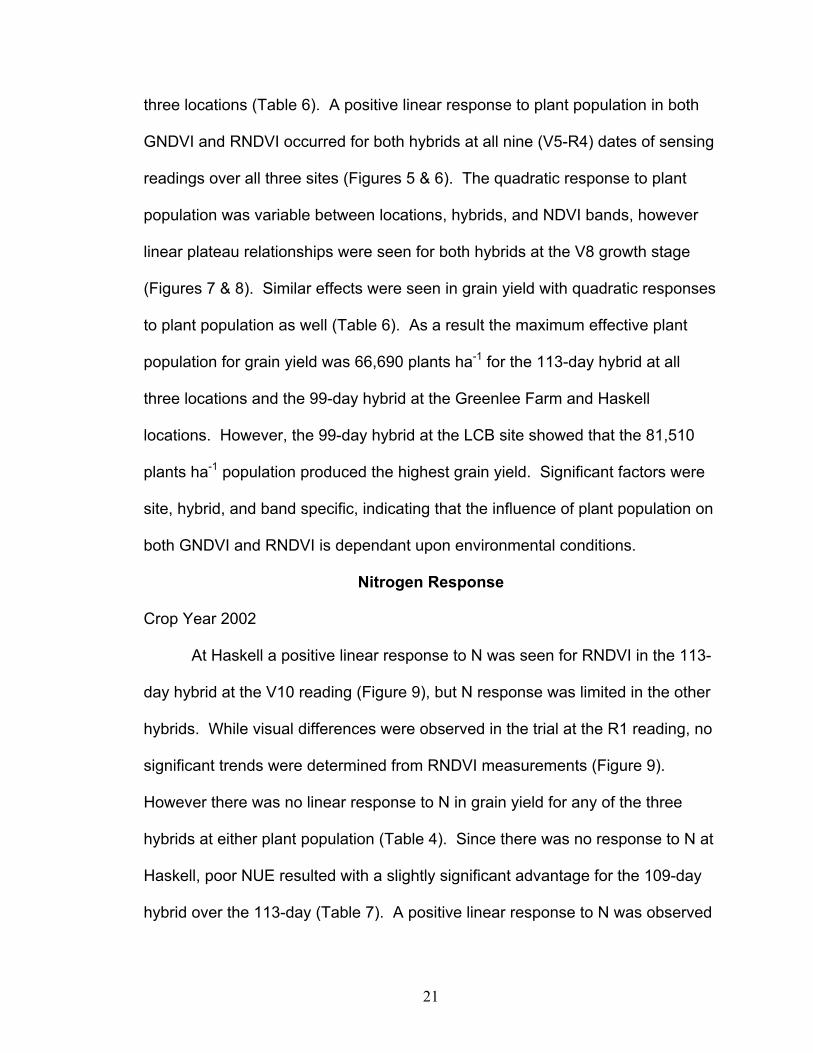
three locations (Table 6). A positive linear response to plant population in both
GNDVI and RNDVI occurred for both hybrids at all nine (V5-R4) dates of sensing
readings over all three sites (Figures 5 & 6). The quadratic response to plant
population was variable between locations, hybrids, and NDVI bands, however
linear plateau relationships were seen for both hybrids at the V8 growth stage
(Figures 7 & 8). Similar effects were seen in grain yield with quadratic responses
to plant population as well (Table 6). As a result the maximum effective plant
population for grain yield was 66,690 plants ha-1 for the 113-day hybrid at all
three locations and the 99-day hybrid at the Greenlee Farm and Haskell
locations. However, the 99-day hybrid at the LCB site showed that the 81,510
plants ha-1 population produced the highest grain yield. Significant factors were
site, hybrid, and band specific, indicating that the influence of plant population on
both GNDVI and RNDVI is dependant upon environmental conditions.
Nitrogen Response
Crop Year 2002
At Haskell a positive linear response to N was seen for RNDVI in the 113-
day hybrid at the V10 reading (Figure 9), but N response was limited in the other
hybrids. While visual differences were observed in the trial at the R1 reading, no
significant trends were determined from RNDVI measurements (Figure 9).
However there was no linear response to N in grain yield for any of the three
hybrids at either plant population (Table 4). Since there was no response to N at
Haskell, poor NUE resulted with a slightly significant advantage for the 109-day
hybrid over the 113-day (Table 7). A positive linear response to N was observed
22
at LCB for the high plant population of the 109-day and 113-day hybrids at the
first (V7) sensing (as shown by the 113-day hybrid in Figure 9). At the second
(R1) LCB reading, a positive linear response was observed for the high plant
populations of all three hybrids and for the low population of the 105-day hybrid
(as shown by the 113-day hybrid in Figure 9). In grain yield a positive linear
response to N was observed at LCB for the 105-day and the 113-day hybrids at
the low plant population and for all three hybrids at the high population (Table 4).
There were no significant differences found in NUE between the hybrids at LCB
(Table 7).
In-season RI (RIRNDVI) was determined (highest mean RNDVI N treatment/
mean RNDVI check treatment) at both sensor readings and compared to final
grain yield response (RIHarvest). In-season RI data from the first sensor reading
indicated that growth stage was important in estimating RIHarvest (Figure 10). The
Haskell data shows that RIHarvest was predicted well by the RIRNDVI taken at V10
with little to no change in RIRNDVI taken at R1, but the data also shows that a
small N response was seen at Haskell as mentioned previously. The LCB
RIRNDVI taken at V7 underestimated RIHarvest for all three hybrids (Figure 10).
However, LCB RIRNDVI taken at R1 did not predict RIHarvest effectively (data not
shown).
Crop Year 2003
A positive linear RNDVI response to N occurred at Haskell in both plant
populations of all three hybrids at the V6, V7, and V8 sensor readings (as
indicated in Figure 11) and for both plant populations of the 111-day hybrid at the
23
10-leaf (V10) sensing. As mentioned beforehand canopy closure occurred
between V10 and V16 at Haskell resulting in complete red absorbance and the
inability to distinguish visually observable N deficiencies (Figure 11).
Furthermore negative linear NDVI responses to N were evaluated in the
reproductive growth stages, particularly after the R1 growth stage, for both plant
populations of all three hybrids at Haskell. Generally, if complete red absorbance
is observed an inverse occurs in the treatment effect on NDVI values due to
tassel development. At tassel development NDVI values decline as stated earlier
(Figure 11), however the NDVI values of the lower fertility treatments decline less
since tassel development is seemingly associated with plant health. At LCB a
positive linear NDVI response to N occurred in the low plant population of the
107-day hybrid for all sensor (V6-R2) readings, but no N response was observed
in the 104-day and 111-day hybrids or in the high plant population of the 107-day
hybrid (data not shown). Nitrogen response in grain yield was merely observed
for the 104-day hybrid in both plant populations at Haskell and no N response
was seen at LCB resulting in poor NUE (Table 8). At Haskell there was a
significant advantage for the 104-day hybrid over both the 107-day and 111-day
in NUE, while at LCB the 107-day hybrid was significantly higher in NUE over
both the 104-day and the 111-day hybrids (Table 8). At the LCB site, the higher
plant populations required more N than the residual N could provide. However,
the greater plant biomass produced needed more soil moisture than available
during grain fill to maintain grain yield, therefore the lower plant population
produced greater grain yields since there was less competition for moisture.
24
In-season RI was determined at all sensing dates and compared to final
grain yield response (RIHarvest). The V8 sensor data produced the highest RIRNDVI
values and were therefore compared to the RIHarvest data (Figure 12). The
Haskell data shows that V8 RIRNDVI overestimated RIHarvest, but the LCB V8
RIRNDVI generally predicted RIHarvest well (Figure 12). Similar to the 2002 Haskell
RI data, the LCB V8 RIRNDVI showed a small response to N and therefore a better
relationship with RIHarvest than the 2003 Haskell data. As alluded to above and
concluded in previous research, mid-season N response may not result in higher
grain yield if environmental stress is great during grain fill and an associated
overestimates of RIHarvest.
Crop Year 2004
A highly significant interaction for NDVI between plant population and N
rate occurred in 2004 at all three locations. Positive linear GNDVI responses to
N at the Greenlee Farm were sporadic within the hybrids and growth stages,
particularly at the lower plant populations (37,050 & 51,870 plants ha-1).
Conversely, positive linear RNDVI responses to N at the Greenlee Farm were a
little more rational with mid-season (V8, V9, V12-VT) N responses in all plant
populations but the lowest (37,050 plants ha-1) of the 99-day hybrid and the
lowest and highest (81,510 plants ha-1) populations of the 113-day hybrid.
Similar results were noted in grain yield at the Greenlee Farm with the 99-day
hybrid showing no response to N at the lowest plant population; nevertheless a
quadratic response was noted at the 51,870 population and a positive linear
response at the 66,690 and 81,510 populations (Table 6). On the contrary, the
25
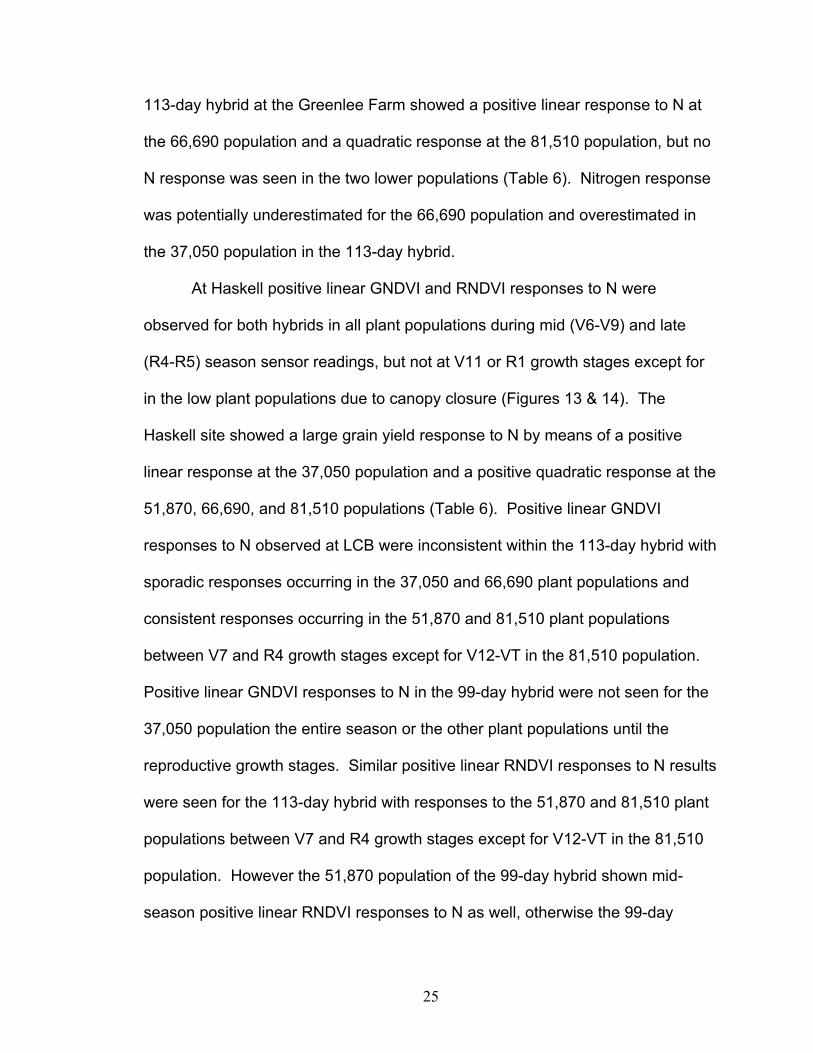
113-day hybrid at the Greenlee Farm showed a positive linear response to N at
the 66,690 population and a quadratic response at the 81,510 population, but no
N response was seen in the two lower populations (Table 6). Nitrogen response
was potentially underestimated for the 66,690 population and overestimated in
the 37,050 population in the 113-day hybrid.
At Haskell positive linear GNDVI and RNDVI responses to N were
observed for both hybrids in all plant populations during mid (V6-V9) and late
(R4-R5) season sensor readings, but not at V11 or R1 growth stages except for
in the low plant populations due to canopy closure (Figures 13 & 14). The
Haskell site showed a large grain yield response to N by means of a positive
linear response at the 37,050 population and a positive quadratic response at the
51,870, 66,690, and 81,510 populations (Table 6). Positive linear GNDVI
responses to N observed at LCB were inconsistent within the 113-day hybrid with
sporadic responses occurring in the 37,050 and 66,690 plant populations and
consistent responses occurring in the 51,870 and 81,510 plant populations
between V7 and R4 growth stages except for V12-VT in the 81,510 population.
Positive linear GNDVI responses to N in the 99-day hybrid were not seen for the
37,050 population the entire season or the other plant populations until the
reproductive growth stages. Similar positive linear RNDVI responses to N results
were seen for the 113-day hybrid with responses to the 51,870 and 81,510 plant
populations between V7 and R4 growth stages except for V12-VT in the 81,510
population. However the 51,870 population of the 99-day hybrid shown mid-
season positive linear RNDVI responses to N as well, otherwise the 99-day
26
hybrid along with the 37,050 and 66,690 plant populations of the 113-day hybrid
N responses were not evaluated until the reproductive stages. At the LCB site,
an N response in grain yield was noticed only for the highest plant population
(81,510 plants ha-1) with a positive linear response in the 113-day hybrid and a
positive quadratic response in the 99-day hybrid (Table 6).
At the Haskell site NUE was significantly higher for the 113-day hybrid
over the 99-day, but at the Greenlee Farm and LCB there was no difference
between the hybrids (Table 9). At all sites the highest plant populations required
the most additional N in 2004 (a positive linear response in plant population to
NUE) since more competition from plant biomass production requires more N
wither or not this increased plant biomass portrays greater grain yield per unit
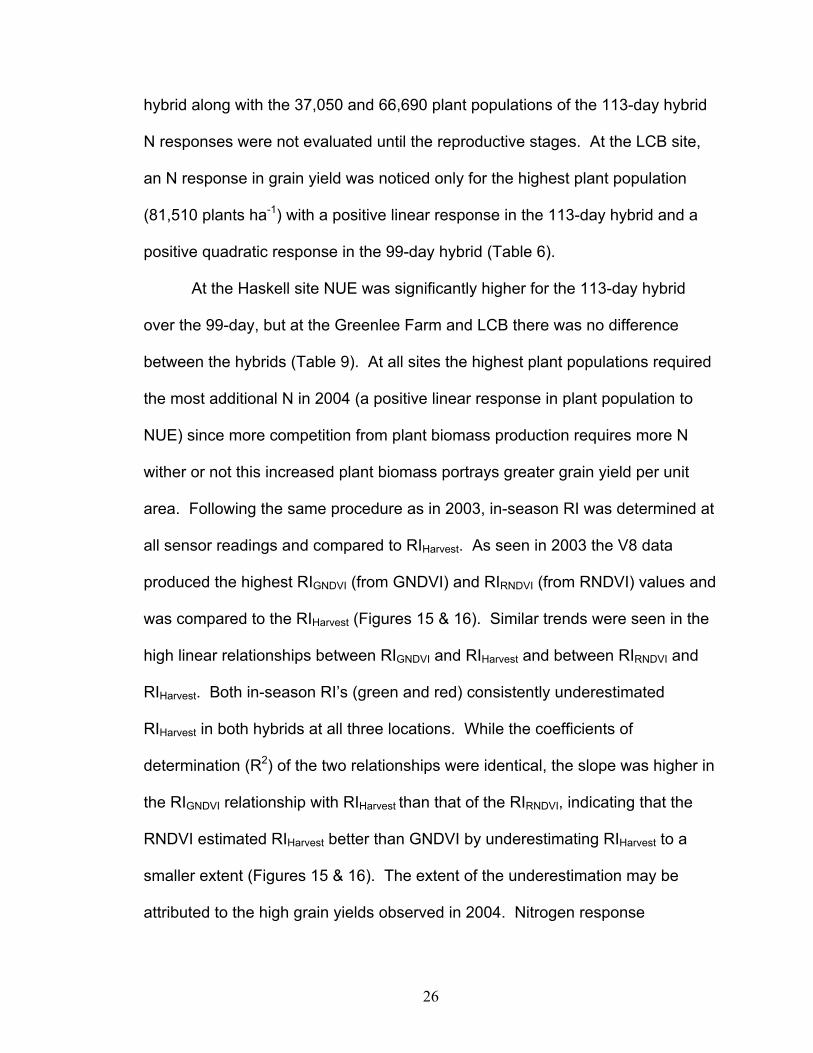
area. Following the same procedure as in 2003, in-season RI was determined at
all sensor readings and compared to RIHarvest. As seen in 2003 the V8 data
produced the highest RIGNDVI (from GNDVI) and RIRNDVI (from RNDVI) values and
was compared to the RIHarvest (Figures 15 & 16). Similar trends were seen in the
high linear relationships between RIGNDVI and RIHarvest and between RIRNDVI and
RIHarvest. Both in-season RI’s (green and red) consistently underestimated
RIHarvest in both hybrids at all three locations. While the coefficients of
determination (R2) of the two relationships were identical, the slope was higher in
the RIGNDVI relationship with RIHarvest than that of the RIRNDVI, indicating that the
RNDVI estimated RIHarvest better than GNDVI by underestimating RIHarvest to a
smaller extent (Figures 15 & 16). The extent of the underestimation may be
attributed to the high grain yields observed in 2004. Nitrogen response
27
increased beyond the V8 growth stage and was maintained throughout grain fill
as a result of moderate air temperatures and timely rainfall and since detection of
treatment differences declines with canopy closure the increased N response
was not recognized by later sensor readings.
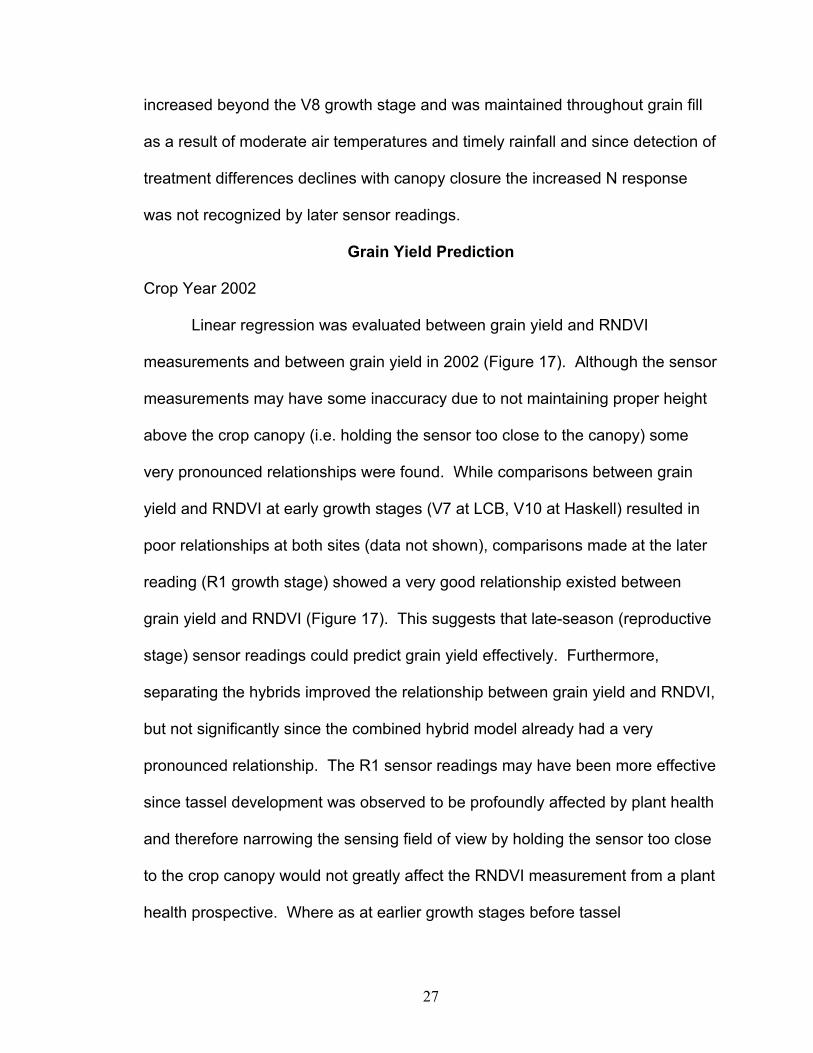
Grain Yield Prediction Crop Year 2002
Linear regression was evaluated between grain yield and RNDVI
measurements and between grain yield in 2002 (Figure 17). Although the sensor
measurements may have some inaccuracy due to not maintaining proper height
above the crop canopy (i.e. holding the sensor too close to the canopy) some
very pronounced relationships were found. While comparisons between grain
yield and RNDVI at early growth stages (V7 at LCB, V10 at Haskell) resulted in
poor relationships at both sites (data not shown), comparisons made at the later
reading (R1 growth stage) showed a very good relationship existed between
grain yield and RNDVI (Figure 17). This suggests that late-season (reproductive
stage) sensor readings could predict grain yield effectively. Furthermore,
separating the hybrids improved the relationship between grain yield and RNDVI,
but not significantly since the combined hybrid model already had a very
pronounced relationship. The R1 sensor readings may have been more effective
since tassel development was observed to be profoundly affected by plant health
and therefore narrowing the sensing field of view by holding the sensor too close
to the crop canopy would not greatly affect the RNDVI measurement from a plant
health prospective. Where as at earlier growth stages before tassel
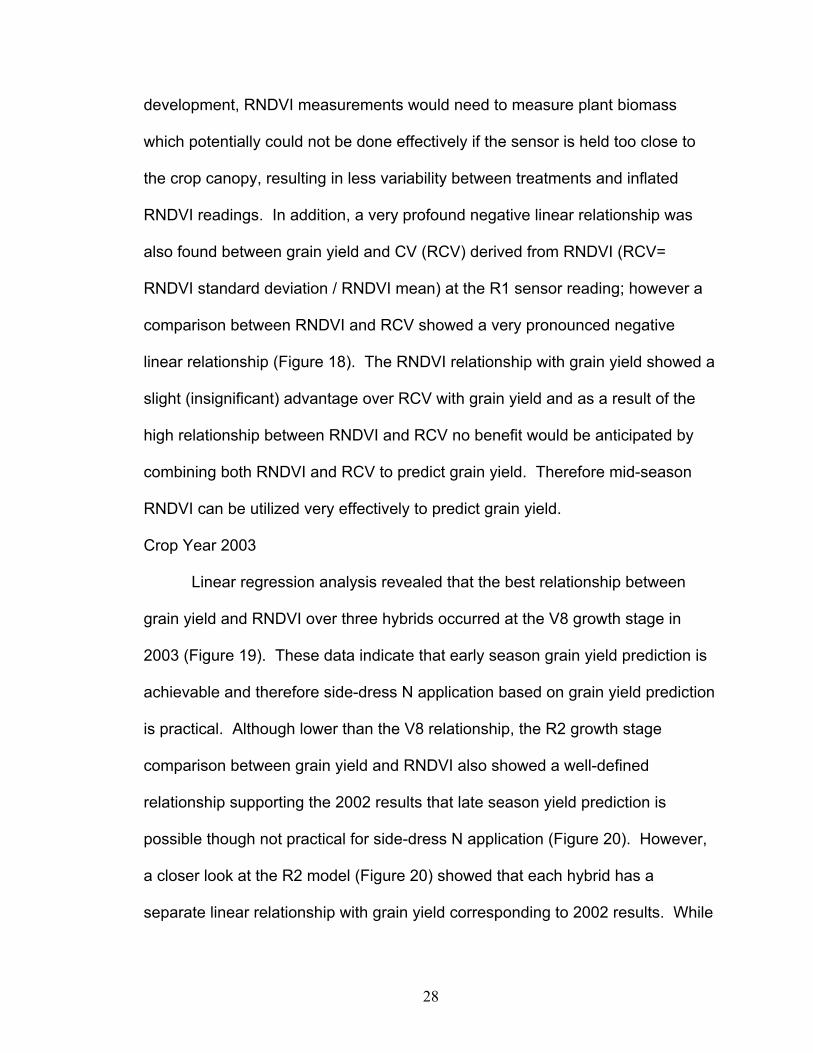
28
development, RNDVI measurements would need to measure plant biomass
which potentially could not be done effectively if the sensor is held too close to
the crop canopy, resulting in less variability between treatments and inflated
RNDVI readings. In addition, a very profound negative linear relationship was
also found between grain yield and CV (RCV) derived from RNDVI (RCV=
RNDVI standard deviation / RNDVI mean) at the R1 sensor reading; however a
comparison between RNDVI and RCV showed a very pronounced negative
linear relationship (Figure 18). The RNDVI relationship with grain yield showed a
slight (insignificant) advantage over RCV with grain yield and as a result of the
high relationship between RNDVI and RCV no benefit would be anticipated by
combining both RNDVI and RCV to predict grain yield. Therefore mid-season
RNDVI can be utilized very effectively to predict grain yield.
Crop Year 2003
Linear regression analysis revealed that the best relationship between
grain yield and RNDVI over three hybrids occurred at the V8 growth stage in
2003 (Figure 19). These data indicate that early season grain yield prediction is
achievable and therefore side-dress N application based on grain yield prediction
is practical. Although lower than the V8 relationship, the R2 growth stage
comparison between grain yield and RNDVI also showed a well-defined
relationship supporting the 2002 results that late season yield prediction is
possible though not practical for side-dress N application (Figure 20). However,
a closer look at the R2 model (Figure 20) showed that each hybrid has a
separate linear relationship with grain yield corresponding to 2002 results. While
29
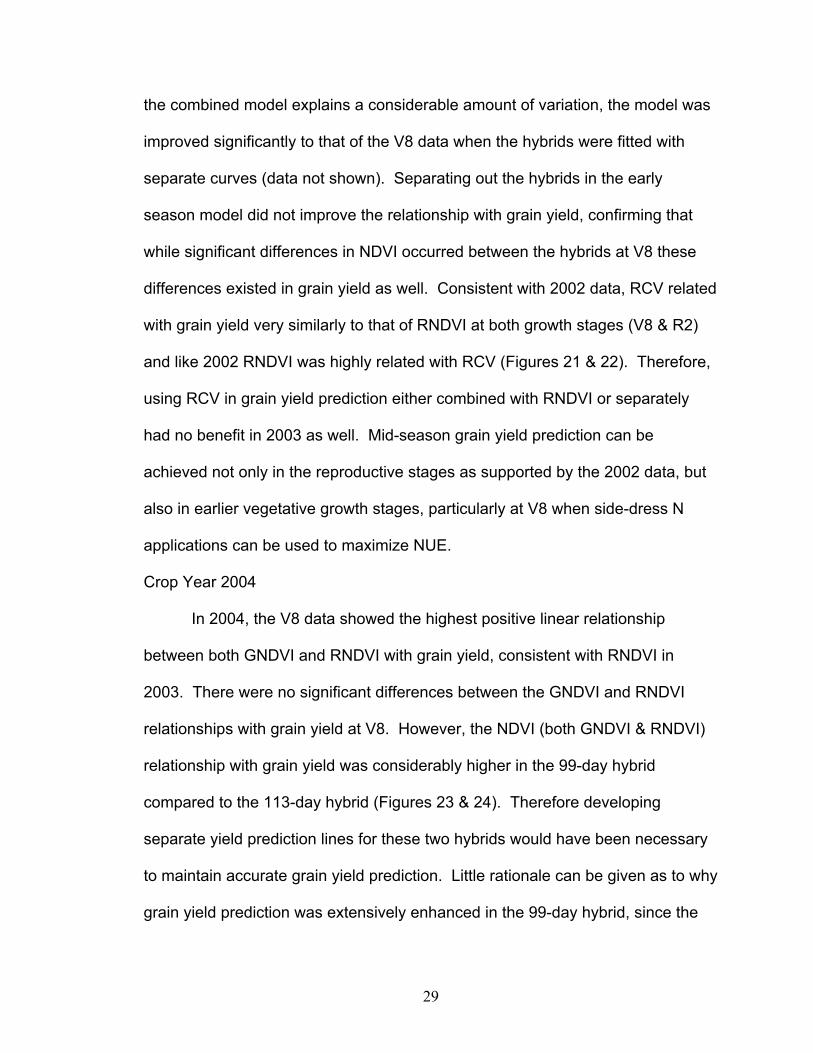
the combined model explains a considerable amount of variation, the model was
improved significantly to that of the V8 data when the hybrids were fitted with
separate curves (data not shown). Separating out the hybrids in the early
season model did not improve the relationship with grain yield, confirming that
while significant differences in NDVI occurred between the hybrids at V8 these
differences existed in grain yield as well. Consistent with 2002 data, RCV related
with grain yield very similarly to that of RNDVI at both growth stages (V8 & R2)
and like 2002 RNDVI was highly related with RCV (Figures 21 & 22). Therefore,
using RCV in grain yield prediction either combined with RNDVI or separately
had no benefit in 2003 as well. Mid-season grain yield prediction can be
achieved not only in the reproductive stages as supported by the 2002 data, but
also in earlier vegetative growth stages, particularly at V8 when side-dress N
applications can be used to maximize NUE.
Crop Year 2004
In 2004, the V8 data showed the highest positive linear relationship
between both GNDVI and RNDVI with grain yield, consistent with RNDVI in
2003. There were no significant differences between the GNDVI and RNDVI
relationships with grain yield at V8. However, the NDVI (both GNDVI & RNDVI)
relationship with grain yield was considerably higher in the 99-day hybrid
compared to the 113-day hybrid (Figures 23 & 24). Therefore developing
separate yield prediction lines for these two hybrids would have been necessary
to maintain accurate grain yield prediction. Little rationale can be given as to why
grain yield prediction was extensively enhanced in the 99-day hybrid, since the
30
difference in visible plant height among other hybrid characteristics was minimum
at V8 due to the fact that the growth patterns of the shorter season (early
maturing) hybrids did not typically separate from the longer season hybrids in this
study (over 3 years) until the reproductive stages. The most plausible
explanation could be that the 99-day hybrid was not as well suited for the dry-
land environment as anticipated and was under substantial stress throughout the
growing season that limited yield potential early and resulted in dramatically
reduced plant response to the post-sensing (late-season) environment contrary
to the 113-day hybrid.
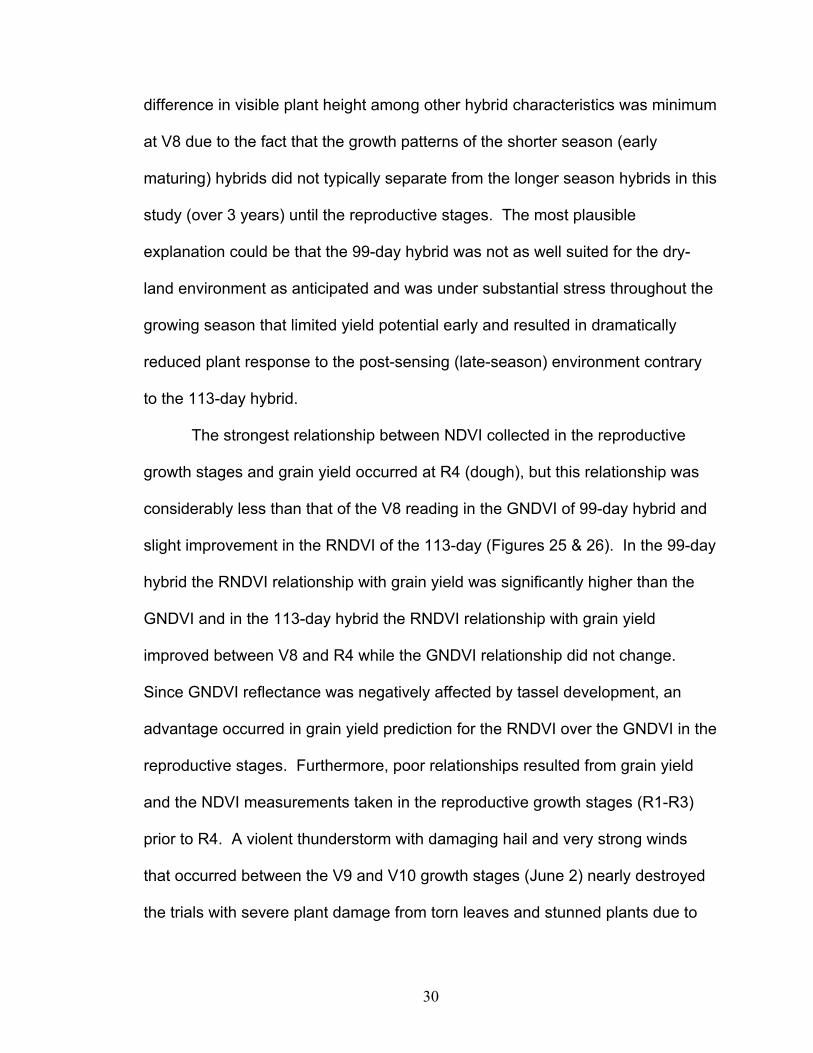
The strongest relationship between NDVI collected in the reproductive
growth stages and grain yield occurred at R4 (dough), but this relationship was
considerably less than that of the V8 reading in the GNDVI of 99-day hybrid and
slight improvement in the RNDVI of the 113-day (Figures 25 & 26). In the 99-day
hybrid the RNDVI relationship with grain yield was significantly higher than the
GNDVI and in the 113-day hybrid the RNDVI relationship with grain yield
improved between V8 and R4 while the GNDVI relationship did not change.
Since GNDVI reflectance was negatively affected by tassel development, an
advantage occurred in grain yield prediction for the RNDVI over the GNDVI in the
reproductive stages. Furthermore, poor relationships resulted from grain yield
and the NDVI measurements taken in the reproductive growth stages (R1-R3)
prior to R4. A violent thunderstorm with damaging hail and very strong winds
that occurred between the V9 and V10 growth stages (June 2) nearly destroyed
the trials with severe plant damage from torn leaves and stunned plants due to
31
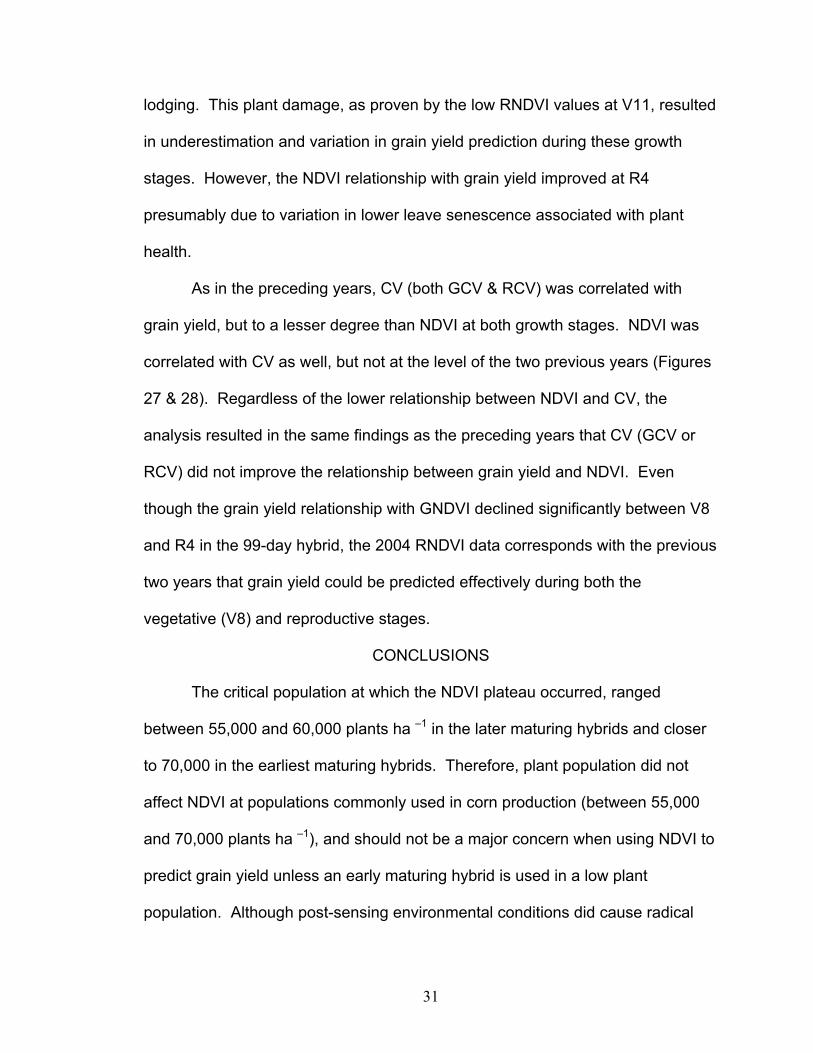
lodging. This plant damage, as proven by the low RNDVI values at V11, resulted
in underestimation and variation in grain yield prediction during these growth
stages. However, the NDVI relationship with grain yield improved at R4
presumably due to variation in lower leave senescence associated with plant
health.
As in the preceding years, CV (both GCV & RCV) was correlated with
grain yield, but to a lesser degree than NDVI at both growth stages. NDVI was
correlated with CV as well, but not at the level of the two previous years (Figures
27 & 28). Regardless of the lower relationship between NDVI and CV, the
analysis resulted in the same findings as the preceding years that CV (GCV or
RCV) did not improve the relationship between grain yield and NDVI. Even
though the grain yield relationship with GNDVI declined significantly between V8
and R4 in the 99-day hybrid, the 2004 RNDVI data corresponds with the previous
two years that grain yield could be predicted effectively during both the
vegetative (V8) and reproductive stages.
CONCLUSIONS
The critical population at which the NDVI plateau occurred, ranged
between 55,000 and 60,000 plants ha –1 in the later maturing hybrids and closer
to 70,000 in the earliest maturing hybrids. Therefore, plant population did not
affect NDVI at populations commonly used in corn production (between 55,000
and 70,000 plants ha –1), and should not be a major concern when using NDVI to
predict grain yield unless an early maturing hybrid is used in a low plant
population. Although post-sensing environmental conditions did cause radical
32
changes in N response between vegetative measurements (RINDVI) and final yield
(RIHARVEST) at some site years, determining N response (RI) mid-season has
been proven possible at the V8 growth stage.
NDVI data from the V8 growth stage predicted grain yield most accurately
in both 2003 and 2004, presumably because the highest variability in NDVI
occurred at the V8 growth stage both years. Later vegetative growth stages may
actually contain more plant variability than V8 and could have stronger
relationships with grain yield, but canopy closure occurs shortly after V8 (V10 to
V12) and vegetative stage NDVI data collected thereafter miscues plant
variability. Well-defined relationships between NDVI and grain yield also
occurred in the reproductive growth stages, but at different growth stages each
year: R1 in 2001, R2 in 2003, and R4 in 2004. Although late-season yield
prediction is not useful for N management and limited due to temporal variability,
the potential is there for other uses.
Separating the hybrids vastly improved these reproductive relationships
with grain yield all three years, but only improved the V8 relationship with grain
yield in 2004. Hybrid maturity did not effect grain yield prediction at V8, but
reproductive growth stage yield prediction will require hybrid maturity
categorization. Finally, comparisons made between the GNDVI and RNDVI
relationships with grain yield in 2004 showed no significant differences over three
locations. Separate yield prediction models for GNDVI and RNDVI will be
required, since GNDVI values are about 10% lower than RNDVI and would
underestimate yield potential using the same model.
33
REFERENCES Aase, J.K., and J.L. Pikul. 1995. Crop and soil response to long-term tillage
practices in the northern Great Plains. Agron. J. 87:652-656. Baker, J.L. and D.R. Timmons. 1994. Fertilizer management effects on leaching
of labeled nitrogen for no-till corn in field lysimeters. J. Environ. Qual. 23:305-310.
Bartholome, E. 1988. Radiometric measurements and crop yield forecasting;
Some observations over millet and sorghum experimental plots in Mali. Int. J. Remote Sens. 9:1539-1552.
Bausch, W.C. and H.R. Duke. 1996. Remote sensing of plant nitrogen status in
corn. Trans. ASAE 39(5):1869-1875. Blevins, D.W., D.H. Wilkison, B.P. Kelly, and S.R. Silva. 1996. Movement of
nitrate fertilizer to glacial till and runoff from a claypan soil. J. Environ. Qual. 25:584-593.
Black, A.L. and A. Bauer. 1988. Setting winter wheat yield goals. P. 24-34. In
J.L. Havlin (ed) Proc. Workshop Central Great Plains Profitable Wheat Management, Wichita, KS. 17-20 Aug. 1988. Potash and Posphate Inst., Altanta, GA.
Blackmer, T.M. and J.S. Schepers. 1995. Use of a chlorophyll meter to monitor
nitrogen status and schedule fertigation for corn. J. Prod. Agric. 8(1):56-60.
Blumenthal, J.M. and M.P. Russelle. 1996. Subsoil nitrate uptake and symbiotic
dinitrogen fixation by alfalfa. Agron. J. 88:909-915. Bosch, H.M., A.B. Rosefield, R. Huston, H.R. Shipman and F.L. Woodward.
1950. Methemoglobinemia and Minnesota well supplies. J. Am. Water Works Assoc. 42: 161-170.
Bundy, L.G. and T.W. Andraski. 1995. Soil yield potential effects on
performance of soil nitrate tests. J. Prod. Agric. 8:561-568. Chichester, F.W. and C.W. Richardson. 1992. Sediment and nutrient loss from
clay soils as affected by tillage. J. Environ. Qual. 21:587-590. Dahnke, W.C., L.J. Swenson, R.J. Goos, and A.G. Leholm. 1988. Choosing a
crop yield goal. SF-822. North Dakota State Ext. Serv., Fargo.
34
Daliparthy, J., S.J. Herbert, and P.L.M. Veneman. 1994. Dairy manure applications to Alfalfa: crop response, soil nitrate, and nitrate in soil water. Agron. J. 86:927-933. Dao, T.H. 1993. Tillage and winter wheat residue management effects on water
infiltration and storage. Soil Sci. Am. J. 57:1586-1595. Diaz, R.J. 2001. Overview of Hypoxia around the World. J. Environ. Qual.
30:275-281. Diez, J.A., R. Roman, M.C. Cartagena, A. Vallejo, A. Bustos, and R. Caballero.
1994. Controlling nitrate pollution of aquifers by using different nitrogenous controlled release fertilizers in maize crop. Agric. Ecosys. and Environ. 48:49-56.
Doran, J.W. 1980. Soil microbial and biochemical changes associated with
reduced tillage. Soil Sci. Soc. Am. J. 44:765-771. Dowdell, R.J., and R.Q. Cannell. 1975. Effect of ploughing and direct drilling on
soil nitrate content. J. Soil. Sci. 26:53-61. Drury, C.F., C.S. Tan, J.D. Gaynor, T.O. Oloya, and T.W. Welacky. 1996.
Influence of controlled drainage-subirrigation on surface and tile drainage nitrate loss. J. Environ. Qual. 25:317-324.
Magdoff. 1995. Implications of nitrogen management strategies for nitrate leaching potential: Roles of nitrogen source and fertilizer recommendations system. Agron. J. 87:884-887.
Eck, H. V., and O.R. Jones. 1992. Soil nitrogen status as affected by tillage,
crops, and crop sequences. Agron. J. 84:660-668. Eckert, D.J. and V.L. Martin. 1994. Yield and nitrogen requirement of no-tillage
corn as influenced by cultural practices. Agron. J. 86:1119-1123. Edwards, W.M., M.J. Shipitalo, L.B. Owens, and L.D. Norton. 1990. Effect of
Lumbricus terrestris L. burrows on hydrology of continuous no-till corn fields. Geoderma 46:73-84.
Eghball, B. and J.W. Maranville. 1991. Interactive effects of water and nitrogen
stresses on nitrogen utilization efficiency, leaf water status and yield of corn genotypes. Commun. Soil. Sci. Plant Anal., 22(13&14):1367-1382.
35
Elliott, E.T., P.W. Tracy, G.A. Peterson, and C.V. Cole. 1986. Leaching of mineralized N is less under no-till cultivation. P. 53-54. In Trans. Int. Congr. Soil Sci. 13th, Hamburg, Germany. Vol. 6. Congr. Centurum, Hamburg.
Esala, Martti and Aku Leppanen. 1998. Leaching of 15N-labeled fertilizer nitrate
in undisturbed soil columns after simulated heavy rainfall. Commun. Soil Sci. Plant Anal. 29:1221-1238.
Francis, D.D., J.S. Schepers, and M.F. Vigil. 1993. Post-anthesis nitrogen loss
from corn. Agron J. 85:659-663. Fenster, C.R., and G.A. Peterson. 1979. Effects of no-tillage fallow compared to
conventional tillage in a wheat-fallow system. Nebraska Agic. Exp. Bull. 289.
Macneal. 1993. Comparsion of near-infrared spectroscopy and other soil nitrogen availability quick tests for corn. Agron. J. 85:1049-1053.
Gascho, G.J. and R.D. Lee. 2002. Determining side-dress nitrogen
requirements of corn following broiler litter in the Southern Coastal Plain. J. Plant Nutr. 11:2361-2371.
Goolsby, D.A., W.A. Battaglin, B.T. Aulenbach, and R.P. Hooper. 2001.
Nitrogen Input to the Gulf of Mexico. J. Environ. Qual. 30:329-336. GopalaPillai, S. and L. Tian. 1999. In-field variability detection and spatial yield
modeling for corn using digital aerial imaging. Trans. ASAE 42(6):1911-1920.
cycling in a wheat crop: Soil, plant, and aerial nitrogen transport. Agron. J. 79:965-973.
Hilton, B.R., P.E. Fixen, and H.J. Woodward. 1994. Effects of tillage, nitrogen
placement, and wheel compaction on denitrification rates in the corn cyle of a corn-oats rotation. J. Plant Nutr. 17:1341-1357.
Holland, J.F., and W.L. Felton. 1989. Effect of tillage practice on grain sorghum
production in northern New South Wales. Aust. J. Exp. Agric. 29:843-848.
36
Howarth, R.W., G. Billen, D. Swaney, A. Townsend, N. Jaworski, K. Lajtha, J.A. Downing, R. Elmgren, N. Caraco, T. Jordan, F. Berendse, J. Freney, V. Kudeyarov, P. Murdoch, and Z. Zhao-Liang. 1996. Regional nitrogen budgets and reverine N & P fluxes for the drainage to the North Atlantic Ocean: Natural and human influences. Biogeochemistry 35:75-139.
Johnson, G.V. 1991. General model for predicting crop response to fertilizer.
Agron. J. 83:367-373. Johnson, G.V., W.R. Raun, and R.W. Mullen. 2000. Nitrogen use efficiency as
influenced by crop response index. P. 291. In Agronomy abstracts. ASA, CSSA, and SSSA, Madison, WI.
Jones, O.R., and T.W. Popham. 1997. Cropping and tillage systems for dryland
grain production in the southern high plains. Agron. J. 89:222-232. Kanwar, R.S., T.S. Colvin, and D.L. Karlen. 1997. Ridge, moldboard, chisel, and
no-till effects on tile water quality beneath two cropping systems. J. Prod. Agric. 10:227-234.
Kessavalou, A., J.W. Doran, W.L. Powers, T.A. Kettler, and J.H. Qian. 1996.
Bromide and nitrogen-15 tracers of nitrate leaching under irrigated corn in central Nebraska. J. Environ. Qual. 25:1008-1014.
Kirkegaard, J.A., R. Munns, R.A. James, P.A. Gardner, and J.F. Angus. 1995.
Reduced growth and yield of wheat with conservation cropping: II. Soil biological factors limit growth under direct drilling. Aust. J. Agric. Res. 46:75-88.
Lamb, J.A., G.A. Peterson, and C.R. Fenster. 1985. Wheat-fallow tillage systems
‘effect on newly cultivated grassland soils’ nitrogen budget. Soil Sci. Soc. Am. J. 49:352-356.
Lehrsch, G.A., R.E. Sojka, and D.T. Westermann. 2000. Nitrogen placement,
row spacing, and furrow irrigation water positioning effects on corn yield. Agron. J. 92:1266-1275.
Liang, B.C., M. Remillard, and A.F. MacKenzie. 1991. Plant and environment
interactions. J. Environ. Qual. 20:123-128. Liang, B.C. and A.F. MacKenzie. 1994. Corn yield, nitrogen uptake and nitrogen
use efficiency as influenced by nitrogen fertilization. Can. J. Soil Sci. 74:235-240.
Liu, J., C.E. Goering, and L. Tian. 2001. A neural network for setting target corn
yields. Trans. ASAE 44(3):705-713.
37
Lopez-Bellido, L., M. Fuentes, J.E. Castillo, F.J. Lopez-Garrido, and E.J.
Fernandez. 1996. Long-term tillage, crop rotation and nitrogen fertilizer effects on wheat yield under rainfed Mediterranean conditions. Agron. J. 88:783-791.
1997. Subsoil nitrate uptake by grain pearl millet. Agron. J. 89:189-194. Merrill, S.D., A.L. Black, and A. Bauer. 1996. Conservation tillage affects root
growth of dryland spring wheat under drought. Soil Sci. Am. J. 60:575-583.
Mueller, D.K. and D.R. Helsel. 1996. Nutrients in the nation’s waters: Too much
of a good thing? U.S. Geological Survey Circular 1136. National Climatic Data Center. 1994. Asheville, North Carolina.
Solie. 2003. Identifying an in-season response index and the potential to increase wheat yield with nitrogen. Agron. J. 95:347-351.
Nixon, S.W. 1995. Coastal marine eutrophication: A definition, social causes,
and future concerns. Ophelia 41:199-219. Norwood, C.A. 1994. Profile water distribution and grain yield as affected by
cropping system and tillage. Agron. J. 86:558-563. Norwood, C.A., and R.S. Currie. 1996. Tillage, planting date, and plant
population effects on dryland corn. J. Prod. Agric. 9:119-122. Owens, L.B., R.W. Malone, M.J. Shipitalo, W.M. Edwards, and J.V. Bonta. 2000.
Lysimeter study of nitrate leaching from a corn-soybean rotation. J. Environ. Qual. 29:467-474.
38
Pan, W.L., E.J. Kamprath, R.H. Moll, and W.A. Jackson. 1984. Prolificacy in
corn: Its effects on nitrate and ammonium uptake and utilization. Soil Sci. Soc. Am. J. 48:1101-1106.
Pang, X.P., J. Letey, and L. Wu. 1997. Yield and nitrogen uptake prediction by
CERES-Maize model under semiarid conditions. Soil Sci. Soc. Am. J. 61:254-256.
Peterson, T.A., T.M. Blackmer, D.D. Francis, and J.S. Schepers. 1993. Using a
chlorophyll meter to improve N management. NebGuide G93-1171-A. Cooperative Extension, Institute of Agriculture and Natural Resources, Univ. of Nebraska-Lincoln.
Phillips, S.B., W.R. Raun, and G.V. Johnson. 1997. Seasonal and long-term
changes in nitrate-nitrogen content of well water in Oklahoma. J. Environ. Qual. 26:1632-637.
Koskinen, and J.L. Anderson. 1994. Cropping system effects on water, nitrate, and pesticide losses through tile drainage. Minnesota Water ’94 Conf., April 1994.
Rasmussen, M.S. 1998. Developing simple, operational, consistent NDVI-
vegetation models by applying environmental and climatic information. Part II: Crop yield assessment. Int. J. Remote Sensing 19(1):119-139.
Raun, W.R., and G.V. Johnson. 1999. Improving nitrogen use efficiency for
W.E. Thomason, and E.V. Lukina. 2002. Improving nitrogen use efficiency in cereal grain production with optical sensing and variable rate application. Agron. J. 94:815-820.
Rehm, G. and M. Schmitt. 1989. Setting realistic crop yield goals. Minnesota
Ext. Serv. Ag-FS-3873. Univ. of Minnesota. Rice, C.W., and M.S. Smith. 1982. Denitrification in no-till and plowed soils. Soil
Sci. Soc. Am. J. 46:1168-1173. Rodriguez, M.B., and N. Giambiagi. 1995. Denitrification in tillage and no-tillage
Pampean soils: relationships among soil water, available carbon, and nitrate and nitrous oxide production. Commun. Soil. Sci. Plant Anal. 26:3205-3220.
39
SAS Institute. 1990. SAS/STAT user’s guide. Release 6.03 ed. SAS Inst., Cary, NC.
Schepers, J.S., D.D. Francis, and M.T. Thompson. 1989. Simultaneous
determination of total C, total N, and 15N on soil and plant material. Commun. Soil Sci. Plant Anal. 20:949-959.
Schepers, J.S., D.D. Francis, M. Vigil, and F.E. Below. 1992. Comparison of
corn leaf nitrogen concentration and chlorophyll meter readings. Commun. Soil Sci. Plant Anal. 23(17-20):2173-2187.
Schuman, G.E. and L.F. Elliott. 1978. Cropping an abandoned feedlot to
prevent deep percolation of nitrate-nitrogen. Soil Sci. 126:237-243. Shrestha, R.K. and J.K. Ladha. 1998. Nitrate in groundwater and integration of
nitrogen-catch crop in rice-sweet pepper cropping system. Soil Sci. Soc. Am. J. 62:1610-1619.
Schuh, W.M., D.L. Klinkebiel, J.C. Gardner, and R.F. Meyer. 1997. Tracer and
nitrate movement to groundwater in the Northern Great Plains. J. Environ. Qual. 26:1335-1347.
Smika, D.E., and P.W. Unger. 1986. Effect of surface residues on soil water
storage. Adv. Soil. Sci. 5:111-138. Spellman, D.E., A. Rongni, D.G. Westfall, R.M. Waskom, and P.N. Soltanpour.
1996. Pre-sidedress nitrate soil testing to manage nitrogen fertility in irrigated corn in a semi-arid environment. Commun. Soil Sci. Plant Anal. 27:561-574.
Stinner, B.R., G.D. Hoyt, and R.L. Todd. 1983. Changes in soil chemical
properties following a 12-year fallow: A 2-year comparison of conventional tillage and no-tillage agroecosystems. Soil Tillage Res. 3:277-290.
1996. Use of spectral radiance for correcting in-season fertilizer nitrogen deficiencies in winter wheat. Trans. ASAE. 39(5):1623-1631.
U.S. Environmental Protection Agency (EPA). 1999a. National Primary Drinking
Water Regulations Technical Fact Sheets. Washington, D.C.: Office of Water, Office of Ground Water and Drinking Water. http://www.epa.gov/OGWDW/hfacts.html. March
U.S. Environmental Protection Agency. 1999b. Risk of Groundwater Nitrate
Contamination. Watershed Information Network. Available at http://www.epa.gov/iwi/1999april/iii21usmap.html. April
40
Varvel, G.E. 1994. Monoculture and rotation system effects on precipitation use
efficiency in corn. Agron. J. 86:204-208. Varvel, G.E., J.S. Schepers, and D.D. Francis. 1997. Ability for in-season
correction of nitrogen deficiency in corn using chlorophyll meters. Soil Sci. Soc. Am. J. 61:1233-1239.
Waddell, J.T., and R.R. Weil. 1996. Water distribution in soil under ridge-till and
no-till corn. Soil Sci. Soc. Am. J. 60:230-237. Walton, G. 1951. Survey of literature relating to infant methemoglobinemia due to
nitrate-contaminated water. Am. J. Public Health. 41: 986-996. Weil, R.R., R.A. Weismiller, and R.S. Turner. 1990. Nirate contamination of
groundwater under irrigated Coastal Plain soils. J. Environ. Qual. 19:441-448.
Wienhold, B.J., T.P. Trooien, and G.A. Reichman. 1995. Yield and nitrogen use
efficiency of irrigated corn in the Northern Great Plains. Agron. J. 87:842-846.
Wolfe, D.W., D.W. Henderson, T.C. Hsiao, and A. Alvino. 1988. Interactive
water and nitrogen effects on senescence of maize: II. Photosynthetic decline and longevity of individual leaves. Agron. J. 80:865-870.
Yadav, S.N. 1997. Formulation and estimation of nitrate-nitrogen leaching from
corn cultivation. J. Environ. Qual. 26:808-814.
41
Table 1. Initial surface (0-15cm) soil test results prior to experiment initiation at Greenlee Farm, Haskell, and LCB, OK.
NH4-N and NO3-N – 2 M KCL extract; P and K – Mehlich-3 extraction; pH – 1:1 soil:deionized water; NA- not available Table 2. Planting, fertilizer, and harvest dates at Greenlee Farm, Haskell, and LCB, OK, 2002-04.
Location Crop Year Planting Fertilizer
Application Grain Harvest
Haskell 2002 4-18-2002 4-16-2002 9-11-2002
LCB 2002 4-23-2002 4-23-2002 8-28-2002
Haskell 2003 4-03-2003 4-03-2003 8-20-2003
LCB 2003 4-01-2003 4-08-2003 8-07-2003
Greenlee Farm 2004 3-31-2004 3-31-2004 8-17-2004
Haskell 2004 4-01-2004 4-01-2004 8-31-2004
LCB 2004 4-03-2004 4-03-2004 8-28-2004
Table 3. Sensing dates by growth stage at Greenlee Farm, Haskell, and LCB, OK, 2002 to 2004.
Vegetative growth stages (V#) determined by number of collared leaves. Depending on hybrid and environmental conditions plants produce between 11 to 20 collared leaves (V11-V20), in 2004 only 12 collared leaves were observed before tasseling.
Kernels thicken to a paste, 50% kernel dry weight --- --- 7-18-03 --- 7-16-04 7-09-04 7-09-04
R5 (Dent)
Kernels have dented at top, the milk line appears --- --- --- --- --- 7-16-04 7-17-04
42
43
Table 4. Corn grain yield treatment means by location, Haskell and Lake Carl Blackwell, OK, 2002.
SED is the standard error of the difference between two equally replicated means. Haskell population (pop) was: 44,460 seeds ha-1 (low) and 66,690 seeds ha-1 (high). LCB (Lake Carl Blackwell) population was: 35,568 seeds ha-1 (low) and 51,870 seeds ha-1 (high).
Table 5. Corn grain yield treatment means by location, Haskell and Lake Carl Blackwell, OK, 2003.
SED is the standard error of the difference between two equally replicated means. Haskell population (pop) was: 49,400 seeds ha-1 (low) and 71,630 seeds ha-1 (high). LCB (Lake Carl Blackwell) population was: 35,568 seeds ha-1 (low) and 51,870 seeds ha-1 (high).
Table 7. Nitrogen Use Efficiency treatment means by location, Haskell and Lake Carl Blackwell, OK, 2002.
NUE= (Grain N uptake of N treatment – Grain N uptake of check) / Nrate SED is the standard error of the difference between two equally replicated means. Haskell population (pop) was: 44,460 seeds ha-1 (low) and 66,690 seeds ha-1 (high). LCB (Lake Carl Blackwell) population was: 35,568 seeds ha-1 (low) and 51,870 seeds ha-1 (high).
Table 8. Nitrogen Use Efficiency treatment means by location, Haskell and Lake Carl Blackwell, OK, 2003.
NUE= (Grain N uptake of N treatment – Grain N uptake of check) / Nrate SED is the standard error of the difference between two equally replicated means. Haskell population (pop) was: 49,400 seeds ha-1 (low) and 71,630 seeds ha-1 (high). LCB (Lake Carl Blackwell) population was: 35,568 seeds ha-1 (low) and 51,870 seeds ha-1 (high).
N rate (kg ha-1) ----------------------------------- % ----------------------------------
56 22 9 8 10 6 11
112 16 9 6 0 20 5 Low
Hybrid Avg. 19 9 7 3 17 8
56 21 7 9 26 60 5
112 13 8 1 14 20 8 High
Hybrid Avg. 17 7 4 20 40 2 SED 7 10 5 12 13 8
46
Table 9. Effect of hybrid, plant population, and N rate on NUE by location, Greenlee Farm, Haskell, and Lake Carl Blackwell, OK, 2004.
NUE= (Grain N uptake of N treatment – Grain N uptake of check) / Nrate SED is the standard error of the difference between two equally replicated means.
Treatment Greenlee Farm Haskell Lake Carl Blackwell 99-day 113-day 99-day 113-day 99-day 113-day Plant pop.
Figure 1. Effect of plant population on RNDVI for two sensor readings in three hybrids at Haskell and LCB, OK, 2002.
0.25
0.35
0.45
0.55
0.65
0.75
0.85
V10 R1 V7 R1
Haskell Location LCB
RN
DVI
low pop, 105-day
high pop, 105-day
low pop, 109-day
high pop, 109-day
low pop, 113-day
high pop, 113-day
Figure 2. Effect of plant population on RNDVI over time in three hybrids at Haskell, OK, 2003.
0.45
0.5
0.55
0.6
0.65
0.7
0.75
0.8
0.85
0.9
0.95
V6 V7 V8 V10 V16 R1 R2 R3 R4
RNDV
I
low pop, 104-day high pop,104-day low pop, 107-dayhigh pop, 107-day low pop, 111-day high pop, 111-day
48
Figure 3. Relationship between RNDVI and plant population of three hybrids at the V8 growth stage over two locations with 0 N treatments removed fitted to a linear-plateau model, 2003.
Figure 4. Relationship between RNDVI and plant population of three hybrids at the R2 growth stage over two locations with 0 N treatments removed fitted to a linear-plateau model, 2003.
Bruce, R.R., G.W. Langdale, and A.L. Dillard. 1990. Tillage and crop rotation
effect on characteristics of a sandy surface soil. Soil Sci. Soc. Am. J. 54:1744-1747.
Campbell, C.A., and R.P. Zenter. 1993. Soil organic matter as influenced by crop
rotations and fertilization. Soil Sci. Soc. Am. J. 57:1034-1040. Cantero-Martinez, C., G.J. O’Leary, and D.J. Connor. 1999. Soil water and
nitrogen interaction in wheat in a dry season under a fallow-wheat cropping system. Australian Journal of Experimental Agriculture. 39:29-37.
Christensen, N.B., W.C. Lindemann, E. Salazar-Sosa, and L.R. Gill. 1994.
Nitrogen and carbon dynamics in no-till and stubble mulch tillage systems. Agron. J. 86:298-303.
Cochran, V.L., L.F. Elliot, and R.I. Papendick. 1980. Carbon and nitrogen
movement under surface applied wheat (Triticum aestivum) straw. Soil Sci. Soc. Am. J. 44:978-982.
Cogo, N.P., W.C. Moldenhauer, and G.R. Foster. 1984. Soil loss reductions from
conservation tillage practices. Soil Sci. Soc. Am. J. 48:368-373. Dao, T.H. 1993. Tillage and winter wheat residue management effects on water
infiltration and storage. Soil Sci. Am. J. 57:1586-1595. Dick, W.A. 1983. Organic carbon, nitrogen, and phosphorus concentrations and
pH in soil profiles as affected by tillage intensity. Soil Sci. Soc. Am. J. 47:102-107.
Dodge, D.A., and H.E. Jones. 1948. The effect of long-time fertility treatments on the nitrogen and carbon content of a prairie soil. J. Am. Soc. Agron. 40:478-485.
Doran, J.W. 1980. Soil microbial and biochemical changes associated with
reduced tillage. Soil Sci. Soc. Am. J. 44:765-771. Dowdell, R.J., and R.Q. Cannell. 1975. Effect of ploughing and direct drilling on
soil nitrate content. J. Soil. Sci. 26:53-61. Dowdell, R.J., and R. Crees. 1980. The uptake of N-labeled fertilizer by winter
wheat and its immobilization in a clay soil after direct drilling or plowing. J. Sci. Food Agric. 31:992-996.
83
Eck, H. V., and O.R. Jones. 1992. Soil nitrogen status as affected by tillage,
crops, and crop sequences. Agron. J. 84:660-668. Edwards, W.M., M.J. Shipitalo, L.B. Owens, and L.D. Norton. 1990. Effect of
Lumbricus terrestris L. burrows on hydrology of continuous no-till corn fields. Geoderma 46:73-84.
Eghball, B., L.N. Mielke, D.L. McCallister, and J.W. Doran. 1994. Distribution of
organic carbon and inorganic nitrogen in soil under various tillage and crop sequences. J. Soil Water ConServ. 49:201-205.
Elliott, E.T., P.W. Tracy, G.A. Peterson, and C.V. Cole. 1986. Leaching of
mineralized N is less under no-till cultivation. P. 53-54. In Trans. Int. Congr. Soil Sci. 13th, Hamburg, Germany. Vol. 6. Congr. Centurum, Hamburg.
Entz, M.H., and D.B. Fowler. 1991. Agronomic performance of winter versus
spring wheat. Agron. J. 83:527-532. Fenster, C.R., and G.A. Peterson. 1979. Effects of no-tillage fallow compared to
conventional tillage in a wheat-fallow system. Nebraska Agic. Exp. Bull. 289.
Follett, R.F., and D.S. Schimel. 1989. Effect of tillage practices on microbial
biomass dynamics. Soil Sci. Soc. Am. J. 53:1091-1096. Fox, R.H., and V.A. Bandel. 1986. Nitrogen utilization with no-tillage. In M.A.
Sprague and Triplett (eds) No-tillage and surface tillage agriculture, the tillage revolution. P. 117-148. John Wiley and Sons, New York.
Groffman, P.M. 1984. Nitrification and denitrification in conventional and no-
tillage soils. Soil Sci. Soc. Am. J. 49:329-334. Haas, H.J., C.E. Evans, and E.F. Miles. 1957. Carbon and nitrogen changes in
Great Plains soils as influenced by cropping and soil treatments. USDA Tech. Bull. 1164. U.S. Gov. Print. Office, Washington, DC.
Halvorson, A.D., A. L. Black, J.M. Krupinsky, and Stephen D. Merrill. 1999. Dryland winter wheat response to tillage and nitrogen within an annual cropping system. Agron. J. 91:702-707.
Hamid, A., and R.L. Mahler. 1994. The potential for volatilization losses of
Hobbs, L.A., and P.L. Brown. 1957. Nitrogen and organic carbon changes in cultivated western Kansas soils. Kansas Agric. Exp. Stn. Tech. Bull. 89.
Holland, J.F., and W.L. Felton. 1989. Effect of tillage practice on grain sorghum
production in northern New South Wales. Aust. J. Exp. Agric. 29:843-848. Ismail, I., R.L. Blevins, and W.W. Frye. 1994. Long-term no-tillage effects on soil
properties and continuous corn yields. Soil Sci. Soc. Am. J. 58:193-198. Jones, O.R., and T.W. Popham. 1997. Cropping and tillage systems for dryland
grain production in the southern high plains. Agron. J. 89:222-232. King, K.W., D.C. Flanagan, L.D. Norton, and J.M. Laflen. 1995. Rill erodibility
parameters influenced by long-term management practices. Trans. ASAE. 38:159-164.
Kirkegaard, J.A., R. Munns, R.A. James, P.A. Gardner, and J.F. Angus. 1995.
Reduced growth and yield of wheat with conservation cropping: II. Soil biological factors limit growth under direct drilling. Aust. J. Agric. Res. 46:75-88.
Kitur, B.K., M.S. Smith, R.L. Blevins, and W.W. Frye. 1984. Fate of N-depleted
ammonium nitrate applied to no-tillage and conventional tillage corn. Agron. J. 76:240-242.
of rainfed winter wheat in tilled and no-till sorghum and wheat residues. Agron. J. 85:886-893.
Kolberg, R.L., N.R. Kitchen, D.G. Westfall, and G.A. Peterson. 1996. Cropping
intensity and nitrogen management impact of dryland no-till rotations in the semi-arid Western Great Plains. J. Prod. Agric. 9:517-522.
Lal, R., A.A. Mahboubi, and N.R. Fausey. 1994. Long-term tillage effect and
rotation effects on properties of a central Ohio soil. Soil Sci. Soc. Am. J. 58:517-522.
Lamb, J.A., G.A. Peterson, and C.R. Fenster. 1985. Wheat-fallow tillage systems
‘effect on newly cultivated grassland soils’ nitrogen budget. Soil Sci. Soc. Am. J. 49:352-356.
Lembi, C.A., M.D. Bri Hon, and M.A. Ross. 1985. Evaluation of nitrogen
application technique and tillage system on nitrogen runoff from an erodible soil. Technical Report 174. Purdue Univ., West Lafayette, Ind.
Lopez-Bellido, L., M. Fuentes, J.E. Castillo, F.J. Lopez-Garrido, and E.J.
85
Fernandez. 1996. Long-term tillage, crop rotation and nitrogen fertilizer effects on wheat yield under rainfed Mediterranean conditions. Agron. J. 88:783-791.
Lupwayi, N.Z., W.A. Rice, and G.W. Clayton. 1998. Soil microbial diversity and
community structure under wheat as influenced by tillage and crop rotation. Soil Biol. Biochem. 30:1733-1742.
McDowell, L. L., and G.E. Smith. 1958. The retention and reactions of anhydrous
ammonia on different soil types. Soil Sci. Soc. Amer. Proc. 22:38-42. McGregor, K.C., C.K. Mutchler, and R.K. Cullum.1992. Soil erosion effects on
Tyler. 1993. Chemical and physical characteristics of four soil types under conventional and no-tillage systems. Soil Tillage Res. 28:51-61.
Rice, C.W., and M.S. Smith. 1982. Denitrification in no-till and plowed soils. Soil
Sci. Soc. Am. J. 46:1168-1173. Rice, C.W., and M.S. Smith. 1984. Short-term immobilization of fertilizer nitrogen
at the surface of no-till and plowed soils. Soil Sci. Soc. Am. J. 48:295-297. Ridley, A.O., and R.A. Hedlin. 1968. Soil organic matter and crop yields as
influenced by frequency of summerfallowing. Can. J. Soil Sci. 48:315-322. Robbins, S.G., and R.D. Voss. 1989. Division S-8-fertilizer technology and use
acidic zones from ammonia application in conservation tillage systems. Soil Sci. Soc. Am. J. 53:1256-1263.
Rodriguez, M.B., and N. Giambiagi. 1995. Denitrification in tillage and no-tillage
Pampean soils: relationships among soil water, available carbon, and nitrate and nitrous oxide production. Commun. Soil. Sci. Plant Anal. 26:3205-3220.
SAS Institute. 1990. SAS/STAT user’s guide. Release 6.03 ed. SAS Inst., Cary,
NC. Schepers, J.L., and R.A. Cattani. 1962. Mineral fixation of anhydrous ammonia
by air-dry soils. Soil Sci. Soc. Am. Proc. 26:147-152. Smika, D.E., and P.W. Unger. 1986. Effect of surface residues on soil water
storage. Adv. Soil. Sci. 5:111-138. Smith, S.J., and A.N. Sharpley. 1990. Soil nitrogen mineralization in the
presense of surface and incorporated crop residues. Agron. J. 82:112-116.
Smith, S.J., A.N. Sharpley, J.W. Naney, W.A. Berg, and O.R. Jones. 1991. Water Quality impacts associated with wheat culture in the southern Plains. J. Environ. Qual. 20:244-249.
Soper, R.J., G.J. Racz, and P.I. Fehr. 1971. Nitrate nitrogen in the soil as a
means of predicting the fertilizer nitrogen requirements of barley. Can. J. Soil Sci. 51:45-49.
Stinner, B.R., G.D. Hoyt, and R.L. Todd. 1983. Changes in soil chemical
87
properties following a 12-year fallow: A 2-year comparison of conventional tillage and no-tillage agroecosystems. Soil Tillage Res. 3:277-290.
Swart, C.L., L.S. Murphy, and C.W. Swallow. 1971. Retention patterns and
effectiveness of anhydrous ammonia applied with an undercutting blade. Agron. J. 63:881-884.
Toews, W.H., and R.J. Soper. 1978. Effects of nitrogen sources, method of
placement and soil type on seedling emergence and barley crop yields. Can. J. Soil Sci. 58:311-320.
Tomar, J.S., and R.J. Soper. 1981. Fate of tagged urea N in field with different
methods of N and organic matter placement. Agron. J. 73:991-995. Unger, P.W. 1991. Organic matter, nutrient, and pH distribution in no- and
conventional-tillage semiarid soils. Agron. J. 83:186-189. Vyn, T.J., and B.A. Raimbault. 1993. Long-term effect of five tillage systems on
corn response and soil structure. Agron. J. 85:1074-1079. Waddell, J.T., and R.R. Weil. 1996. Water distribution in soil under ridge-till and
no-till corn. Soil Sci. Soc. Am. J. 60:230-237. Wagger, M.G., D.E. Kissel, and S.J. Smith. 1985. Mineralization of nitrogen from
nitrogen-15 labeled crop residues under field conditions. Soil Sci. Soc. Am. J. 49:1220-1226.
Weersink, A., M. Walker, C. Swanton, and J.E. Shaw. 1992. Costs of
conventional and conservation tillage systems. J. Soil and Water Cons. 47:328-334.
Wienhold, B.J., and A.D. Halvorson. 1999. Nitrogen mineralization responses to
cropping, tillage, and nitrogen rate in the northern great plains. Soil Sci. Soc. Am. J. 63:192-196.
Wood, C.W., D.G. Westfall, and G.A. Peterson. 1991. Soil carbon and nitrogen
on initiation of no-till cropping systems. Soil Sci. Soc. Am. J. 55:470-476. Young, R.A., J.C. Zubriski, and E.B. Norum. 1960. Influence of long-term fertility
management practices on chemical and physical properties of a Fargo clay. Soil Sci. Soc. Am. J. 24:124-128.
88
Table 1. Initial surface (0-15 cm) and sub-soil (15-30 cm) test results prior to experiment initiation at Efaw and Lahoma OK.
NH4-N NO3-N P K Sample ---------------------------- mg kg-1 --------------------------- pH Lahoma (0-15 cm) 14.35 8.86 9.34 282 5.67 Lahoma (15-30 cm) 15.78 3.89 6.49 222 6.23 Efaw (0-15 cm) 15.87 11.16 28.23 225 5.70 Efaw (15-30 cm) 13.70 7.41 7.44 190 6.35 NH4-N and NO3-N – 2 M KCL extract; P and K – Mehlich-3 extraction; pH – 1:1 soil:deionized water Table 2. Planting, fertilizer, and harvest dates at Efaw and Lahoma, OK, 2000-04.
Location Crop Year Planting Fertilizer
Application Grain Harvest
2000-2001 11-30-00 11-22-00 6-11-01
2001-2002 10-01-01 9-11-01 6-21-02
2002-2003 10-17-02 9-03-02 6-23-03
Efaw 2003-2004 9-27-03 9-18-03 6-15-04
2000-2001 11-27-00 11-27-00 6-14-01
2001-2002 10-03-01 9-04-01 6-25-02
2002-2003 10-08-02 9-06-02 6-17-03
Lahoma 2003-2004 10-16-03 9-19-03 6-12-04
89
Table 3. Grain yield treatment means and analysis of variance at Efaw, 2001-2004.
*, **, *** Significant at the 0.10, 0.05, and 0.01 levels of probability, respectively; NS is not significant. SED is the standard error of the difference between two equally replicated means. CT= conventional tillage; NT= no-till RI = highest N treated average grain yield divided by the average check (0 N rate).
Avg. 2.28 3.24 3.22 3.70 3.12 NT Response Indices (RI) 1.40 1.25 1.32 1.94 1.42 SED 0.13 0.27 0.12 0.36 ---
Source of Variation Level of Significance Tillage NS * ** NS --- N rate *** * *** *** --- N method NS NS NS NS --- N rate * N method NS NS * NS --- Tillage * N rate NS * NS NS --- Tillage * N method NS * NS NS --- Tillage * N rate * N method NS NS NS NS --- CT, Knife vs. V-blade NS NS NS NS --- NT, Knife vs. V-blade * NS NS NS --- CT, Knife linear * NS NS *** --- NT, Knife linear *** ** *** *** --- CT, Knife quadratic NS NS NS NS --- NT, Knife quadratic NS NS NS * --- CT, V-blade linear ** NS *** *** --- NT, V-blade linear ** ** *** *** --- CT, V-blade quadratic NS NS *** *** --- NT, V-blade quadratic NS NS NS NS ---
90
Table 4. Grain yield treatment means and analysis of variance at Lahoma, 2001- 2004.
*, **, *** Significant at the 0.10, 0.05, and 0.01 levels of probability, respectively; NS is not significant. SED is the standard error of the difference between two equally replicated means. CT= conventional tillage; NT= no-till RI = highest N treated grain yield average divided by the check (0 N rate) average.
Avg. 1.50 3.32 4.97 2.89 3.11 NT Response Indices (RI) 1.67 1.68 1.32 2.71 1.92 SED 0.31 0.20 0.42 0.46 ---
Source of Variation Level of Significance Tillage * ** *** *** --- N rate *** *** *** *** --- N method NS ** NS NS --- N rate * N method NS * NS NS --- Tillage * N rate *** ** NS ** --- Tillage * N method NS *** NS ** --- Tillage * N rate * N method NS NS NS * --- CT, Knife vs. V-blade NS NS NS NS --- NT, Knife vs. V-blade NS *** NS NS --- CT, Knife linear NS NS * *** --- NT, Knife linear ** NS ** *** --- CT, Knife quadratic NS NS NS *** --- NT, Knife quadratic NS ** *** NS --- CT, V-blade linear NS NS *** NS --- NT, V-blade linear *** *** NS *** --- CT, V-blade quadratic NS NS ** NS --- NT, V-blade quadratic *** ** NS * ---
91
Table 5. Grain N uptake treatment means and analysis of variance at Efaw, 2001-2004.
*, **, *** Significant at the 0.10, 0.05, and 0.01 levels of probability, respectively; NS is not significant. SED is the standard error of the difference between two equally replicated means. CT= conventional tillage; NT= no-till
Avg. 53.0 80.4 73.7 81.0 71.6 SED 4.9 8.7 14.8 10.3 --- Source of Variation Level of Significance Tillage * ** *** NS --- N rate *** *** ** *** --- N method NS NS NS NS --- N rate * N method NS NS NS NS --- Tillage * N rate NS NS NS NS --- Tillage * N method * NS NS NS --- Tillage * N rate * N method NS NS NS NS --- CT, Knife vs. V-blade NS ** NS NS --- NT, Knife vs. V-blade ** NS NS NS --- CT, Knife linear ** * NS *** --- NT, Knife linear *** * *** *** --- CT, Knife quadratic NS NS NS NS --- NT, Knife quadratic NS NS NS NS --- CT, V-blade linear *** NS NS *** --- NT, V-blade linear ** *** *** *** --- CT, V-blade quadratic NS NS NS ** --- NT, V-blade quadratic NS NS NS NS ---
92
Table 6. Grain N uptake treatment means and analysis of variance at Lahoma, 2001-2004.
*, **, *** Significant at the 0.10, 0.05, and 0.01 levels of probability, respectively; NS is not significant. SED is the standard error of the difference between two equally replicated means. CT= conventional tillage; NT= no-till
Avg. 38.0 86.5 115.2 87.2 79.2 SED 7.9 8.1 9.5 16.5 --- Source of Variation Level of Significance Tillage NS *** *** * --- N rate *** *** *** *** --- N method NS NS NS NS --- N rate * N method NS NS NS NS --- Tillage * N rate ** * NS * --- Tillage * N method NS *** * NS --- Tillage * N rate * N method NS * NS * --- CT, Knife vs. V-blade NS ** NS NS --- NT, Knife vs. V-blade NS *** NS NS --- CT, Knife linear NS NS *** *** --- NT, Knife linear ** NS *** *** --- CT, Knife quadratic NS NS NS ** --- NT, Knife quadratic NS NS ** NS --- CT, V-blade linear NS NS *** NS --- NT, V-blade linear *** *** *** *** --- CT, V-blade quadratic NS NS ** NS --- NT, V-blade quadratic ** * NS NS ---
93
Table 7. Nitrogen Use Efficiency treatment means and analysis of variance at Efaw, 2001-2004.
*, **, *** Significant at the 0.10, 0.05, and 0.01 levels of probability, respectively; NS is not significant. NUE= (Grain N uptake of N treatment – Grain N uptake of check) / N rate SED is the standard error of the difference between two equally replicated means. CT= conventional tillage; NT= no-till
Treatment 2001 2002 2003 2004 Avg.
Tillage App/
Source N rate
kg N ha-1 -------------------------------- NUE (%) --------------------------------- 61 5 4 15 68 23 123 10 8 13 30 15 Knife
Avg. 7 13 26 39 21 SED 5 11 12 17 --- Source of Variation Level of Significance Tillage NS NS ** NS --- N rate NS NS NS NS --- N method NS NS NS NS --- N rate * N method NS NS NS NS --- Tillage * N rate NS NS NS NS --- Tillage * N method *** NS NS NS --- Tillage * N rate * N method NS NS NS NS --- CT, Knife vs. V-blade NS NS NS NS --- NT, Knife vs. V-blade *** NS NS NS --- CT, Knife linear NS NS NS NS --- NT, Knife linear NS NS *** NS --- CT, Knife quadratic NS NS NS NS --- NT, Knife quadratic NS NS ** NS --- CT, V-blade linear * NS NS NS --- NT, V-blade linear NS NS NS NS --- CT, V-blade quadratic NS NS NS NS --- NT, V-blade quadratic NS NS NS NS ---
94
Table 8. Nitrogen Use Efficiency treatment means and analysis of variance at Lahoma, 2001-2004.
*, **, *** Significant at the 0.10, 0.05, and 0.01 levels of probability, respectively; NS is not significant. NUE= (Grain N uptake of N treatment – Grain N uptake of check) / N rate SED is the standard error of the difference between two equally replicated means. CT= conventional tillage; NT= no-till
Treatment 2001 2002 2003 2004 Avg.
Tillage App/
Source N rate
kg N ha-1 -------------------------------- NUE (%) --------------------------------- 61 14 23 46 90 43
123 0 13 40 50 24 Knife
185 6 6 28 36 19 Avg. 5 14 38 59 29
61 29 23 64 20 36 123 3 1 32 0 8 V-blade
185 5 4 25 3 9
CT
Avg. 12 11 40 6 17 61 19 14 36 58 27
123 13 13 39 45 27 Knife
185 14 4 22 37 19 Avg. 15 10 32 43 24
61 44 48 39 78 53 123 24 35 27 72 39 V-blade
185 16 28 24 45 27
NT
Avg. 28 37 29 65 40 SED 7 9 10 14 --- Source of Variation Level of Significance Tillage * NS * ** --- N rate *** *** *** *** --- N method *** *** NS ** --- N rate * N method * NS NS NS --- Tillage * N rate NS NS NS NS --- Tillage * N method NS *** NS *** --- Tillage * N rate * N method NS NS NS NS --- CT, Knife vs. V-blade NS NS NS *** --- NT, Knife vs. V-blade ** *** NS * --- CT, Knife linear NS * * *** --- NT, Knife linear NS NS NS NS --- CT, Knife quadratic ** NS NS NS --- NT, Knife quadratic NS NS NS NS --- CT, V-blade linear ** ** *** NS --- NT, V-blade linear *** * NS ** --- CT, V-blade quadratic * * NS NS --- NT, V-blade quadratic NS NS NS NS ---
95
Table 9. Soil nitrate N treatment means from post-harvest sampling in 2002 and 2004 at Efaw and Lahoma, OK.
SED is the standard error of the difference between two equally replicated means. CT= conventional tillage; NT= no-till NO3-N – 2 M KCL extract In 2002 no subsoil samples (15-30 cm) were collected.
2002 2004
Efaw Lahoma Efaw Lahoma 0-15 cm 0-15 cm 0-15 cm 15-30 cm 0-15 cm 15-30 cm
Tillage App/
Source N rate
kg N ha-1 NO3
- N ----------------------------------- mg kg-1 -----------------------------------
Table 10. Soil ammonium N treatment means from post-harvest sampling in 2002 and 2004 at Efaw and Lahoma, OK.
SED is the standard error of the difference between two equally replicated means. CT= conventional tillage; NT= no-till NH4 -N – 2 M KCL extract In 2002 no subsoil samples (15-30 cm) were collected.
2002 2004
Efaw Lahoma Efaw Lahoma 0-15 cm 0-15 cm 0-15 cm 15-30 cm 0-15 cm 15-30 cm
Figure 3. Effect of tillage and N method on soil compaction over four years for depths 0-30 cm at Lahoma, OK.
Figure 4. Effect of tillage and N method on soil compaction over four years for depths 0-30 cm at Efaw, OK.
0
5
10
15
20
25
300 500 1000 1500
Soil Compaction (kPa)
Dept
h (c
m) NT, Knife
NT, V-blade
CT, Knife
CT, V-blade
0
5
10
15
20
25
300 500 1000 1500 2000
Soil Compaction (kPa)
Dep
th (c
m) NT, Knife
NT, V-blade
CT, Knife
CT, V-blade
VITA
Roger Keith Teal
Candidate for the Degree of
Doctor of Philosophy
Dissertation: EVALUATING METHODS FOR IMPROVING NITROGEN USE
EFFICIENCY IN CORN AND HARD RED WINTER WHEAT
Major Field: Soil Science Biographical:
Personal Data: Born in Manchester, Tennessee, on August 15, 1978. Education: Graduated from Coffee County Central High School,
Manchester, Tennessee in May 1996; received Bachelors of Science degree in Plant and Soil Science from University of Tennessee-Martin, Martin, Tennessee in May 2000. Completed the requirements for the Master of Science degree with a major in Plant and Soil Sciences at Oklahoma State University in August 2002. Completed the requirements for the Doctor of Philosophy degree with a major in Soil Science at Oklahoma State University in May 2005.
Experience: farm employee for Pine Grove Dairy, 1991-2000, Shady
Grove, Tennessee; assistant manager for Maple Creek Dairy, 1991-2000, Mud Creek, Tennessee; lab instructor for University of Tennessee-Martin, 1998-2000, Martin, Tennessee; employed by Oklahoma State University, Department of Plant and Soil Sciences as a graduate research assistant, 2000-2002.
Professional Memberships: American Society of Agronomy, Crop Science
Society of America, and Soil Science Society of America.
Name: Roger Keith Teal Date of Degree: May, 2005 Institution: Oklahoma State University Location: Stillwater, Oklahoma
Title of Study: EVALUATING METHODS FOR IMPROVING NITROGEN USE
EFFICIENCY IN CORN AND HARD RED WINTER WHEAT
Pages in Study: 98 Candidate for the Degree of Doctor of Philosophy Major Field: Soil Science Scope and Method of Study: For chapter one, Corn (Zea mays L.) experiments
were conducted to evaluate spectral reflectance, measuring the normalized difference vegetation index (NDVI) with a GreenSeeker™ Hand Held optical reflectance sensor as a function of hybrid, plant population, and fertilizer N rate. In the spring of 2004 with the addition of a third site and the availability of a green NDVI sensor, the trials were reconfigured removing one hybrid and imposing two more plant populations and the utilization of both green and red NDVI. Differences in NDVI, grain yield, grain N, and grain N uptake were investigated based on hybrid, plant population, and N rate. For chapter two, Hard red winter wheat (Triticum aestivum L.) experiments were conducted to evaluate tillage system and anhydrous ammonia application methods on yield, N uptake, and NUE, using a narrow (10 cm) nozzle spacing on a V-blade (Noble or sweep blade) applicator and wide (46 cm) nozzle spacing on a knife applicator.
Findings and Conclusions: For chapter one, the critical population at which NDVI
was no longer affected occurred between 55,000 and 60,000 plants ha –1 for the later maturing hybrids and closer to 70,000 plants ha –1 for the earliest maturing hybrids. Vegetative response index (RINDVI) at V8 was highly correlated with RI at harvest (RIHARVEST) in 2004. The V8 growth stage was most effective growth stage to predict grain yield. Hybrid maturity did not effect grain yield prediction at V8 and no significant differences occurred between the GNDVI and RNDVI relationships with grain yield in 2004. For chapter two, conventional tillage was significantly higher in grain yield and grain N uptake in five of eight site years over no-till. Mixed results were evaluated from NUE for tillage; four site years split evenly between conventional till and no-till. The V-blade improved NUE in no-till three site years at Lahoma, but the knife applicator increased NUE the initial year at Efaw in no-till. Previous crop residue disturbance averaged less than 15% for both AA applicators all four site years. No-till crop production reduced soil compaction at Efaw and the V-blade applicator reduced soil compaction within the no-till at both locations.