Page 1
University of Central Florida University of Central Florida
STARS STARS
Electronic Theses and Dissertations, 2020-
2021
Evaluating Ozone and Granular Activated Carbon Treatment for Evaluating Ozone and Granular Activated Carbon Treatment for
Control of Disinfection By-Product Formation for a Central Florida Control of Disinfection By-Product Formation for a Central Florida
Groundwater Supply Groundwater Supply
Devon Higgins University of Central Florida
Part of the Environmental Engineering Commons
Find similar works at: https://stars.library.ucf.edu/etd2020
University of Central Florida Libraries http://library.ucf.edu
This Masters Thesis (Open Access) is brought to you for free and open access by STARS. It has been accepted for
inclusion in Electronic Theses and Dissertations, 2020- by an authorized administrator of STARS. For more
information, please contact [email protected] .
STARS Citation STARS Citation Higgins, Devon, "Evaluating Ozone and Granular Activated Carbon Treatment for Control of Disinfection By-Product Formation for a Central Florida Groundwater Supply" (2021). Electronic Theses and Dissertations, 2020-. 696. https://stars.library.ucf.edu/etd2020/696
Page 2
EVALUATING OZONE AND GRANULAR ACTIVATED CARBON
TREATMENT FOR CONTROLLING OF DISINFECTION BY-PRODUCT
FORMATION IN A CENTRAL FLORIDA GROUNDWATER SUPPLY
by
DEVON J. HIGGINS
B.S.EnvE., University of Central Florida, 2019
A thesis submitted in partial fulfillment of the requirements
for the degree of Master of Sciences
in the Department of Civil, Environmental and Construction Engineering
in the College of Engineering and Computer Science
at the University of Central Florida
Orlando, Florida
Summer Term
2021
Major Professor: Steven J. Duranceau
Page 3
ii
©2021 Devon J. Higgins
Page 4
iii
ABSTRACT
A pilot investigation that compared ozone oxidation with an integrated ozone and granular
activated carbon (GAC) process for the control of regulated disinfection by-products at the
University of Central Florida’s water plant located at the Orlando campus has been completed.
Treatment effectiveness was measured by monitoring the parameters pH, temperature, non-
purgeable dissolved organic carbon (DOC), ultraviolet absorbance at a wavelength of 254 nm
(UV254), specific ultraviolet absorbance (SUVA), excitation emission matrices (EEMs) and the
associated formation of the DBP chemical groups total trihalomethanes (TTHMs) and haloacetic
acids (HAAs). Groundwater that contained an average of 2.5 milligrams per liter (mg/L) DOC and
0.8 mg/L total sulfide was fed to a 15 gram/hour ozone contactor prior to being transferred to two
parallel GAC pilot columns, each containing a different coal-based GAC material, either denoted
Filtrasorb® (FS-400) or HPC-830 (HPC-830), with an apparent density of 0.54 and 0.36 grams per
cubic centimeter, respectively. Stand-alone ozone treatment having an instantaneous ozone
demand of 0.82 mg/L O3 provided a 6.0 mg/L O3 residual that when held for 30 minutes, followed
by the addition of 5 mg/L Cl2 to represent disinfection, reduced 48-hour TTHM formation by 22
percent, however, increased 48-hour HAA formation by 67 percent. The integrated ozone-GAC
process was found to consistently reduce 24-hour and 48-hour TTHM and HAA formation to
below regulatory levels through the entirety of the 420 hours of operational run-time. Results for
the integrated ozone-GAC process operating at a dose of 7.20 mg/L O3 both FS-400 and HPC-830
carbon types reached an average of 60% breakthrough for UV254 and DOC in the last 1000 bed
volumes of the study. Projections with these results provided an estimated 30,000 EBV and 35,000
EBV for the FS-400 and HPC-830 carbon types, respectively, and could be achieved prior to bed
DOC exhaustion.
Page 5
iv
This thesis is dedicated to my friends, loved ones and life mentors.
Page 6
v
ACKNOWLEDGEMENTS
The research as described herein was possible because of the assistance provided by several
individuals. Special thanks are given to Dr. Steven Duranceau for giving gifting me the opportunity
to work this project, serving as my advisor, and guiding myself through the boisterous journey of
academic research. Sincere thanks are also given to Dr. Steven Duranceau, Dr. Anwar Sadmani
and Dr. Woo Hyoung Lee for offering me their time and professional expertise in serving on my
committee and reviewing this thesis. Considerable appreciation is also given to the members of
the past and present UCF’s Water Quality Engineering research team for their selfless support and
depth of knowledge in the field of water quality research: Tulsi Shukla, Paula Campesino,
Courtney Powell, Jessica Cormier and Zachary Protas.
The author would also like to express his gratitude towards the staff of the University of Central
Florida Utilities and Energies Services, particularly Dale Lance, David Ruggiero and Riley Baird,
who unwaveringly lent their time, knowledge and skill when assisting me in the operation of the
pilot plant. Appreciation is also extended towards the contributions and services which were
provided by Dr. Adam Redding of Calgon Carbon, a Kuraray Company (GAC equipment
provider) and Thoram Charanda and Chandler Bobo of Guardian Manufacturing (ozone equipment
provider); I am thankful that these professionals providing myself with solutions in the darkest of
hours.
Lastly, the author would like to bequeath his undivided gratefulness to the friends and family who
lent their support and encouragement when their unbridled kindness and help were needed the
most.
Page 7
vi
Research presented herein is based upon work supported by project authorization number 1620-
0303 for funding provided by the University of Central Florida Utilities and Energy Services. Any
opinions, findings, conclusions, or recommendations expressed in this material do not necessary
reflect the views of the funding agency, the University’s Board of Governor’s or its’ Research
Foundation, rather, remain those of the author.
Page 8
vii
TABLE OF CONTENTS
LIST OF FIGURES ........................................................................................................................ x
LIST OF TABLES ....................................................................................................................... xiii
LIST OF EQUATIONS ................................................................................................................ xv
LIST OF ABBREVIATIONS ...................................................................................................... xvi
CHAPTER 1. INTRODUCTION ............................................................................................. 1
CHAPTER 2. LITERATURE REVIEW .................................................................................. 6
Disinfection By-Product Regulation ........................................................................................... 6
Disinfection By-Product Links to Health Effects ...................................................................... 9
Water Quality Considerations ................................................................................................... 10
Disinfection Conditions ......................................................................................................... 10
Sulfide .................................................................................................................................... 10
Bromide ................................................................................................................................. 12
Natural Organic Matter .......................................................................................................... 13
Alternative Methods to Reduce DBP Precursors ...................................................................... 16
Ozone ..................................................................................................................................... 16
Granular Activated Carbon .................................................................................................... 22
Integrated Treatment .............................................................................................................. 25
CHAPTER 3. EXISTING CONDITIONS ............................................................................. 27
Page 9
viii
Existing Groundwater Conditions ............................................................................................. 29
Existing Potable Water System Conditions .............................................................................. 34
Prior Research ........................................................................................................................... 36
CHAPTER 4. METHODS AND MATERIALS .................................................................... 38
Water Quality Monitoring and Experimental Procedures ......................................................... 38
DBP Formation Experimentation .......................................................................................... 44
Organic Composition Determination ..................................................................................... 45
Pilot System Process ................................................................................................................. 46
Ozone Generator Equipment ................................................................................................. 49
Activated Carbon Pilot Columns ........................................................................................... 51
Laboratory Quality and Control ................................................................................................ 53
CHAPTER 5. RESULTS AND DISCUSSION ...................................................................... 55
Stand-Alone Ozone Oxidation Performance ............................................................................. 56
Water Quality Results ............................................................................................................... 56
DBP Precursor Results .......................................................................................................... 59
DBP Formation Results ......................................................................................................... 64
Integrated Ozone and GAC Process Performance .................................................................... 70
Water Quality Results ............................................................................................................ 73
DBP Precursor Results .......................................................................................................... 75
DBP Formation Results ......................................................................................................... 85
Page 10
ix
Carbon Results ....................................................................................................................... 96
Quality Control and Quality Assurance .................................................................................... 99
CHAPTER 6. CONCLUSIONS ........................................................................................... 104
DOC and UV254 Composition ................................................................................................. 104
DBP Formation Findings ........................................................................................................ 106
CHAPTER 7. RECOMMENDATIONS............................................................................... 109
APPENDIX. WATER QUALITY RESULTS ........................................................................... 112
REFERENCES ........................................................................................................................... 116
Page 11
x
LIST OF FIGURES
Figure 2-1: Excitation-Emission Matrix Regions for Organic Species ........................................ 15
Figure 3-1: Existing UCF WTP Process Schematic ..................................................................... 27
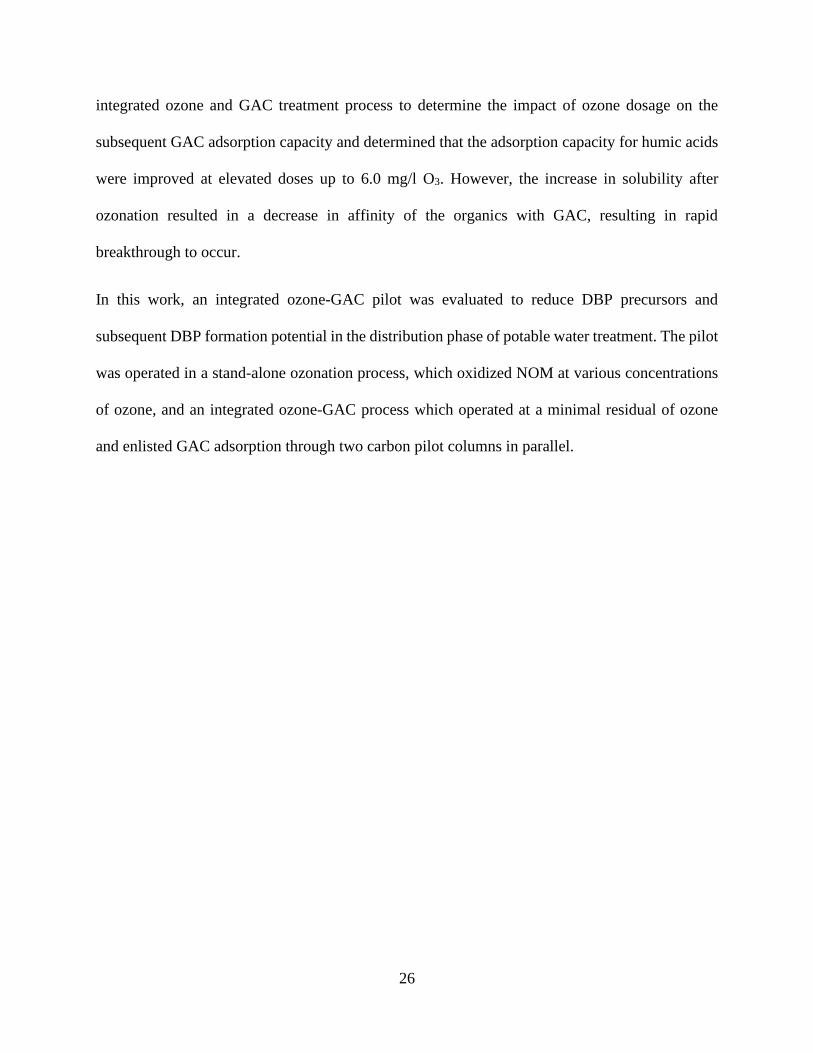
Figure 3-2: Locations of the UCF Orlando Campus (boxed in gold), WTP (circled in yellow) and
Well Field (boxed in green) .......................................................................................................... 28
Figure 3-3: Dissolved Ozone as a Function of Time .................................................................... 33
Figure 3-4: Linearized Dissolved Ozone as a Function of Time .................................................. 33
Figure 3-5: DBP Formations at Vulnerable Sections of the UCF PWS ....................................... 35
Figure 4-1. Process Schematic for the Integrated Ozone-GAC Pilot ........................................... 47
Figure 4-2: a) View of the Integrated Ozone and GAC Pilot, b) GAC Pilot Carbon Columns .... 48
Figure 5-1: Correlation between DOC and UV254 for the Stand-alone Ozonation Study ............ 60
Figure 5-2: Average DOC and UV254 Reduction by the Stand-alone Ozonation Study ............... 61
Figure 5-3: EEM of the Raw UCF Groundwater Supply ............................................................. 62
Figure 5-4: EEM of the UCF Groundwater Supply Ozonated to 0.3 mg/l O3 Residual ............... 63
Figure 5-5: EEM of the UCF Groundwater Supply Ozonated to 3.7 mg/l O3 Residual ............... 63
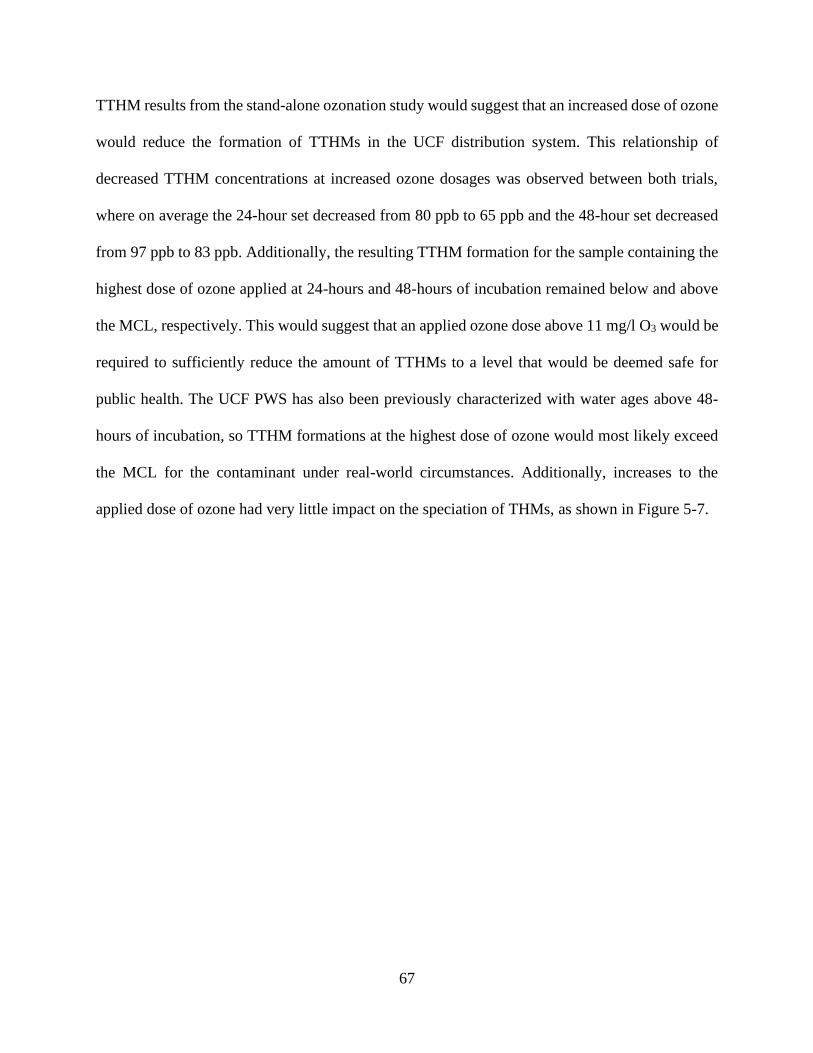
Figure 5-6: Average TTHM Formation at 24 and 48-hours for the Stand-alone Ozonation Study
....................................................................................................................................................... 66
Figure 5-7: THM Speciation for the Stand-alone Ozonation Study ............................................. 68
Figure 5-8: HAA5 Formation at 48-hours from the Stand-alone Ozonation Study ..................... 69
Figure 5-9. Average Daily Runtime and Ozone Residual of the Ozone Skid .............................. 70
Figure 5-10: Flow in terms of EBVs for both GAC Columns in the Ozone-GAC Study ............ 72
Figure 5-11: Relativity of DOC vs UV254 for the HPC-830 Pilot Column ................................... 75
Figure 5-12: Relativity of DOC vs UV254 for the FS-400 Pilot Column ...................................... 76
Page 12
xi
Figure 5-13: DOC Concentration Results from the Integrated Ozone-GAC Pilot Study ............. 77
Figure 5-14: UV254 Results from the Integrated Ozone-GAC Pilot Study ................................... 77
Figure 5-15: GAC Column Breakthrough of UV254 from the Integrated Ozone-GAC Pilot Study
....................................................................................................................................................... 79
Figure 5-16: GAC Column Breakthrough of DOC from the Integrated Ozone-GAC Pilot Study79
Figure 5-17: FS-400 Pilot Column Operation to DOC Exhaustion .............................................. 81
Figure 5-18: HPC-830 Pilot Column Operation to DOC Exhaustion........................................... 81
Figure 5-19: FS-400 Pilot Column Estimated Operation to UV254 Exhaustion............................ 82
Figure 5-20: HPC-830 Pilot Column Estimated Operation to UV254 Exhaustion ........................ 83
Figure 5-21: SUVA of the Integrated Ozone-GAC Pilot.............................................................. 84
Figure 5-22. THM FP and Speciation for the Integrated Ozone-GAC study at 48-hours ............ 88
Figure 5-23: Impact on THM Speciation by the HPC-830 Pilot Column .................................... 89
Figure 5-24: Impact on THM Speciation by the FS-400 Pilot Column ........................................ 90
Figure 5-25: Pilot Column EBVs to TTHM Exhaustion .............................................................. 91
Figure 5-26: Pilot Column UV254 (above) and DOC (below) to TTHM Exhaustion ................... 92
Figure 5-27: HAA Formation of the Integrated Ozone-GAC Pilot at 48-hours of Incubation..... 93
Figure 5-28: Impact on 48-hour HAA Speciation for the HPC-830 Pilot Column ...................... 95
Figure 5-29: Impact on 48-hour HAA Speciation for the FS-400 Pilot Column ......................... 95
Figure 5-30: Exhausted Column Top and Bottom Particle Distributions ..................................... 98
Figure 5-31: Exhausted Pilot Column Percent Finer Distribution Curves ................................... 98
Figure 5-32: Precision Control Chart for DOC Results of the Integrated Ozone-GAC Study ... 100
Figure 5-33: Precision Control Chart for UV254 Results from the Integrated Ozone-GAC Study
..................................................................................................................................................... 101
Page 13
xii
Figure 5-34: Precision Control Chart for TTHM Results from the Integrated Ozone-GAC Study
..................................................................................................................................................... 101
Figure 5-35: Precision Control Chart of TTHM Dupes from the Stand-alone Ozonation Study 102
Figure 6-1: Example of an Engineered GAC Vessel with an Internal Cone Distributor ............ 111
Page 14
xiii
LIST OF TABLES
Table 2-1: MCLs and MCLGs for DBPs per the Stage 2 DBPR ................................................... 8
Table 2-2: SUVA Relation to UVA254 Absorbance and TTHM Formation Potential .................. 14
Table 2-3: Influence of Parameters on Ozone Solubility .............................................................. 20
Table 3-1: Water Quality from UCF Groundwater Supplies (Sampled 7/16/2020) ..................... 29
Table 3-2: Inorganic Water Quality from UCF Wells 3 and 4 (Sampled 1/22/2019) .................. 30
Table 3-3: DBP Formation Potential for the UCF Groundwater Supply...................................... 31
Table 3-4: Groundwater Quality Characteristics .......................................................................... 32
Table 4-1: Methods and Equipment for Water Quality Analysis ................................................. 40
Table 4-2: Methods to Zeroing and Calibration of Instrumentation ............................................. 43
Table 4-3: Virgin Carbon Characteristics ..................................................................................... 51
Table 5-1: Water Quality Results from the Stand-alone Ozonation Study for Trials 1 and 2 ...... 58
Table 5-2: Chlorine Residual Reduction of DBP Samples from the Stand-alone Ozonation Study
....................................................................................................................................................... 65
Table 5-3: TTHM Formation and Percent Reduction by the Stand-alone Ozonation Study ........ 66
Table 5-4: Parameters of Operation for GAC Pilot Columns ....................................................... 71
Table 5-5: Monthly Flow of GAC Pilot Columns ........................................................................ 71
Table 5-6: Ranges for Water Quality Conditions for the Ozone-GAC Pilot ................................ 73
Table 5-7: Dates of DBP Experimentation for the Ozone-GAC Pilot Study. .............................. 85
Table 5-8: Chlorine Reduction of the Integrated Ozone-GAC Pilot ............................................ 86
Table 5-9: DBP Formation Experimentation Results of the Integrated Ozone-GAC Pilot Study 87
Table 5-10: Characteristics of Carbon Types at Start and Finish ................................................. 96
Table 5-11: Historical TTHM Percent Recovery data for the Integrated Ozone-GAC Study .... 102
Page 15
xiv
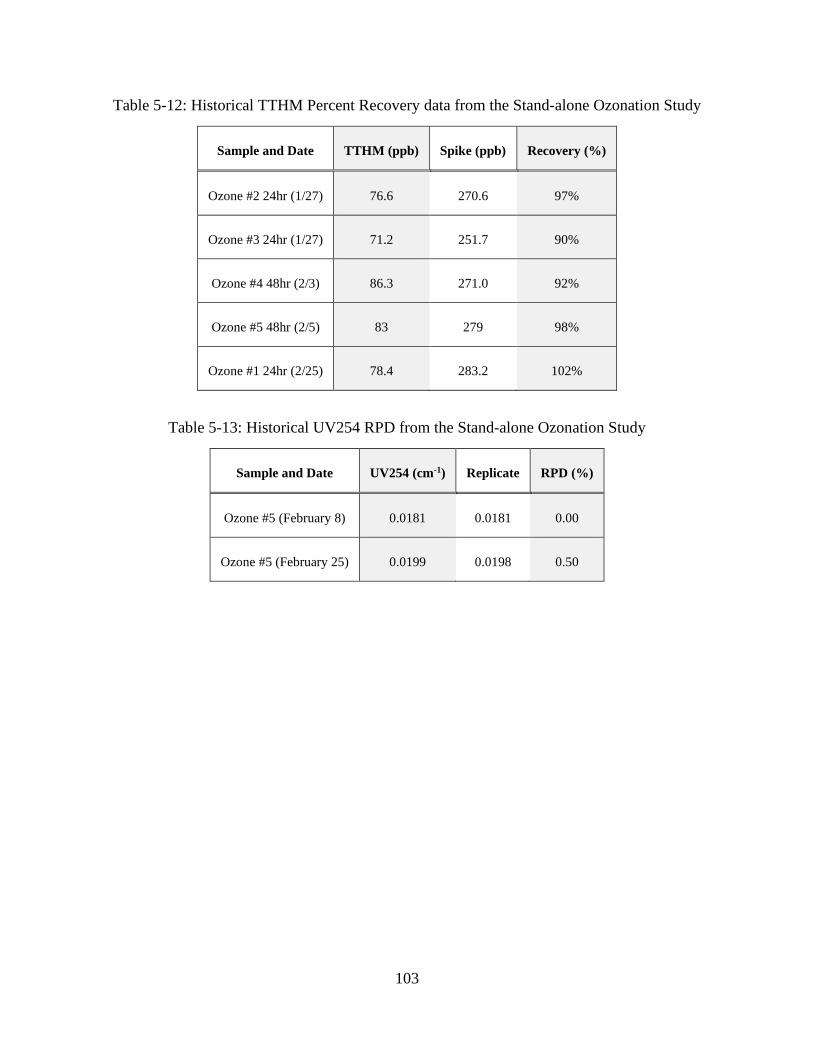
Table 5-12: Historical TTHM Percent Recovery data from the Stand-alone Ozonation Study . 103
Table 5-13: Historical UV254 RPD from the Stand-alone Ozonation Study ............................. 103
Page 16
xv
LIST OF EQUATIONS
(2.1) ............................................................................................................................................... 12
(2.2) ............................................................................................................................................... 14
(2.3) ............................................................................................................................................... 18
(2.4) ............................................................................................................................................... 18
(2.5) ............................................................................................................................................... 18
(2.6) ............................................................................................................................................... 18
(2.7) ............................................................................................................................................... 19
(2-8)............................................................................................................................................... 19
(2.9) ............................................................................................................................................... 21
(2.10) ............................................................................................................................................. 21
(2.11) ............................................................................................................................................. 21
(2.12) ............................................................................................................................................. 25
(4.1) ............................................................................................................................................... 53
(4.2) ............................................................................................................................................... 53
(4.3) ............................................................................................................................................... 53
(4.4) ............................................................................................................................................... 53
(4.5) ............................................................................................................................................... 53
Page 17
xvi
LIST OF ABBREVIATIONS
AOC Assimilable Organic Matter
AN Abrasion Number
BAC Biological Activated Carbon
BDCM Bromodichloromethane
CL Critical Level
COD Chemically Oxidized Demand
CT Contact Time
DBAA Dibromoacetic Acid
DBCM Dibromochloromethane
DBP Disinfection By-Product
DBPR Disinfection By-Product Rule
DCAA Dichloroacetic Acid
DI Distilled
DO Dissolved Oxygen
DOC Dissolved Organic Matter
TDS Total dissolved Solids
EBCT Empty Bed Contact Time
EBV Empty Bed Volume
EEM Excitation Emission Matrices
EPA Environmental Protection Agency
ESEI Environmental Systems Engineering Institute
FDEP Florida Department of Environmental Protection
FP Formation Potential
GAC Granular Activated Carbon
GPD Gallons Per Day
GST Ground Storage Tank
GWR Groundwater Rule
HAA Haloacetic Acid
HAA5 Five Haloacetic Acids
HS Hydrogen Sulfide
IARC International Agency for Research on Cancer
LRAA Locational Running Annual Average
MCL Minimum Contaminant Level
MRDLG Maximum Residual Disinfectant Level Goals
NIPDWR National Interim Primary Drinking Water Regulations
NOM Natural Organic Matter
OH Hydroxide
ORP Oxidative Reduction Potential
Page 18
xvii
OTE Ozone Transfer Efficiency
PLC Programmable Logic Controller
PPB Parts per Billion
PPM Parts per Million
PSA pressure Swing Adsorption
PWS Potable Water System
QAQC Quality Assurance Quality Control
RAA Running Annual Average
RPD Relative Percent Difference
SDWA Safe Drinking Water Act
SFA Surficial Floridan Aquifer
SUVA Specific Ultraviolet Absorbance
SWTR Surficial Water Treatment Act
TCAA Trichloroacetic Acid
THM Trihalomethanes
TTHM Total Trihalomethanes
UCF University of Central Florida
US United States
EPA United States Environmental Protection Agency
UV Ultra-Violet
UV254 ultraviolet light absorbance at a wavelength of 254-nm
WL Warning Level
WTP Water Treatment Plant
Page 19
1
CHAPTER 1. INTRODUCTION
The Safe Drinking Water Act (SDWA) of 1974 authorized the Environmental Protection Agency
(EPA) to set national standards to protect the consumers of potable water in the United States and
its Territories (US) from anthropogenic and natural contamination, and over time, introduced
amendments that sought to enhance the requirements as new health effects and new scientific
knowledge became available. One such amendment included the Stage 1 and Stage 2 Disinfectants
and Disinfection Byproducts Rule (D/DBPR) that required public water systems (PWSs) to rethink
their current treatment and distribution system management strategies. The D/DBPR regulates two
classes of DBPs that are suspected carcinogenic contaminants that form as a result of chlorine
disinfection processes used to inactivate pathogens in the supplies served to the public. After its
promulgation in 1996, the Stage 1 DBPR initially based compliance for TTHMs and HAA5s
maximum contaminant levels (MCLs) to be determined by the running annual average (RAA) that
averaged four quarterly results of water samples collected at four different locations representing
the furthest expanses of a water system’s distribution system (EPA, 1998).
However, with the promulgation of the Stage 2 DBPR in 2006, MCL compliance for the same
compounds is now calculated based on a locational RAA (LRAA) for each monitoring location in
the distribution system (EPA, 2006). This change in enforcement has highlighted regions in PWSs
that are prone to producing DBPs, as the formation of the regulated TTHMs and HAAs as they are
suspected carcinogens may not be consistent across a given water distribution system. In most
cases, potable water transmission pipelines prone to elevated LRAA’s are often due to system
water age, elevated temperatures, and valve management practices and are as such to more likely
to produce elevated DBP content.
Page 20
2
In general, the purpose of drinking water treatment is to comply with the primary and secondary
standards mandated by the EPA (EPA, 1979). In the state of Florida, the Florida Department of
Environmental Protection (FDEP) has been serves as the primacy agency that has the authority to
enforce the primary standards established within the federal SDWA Rules for more than 90
contaminants. Secondary standards that ae not considered enforceable by the EPA are in fact
enforced by the many state agencies to include the FDEP. Violation of the SDWA provisions can
be punitive.
It has been reported by Bush and Richard (1988) that the Floridan Aquifer is one of the major
sources of potable water supplies used by municipalities in Florida, Alabama, Georgia and South
Carolina, and extends for over an area that approximates 100,000 square miles (Bush and Richard,
1988). It is not unexpected then that the Floridan Aquifer serves as the major supplier of water to
most Central Florida potable water purveyors. In 2010, 89 percent of the 2.2 billion gallons per
day of the potable water produced by Florida-based utilities was sourced from groundwater
pumped out of the Floridan Aquifer (Gerardus, et al., 2015). Notwithstanding the numerous
regulated contaminants that may exist within a surface or groundwater supply, some non-regulated
chemical constituents that although not regulated may impact TTHM and HAA formation
downstream of chlorine disinfection processes and include natural organic matter (NOM), or
“precursor” matter, bromide, and total sulfide. When groundwater containing NOM (as measured
by total organic carbon) is disinfected with chlorine, DBPs are formed. Also, the presence of
bromide in the presence of chlorine and NOM will form brominated DBPs, and depending on
specific chemistries, can form bromate (which can occur when ozone oxidation is integrated within
the utility’s treatment regime). Bromate is also a regulated DBP (EPA 1979b). Also, it is often
common practice, although not required, to removed dissolved total sulfide because the chemical
Page 21
3
causes a significant chlorine demand during disinfection as well as issues related to taste, odor,
and corrosivity. NOM may share the same fate as bromide in a PWS, as under certain conditions
organic matter can react with disinfectants to form into halogenated DBPs, such as total
trihalomethanes (TTHMs) and haloacetic acids (HAA5s). The TTHMs and HAA5s regulatory
MCLs as established by the EPA are delineated at the LRAA and set at 80 parts per billion (ppb)
and 60 ppb, respectively (EPA, 2006). Bromate, a regulated DBP that can result from the use of
advanced oxidation processes such as ozone, is regulated by EPA at the MCL of 10 ppb.
There are many options that utilities can consider when addressing methods that can lower or
eliminate DBPs from forming in water distribution systems that may include (but are not limited
to) treatment for the removal of precursors such as TOC and bromide, use of alternative
disinfectants, and removal of DBPs after being formed in the disinfection process. For example,
TOC can be removed from groundwater supplies using granular activated carbon (GAC), anion
exchange, and membrane processes (Wood and DeMarco, 1979; Schaefer et al., 2020; Escobar et
al., 2000). . Zhang et. al (2015) also observed that bromide can be removed from drinking water
through implementation of granular activated carbon (GAC) in both pilot and bench scale
experiments. Krasner et al. (2006) showed that use of alternative disinfectants such as ozone,
chlorine dioxide and chloramines can control formation of DBPs in groundwater supplies. The
efforts described in this thesis are primarily concerned with research that was performed to
evaluate alternative treatment(s) that could be employed by groundwater purveyors to better
manage their efforts to comply with the Stage 2 D/DBPR requirements.
The University of Central Florida (UCF) is located near Orlando in western Orange County,
Florida. The University owns and operates its own water treatment and distribution system on
campus through its Utilities and Energy Services department (referred to as Utility); the water
Page 22
4
system is in general comprised of four ground water wells, one 120,000 gallon ground water
storage tank (GST) with tray aeration and recirculation appurtenances, and an elevated 200,000
gallon water tower. The Utility distributes water throughout campus to serve its faculty, staff and
students.
The Utility has in recent times faced challenges in complying with the requirements set forth by
the Stage 2 DBPR. In 2018, the Utility began exploring methods to reduce the formation potential
for DBPs within their distribution system internally with their operations staff as well as with the
assistance of UCF’s Environmental Systems Engineering Institute (ESEI) that aided in preliminary
examinations of the existing treatment and distribution procedures and management methods.
Projects piloted by the ESEI included implementation of enhancements to the existing tray aerators
by modification with spray nozzles and GST recirculation, and the assessment of GAC filtration.
Based on the results of the Utility and ESEI studies, it was concluded that a change in the chlorine
dosing location and implementation of recirculation piping in the GST would reduce DBPs (UCF
ESEI, 2019a). In addition, installation of auto-flushers also remediated DBP formation potentials
within the distribution system. These actions were presented at the Florida Section American
Water Works Association’s conference held at Champions Gate, Florida in 2019 (Shukla and
Duranceau, 2019).
Currently, UCF is master planning for future potable water systems to be installed onto the campus
within the next 10-years. Based in part on the prior efforts of the Utility and ESEI, it was
determined that it would be beneficial to pilot ozone and GAC filtration, which was an expanded
concept to the prior stand-alone GAC study already completed. The research presented in this
thesis was performed between the fall of 2020 and carried into the spring of 2021, and consisted
of exploring the removal efficiency of DBP precursors and further reduction in DBP formation
Page 23
5
from a stand-alone ozone process in addition to an integrated ozone-GAC treatment process at the
UCF on-campus water treatment plant (WTP). The document will provide information to explain
DBP formation as well as formation potentials for TTHMs, HAA5s and organic precursor analysis
through the monitoring of dissolved organic carbon (DOC), the absorbance of ultra-violet light at
a wavelength of 254-nm (UV254), specific ultra-violet absorbance (SUVA), and pilot-scale process
operations data.
Page 24
6
CHAPTER 2. LITERATURE REVIEW
Disinfection By-Product Regulation
On November 29, 1979, the EPA promulgated an amendment to the National Interim Primary
Drinking Water Regulations (NIPDWR) to control THMs in drinking water (Federal Register,
1979; EPA, 1979). This rule set an interim MCL for TTHMs, defined as the sum of four
trihalomethanes, of 0.10 mg/L for community water systems (CWS) serving 10,000 or more
people and using a chlorine-based disinfectant. The Stage 1 Disinfectants and Disinfection
Byproducts Rule of 1998 (EPA, 1998) reduced the MCL for TTHM to 0.080 mg/L, added MCLs
for the sum of five haloacetic acids (HAA5) of 0.060 mg/L, bromate of 0.010 mg/L and chlorite
of 1.0 mg/L, and increased the scope of the rule to cover all CWS that disinfect water. Currently
the SDWA standards exist for two classes of halogenated organic DBPs, trihalomethanes (THM)
and haloacetic acids (HAA), and for two inorganic compounds, bromate and chlorite (EPA, 2007).
Additionally, measures based on these contaminants are used to reduce human exposure to DBPs
in publicly provided drinking water systems that are encouraged to enhance source water quality,
provide infrastructure improvements or other interventions to reduce DBP exposure of consumers
in the distribution system.
In 1974, a chemist by the name of J.J. Rook discovered in Rotterdam that post-chlorinated drinking
water supplies containing concentrations of NOM higher than 150 ppb were prone to producing
halogenated trihalomethanes (Rook, 1974). It is now commonly accepted that DBPs are formed
when disinfectants used to inactivate microbial contaminants in water react with materials,
primarily organic matter, in the water (Bellar et al. 1974; Rook, 1974; Cedergren et al., 2002; Sadiq
and Rodriguez, 2004). Several hundred DBPs in over a dozen chemical classes have been
Page 25
7
identified (Woo et al., 2002; Krasner et al., 2006; Richardson et al., 2002). Most commonly, DBPs
form when chlorine reacts with naturally occurring organic matter in the source water. The
halogens detected included chloroform, bromodichloromethane (BDCM), dibromochloromethane
(DBCM) and bromoform, and now are commonly referred to as the four THM species (Rook,
1974). The discovery of halogenated species in chlorinated surficial and groundwater supplies,
and the following reports on their potential carcinogenic properties, provided cause for concern in
many governments. Rook’s discovery of THMs in drinking water led to research on other
chemicals formed when chlorine is added to water, and to the health effects of these chemicals.
Richardson (2002) identified greater than 600 water disinfection by-products in chlorinated tap
water, including haloacetic acids (HAAs). DBP levels are spatially and temporally labile within a
distribution system (Rodriguez et al., 2004b). THM levels increase with time after disinfection and
therefore with distance from the treatment plant (Chen and Weisel, 1998; Rodriguez and Sérodes,
2001). HAA levels may increase or decrease (Chen and Weisel, 1998; Rodriguez et al., 2004b),
depending upon distribution system conditions. Rechlorination at booster stations in the
distribution system further increases DBP levels.
On December 16th, 1998, the Stage 1 DBP Rule (DBPR) later established maximum residual
disinfectant level goals (MRDLGs) for disinfectants and MCLs for four THMs, two HAAs,
chlorite and bromate, in addition to mandates by the EPA for the monitoring, reporting and public
notification of the previously stated compounds (EPA, 1998). MRDLGs are not enforceable by
law, and act as goals for water purveyors to achieve. Chlorite appears in drinking water when
chlorine dioxide is added to the water supply as a disinfectant, and levels can range from 3.2 to 7.0
mg/l depending on the dose of the disinfectant (Michael et al., 1981). Bromate may appear in a
drinking water system if the supply contains an elevated concentration of bromide and a strong
Page 26
8
oxidizer, such as ozone, is used in the purification process. Because of these operational
requirements, potable water purveyors are only required to report chlorite and bromate if the
application of ozone or chlorine dioxide as disinfectants are included in the treatment system.
Changes to the MCLGs and MCLs poised in the Stage 1 DBPR were then made with the addition
of the Stage 2 DBPR, which was promogulated on January 4, 2006. The new rule aimed to
strengthen the reporting and monitoring requirements for DBPs by reducing the peak and average
levels of DBPs in drinking water systems (EPA, 2003). This was accomplished through the
alteration of the calculations made in determining the compliance of a system from a total system
overview to a locational-centric overview, which is more efficient as a ‘warning signal’ for areas
prone to higher formations of DBPs in PWSs (EPA, 2003). The Stage 2 DBPR also included
regulation for HAA5s, altering the MCLG for monochloroacetic acid and trichloroacetic acid to
0.07 and 0.20 mg/l, respectively (EPA, 2003). Table 2 displays the MCLs and MCLGs for DBPs
outlined in the Stage 1 and Stage 2 DBPR.
Table 2-1: MCLs and MCLGs for DBPs per the Stage 2 DBPR
Regulated DBP Stage 1 DBPR Stage 2 DBP
MCL (mg/l) MCLG (mg/l) MCL (mg/l) MCLG (mg/l)
TTHM 0.080 0.080
Chloroform - 0.07
Dibromodichloromethane Zero Zero
Dibromochloromethane 0.06 0.06
Bromoform Zero Zero
HAA5 0.060 0.060
Monochloroacetic Acid - 0.07
Dichloroacetic Acid Zero Zero
Trichloroacetic Acid 0.3 0.2
Bromoacetic Acid - -
Dibromoacetic Acid - -
Bromate 0.010 Zero 0.010 Zero
Chlorite 1.0 0.8 1.0 0.8
Page 27
9
Disinfection By-Product Links to Health Effects
The classifications of possible human carcinogens come from data that is extrapolated from
research on animals that may or may not be relevant to human cancer. DBCM and bromoform are
not classifiable, indicating there is no evidence supporting these two compounds as carcinogens,
but there is not enough research to classify them as non-carcinogenic (World Health Organization
1993). There is inadequate epidemiological evidence of carcinogenicity in humans for the four
compounds. However, in 1991, 1999, and again in 2004, the International Agency for Research
on Cancer (IARC) evaluated the evidence of the human carcinogenicity of chlorinated water as
well as the by-products it produces (IARC, 2004). Although the extent of the data provided the
International Agency for Research on Cancer with insufficient evidence to classify the by-products
as carcinogenic, the research served as an impetus for the US Environmental Protection Agency
to establish maximum contaminant level goals for several of the by-products, including total
TTHM and five HAAs (EPA, 1998).
Disinfectants such as chlorine, chlorine dioxide (ClO2), and ozone act as strong oxidizers to
reactive NOM. Through chemical reactions driven by optimal pH, temperature and contact time,
the oxidative properties of post-disinfected waters react with readily available precursors, namely
NOM and bromide, to form DBPs; some of which are considered potentially carcinogenic
(Chaukura, et al., 2020). The chronic exposure of such DBPs have been linked to higher rates of
cancer, neurological disorders, and maternal disadvantages (Nieuwenhuijsen, 2000). Chlorinated
THMs are also suspected to induce weight gain and reduce the reproductive and survival rates of
offspring of male and female rat populations (Morris et al., 1995). Links between chlorinated
THMs and teratogenicity have not been found, however increased doses of such compounds have
been related to lower embryo weights and decreases in the survival rate in rate populations
Page 28
10
(Ruddick et al., 1983). Smith et al. (1992) discovered that feeding rats DCAA and TCAA, yielded
the development of neural tube and craniofacial defects.
Water Quality Considerations
The formation of DBPs in potable water is influenced by natural and anthropogenic factors. Such
factors that attribute to DBP formation in potable water include temperature, pH, disinfectant
application, sulfide, bromide and NOM.
Disinfection Conditions
The influence on DBP formation by disinfection processes can vary spatially and temporally and
are influenced by temperature, pH, and disinfectant application (Clark and Sivaganesan., 1998).
In post-chlorinated waters, DBP formations have been observed to increase with increasing pH
and temperature (Hua and Reckhow, 2008; Huang et al, 2019). Additionally, the retention time,
dose and residual of reactive disinfectants such as ozone and chlorine with water have also been
observed to impact DBP formation (Liang and Singer, 2003). Liang and Singer (2003) investigated
the relationship between TTHM and HAA5 formation for various disinfectant parameters (such as
chlorine retention time and residual) and observed that TTHM and HAA5 formation
predominantly occurs within the first hours of disinfectant retention, however as the concentration
of disinfectant decreases, the formation also decreases (Liang and Singer, 2003).
Sulfide
Natural sources of dissolved sulfide typically found in the form of hydrogen sulfide (H2S) in
groundwater supplies are derived from the biogenic reduction of dissolved sulfate by aquatic
bacteria and through the decomposition of buried organic matter (Rye et al., 1981). Sulfide can
Page 29
11
occur in both gaseous and aqueous forms, and such removal of H2S from a water supply is critical
as the contaminant can increase the corrosivity and negatively impact the palatability of potable
water (Duranceau et al., 2010). Additionally, the oxidization of sulfide can also influence the
turbidity and color of the treated water (Lyn and Taylor, 1992). Existing methods used in Central
Florida to remove sulfide from water supplies have included chlorination and aeration. Such
treatment processes include the application of strong oxidizers, anion exchange and GAC filtration
(Duranceau et al., 2010).
In groundwater, sulfide can occur in three states: H2S, bisulfide (HS-) and elemental sulfide (S0);
sulfide (S2-) exists at pH above 12 and is typically not applicable to normal water supplies. The
sum of the three states of sulfide is referred to as total sulfide, often reported in mg/l as S2-. Natural
sources of groundwater in Central Florida typically occur at neutral pH, so the main fraction of
total sulfide removed from the water is in the form of H2S (Duranceau et al., 2010). Aeration has
been used as an effective technology for the removal of hydrogen sulfide. As such, only a portion
of total sulfide can be removed through existing treatment processes. In addition, sulfide can
reduce strong oxidizers used in drinking water treatment processes. For example, implementation
of an ozonation process may be negatively impacted by the dissolved sulfide content, as an increase
in the required ozone dose needed to overcome the chemical demand provided by excess sulfide
can increase capital costs incurred by the generation of ozone. The chemical demand equation for
the reactions of sulfide and ozone are included in Equation 2.1. Per stoichiometry, 4.0 moles of
ozone are required to produced 1.0 mole of sulfate (SO4), however in practice the demand is
typically 2.4 mole of ozone per 1.0 mole of SO4 produced. This delineation from chemical
formulation occurs because the applied ozone will decay back into oxygen during treatment, which
will also react with sulfide to form sulfate and lower the chemical demand of the water.
Page 30
12
𝑆−2 + 4𝑂3 + 4𝐻2𝑂 → 𝑆𝑂4−2 + 4𝑂2 (2.1)
The rate of sulfide oxidation depends on pH and temperature; therefore, the kinetics of sulfide
oxidation is locational specific. Additionally, chlorination of sulfide laden waters containing a pH
value higher than 3.8 has been observed to produce sulfur turbidity depending on the free chlorine
to total sulfide molar ratio, which will further react with free chlorine resulting in an increase to
the required chlorine dose and a possible increase to DBP formation (Lyn and Taylor, 1992).
Bromide
If concentrations of bromide in a PWS increase above 0.1 mg/l of bromide is detected in a potable
water supply, concern for the implications of brominated DBPs on the health of public consumers
must be carefully investigated (Sohn, 2006). Bromide can act in a similar capacity as NOM in
serving as a DBP precursor, and under certain conditions form dangerous carcinogens. Bromide
can originate in a groundwater supply through saltwater intrusion and previous geological
formations (Salameh et al., 2016). Najm and Krasner (1995) studied the effects of bromide and
NOM on the production of bromate and cyanogen bromide and found that the effects of bromide
were much more significant in DBP formation when compared to those formed from DOC (Najm
and Krasner, 1995). Consumption of brominated DBPs also carries a higher risk of negatively
impacting human health as compared to chlorinated DBPs, so reduction of the compounds is often
targeted in treatment. Direct reduction of bromate can be achieved through pH balance, addition
of ammonia (Gunten, 2003), GAC filtration (Siddiqui et al., 1996) and addition of hydrogen
peroxide (H2O2) (Kruithof et al., 1993). However, the adsorption capacity of GAC for bromate
may be significantly lowered if concentrations of chloride or sulfate are present (Mills et al., 1996).
Page 31
13
Natural Organic Matter
Natural organic matter (NOM) can impact color of the water feeding the distribution system,
contribute to DBP formation and can cause a reduction in dissolved oxygen in the system
(Bhatnagar and Sillanpää, 2017). NOM has also been observed to decrease the treatment efficiency
of oxidants in processes that employ ozone and chlorine dioxide (Owen et al., 1993). Sources of
NOM in a water supply are derived from interactions between the hydrologic cycle, lithosphere,
and biosphere (Bhatnagar and Sillanpää, 2017). NOM originating from terrestrial sources is
typically composed of hydrophobic compounds, while NOM from aquatic environments (typically
deriving from algae) is comprised of hydrophilic compounds (Tak and Vellanki, 2018). As such,
the characteristics of NOM will vary based on the majority fraction of NOM in a water supply,
resulting in a difference in treatment capacity between select processes depending on the fraction
of NOM present (Nkambule et al., 2012).
The fractionation of NOM can be generalized into hydrophobic (humic) and hydrophilic (non-
humic) compounds (Tak and Vellanki, 2018). The hydrophilic portion of NOM consists of
carbohydrates and proteins, which are of less interest when studying DBPs as they hold less of an
impact on their formation (Sillanpää, 2015). However, the hydrophilic portion of NOM does
support bacterial growth within a PWS (Karnik et al., 2005). In contrast, the hydrophobic fraction
of NOM dominates a major portion of aquatic dissolved organic carbon (DOC) and includes humic
and fulvic acids (Owen et al., 1995). These acids are aromatic in structure and are sourced from
decayed plants that are resistant to biodegradation but have a high reactivity to chlorine. In
addition, hydrophobic fractions of NOM are prone to producing DBPs (Aiken et al., 1992),
however little research has been conducted on the correlation between specific NOM fractionation
and DBP formation (Kim and Yu, 2005).
Page 32
14
Methods to detect and identify aquatic NOM include the analysis for total organic carbon (TOC),
dissolved organic carbon (DOC), ultraviolet light absorbance at a wavelength of 254-nm (UV254),
fluorescence spectroscopy and assimilable organic carbon (AOC). The EPA assesses NOM type
and concentration through analysis of surrogate properties associated with TOC, often reported as
concentrations of DOC and UV254 absorbance (EPA, 2012). Both DOC and UV254 require samples
to be filtered through a 0.45 µm filter before measurement can be taken, since both measurements
focus on the dissolved fractions of organic matter and suspended media will impact the results.
Resulting DOC and UVA254 of a water supply can also be interpreted as the specific UV
absorbance (SUVA), which can be used to identify the aromaticity and hydrophobicity of organic
carbon along with its TTHM formation potential (EPA 2012). Calculation of SUVA is completed
through use of Equation 2.2 and interpretation of SUVA values, as provided by the EPA, can be
investigated using Table 2-2 (EPA, 2012).
𝑆𝑈𝑉𝐴 =𝑈𝑉𝐴254(𝑐𝑚−1)∗100
𝐷𝑂𝐶 (𝑚𝑔
𝑙)
(2.2)
Table 2-2: SUVA Relation to UVA254 Absorbance and TTHM Formation Potential
SUVA Value, cm-1/(mg/l) Matter Fraction UVA254 Abs. TTHM FP
x < 2 Hydrophobic non-humic matter Low Low
2 < x < 4 Hydrophobic non-humic and humic matter Medium High
x > 4 Hydrophobic aromatic humic matter High High
Source: EPA, 2012
The understanding of aquatic NOM fractionation in water supplies has been researched
extensively (Abbt-Braun et al., 2004; Thurman, 1985) and a relatively simple method to its
detection includes fluorescence spectroscopy, which can articulate the functional groupings of
Page 33
15
organic molecules (Baghoth et al., 2011). Hudson et al. (2007) investigated the behavior of NOM
through a review of fluorescence completed on waste, marine and freshwaters (Hudson et al.,
2007). Results indicate that fluorescence spectroscopy, primarily excitation emission matrices
(EEMs), have potential for a wide application in studies requiring rapid water quality testing
(Hudson et al., 2007). EEMs are a three-dimensional spectroscopy method than can be used to
characterize aquatic NOM to identify substances that mirror the behaviors of humic matter and
proteins (Baghoth et al., 2011). This method of identification can be accomplished through
analysis on peaks produced from the resulting EEMs using parallel factor analysis, which has a
higher predictability of NOM fractions than UVA254 (Baghoth et al., 2011). Analysis on EEMs
can lead to the understanding of NOM through observations on its five regions of interests, of
which can be observed in Figure 2-2.
Figure 2-1: Excitation-Emission Matrix Regions for Organic Species
Page 34
16
Alternative Methods to Reduce DBP Precursors
Prior research has sought to reduce the formations of chlorinated DBPs, which can be achieved
through the reduction of constituents that act as DBP precursors in aquatic environments. Rook
(1976) utilized a conventional treatment, carbon adsorption and ozonation train to investigate the
removal of organic precursors. Samples dosed with 8 mg/L O3 for two minutes prior to chlorination
produced 50% fewer halogens compared to samples that were not ozonated (Rook, 1976).
However, samples that were dosed with 2 mg/L O3 were observed to harbor a lower efficiency in
halogen reduction (Rook, 1976). This would suggest that ozone can reduce the formation potential
of halogens at high doses, however the process may require additional processes downstream to
assist in further treatment of organic precursors, such as coagulation or GAC filtration if using
decreased ozone doses. Water purveyors must compare capital and operational costs of elevated
doses of ozone (as production is historically expensive) with decreased ozone in conjunction with
downstream treatment.
Treatment processes to remove DBP precursors from source waters include convention treatment
methods, ozonation, adsorption and membrane filtration. Treatments investigated in this work
include oxidation through ozonation and adsorption through GAC and BAC. The installation of
such units and operations set forth to conform with regulation posted by government agencies,
with goals to improve water quality and protect public health.
Ozone
Ozone is a strong oxidizer that has the capacity to alter NOM into a more biodegradable form of
organic media, which is often reported as assimilable organic carbon (AOC). The relationship
between the rate of NOM alteration and biodegradation has been observed to increase with ozone
Page 35
17
dose (Huang and Chen, 2004). Research on the interactions between the application of ozone on
source waters of different qualities were investigated by Park et al. (2000), who concluded that
ozonation was effective in AOC removal. Ozonation is predominantly used in Europe as a
disinfectant, as salt reserves that are required to produce the disinfecting chemical chlorine are less
available. The production of ozone on-site is required if ozonation is to be included within a system
process. As the process can be energy intensive, it may accrue high operation and maintenance
(O&M) costs. This may become problematic if the required ozone dose is high, as additional
voltage would be required to sustain the elevated dose.
Drinking water applications for ozone in the United States began in the early 1900’s, where its
capabilities in removing unpalatable characteristics of water afflicting its taste, odor and color were
used (Rice, 1999). Reports from the U.S War Departments Surgeon General dictate that the U.S.
military researched the practicality of ozonation during wartime in 1909 at Fort Niagara, NY (Loeb
et al., 2012). Soon after, the US military abandoned the idea for ozone as an alternative to chlorine
and iodine, as ozonation was costly and required a constant source of electricity (Loeb, 2012). In
parallel, various drinking water plants around the Great Lakes region championed processes
including ozonation for taste and odor control. Ozonation processes in the region were soon
replaced as the capabilities of ozone from an engineering aspect had not yet caught up to the
advancements in ozonation science and would not be reintroduced in the United States until 1940
where an ozone process was installed for taste and odor control in Whiting, ID (Loeb, 2012).
In 1986, promulgation of the SDWA adopted the CT principle to modern drinking water treatment
processes which mandated that treated waters must undergo required levels of disinfection in terms
of contact time and concentration of disinfectant for the inactivation of microorganisms. The
disinfectant properties of ozone warrant the compound a low CT, as ozone requires both a low
Page 36
18
dose and contact time to operate as compared to other disinfectants. In the 21st century, ozonation
in the United States is primarily used as a pre-treatment method for raw water transmission lines
to protect the pipelines from biological growth and to increase the performance of conventional
treatments such as coagulation or GAC filtration.
Ozone is usually generated via photochemistry, electrolysis, or corona discharge (Silva and Jardim,
2006). When ozone is produced through corona discharge, concentrated oxygen is produced from
ambient air and flowed through an electric discharge that converts the stream into ozone (Espei et
al., 2001). The reactions between the electrode and oxygen to produce ozone is found in Equation
2.4, Equation 2.5, Equation 2.6, and Equation 2.7.
𝑂2 + 𝑒− → 𝑂 + 𝑂 + 𝑒− (2.3)
𝑂2 + 𝑒− → 𝑂2∗ + 𝑒− (2.4)
𝑂 + 𝑂2 + 𝑀 → 𝑂3 + 𝑀 (2.5)
𝑂2∗ + 𝑂2 → 𝑂3 + 𝑂 (2.6)
As the electric discharge bombardes the oxygen molecules (O2) with electrons, the oxygen
becomes excited (O2*) and free oxygen molecules (O) are produced, as displayed in Equation 2.3
and Equation 2.4. Ozone is then generated from the reactions between the O, O2 and a catalyst
(M), as seen in Equation 2.5, and the reactions between O2* and O2, as displayed in Equation 2.6.
Ozone will also degrade back into O2, and the relationship has been observed to increase with
increasing temperature (Espei et al., 2001). Ozone is then contacted with a flow, typically in a
vacuum produced by the liquid upon the point of gaseous injection and made aqueous. The
solubility of ozone during this exchange can be completed through mathematical quantification
Page 37
19
and application of diffusivity laws. As a general guideline, the solubility of ozone follows Henry’s
Law, as seen in Equation 2.7.
𝑌 = 𝐻 ∗ 𝑋 (2.7)
Where, Y is the pressure of substance over the fluid in atmospheres (atm), X is the molar fraction
of the gaseous solute in liters per mole (l/mol) and H is the Henry’s constant in atmospheres per
liters per moles (atm/l/mol).
The solubility of ozone can also be calculated through the Bunsen Adsorption Coefficient, which
is displayed in Eq. 2.9.
𝐶𝑠 = 𝛽 ∗ 𝑀 ∗ 𝑃 (2-8)
Where, Cs is equal to the concentration of dissolved gas (Pa*kg/m3), B is the Bunsen adsorption
coefficient (unitless), M is the density of the gaseous solute (kg/m3) and P is the partial pressure
in Pascals.
Analytical models that estimate the solubility of ozone in liquid solvents also include Regular
Solution theory (Scovazzo et. al, 2004), the Soave-Redlich-Kwong model (Li et al., 2001) and
Scaled Particle theory (Mandell and Reiss, 1975). Ionic strength, temperature, pH, ozone partial
pressure, gas flow rate and liquid flow rates also influence the level of ozone solubility, as shown
in Table 2.3.
Page 38
20
Table 2-3: Influence of Parameters on Ozone Solubility
Parameter Influence on Ozone Solubility
Ambient Air Ozone Concentration Increases with increasing
ambient ozone concentration.
pH Increases with decreasing
solvent pH.
Air Pressure Increases with increasing air
pressure.
Water Temperature Increases with decreased solvent
temperature.
Air Temperature Increases with decreasing air
temperature.
UV Light Increases with excess UV light.
Number of Solutes Increases with a decrease in
concentration solutes.
The solubility, or mass transfer, of ozone from a gas to a liquid state can be modeled through its
three stages of diffusivity: (1) Diffusion of ozone across a gas/liquid phase, (2) Dissolving of ozone
into a liquid, (3) Diffusion of ozone into a liquid and the process of mass transfer can be viewed
in Figure 2.3 (Berry et al., 2017). Diffusion from a gas to a liquid is determined by physical
properties, mechanical turbulence, and difference in concentrations across the transfer surface. The
use of non-porous polymetric membranes as contactors for ozonation processes have been
observed to increase the mass transfer efficiency as membranes can increase the surface area per
volume of the design; therefore, increasing the gas flow and liquid volumes allowed for the effluent
gas stream to be recycled back into the system process (Berry et al., 2017). Mass transfer efficiency
is an important parameter when calculating the applied dose of an ozone system. To further discern
Page 39
21
the feasibility of an ozone process, parameters such as applied dose of ozone and understanding of
ozone kinetics after its application are required. The applied ozone dose equation is shown in
Equation 2.9.
𝐴𝑂𝐷𝑔
ℎ=
𝑂𝐷 (𝑔
𝑙)
𝑂𝑇𝐸 (%)∗𝑄 (𝑙
ℎ)
(2.9)
Where, AOD is the actual ozone dose in grams per hour (g/h), OD is the ozone demand in grams
per liter (g/l), OTE is the ozone transfer efficiency in percent (%) and Q is the liquid flow of the
process in liters per hour (l/h).
The determination of an applied dose of ozone can also be completed through stoichiometric
evaluation, which requires knowledge of the reducing agents and the resulting residual
concentration of ozone. Such chemically oxidized demand (COD) equations are included in
Equation 2.10 and Equation 2.11. The ozone demand of sulfide (as HS- and H2S) and iron are
reported to be as low as 2.4 moles of ozone per mole of sulfate formed and one mole of ozone per
two moles of oxidized iron formed.
2𝐹𝑒+2 + 𝑂3 + 𝐻2𝑂 → 2𝐹𝑒3 + 𝑂2 + 2𝑂𝐻− (2.10)
𝑆−2 + 4𝑂3 + 4𝐻2𝑂 → 𝑆𝑂4−2 + 4𝑂2 (2.11)
Iron may complex with organics (namely humic acids) in a supply and thus require higher amounts
of oxidants and longer contact times to completely precipitate (Reckhow et al., 1991). Portions of
NOM from a groundwater supply react differently when oxidized by ozone, which causes the
resulting formations of DBPs to vary (Molnar, et. al, 2012). Complete oxidation of NOM into
carbon dioxide (CO2) is typically not encouraged as sufficient ozonation of NOM can be achieved
before the NOM has been mineralized (Hoigné, 1998). Win et. al (2000) researched the
interactions between ozone and NOM from a brown water lake supply and observed that
Page 40
22
biodegradability of the NOM improved with an increased oxidation intensity (Win et al., 2000).
However, in samples that were “mildly” oxidized (i.e. 5-min ozone contact time), the
biodegradability was unaffected (Win et al., 2000).
Ozonation prior to biological filtration of source waters containing favorable pH, DOC and
temperature has also been observed to increase microbiological activity in conventional filters,
enhancing the level of biodegradability of DOC (EPA, 1999). When NOM is degraded, its apparent
molar size is reduced, generally with the formation of carboxylic acids, which improves its
removal efficiency through processes that are designed downstream of ozone such as GAC
filtration or conventional treatment. Additionally, an increase in the HAA concentration due to
presence of hydrophilic NOM has also been observed (Chowdhury et al., 2008). Epoxides, organic
peroxides and aldehydes are also formed from ozonation processes (Can and Gurol, 2003). The
mechanisms for aldehyde production post-ozonation are not well understood, however such
production has been found to be dependent on pH, ozone dosage, NOM fractionation and alkalinity
(Can and Gurol, 2003). Very few studies have focused on the impacts of ozone dose and retention
time when studying the formation of aldehydes, namely formaldehyde, and a better understanding
of aldehydes may assist in the reduction of such species when ozonation is installed into potable
water systems.
Granular Activated Carbon
Removal of contaminants through use of commercial adsorbents can be an efficient and cost-
effective means of potable water treatment (Iriarte-Velasco et al., 2008). Adsorption is the
accumulation of mass onto a surface and include interactions between the adsorbate (constituent)
and adsorbent (carbon). Bromate, bromide, NOM, chlorine, and other compounds that impact the
taste and odor have shown to be successfully removed using activated carbon (Zhang et al., 2014;
Page 41
23
Matilainen et al., 2010; Kim and Kang, 2008; Duranceau et al., 2010). The removal of NOM also
reduces the formation potential for DBPs, so the option is often pursued when DBP reduction is
targetted (Rook, 1976). In 1786, Scheele was the first to observe the abilities of charcoal as an
adsorbent in a liquid-phase (Sontheimer et al., 1988). Soon after Scheele’s discovery, Lowitz
determined that charcoal could also improve the palatability of water (Sontheimer et al., 1988).
However, it would not be until the nineteenth century where the Swedish chemist Von Ostreijko
commercialized activated carbon with two patents in 1900 and 1901, which covered the
development of activated carbon using carbon dioxide and metal chlorides (Sontheimer et al.,
1988).
Currently, there are numerous corporations that hold patents regarding the manufacturing and
design of activated carbon. Activated carbon can be categorized as pelletized carbon, granular
activated carbon (GAC), powdered activated carbon, coconut shell, lignite coal, wood, and
bituminous coal. Using these ingredients, corporations have also engineered activated carbon
product lines that have been observed to effectively treat potable water (Marais and Ncube, 2018).
Companies such as Calgon Carbon (Calgon) have designed different carbon types that are used
worldwide in potable water treatment. Commercial lines of activated carbon designed and
marketed by Calgon include the Filtrasorb, OLC, Centaur and HPC series. During the design of a
GAC process, it is recommended that multiple carbon types be piloted to determine the best fit
caron type for the existing water source. This would be determined through the analysis on the
breakthrough of constituent (namely NOM) and eventual exhaustion of carbon after extended use.
Exhaustion of carbon would be concluded when the effluent concentration of constituent equaled
that of the influent concentration of constituent.
Page 42
24
The selection and capacity of adsorptive media can vary by the quality of raw water and level of
pretreatment before the process (Babi et al., 2007). Factors that inhibit GAC adsorptive capacity
include loss of adsorptive sites due to residence of other contaminants, biological growth, pH,
temperature, and adsorptive kinetics including the hydraulic loading rate and carbon size (Speth
and Miltner, 1998). There is a direct relationship between the size of the contaminant and the
propensity for van der Waals forces to contribute to the adsorption potential of a particle
(Sontheimer et al., 1988). Van der Waals originate from the electrostatic interactions between
molecules that do not attract. As such, the surface chemistry of the absorbent is integral in
providing a sufficient adsorptive surface and thus effective removal.
Additional methodologies used to study the properties of engineered carbon types include pH of
point of zero charge, total HCl and NaOH uptake, and elemental analysis using inductively coupled
plasma atomic emission spectroscopy (Cheng, Dastgheib and Karanfil, 2005). Designing for the
applications of absorbents in real-world situations can also be determined through chemical
breakthrough studies, where columns of carbon adsorbents in bench and pilot settings are subject
a flow, typically from a natural water source, and its contaminant removal efficiency is monitored
over the piloting period. Breakthrough of the carbon columns is measured through the amount of
contaminant exiting the absorbent as compared to the concentration of the contaminant entering
the adsorbent. The equation for the measurement of breakthrough is included in Equation 2.12. As
the duration of column piloting proceeds, it is expected that the removal capacity of the adsorbent
will decrease. This interaction has been studied by multiple researchers with goals of
understanding GAC reduction of NOM, DOC, TTHM and HAA5 for design and scaling purposes
(Kim and Kang, 2008; Dastgheib et al., 2004).
Page 43
25
𝐵𝑟𝑒𝑎𝑘𝑡ℎ𝑟𝑜𝑢𝑔ℎ =𝐶
𝐶𝑜
(2.12)
Where, C is the concentration of the contaminant in the effluent (mg/l) and C0 is the concentration
of the contaminant entering the adsorbent system.
In 1976, Rook sought to understand the reduction of organic precursors in chlorinated waters
through GAC filtration to reduce DBP formation. Rook observed that throughout the lifetime of
the adsorptive process, the GAC remained to be effective in reducing larger chlorinated molecules
from the effluent stream and further reduce the formations of halogenated species (Rook, 1976).
Dastgheib et al. (2004) researched the removal of DOC by GAC filtration that had been enhanced
with high-temperature helium, ammonia, and iron-impregnation treatments of coal-based and
wood-based carbon types. After altering the surface chemistry of the adsorbents, an increase in
DOC removal of water sourced from Myrtle Beach, SC was observed (Dastgheib et al., 2004).
Integrated Treatment
The combination of an ozonation and GAC treatment process has found much use in areas where
requirements preventing their individual uses prevents such cases from occurring. Ozonation is
effective at degradation certain organics, such as humic substances, however it also proves to be
in-effective treating non-humic substances. If left untreated, these compounds can then continue
to form DBPs within a distribution system if further treatment is not present. GAC can also
efficiently remove NOM from a supply, however if the carbon exhausts quickly, then the user may
incur high costs associated with carbon replacements (Lou et al., 2014). Huang and Chen (2004)
assessed the effectiveness of ozone and GAC treatment on removing AOC from groundwater
localized in Sha-Lu, China, and a correlation was observed between ozonation followed by GAC
filtration and a resulting high removal capacity for AOC. Chang et al. (2002) also assessed an
Page 44
26
integrated ozone and GAC treatment process to determine the impact of ozone dosage on the
subsequent GAC adsorption capacity and determined that the adsorption capacity for humic acids
were improved at elevated doses up to 6.0 mg/l O3. However, the increase in solubility after
ozonation resulted in a decrease in affinity of the organics with GAC, resulting in rapid
breakthrough to occur.
In this work, an integrated ozone-GAC pilot was evaluated to reduce DBP precursors and
subsequent DBP formation potential in the distribution phase of potable water treatment. The pilot
was operated in a stand-alone ozonation process, which oxidized NOM at various concentrations
of ozone, and an integrated ozone-GAC process which operated at a minimal residual of ozone
and enlisted GAC adsorption through two carbon pilot columns in parallel.
Page 45
27
CHAPTER 3. EXISTING CONDITIONS
The information presented in this chapter reviews the existing conditions of the UCF groundwater
wells and distribution system as well as describe prior research completed by the UCF Utility and
ESEI to control DBP formation. The on-campus WTP serves a main campus comprised of 43,103
full-time equivalent population, in addition to one facility off campus that holds 1,000 people when
fully staffed, providing a total population served as 44,103. UCF is the largest university by
enrollment in Florida and one of the largest universities in the nation. UCF distributes
approximately 300 million gallons of potable water per year to approximately the students, faculty,
and staff that attend the university for work and study. The PWS is composed of four groundwater
wells, a 120,000 gallon GST fitted with tray aerators for hydrogen sulfide and carbon dioxide
removal, a 200,000 gallon elevated storage tank (EST), and the ability to add bleach for
disinfection downstream of the tray aerators. A schematic of UCF’s treatment process is presented
in Figure 3-1 and the location of the UCF campus and WTP site are included in Figure 3-2.
Figure 3-1: Existing UCF WTP Process Schematic
Page 46
28
Figure 3-2: Locations of the UCF Orlando Campus (boxed in gold), WTP (circled in yellow) and Well Field (boxed in green)
Page 47
29
Existing Groundwater Conditions
Prior analysis on the UCF groundwater supply to determine its characteristics and quality were
completed prior to the research here-in by UCF ESEI, the results of which are included in Table
3-1 and Table 3-2.
Table 3-1: Water Quality from UCF Groundwater Supplies (Sampled 7/16/2020)
Parameter Well 1 Well 2 Well 3 Well 4
pH 7.7 7.5 7.5 7.7
Temperature (°C) 24 24 24 25
Conductivity (mS/cm) 360 1150 1240 480
Total Dissolved Solids (mg/L) 260 810 880 350
Turbidity (NTU) 0.14 0.56 0.17 0.26
Total Sulfide (mg/L) 1.3 0.84 0.87 1.90
UV-254 (cm-1) 0.073 0.084 0.084 0.068
DOC (mg/L) 2.4 2.7 2.7 2.3
SUVA (L/mg/m) 3.1 3.1 3.1 3.0
Page 48
30
Table 3-2: Inorganic Water Quality from UCF Wells 3 and 4 (Sampled 1/22/2019)
Parameter Well 3 Well 4
Aluminum (mg/l) < 0.005 < 0.005
Sulfate (mg/l) 2.9 3.9
Bromide (mg/l) < 0.005 < 0.005
Fluoride (mg/l) 0.26 0.48
Chloride (mg/l) 10 10
Phosphate (mg/l) 1.5 1.3
Alkalinity (mg/l as CaCO3) 150 140
Iron (mg/l) 0.018 < 0.005
Magnesium (mg/l) 7.2 1.3
Calcium (mg/l) 51 42
Silica (mg/l) 11 10
Sodium (mg/l) 5.2 5.3
Source: UCF ESEI REPORT (2019a)
The water quality for each groundwater well varies: well 1 and well 4 contain lower concentrations
of total dissolved solids (TDS) and DOC, conductivity and UV254, and higher concentrations of
total sulfide and pH as compared to well 2 and well 3. The SUVA values for the four UCF
groundwater wells would also indicate that the NOM within the supply contains a mix of humic
and non-humic matter, as the values range between 2 L/mg/m and 4 L/mg/m (ESEI, 2019). The
source water can also be characterized by a low level of inorganic substances, where the most
prevalent of such inorganics include calcium and alkalinity. The bromide content in the UCF
groundwater was observed to be below the minimum detection limit at less than 0.005 mg/l, so
possible threats issued by the formation of brominated DBPs in the UCF distribution system are
expected to be low. DBP experimentation also completed by UCF ESEI in 2019 to analyze for the
Page 49
31
potential formations of TTHMs and HAA5s by the groundwater supply under worst-case
conditions after aeration, chlorination, and 168-hours of incubation at 30oC can be observed in
Table 3-3.
Table 3-3: DBP Formation Potential for the UCF Groundwater Supply
Well
No.
Chlorine (mg/L CL2) TTHM (μg/L) HAA5 (μg/L)
Dose 168-hr
Residual MCL
Projected 168-hr
Formation MCL
168-hr
Formation
1 9 1.50 80 230 60 82
2 9 0.76 80 310 60 92
3 10 0.90 80 290 60 83
4 10 0.61 80 280 60 82
Source: UCF ESEI REPORT 2019a
The chlorine dose required to overcome the chemical demand of the aerated groundwater and
maintain a residual between 0.1 mg/l Cl2 and 1.5 mg/l Cl2 after incubation were 9 mg/l Cl2 and 10
mg/l Cl2. These doses also resulted in the projected TTHM and HAA5 concentrations of
approximately 280 ppb and 85 ppb, respectively. These potential formations of DBPs observed in
the UCF groundwater exceed the MCLs standardized by the EPA for either contaminant, thus
calling for a need of remediation on DBP precursors control in the UCF system to reduce such
formations to levels presumed as safe for public health.
On July 29, 2020, approximately 15 gallons of UCF groundwater was transported from UCF to
Guardian Manufacturing Laboratories (2750 Dillard Rd, Eustis, FL 32726). Bulk water aliquots
were dosed with ozone to achieve specified concentrations of transferred ozone (often remarked
as ozone residual in mg/l O3) for demand and decay studies. The purpose of testing with the ozone
manufacturer/supplier (Guardian) was to determine the instantaneous ozone demand and decay,
Page 50
32
along with the half-life, of UCF’s groundwater per industry standards. However, it is to be noted
that the following results do not account for total sulfide present in the source water as aliquots
were held in storage for an extended duration before demand and decay experimentation was
completed. Displayed in Table 3-4 are the water quality results from such testing.
Table 3-4: Groundwater Quality Characteristics
Sample ID
Raw
Groundwater
Sample
Transferred Ozone Dose
0.5 ppm 1.0 ppm 1.5 ppm (Decay Test)
TOC (mg/L) 2.0 2.3 2.2 2.1
Dissolved Oxygen (ppm) 7.7 8.0 8.7 9.3
Temperature (°C) 25 25 25 25
Bromide (µg/L) 22 57 31 44
Bromate (µg/L) N/a 2.5* 2.5* 2.5*
Total ozone dosage (mg/L O3) N/a 5.0 6.5 N/a2
Instantaneous Demand (mg/L O3) N/a 0.5 0.84 0.82
Half-life (min) N/a N/a N/a 1.23
*Minimum Detection Level (MDL) for bromate. 2: The total ozone dosage of the 1.5 ppm transferred ozone dose was not recorded.
Results from the ozone demand and decay tests indicated that a transferred ozone dose of 1.5 mg/l
O3 was the most suitable dose to calculate the instantaneous ozone demand and half-life of the
UCF groundwater. Displayed in Figure 3-3 and Figure 3-4 are the resulting ozone residual vs time
curve and linearized ozone residual vs. time curve used to calculate the instantaneous demand and
half-life for the aliquot after application of 1.5 mg/l O3 residual.
Page 51
33
Figure 3-3: Dissolved Ozone as a Function of Time
Figure 3-4: Linearized Dissolved Ozone as a Function of Time
Page 52
34
The instantaneous demand for this trial was 0.82 mg/L O3 displaying a well-formed decay curve
with a correlation coefficient of 0.988. The slope of the natural log of the decay curve was
calculated to be -0.562 mg/L/min with a correlation coefficient value of 0.988, which correlates to
a half-life of 1.23-min. As such, the dosage required to satisfy the ozone demand of UCF
groundwater and achieve 1.0 mg/l O3 residual under laboratory conditions would be approximately
6.5 mg/l O3. However, the realistic ozone dose may change due to demand incurred from H2S and
other variations in groundwater quality.
Existing Potable Water System Conditions
Locations in the UCF PWS that are at a higher risk of DBP formation include the Barbara Ying
Center, the Bounce House, sections of Greek Row, Siemens, and Aurora drive. The UCF PWS
also has a highly variable demand which is influenced by events such as football games, graduation
events, and holiday breaks, so PWS DBP formation varies seasonally and locationally. Sections
of the UCF PWS locations vulnerable to higher DBP formation content occur the far reaches of
the distribution system, which includes the Barbara Ying Center, Siemens, Greek Row and Arena,
as displayed in Figure 3-5.
Page 53
35
Figure 3-5: DBP Formations at Vulnerable Sections of the UCF PWS
Source: UCF ESEI REPORT 2019a
On May 29th, 2019, concentrations of TTHMs in potable water exiting the UCF WTP were
observed to be 46 ppb in the morning and at 50 ppb in the evening, and potable water at one of the
ends of the distribution system exceeded the MCL for TTHMs at a concentration of 86 ppb.
Page 54
36
Prior Research
UCF Utilities has sought to promote their water system through master planning of future additions
to current treatment processes, with aims to minimize the formation of DBPs throughout the entire
PWS. In 2019, the UCF PWS failed to comply with EPA’s TTHM MCL at one section of the
system located at the Greek Residence on campus that yielded a TTHM concentration of 91 ppb,
which exceeded the 80 ppb MCL per UCF’s consumer compliance report (UCF, 2020). Prior
research investigating DBP formation potential performed by ESEI documented that the four
groundwater wells when dosed with chlorine exceeded the EPA’s MCL of 80 ppb for TTHMs in
less than eight hours and the HAA5 MCL of 60 ppb within 168 hours. From 2019 to 2020, UCF
Utilities sought to promote their near-term DBP compliance through enhancing their
understanding of current conditions in their system through DBP screening and studies on the
efficacy of auto-flushing and GST recirculation, spray aeration and tray aeration (ESEI, 2019a).
Additional research was also undertaken to evaluate GAC as a stand-alone system using pilot-
scale equipment to determine the removal efficiency of DBP precursors from the groundwater
supply between mid-April and mid-June 2019. Two GAC types, FS-400 and Centaur 12x40, were
fed by the raw influent line from the wells. DOC and UV254 of the pilot column effluent were
monitored as the DBP precursors of interest and their associated TTHM and HAA5 formations
were analyzed to determine the effective treatment potential of the carbon columns in adsorption
and biological modes. Initially, the GAC columns were operated as a stand-alone method of
treatment, however the columns expended quickly and after 10-days both carbon columns had
exhausted and entered the mode of biological removal (ESEI, 2019a). Operation of the columns
in biological mode proved to reduce the formation of DBPs by approximately 15%, so the columns
would be required to operate in adsorption mode to promote proper DBP reduction, however the
Page 55
37
option proved to be financially burdensome to the Utility as the carbon would need to be replaced
often so neither option was chosen (ESEI, 2019a). As the stand-alone process has proved to be
ineffective, the Utility began to research other options of DBP precursor removal; eventually
leading to the investigation on the effectiveness of an integrated ozone-GAC process and stand-
alone ozonation process treatment study to be conducted.
Page 56
38
CHAPTER 4. METHODS AND MATERIALS
Included in this chapter are the experimental plan, methodologies and materials employed to
develop and monitor the presented treatment processes. The controlled operation of either process
was accomplished through the development of a pilot at the UCF WTP with capabilities for ozone
and GAC treatments. The determination of treatment effectiveness for both processes was
measured through the impact on NOM fractionation and formation of DBPs. The impact of the
treatment processes on NOM fractionation was determined through the monitoring of DOC and
UV254, and calculation of SUVA for both processes, coupled with analysis completed to determine
the fluorometric behavior of the raw and ozonated waters. Sampling from the pilot also underwent
DBP formation analysis, where the concentrations of TTHMs and HAA5s at certain periods of
incubation were extracted.
Water Quality Monitoring and Experimental Procedures
Samples taken from the pilot underwent analysis for water quality parameters as shown in Table
4-1, excluding the analysis procedures for fluorometric behavior analysis which are included in
the ORGANIC COMPOSITION DETERMINATION section of this chapter. The methods used
originate from Standards and Methods for the Examination of Water & Wastewater 20th Edition,
EPA Standard Methods and HACH Standard Methods (Baird et al., 2017). Methods to the
calibration of certain equipment are also included in Table 4-2. Upon their arrival at UCF
Laboratories, samples were held for up to four-days after initial sampling in a refrigerator at 4°C.
Sampling for DBP formation analysis was completed using 1-gallon and 4-gallon plastic totes and
sampling for metals and carbon analysis was completed using 250 mL and 500 mL plastic bottles.
Sampling for every other method of analysis completed in the following studies were completed
Page 57
39
using 125 mL and 250 mL amber bottles. Collection of water samples from the pilot occurred at
the following four sampling ports: (1) Influent line connected to the groundwater supply, (2) Ozone
skid contact tank, (3) Downstream from the FS-400 pilot column, and (4) Downstream from the
HPC Maxx (HP-830) pilot column. Prior to sampling from the ozone skid and GAC columns, an
equivalent of three times the total volume of the pilot of water was flown through the system to
promote sampling quality.
During the integrated ozone and GAC study, samples for UV254 and DOC were taken every
morning after 30-minutes of operation from each port of the pilot. Additional water quality
parameters, such as turbidity, pH, temperature, dissolved oxygen (DO), bromide, sulfate,
conductivity, oxidation-reduction potential (ORP) and alkalinity were monitored at the pilot during
field trips conducted at a frequency of 1-3 days a week over the entirety of the study. Samples for
iron, magnesium and calcium were taken three times over the study; once in November, December,
and January. At the end of the study, carbon was removed from the top and bottom 6-inches of
both columns and shipped to Calgon Carbon Company (Moon Township, PA) to quantify the
particle distribution, abrasion number, and iodine number of the activated carbon after its extended
use.
The stand-alone ozonation study was completed in duplicate and water quality samples collected
during the study were sampled from the groundwater influent line and ozone skid sampling ports
of the pilot. Water quality parameters of interest monitored during this study were DOC, UV254,
SUVA, ORP, turbidity, pH, temperature, conductivity, ozone residual concentration and formation
of DBPs after chlorination, with a primary interest on TTHMs. HAA5s were also monitored during
the first trial of the stand-alone ozonation study.
Page 58
40
Table 4-1: Methods and Equipment for Water Quality Analysis
Test Location Test Method Equipment Description
Method
Detection
Level
Preservation
Technique
Holding
Time
Field
Conductivity SM: 2510 B. Laboratory
Method
HACH HQ40D
Conductivity Probe
0.01
μS/cm N/A
Analyze
immediately
Ozone (Residual) HACH Method 8311 HACH DR2800
0.01 mg/l
– 1.50
mg/l
N/A Analyze
Immediately
Dissolved Oxygen YSI Dissolved Oxygen
Meter Method
YSI Pro 20 Galvanic DO
Probe 0.01 mg/l N/A
Analyze
Immediately
pH SM: 4500-H+ B.
Electrometric Method
HACH HQ40D pH and
Temperature Probe
0.01 pH
units N/A
Analyze
immediately
Sulfide HACH Method 8131 HACH DR2800 0.01 mg/L N/A Analyze
immediately
Temperature SM: 2550 B. Laboratory
and Field Methods
HACH HQ40D pH and
Temperature Probe 0.1 °C N/A
Analyze
immediately
ORP SM: 2580 B. HACH HQ40D ORP
Probe
-2000 to
2000 mV N/A
Analyze
Immediately
Turbidity SM: 2130 B.
Nephelometric Method
HACH 2100N Laboratory
Turbidity Meter 0.01 NTU N/A
Analyze
immediately
UCF Laboratory
Alkalinity Standard Methods (SM):
2320 B. Titration Method
Sulfuric Acid Burette
Titration
5 mg/L as
CaCO3 Refrigerate at 4°C 14 days
Calcium
SM: 3120 B. Inductively
Coupled Plasma (ICP)
Method
ICP Spectrometer - Perkin
Elmer Avio 200 0.01 mg/L
2% nitric acid,
refrigerate at 4°C 6 months
Magnesium
SM: 3120 B. Inductively
Coupled Plasma (ICP)
Method
ICP Spectrometer - Perkin
Elmer Avio 200 0.03 mg/L
2% nitric acid,
refrigerate at 4°C 6 months
Page 59
41
Test Location Test Method Equipment Description
Method
Detection
Level
Preservation
Technique
Holding
Time
Iron
SM: 3120 B. Inductively
Coupled Plasma (ICP)
Method
ICP Spectrometer - Perkin
Elmer Avio 200 0.01 mg/L
2% nitric acid,
refrigerate at 4°C 6 months
Chlorine (Free) Hach Method 8021 HACH DR 2700
Spectrophotometer
0.02 mg/L
as Cl2 N/A
Analyze
immediately
DOC
SM: 5130 C. Persulfate-
Ultraviolet or Heated-
Persulfate Oxidation
Method
Teledyne Tekmar Total
Organic Carbon Fusion
UV/Persulfate Analyzer
0.01 mg/L
2% phosphoric
acid, refrigerate at
4°C
28 days
TTHMs SM: 6232 B. Gas
Chromatograph
Agilent 6890N Network
Gas Chromatograph 10 μg/L
Sodium sulfite,
refrigerate at 4°C 14 days
UV-254 SM: 5910 B. Ultraviolet
Absorption Method Realtech P300 UV254 0.01 cm-1 N/A 48 hours
Sulfate
SM: 4110 B. Ion
Chromatography (IC); SM:
4500 B. Argentometric
Method
IC - Dionex ICS-1100 with
AS40 Automated Sampler 0.004 mg/l Refrigerate at 4°C 28 days
Bromide
SM: 4110 B. Ion
Chromatography (IC); SM:
4500 B. Argentometric
Method
IC - Dionex ICS-1100 with
AS40 Automated Sampler 0.004 mg/l Refrigerate at 4°C 28 days
Advanced
Environmental
Laboratories, Inc.
(Altamonte
Springs, FL)
HAA5 SM: 5710 D. Agilent 6890N Network
Gas Chromatograph 3 µg/L
Ammonium
chloride, refrigerate
at 4°C
14 days
Bromate EPA 300.1 IC Spectrometer 3.7 µg/L EDA, refrigerate at
4°C 14 days
SGS Laboratories
Inc. (Scott,
Louisiana)
Formaldehyde SW846 8315 GC/LC Semi-volatiles 2 µg/L Refrigerate, 4°C 3 days
Page 60
42
Test Location Test Method Equipment Description
Method
Detection
Level
Preservation
Technique
Holding
Time
Calgon Carbon
Abrasion Number TM-9 N/A N/A N/A 28 days
Apparent Density TM-7 Oven N/A N/A 28 days
Iodine Number TM-5 ASTM D2866 Titration N/A N/A 28 days
Particle Distribution TM-4 Mass N/A N/A 28 days
Page 61
43
Table 4-2: Methods to Zeroing and Calibration of Instrumentation
Analyte Method of Calibration or Zeroing
Chlorine, Free Zero by filling the sample cell with solution,
place cell in the unit and press zero.
Dissolved Oxygen
Calibrate by placing the galvanic probe into a
holder with a wetted sponge for 10 minutes,
then press calibrate.
Dissolved Ozone
Zero by creating a blank. Fill a 150 mL
breaker with DI water and break open an
ampul in the water, place in the unit and press
zero.
ORP
Calibrate by placing the sensor into
calibration solution at a specific level of mV
and pressing zero.
pH
Calibrate by placing the pH sensor into
standardized solutions at pH’s of 4, 7 and 10
and pressing calibrate on the unit with the
sensor in each solution.
Temperature Calibrate against a certified thermometer.
Turbidity Calibrate using samples containing
standardized NTUs.
Total Sulfide
Zero by creating a blank. Place 10 mL of DI
water into a cell and mix 0.5 mL of Sulfide
reagent 1 and Sulfide reagent 2 into the
solution by slowly inverting the cell after
inclusion of the reagents. Let the solution
stand for 5 minutes, insert the cell into the
unit and press zero.
UV254 Zero by pouring DI water into a cell, placing
the cell into the unit, and pressing zero.
Page 62
44
DBP Formation Experimentation
During DBP formation experimentation, samples were analyzed for their respective chlorine
residual, pH, temperature and DBP formation after their extended period of simulated incubation.
Groundwater from the raw influent line was also aerated and underwent DBP formation
experimentation as a control for either studies. Prior to DBP analysis, groundwater samples were
aerated overnight to removed volatile compounds that may interfere with the proceeding
experiment. To quantify the required chlorine dosage for each sample to achieve a residual
between 0.2 mg/l Cl2 – 1.0 mg/L Cl2 after 48-hours at an incubation at 30°C, each sample was
initially dosed with three separate chlorine doses and the sample with the lowest residual within
the set range was chosen. After determining the required chlorine doses, 1000-mL of sample for
each condition was dosed with chlorine with a stock solution with a strength of approximately
38,000 mg/l Cl2 was then mixed on a stir-plate with a stir bar for approximately 45-seconds. Stock
strength of the chlorine solution was measured prior to each experimentation event. After mixing
for the allotted time, samples were measured for their zero hour chlorine residual, poured into 60
mL amber bottles, and incubated at 30°C for 24- hours and 48-hours. This methodology sought to
replicate the worst-case conditions influencing water in a distribution system, which maximizes
the potential for DBP formation. After the predetermined incubation times has expired, samples
were removed from the incubator and chlorine residuals of each sample were measured. Samples
collected for TTHM analysis were then quenched with sodium sulfite and stored in a refrigerator
at 4°C for up to two weeks prior to gas chromatography analysis. Samples collected for HAA5
analysis were poured into 200-mL amber vials provided by American Environmental Laboratories,
Inc. (AEL) (Altamonte Springs, FL), quenched with ammonium chloride and stored in a
refrigerator at 4°C for up to two weeks prior to their analysis. The employed simulation of a potable
water system is conceptual in nature and is intended as a use to provide for analytical estimations
Page 63
45
of DBP formation within a full-scale PWS. As to avoid the loss of volatile compounds during the
experimentation of DBP FPs, samples were prevented from being over-exposed to the atmosphere
and light.
Organic Composition Determination
NOM acts as the major natural DBP precursor for the formation of DBPs in the UCF water supply.
To better understand the reduction of NOM post-ozonation and GAC filtration, samples taken from
each port of the pilot were measured for UV254 absorbance and DOC concentration, and SUVA
was calculated after knowledge of either constituent was discovered. Additionally, raw and
ozonated samples were also studied for their fluorometric behavior. Upon arrival to the UCF Water
Quality Laboratories, NOM samples were refrigerated at 4°C until the required analysis began.
Prior to their analysis, NOM samples were filtered through 0.45-micron filters using a vacuum
filter. Filtered samples for DOC quantification were then poured into 60 mL amber vials, acidified
with 800 µl of phosphoric acid and stored for up to two weeks in a refrigerator at 4°C before being
ran on a Teledyne Tekmar Total Organic Carbon Fusion machine. For all other filtered NOM
samples, sampling bottles were reprimed with the filtered sample and the filtered sample was
poured back into their respective sampling bottles and stored in a refrigerator at 4°C for up to a
week before initial analysis was completed.
Affiliated techniques to produce the required NOM fraction results were completed using the
methods presented in Table 4-1. SUVA was then calculated through Equation 2.2 from Chapter 2,
which is derived using the resulting DOC and UV254 values. Analysis for fluorometric behavior
was completed with emission and excitation bandwidths set to 1 nm and excitation wavelengths
ranged from 250 nm to 600 nm and emission wavelengths ranged from 280 nm to 520 nm.
Page 64
46
Pilot System Process
Facilitation of the following treatment studies were completed through installation of a pilot at the
UCF WTP with the capabilities of advanced oxidation through ozone and GAC filtration. The
system diagram for the integrated ozone-GAC pilot at the UCF WTP can be observed in Figure 4-
1 and pictures of the ATS-15 Guardian ozone generator and two GAC pilot columns also at the
UCF WTP are included in Figure 4-2. Raw groundwater from the UCF GST influent line was
supplied to the pilot through the top of the ozone skid’s contact tank using pressure driven by head
generated by the GST. Upon entering the contact tank, water was continuously removed through
the bottom of the vessel into a pressurized loop containing the point of ozone injection. At the
point of ozone injection, a decrease in pipe diameter forced water to generate a vacuum through
the venturi effect which would mix the gas into an aqueous mixture, and the resulting solution
would be recirculated back into the bottom of the contact tank. For the integrated ozone-GAC
study, the pilot was operated with an applied dose of 7.2 mg/l O3, which resulted in a residual of
0.30 mg/l O3 in the contact tank after demand of the raw water was satisfied. Ozonated water in
the recirculation loop was also bypassed into a separate line which either directed the flow into
one of two GAC pilot columns or into a grate for disposal. Flow was wasted to maintain steady
state conditions in the ozone skid contact tank, which would overheat and irritate solubility of
ozone if too little flow exited the ozonation process. Flows directed through the GAC columns
were monitored using flow totalizers, which were controlled using flow meters containing a range
of control from 0.01 gallons per minute (gpm) to 1 gpm and effluent from the GAC columns were
disposed.
Page 65
47
Figure 4-1. Process Schematic for the Integrated Ozone-GAC Pilot
Page 66
48
(a) (b)
Figure 4-2: a) View of the Integrated Ozone and GAC Pilot, b) GAC Pilot Carbon Columns
Page 67
49
Operation of the integrated ozone-GAC pilot would be prevented if certain conditions were meet
during facilitation of treatment. Such errors that were encountered during operation of the pilot
equipment were mainly due to operational constraints arisen from a low demand incurred by the
UCF PWS, which would often prevent the well pumps from operating as the GST would remain
full for extended periods of time. During these periods, the pilot would rely on pressure driven by
the GST’s influent line to supply water to system processes. This pressure would often dwindle
after sustained use and loss of water to the ozone skid would cause the ozone generator to shut off
prematurely, preventing operation of the pilot. Additional issues that would cause for the pilot to
shut off prematurely, not associated with low flow events, were due to mechanical errors
associated with low oxygen purity and variable injection pressure. Such errors became an issue as
operators were unable to monitor the pilot for all hours of the day, preventing staff from
maintaining routine scheduling of pilot operation.
Ozone Generator Equipment
The ozone generator used in this study was a Guardian Manufacturing ATS-15 (ozone skid), which
houses the capability to dose ozone up to 11 mg/l O3 at the designed flow rate of 15 gpm (Guardian
Manufacturing, 2021). Production of ozone was completed through use of an oxygen enrichment
system, which converted ambient air into highly concentrated oxygen through a process called
Pressure Swing Adsorption (PSA). PSA processes generate oxygen enriched gases by stripping
nitrogen from ambient air through filtration by pressurized cylinders containing a mixture of
thermally modified zeolite and diatomaceous earth, producing oxygen at a purity of approximately
96%. The ozone skid would then direct the oxygen enriched gas into a Plasma Technics 50 g
Plasma Block ® (Plasma Block), which used the corona discharge method to generate ozone at 5-
10% weight (Plasma Technics, 2021). Most of the generated ozone, and a small amount of oxygen
Page 68
50
resulting from its decomposition, were then diffused into the injection point with the flow of
groundwater and an aqueous mixture of ozonated water was created. Undissolved gases would
float to the top of the tank and exit through the off-gas destruct unit located at the top of the ozone
skid where gaseous ozone was converted back into oxygen. Design of the off-gas unit was included
to comply with the United States Department of Labor Occupational Safety and Health
Administration (OSHA), who constituted that an employee must not be exposed to ozone above
its permissible exposure limit over an eight hour time-weighted average value of 0.1 parts per
million (ppm) (OSHA, 2006).
Monitoring equipment onboard the ozone skid could measure the ozone residual and water level
in the contact tank, ozone concentration in the ambient air and the ozone generator’s voltage,
amperage, and total runtime. Such values monitored by the ozone skid were reported every five-
seconds and saved onto its onboard memory storage. Calibration of the ozone skid’s set ozone
residual level and scheduling of the pilot were both controlled though use of the skid’s
programmable logic controller (PLC) which provided a user interface via a touchscreen mounted
on the ozone skid. Through the PLC, the pilot was programmed to turn on and begin dosing the
influent flow to a residual of 0.3 mg/l O3 in the morning at 9:30 AM and off in the evening. To
determine the applied ozone dose performed by the ozone skid during the integrated ozone-GAC
study, operational parameters such as the UCF groundwater iron and sulfide concentrations,
generator current and amperage, oxygen flow, liquid flow and ozone residual in the contact tank
of the ozone skid were logged over the duration of the study. The calculation of ozone dosage was
also be estimated through combination of the ozone residual concentration and stoichiometric
chemical demand equations for sulfide and iron, which are included in Equation 2.10 and Equation
2.11.
Page 69
51
Activated Carbon Pilot Columns
Operation of the integrated ozone-GAC pilot to treat the ozonated flow was completed through
use of two GAC pilot columns, either containing the following Calgon series of carbons: FS-400
and HPC-830. Effectiveness of pilot column operation was determined through the monitoring and
analysis for DBP precursor reduction and formation of DBPs from the column effluent. Both
carbon types were manufactured by Calgon and the virgin carbon characteristics of either carbon
type can be observed in Table 4-3.
Table 4-3: Virgin Carbon Characteristics
Carbon Type Iodine Number
(mg/g)
Abrasion
Number
Apparent
Density (g/cc)
Effective
Granule
Size (mm)
HPC-830 1000, min 80 0.27, min
0.37, max 0.60 – 2.4
FS-400 1000, min 75 0.44 0.43 – 1.7
The HPC series of carbon is produced by Calgon Caron, and contain carbon types that are low-
density, kosher, coal-based which can be reactivated after exhaustion (Calgon Carbon, 2015).
HPC-830 virgin carbon is also characterized by its low apparent density of 0.37 g/cc3 to 0.43 g/cc3,
which gives the carbon the advantage of being a low cost per unit volume alternative to denser
carbon options. The HPC-830 carbon type also benefits from a reduced contact time due to its
large volume of transport pores.
The Filtrasorb series is also manufactured by Calgon Carbon and is produced from the re-
agglomeration of bituminous coal for the purpose of removing organic substances from water
(Calgon, 2015). The FS-400 carbon type has a high mechanical strength due to re-agglomeration,
attributing to its hardness and apparent density of 75 g/cc3 and 0.54 g/cc3, respectively, at virgin
Page 70
52
conditions. The carbon’s high mechanical strength should allow for a sustained and effective
operation through multiple backwashes without the production of additional fines as the carbon
ages. FS-400 carbon is also re-activated, which produces small and large pore sizes to allow for a
broad range of adsorption of low and high molecular weight organic compounds (Calgon, 2015).
FS-400’s apparent density also increases its adsorptive capacity at the disadvantage of an increase
in O&M costs since the cost per volume will be higher as compared to a carbon with a lower
density. Neat (stock) FS-400 carbon contains particles with diameters that range between 0.43 mm
and 1.7 mm, while virgin HPC-830 carbon contains particles with diameters that range between
0.60 mm and 2.4 mm. Both carbon types also possess a fines content of approximately five-
percent.
The pilot columns were designed to uphold a predetermined flow of 0.15 gpm at its designed
dimensions, producing an EBCT of 3.5 minutes within either column. Flow for the GAC columns
was controlled using two Blue White F-550 adjustable flowmeters and total flow was measured
using two FlowIQ ® 2100 totalizers.
Packing of the GAC pilot columns was completed at the UCF Laboratories. To prevent excess
carbon from escaping the pilot columns, a six-inch layer of coarse aquarium gravel was first poured
into the bottoms of both pilot columns. Additionally, before entering either pilot column, the coarse
aquarium was washed with distilled (DI) water. An 18-inch layer of GAC, one column receiving
FS-400 and the other HPC-830, was then poured into either column on top of the coarse aquarium
gravel. The packed columns were then backwashed with DI water until a bed expansion of 30%
was achieved and observable fines were undetected in the effluent. After backwashing, the carbon
columns were installed onto the wall of the UCF WTP pump room and allowed to soak for a week
before the pilot was first operational.
Page 71
53
Laboratory Quality and Control
Laboratory and field quality control measures were employed during both studies presented in this
thesis to ensure proper quality assurance and quality control (QAQC) were followed. Duplicates
of field measurements were taken during the analysis for pH, temperature, conductivity, turbidity,
ozone residual, dissolved oxygen, oxidation reduction potential and total sulfide. Laboratory
analysis completed at UCF Laboratories, AEL, SGS and Calgon Corporation followed the
procedures in accordance with EPA and the Standards and Methods for the Examination of Water
& Wastewater (Baird et al., 2017). Each laboratory follows a Laboratory Quality Assurance Plan,
which requires quality control to be monitored and reported for each method used (EPA, 2005).
Laboratory analyses for TTHMs included duplicates and spikes for every fifth sample to ensure
precision and accuracy. Calculation of QAQC can be observed in Equations 4.1 – 4.5, and the
control level (CL) and warning levels (WL) for the associated parameters were calculated using
the first ten samples analyzed in adherence with Standards and Methods for the Examination of
Water & Wastewater (Baird et al., 2017). For DOC and UV254 measurement, replicates and
duplicates were analyzed from the raw well line and spikes were completed for DOC analysis
every five samples.
𝑅𝑃𝐷 =
|𝑆𝑎𝑚𝑝𝑙𝑒 𝑅𝑒𝑠𝑢𝑙𝑡−𝐷𝑢𝑝𝑙𝑖𝑐𝑎𝑡𝑒 𝑅𝑒𝑠𝑢𝑙𝑡|
𝑆𝑎𝑚𝑝𝑙𝑒 𝑅𝑒𝑠𝑢𝑙𝑡+𝐷𝑢𝑝𝑙𝑖𝑐𝑎𝑡𝑒 𝑅𝑒𝑠𝑢𝑙𝑡
2∗ 100
(4.1)
𝑃𝑒𝑟𝑐𝑒𝑛𝑡 𝑅𝑒𝑐𝑜𝑣𝑒𝑟𝑦 =𝑄𝑢𝑎𝑛𝑡𝑖𝑡𝑦 𝑀𝑒𝑎𝑠𝑢𝑟𝑒𝑑
𝑄𝑢𝑎𝑛𝑡𝑖𝑡𝑦 𝐴𝑑𝑑𝑒𝑑∗ 100
(4.2)
𝑅𝑜 = 𝑑2𝑠 (4.3)
𝐶𝐿 = 𝑅𝑜 ± 3𝑠 ∗ 𝑅 = 𝐷4𝑅𝑜 (4.4)
𝑊𝐿 = 𝑅𝑜 ± 2𝑠𝑅 = 𝑅𝑜 ±2
3(𝐷4𝑅𝑜 − 𝑅𝑜) (4.5)
Page 72
54
Where, RPD is the relative percent difference, Ro is the mean range, s is the standard deviation, d2
is the factor of to convert standard deviation to mean range, equal to 1.128 for duplicates, CL is
the control level, WL is the warning level, R is the range and D4 is the conversion factor to convert
mean range to CL, equal to 3.267 for duplicates.
Page 73
55
CHAPTER 5. RESULTS AND DISCUSSION
The results presented in this chapter were reported from analytical observations for NOM and DBP
formation performed on both the stand-alone ozone oxidation studies in addition to the integrated
ozone-GAC filtration pilot located at the UCF WTP. Water quality monitoring for the specific
parameters profiling the treatment processes evaluated were evaluated to determine the treatment
effectiveness of both the stand-alone ozone and integrated ozone-GAC processes.
For the stand-alone ozonation component of the study, the effectiveness for each ozone dose to
reduce the NOM originating from the UCF groundwater was measured through DOC, UV254 and
spectrofluorometry. Observed TTHM and HAA5 formation results were analyzed to determine the
effective reduction in TTHM and HAA formation post-ozone oxidation and bleach disinfection.
For the integrated ozone-GAC process study, DOC, UV254 and SUVA were first used to determine
the NOM fractionation remaining in the processed water. Each GAC column was assessed for
DOC and UV254 breakthrough in terms of EBVs for each GAC column. DBP formations were
compared with NOM results to estimate the TTHM exhaustion for both pilot column carbon types.
Page 74
56
Stand-Alone Ozone Oxidation Performance
Over a four-week period from January 27, 2021 to February 24, 2021, the UCF groundwater was
exposed to varying levels of ozonation through use of the ozone generator section of the integrated
ozone-GAC pilot located at the UCF WTP. The stand-alone ozone dose studies were conducted in
duplicate and expressed as trial one (T1) and trial two (T2). Results associated with the stand-alone
ozonation study included the reaction of NOM through DOC and UV254 monitoring, behavior of
fluorimetry and reduction of DBPs, mainly TTHMS, after application of a range of ozone doses
on the raw UCF groundwater.
Water Quality Results
The selected ozone dosage quantities targeted for this study are recorded with the residual after the
ozone demand for the generator was satisfied at the time of experimentation. The contact tank was
flushed for a period of 30 minutes after changing the generator’s residual setting before a
subsequent test run was performed and a water sample was collected for ozone decay. The
residuals tested in this study were 0.30 mg/l O3, 0.80 mg/l O3, 1.5 mg/l O3, 3.0 mg/l O3 and 6.0
mg/L O3, each marked respectively in the results as ozone residual #1, #2, #3, #4 and #5. Through
each experimented dose, the concentration of ozone in the contact tank was variable and was not
sustained exactly at the inputted dose of ozone. The lowest ozone residual setting was set to 0.3
mg/l O3 (with an applied dose of 7.2 mg/l O3) since the ozone generator could not produce an
ozone residual below zero. It is also to be noted that when the ozone generator was adjusted to
provide the highest residual of 6.00 mg/L O3, the skid’s ozone generation unit was at full capacity.
The highest actual measured residual observed within the contact tank was in dose #5 which
Page 75
57
registered 4.00 mg/L O3; however, the concentration was variable through the experiment. The
resulting water quality and NOM results from the study are included in Table 5-1.
Page 76
58
Table 5-1: Water Quality Results from the Stand-alone Ozonation Study for Trials 1 and 2
Parameter
Raw #1 #2 #3 #4 #5
T1 T2 T1 T2 T1 T2 T1 T2 T1 T2 T1 T2
Residual Setting (mg/L
O3) N/a N/a 0.3 0.3 0.8 0.8 1.5 1.5 3.0 3.0 6.0 6.0
pH 7.41 7.49 7.41 7.58 7.78 7.49 7.75 7.41 7.69 7.50 7.68 7.49
Temperature (oC) 26.4 23.9 27.4 26.8 24.5 27.3 24.9 25.8 21.6 27.5 27.2 26.4
Actual Ozone Residual
(ATS-15) (mg/L) -2 -2 0.30 0.31 0.78 0.88 1.44 1.74 2.96 2.90 3.73 3.70
Actual Ozone Residual
(HACH) (mg/L) -2 -2 0.44 0.37 1.06 0.88 -* -* -* -* -* -*
ORP (mV) -167 -122 241 309 550 565 657 574 729 761 845 831
UV254 (cm-1) 0.0840 0.0811 0.0329 0.0350 0.0318 0.0320 0.0262 0.0289 0.0224 0.0212 0.0181 0.0199
DOC (mg/L) 2.45 2.40 2.32 2.33 2.28 2.37 2.24 2.26 2.13 2.09 1.96 2.03
SUVA (L/mg/m) 3.43 3.38 1.42 1.50 1.39 1.35 1.17 1.28 1.05 1.01 0.92 0.98
Formaldehyde (ppb)3 - - 36.1 - - - 43.3 - - - - -
Bromate (ppb)3 - - < 3.7 - - - < 3.7 - - - - -
*: The MDL of the HACH DR 2800 prevented its measurement of ozone residuals on samples above 1.50 mg/l O3.
2: Dissolved ozone residual measurements were not taken on the raw groundwater samples.
3: Formaldehyde and bromate were collected during the first trial for doses #1 and #3.
Page 77
59
Reported in Table 5-1 are results for the dissolved ozone concentration of ozonated samples as
monitored by a HACH DR2800 in triplicate, with an acceptable range of 0.1 mg/l O3 to 1.5 mg/l
O3 residual, and the monitored dissolved ozone residual concentrations as reported by the ozone
generator’s monitoring equipment. The highest achievable residual for the set of samples was
approximately 3.7 mg/l O3; however, the dose of ozone applied to the influent varied throughout
each trial. For a higher ozone residual to have been achieved, the alteration of operational
conditions to improve the solubility of ozone in the contact tank would have been required.
Temperature and pH within the contact tank of the ozone generator varied by day depending on
the groundwater quality and length of ozone generator operation. The results for pH and
temperature were unaffected by oxidation and the resulting ORP measurements increased from
275 to 840 mV. Additionally, sampling for formaldehyde and bromate was completed during the
first trial for doses #1 and #3.
DBP Precursor Results
At the time of ozone dosing, impact on NOM fractioning in the effluent from the ozone generator
was monitored. This was completed through the determination of the DOC, UV254 and SUVA of
raw and ozonated samples. Additionally, fluorescence of the raw and some ozonated samples were
analyzed through the procreation of EEMs. As a result, relationships between the monitored DOC
and UV254 of the set of ozonated samples were observed. The correlation between results for DOC
and UV254 from the ozonated samples are included in Figure 5-1.
Page 78
60
Figure 5-1: Correlation between DOC and UV254 for the Stand-alone Ozonation Study
The reported r-squared value of Figure 5-1 was 0.9226, which displays a positive relationship
between the DOC and UV254 results from the stand-alone ozonation study. Further observations
on the impact of DOC and UV254 by the stand-alone ozonation process, in comparison to the DOC
and UV254 results from the groundwater influent line presented in Table 5-1, are included in Figure
5-2.
Page 79
61
Figure 5-2: Average DOC and UV254 Reduction by the Stand-alone Ozonation Study
A relationship between the applied dose of ozone and NOM impaction was observed during the
stand-alone ozonation study, where an increase to the applied ozone dose resulted in a decrease in
the levels of UV254 and DOC concentration in the effluent flow of the ozone generator. UV254 was
reduced far greater than DOC by the applied ozone, further exemplifying that the ozonation
process was more efficient at degrading the aromatic, UV absorbent fraction of NOM in the UCF
groundwater supply. This resulted in the measured DOC and UV254 of the ozonated samples being
reduced by up to approximately 80% and 20%, respectively. As the ozone dose was increased, the
efficiency of UV254 and DOC reduction also increased by 18% and 14%, respectively. This would
suggest that the lowest dose of applied ozone, which was sufficient meeting the ozone demand of
the raw groundwater and providing for a low ozone residual, was sufficient to reduce over half of
the UV absorbent fraction of NOM and a small portion of the DOC portion of NOM in the UCF
Page 80
62
groundwater. The observed reduction of NOM in each ozone dose would suggest the resulting
formations of DBPs would also be minimized, however the difference in reduction between the
lowest and highest doses of ozone should be minimal. Table 5-1 further displays this relationship,
where the raw groundwater sample contained a mix of humic and non-hmuc organics and the
ozonated samples were observed to contain non-humic organics. Further determination on the
alteration of NOM through the ozonation of groundwater can also be observed in the change to the
fluorometric behavior of samples through fluorometric EEMs, which are displayed in Figure 5-3,
Figure 5-4, and Figure 5-5.
Figure 5-3: EEM of the Raw UCF Groundwater Supply
Page 81
63
Figure 5-4: EEM of the UCF Groundwater Supply Ozonated to 0.3 mg/l O3 Residual
Figure 5-5: EEM of the UCF Groundwater Supply Ozonated to 3.7 mg/l O3 Residual
Page 82
64
Figure 5-3 displays a large presence of fluorescent organic media within the humic region of the
resulting EEM. Initial ozonation of the UCF groundwater with the lowest dose had a large impact
on the fractionation of NOM, resulting in a low amount of visible fluorescence within the humic
region of the EEM. Further ozonation of the UCF groundwater with the highest dose completely
removed visible fluorescence.
DBP Formation Results
The reduction in chlorine residuals resulting from DBP formation experimentation, at an average
between the two trials, are included in Table 5-2. Also included in APPENDIX A are the water
quality results for free chlorine, pH, temperature, and turbidity of samples as monitored and
collected during the stand-alone ozonation DBP formation experimentation.
Page 83
65
Table 5-2: Chlorine Residual Reduction of DBP Samples from the Stand-alone Ozonation Study
Sample
Dose
(mg/l
Cl2)
0-hr
Residual
(mg/l Cl2
Initial %
CL2
Reduction
24-hr
Residual
(mg/l Cl2)
% CL2
Reduction
at 24-hr
48-hr
Residual
(mg/l Cl2)
% CL2
Reduction
at 48-hr
D1 5.0 2.6 46% 0.92 82% 0.66 87%
D2 5.0 2.9 42% 1.1 80% 0.71 86%
D3 5.0 3.0 42% 1.2 77% 0.81 85%
D4 5.0 2.9 38% 1.3 74% 0.98 81%
D5 5.0 2.8 42% 1.3 72% 0.97 79%
As the applied dose of ozone was increased, the required dose of chlorine to supplement a residual
between 0.2 mg/l Cl2 and 1.5 mg/l Cl2 after 48-hours of incubation was unaffected, however the
efficiency of samples to maintain said chlorine residual was increased. During both trials, each
sample required a dose of 5.0 mg/l Cl2 and the resulting reduction in chlorine residual, as compared
between the lowest and highest doses of ozone, was mitigated by 10% and 12% at 24-hours and
48-hours of incubation. This would suggest that application of an ozonation process to the UCF
groundwater would increase the effectiveness of the UCF PWS to maintain its residual of chlorine
at prolonged holding times. The average resulting formation of TTHMs at 24-hours and 48-hours
are included in Figure 5-6 and the tabulated TTHM results for the ozonated samples with percent
reduction of DBP formation, as compared to results from the aerated groundwater samples, are
displayed in Table 5-3. Such reductions in TTHM formation by the stand-alone ozonation process
were calculated using the averaged formation potential results analyzed from the raw groundwater
influent line in mid-January 2021. Individual water quality and DBP results observed during
formation experimentation of the UCF groundwater is included in APPENDIX A.
Page 84
66
Table 5-3: TTHM Formation and Percent Reduction by the Stand-alone Ozonation Study
Trial No. Sample 24-hr
TTHM FP
24-hr
TTHM %
Reduction1
48-hr
TTHM FP
48-hr
TTHM %
Reduction1
Trial 1
#1 81.3 1.57 97.0 -2.63
#2 76.6 7.26 92.7 1.92
#3 71.2 13.8 89.1 5.73
#4 69.4 16.0 86.3 8.69
#5 65.0 21.3 83.0 12.2
Trial 2
#1 78.4 2.08 97.3 -2.95
#2 77.0 6.78 94.3 0.22
#3 71.6 13.3 87.9 7.00
#4 67.0 18.9 86.8 8.16
#5 64.5 21.9 78.4 17.1
1: Percent reduction is calculated with the average groundwater TTHM FP from mid-January 2021.
Figure 5-6: Average TTHM Formation at 24 and 48-hours for the Stand-alone Ozonation Study
Page 85
67
TTHM results from the stand-alone ozonation study would suggest that an increased dose of ozone
would reduce the formation of TTHMs in the UCF distribution system. This relationship of
decreased TTHM concentrations at increased ozone dosages was observed between both trials,
where on average the 24-hour set decreased from 80 ppb to 65 ppb and the 48-hour set decreased
from 97 ppb to 83 ppb. Additionally, the resulting TTHM formation for the sample containing the
highest dose of ozone applied at 24-hours and 48-hours of incubation remained below and above
the MCL, respectively. This would suggest that an applied ozone dose above 11 mg/l O3 would be
required to sufficiently reduce the amount of TTHMs to a level that would be deemed safe for
public health. The UCF PWS has also been previously characterized with water ages above 48-
hours of incubation, so TTHM formations at the highest dose of ozone would most likely exceed
the MCL for the contaminant under real-world circumstances. Additionally, increases to the
applied dose of ozone had very little impact on the speciation of THMs, as shown in Figure 5-7.
Page 86
68
Figure 5-7: THM Speciation for the Stand-alone Ozonation Study
Increases to the applied dose of ozone to the UCF groundwater decreased the formation of
chloroform and increased the formation of brominated DBPs. As the dose of applied ozone was
increased, the percent formation of chloroform was also increased by 7% and the percent formation
of BDCM and DBCM were decreased by 4% and 3%, respectively. However, it is to be noted that
every measurement for bromoform was observed to be below the MDL for the instrument at a
concentration of > 0.7 ppb, so further observations on the reduction of the compound could not be
concluded on. Speciation results would suggest that the required ozone dose to effectively reduce
THMs below the MCL would result in a high percent speciation of brominated DBPs, which would
increase the hazards towards public health from the consumption of potentially carcinogenic,
brominated DBPs. Additional results for HAA5 formations at 48-hours of incubation for four of
Page 87
69
the five ozone doses trialed from the first round of ozonation experimentation are included in
Figure 5-8.
Figure 5-8: HAA5 Formation at 48-hours from the Stand-alone Ozonation Study
HAA5 formation results would suggest that the lower doses of ozone decreased the formation of
HAA5s while the highest dose of ozone increased the formation for HAA5s. The observed increase
in HAA5 formation for the highest dose of ozone resulted in an HAA5 concentration which
surpassed the MCL of 60 ppb. As such, the installation of a stand-alone ozonation process by the
Utility operating at an ozone dose equaling or exceeding the highest dose trialed may elevate
HAA5 formations in the UCF distribution system beyond the threshold of the MCL, thus requiring
further remediation.
Page 88
70
Integrated Ozone and GAC Process Performance
The integrated ozone-GAC study was operated for a total of 420 hours and approximately 7000
EBVs over a period of three-months (November 21, 2020 - February 26, 2021). The observed
average daily operating ozone residual and daily runtime of the pilot as reported by the Guardian
ATS-15 ozone generator’s monitoring equipment are included in Figure 5-9.
Figure 5-9. Average Daily Runtime and Ozone Residual of the Ozone Skid
Over the duration of the study, the pilot averaged a daily runtime of 4.4 hours at an average of 0.37
mg/l O3 residual and 7.2 mg/l O3 dose. Operation of the pilot was prevented periodically over
academic and holiday breaks due to complications attributed from a low flow demand due to low
campus population. Such events would occur at periods when the GST had reached volumetric
Page 89
71
capacity, resulting in the groundwater wells and ozone skid to turn off. Additionally, personnel
were not available to manage the pilot at all hours of the day, resulting in an inability to restart the
pilot after early shut-offs. However, the pilot was prevented from being inoperable for more than
three consecutive days as to avoid stagnation of carbon within the pilot columns. The pilot also
did not operate on February 9, 2021, which occurred because the pilot turned off immediately upon
start-up due to low oxygen purity. Important parameters required to further understand the flow
conditions of the pilot columns, such as the designed empty bed volume (EBV), empty bed contact
time (EBCT) and loading rates (flux) of the pilot columns are displayed in Table 5-4.
Table 5-4: Parameters of Operation for GAC Pilot Columns
Column
Media
Height
(in)
Column
Dia. (in)
EBV
(gal)
Average
Flow Rate
(gpm)
EBCT
(min)
Flux
(gpm/ft2)
HPC-830 18.0 3.00 0.551 0.156 3.53 3.18
FS-400 18.0 3.00 0.551 0.155 3.56 3.15
At a designed empty bed volume of 0.55 gallons and an average flow rate of approximately 0.15
gpm, the resulting EBCT and flux for the HPC-830 and FS-400 pilot columns were 3.53-min and
3.56-min, and 3.18 gpm/ft2 and 3.15 gpm/ft2, respectively. As such, operational flow parameters
for both carbon columns remained close throughout the entirety of the pilot study. The monthly
flows for either pilot columns can also be observed in Table 5-5.
Table 5-5: Monthly Flow of GAC Pilot Columns
Carbon
Column
November
21–30
Flow (gal)
December
1–31
Flow (gal)
January
1–31
Flow (gal)
February
1–25
Flow (gal)
HPC-830 357 1156 1280 845
FS-400 336 1133 1283 827
Page 90
72
In terms of monthly flow, the pilot columns received the most flow in January. Additionally, the
average daily flow loaded onto the HPC-830 and FS-400 pilot columns were both approximately
39 gallons per day. Through combination of the designed EBV for either pilot column and the
monitored daily flow, the cumulative flow applied the pilot carbon columns in terms of EBVs is
shown in Figure 5-10.
Figure 5-10: Flow in terms of EBVs for both GAC Columns in the Ozone-GAC Study
The daily flow regime for the pilot columns appear to be constant and in close relationship,
however impacts to the daily flow due to low or zero flow events are observable in Figure 5-10.
The HPC-830 and FS-400 pilot columns operated at a daily average of 72 EBVs and 73 EBVs,
respectively, and ultimately operated for 7025 EBVs and 6950 EBVs, respectively. It is to be noted
that the official starting date for the study does not begin at zero EBVs in Figure 5-10 because the
pilot was running discontinuously for about two weeks during the pilot start-up period, which
occurred from November 11, 2020 to November 21, 2020.
Page 91
73
Water Quality Results
Listed in Table 5-6 are the resulting ranges of general water quality parameters monitored from
the pilot over the duration of the piloting period through the procedural methodology and
frequency explained in Chapter 4 for the UCF groundwater (Raw Well), ozone skid and both GAC
pilot column sampling locations.
Table 5-6: Ranges for Water Quality Conditions for the Ozone-GAC Pilot
Parameter Raw Well Ozone Skid HPC-830 FS-400
pH 7.36 – 7.79 7.37 – 7.76 7.18 – 7.71 7.20 – 7.71
Temperature (oC) 18.8 – 26.4 24.4 – 29.2 24.2 – 30.5 24.5 – 30.6
Conductivity (mS/cm2) 288 – 430 294 – 359 289 – 339 252 – 341
Ozone Residual (mg/L) -1 0.23 – 0.71 0.00 – 0.05 0.00 – 0.05
Dissolved Oxygen (mg/L) 0.72 – 0.10 19.9 – 30.9 18.2 – 28.8 18.4 – 29.4
Alkalinity (mg/L) 131 – 173 131 - 175 138 - 177 138 - 170
Sulfide (mg/L) 0.26 – 1.42 0.00 – 0.06 0.00 – 0.01 0.00 – 0.01
Turbidity (NTU) 0.16 – 0.94 0.13 – 1.25 0.10 – 0.49 0.08 – 0.40
Bromide (mg/L) < 0.20 < 0.20 < 0.20 < 0.20
Sulfate (mg/L) 2.19 – 4.82 3.91 – 5.89 4.05 – 5.91 3.99 – 5.85
ORP (mV) -222 – -38 185 – 401 186 – 301 185 – 294
Iron (mg/L) < 0.005 – 0.0212 < 0.005 – 0.0211 < 0.005 < 0.005
Magnesium (mg/L) 6.33 – 7.93 6.32 – 7.89 6.50 – 7.96 6.28 – 7.97
Calcium (mg/L) 40.3 – 49.3 40.2 – 49.1 39.6 – 48.8 40.1 – 48.8
1: Ozone residual for the raw well line was not taken.
Iron, magnesium, calcium, alkalinity, pH, bromide, and conductivity were unaffected by the pilot
at each of the sampling locations over the entire period of study. Ozonation of the groundwater
increased the levels of ORP, DO, dissolved ozone residual, temperature, and sulfate concentration,
and decreased the concentration of sulfide. As reflected in the water quality results, the ORP of
Page 92
74
the ozone skid was maintained from 200 mV to 300 mV to promote proper oxidation of the
groundwater and prevent issues associated with carbon deterioration in the pilot columns. GAC
filtration then further reduced the turbidity, ORP, temperature, dissolved ozone residual and DO
of the supplied water.
The temperature was increased by the ozone skid on average by 19% as compared to the raw
groundwater supply, resulting the water in the ozone skid to reach up to 30oC periodically and
decrease the efficiency of ozone solubility. This was remedied by increasing the amount of wasted
flow, which allowed for more water to cycle in and out of the ozone skid and reduce the increase
in contact tank water temperature. Contacting in the GAC columns would also further reduce the
water temperature on average by 2% and 3% for the HPC-830 and FS-400 columns as compared
to the influent from the ozone skid. Turbidity monitored from the ozone skid had increased on
average by 25% as compared to the raw well water, and such an increase in turbidity was most
likely caused by bubbles attributed to the oversaturation of DO in the contact tank. The degradation
of aqueous ozone oversaturated the water in the contact tank and GAC columns with DO, resulting
in the concentration of DO in either sampling location to range from 18 to 31 mg/l in the contact
tank depending on the operating conditions of the ozone generator. Effluent from the HPC-830
and FS-400 columns also averaged a 7% and 6% reduction in their respective DO concentrations
as compared to the ozone skid. Turbidity from the ozone skid was then reduced by the HPC-830
and FS-400 columns on average by 57% and 65%, respectively. Sulfide was consumed by the
oxidation of the water by ozone, which is evident in the minor increases to the observed sulfate
concentration post-ozonation and the 97% removal of total sulfide in the effluent of the ozone skid.
Page 93
75
DBP Precursor Results
The determination of DBP precursor reduction by the integrated ozone-GAC pilot was completed
through the monitoring of DOC and UV254. SUVA was then calculated after the fact with the
previously investigated DOC and UV254 measurements to determine the organic fractionation. To
understand the relationship between the DOC and UV254 measurements taken from the pilot
columns over the duration of the study, the relation was plotted for the HPC-830 and FS-400 pilot
columns, as shown in Figure 5-11 and Figure 5-12.
Figure 5-11: Relativity of DOC vs UV254 for the HPC-830 Pilot Column
Page 94
76
Figure 5-12: Relativity of DOC vs UV254 for the FS-400 Pilot Column
The relationship between DOC and UV254 in natural waters is very close (Brandstetter and Sletten,
1966). The reported r-squared value for HPC-830 and FS-400 columns were 0.879 and 0.851,
resulting in a positive correlation between the NOM results for the integrated ozone-GAC study.
Additionally, the DOC and UV254 results as monitored from the UCF groundwater, ozone skid and
two GAC pilot columns in terms of runtime are presented in Figure 5-13 and Figure 5-14.
Page 95
77
Figure 5-13: DOC Concentration Results from the Integrated Ozone-GAC Pilot Study
Figure 5-14: UV254 Results from the Integrated Ozone-GAC Pilot Study
Page 96
78
Fluctuations observed in the resulting DOC and UV254 measurements from the integrated ozone-
GAC pilot are due to the varying well water quality within the UCF wellfield. Performance of the
ozone generator in reducing the DOC and UV254 of the influent flow was constant through the
study, however the performance of the GAC columns to remove DOC and UV254 from the influent
of the ozone skid decreased as the study progressed. Ozonation of the UCF groundwater water
initially reduced the DOC and UV254 on average by about 0.42 mg/l and 0.048 cm-1, respectively,
resulting in initial reductions of approximately 20% and 63%. Ozonation of the groundwater was
more efficient at reducing UV254 as compared to DOC, which would suggest that ozonation of the
UCF groundwater was better suited to degrade the aromatic, UV absorbent fraction of NOM
supplied in the UCF groundwater as opposed to the non-humic fraction or organics. Further
treatment of the ozonated water through GAC filtration with the HPC-830 and FS-400 pilot
columns reduced the DOC and UV254 substantially, however the performance of the treatment
decreased as the study progressed. This decrease in performance can also be observed through the
DOC and UV254 breakthrough curves for either pilot column, of which are included in Figure 5-
15 and Figure 5-16.
Page 97
79
Figure 5-15: GAC Column Breakthrough of UV254 from the Integrated Ozone-GAC Pilot Study
Figure 5-16: GAC Column Breakthrough of DOC from the Integrated Ozone-GAC Pilot Study
Page 98
80
Breakthrough was observed in units of cumulative EBVs and was calculated relative to the influent
DOC and UV254 as observed from the ozone generator’s contact tank through use of Equation 2-
12. Initial breakthrough for either columns began at approximately 1500 EBVs. The HPC-830
pilot column surpassed 50% DOC breakthrough at 5700 EBVs and 50% UV254 breakthrough at
4100 EBVs, while the FS-400 pilot column surpassed 50% DOC and UV254 breakthrough at 5000
EBVs and 4900 EBVs. On average, effluent from the HPC-830 pilot column contained 0.0016 cm-
1 more UV254 and 0.0869 mg/L less DOC than the FS-400 Carbon column. In the final 1000 EBVs
of the study, the HPC-830 carbon column averaged 62% UV254 breakthrough and 52% DOC
breakthrough while the FS-400 carbon column averaged 56% UV254 breakthrough and 57% DOC
breakthrough. Additional pilot column treatment efficiency in terms of pilot column effluent DOC
concentrations can be observed in Figure 5-17 and Figure 5-18.
Page 99
81
Figure 5-17: FS-400 Pilot Column Operation to DOC Exhaustion
Figure 5-18: HPC-830 Pilot Column Operation to DOC Exhaustion
Page 100
82
The FS-400 and HPC-830 pilot columns were estimated to be operable for approximately 30,000
EBVs and 35,000 EBVs prior to the occurrence of DOC breakthrough exhaustion. As such, the
HPC-830 pilot column would exhaust soon after the FS-400 pilot column were to exhaust if both
columns were allowed to operate for maximum bed volumes to reach total exhaustion. Additional
pilot column treatment life-expectancy estimations in terms of pilot column effluent UV254
breakthrough over their extended uses can be observed in Figure 5-19 and Figure 5-20.
Figure 5-19: FS-400 Pilot Column Estimated Operation to UV254 Exhaustion
Page 101
83
Figure 5-20: HPC-830 Pilot Column Estimated Operation to UV254 Exhaustion
The FS-400 and HPC-830 pilot columns were estimated to reach total bed UV254 exhaustion at
approximately 35,000 EBVs and 25,000 EBVs, respectively. As such, the FS-400 pilot column
would exhaust for UV254 breakthrough around 10,000 EBVs after exhaustion of the HPC-830 pilot
column if both columns could operate for maximum bed volumes to reach total exhaustion. Further
quantification of NOM for the piloted process can be observed in Figure 5-21, which displays the
resulting SUVA results for the integrated ozone-GAC pilot at each of the sampling locations.
Page 102
84
Figure 5-21: SUVA of the Integrated Ozone-GAC Pilot
SUVA results for the UCF groundwater would suggest that the water source mainly contained
non-humic and humic organic matter during operation of the integrated ozone-GAC pilot.
However, after ozonation and GAC filtration, the resulting SUVA values would suggest that the
organic content of sampled water shifted to become more non-humic in content.. This would again
suggest that the integrated ozone-GAC process has a high removal efficiency for humic organic
matter and a low removal efficiency for non-humic organic matter. This difference in NOM
treatability can potentially impact the formations of DBPs.
As such, the HPC-830 carbon column proved to be more efficient in reducing DOC while the FS-
400 carbon column was more efficient in reducing UV254. Additionally, the FS-400 pilot column
is expected to treat both DOC and UV254 for around the same amount of EBVs. In contrast, the
Page 103
85
HPC-830 pilot column is estimated to exhaust for UV254 well before it is to exhaust for DOC. This
difference in treatability between different types of NOM fractions can have a large impact on the
reduction efficiency for TTHM formations. It would be suggested that the carbon type for the
master planning of future UCF treatment systems be chosen with DOC treatability in mind, as
oxidation of the supply will reduce a large fraction of humic organics in the supply, so DOC
remediation will be a higher priority for the designed GAC contactors.
DBP Formation Results
Periodic DBP formation experimentation was conducted on aliquots sampled from the UCF
groundwater, ozone contact tank, and both GAC pilot columns through the duration of the
integrated ozone-GAC pilot study. The occurring dates for specific DBP experimentation
conducted on the pilot can be viewed in Table 5-7. Additionally, water quality results for free
chlorine, turbidity, temperature, and pH of the samples studied during DBP experimentation are
included in APPENDIX A.
Table 5-7: Dates of DBP Experimentation for the Ozone-GAC Pilot Study.
DBP FP Sample Date TTHM HAA5
24-hr Formation 48-hr Formation 48-hr Formation
November 23rd - X X
January 13th - X X
January 18th G/O/X G/O/X O/X
January 27th G/O/X G/O/X O/X
February 8th X X X
February 15th X X X
February 24th X X X
G: UCF Aerated Groundwater; O: Ozone Generator; X: Pilot Column
Page 104
86
TTHM and HAA5 formation at 48-hours of incubation were monitored through the entirety of the
study to observe the changes in the reduction of DBPs after ozonation and GAC filtration.
Formation of TTHMs at 24-hours of incubation were also monitored for the GAC columns for the
second half of the study. The average chlorine residuals for the aerated UCF groundwater, ozone
generator effluent (ozone skid) and two GAC pilot columns at 24-hours and 48-hours of incubation
at 30oC are included in Table 5-8.
Table 5-8: Chlorine Reduction of the Integrated Ozone-GAC Pilot
Sample Dose
(mg/l Cl2)
0-hr
Residual
(mg/l Cl2
Initial %
CL2
Reduction
24-hr
Residual
(mg/l Cl2)
% CL2
Reduction
at 24-hr
48-hr
Residual
(mg/l Cl2)
% CL2
Reductio
n at 48-hr
Raw1 7.3 2.7 63 0.67 91 0.23 97
Ozone Skid 5.2 2.5 51 1.1 78 0.58 89
HPC-830 3.9 2.1 47 1.6 60 1.2 69
FS-400 3.8 2.0 48 1.1 71 0.90 76
1: Raw results indicate formation potential results for the UCF groundwater supply.
Ozonation and GAC filtration of the UCF groundwater greatly reduced the required chlorine dose
to supplement a residual between 0.20 mg/l Cl2 to 1.00 mg/l Cl2. On average, the integrated process
required 3.4 mg/l Cl2 less than the UCF groundwater, and 1.3 mg/l Cl2 less than the ozone generator
effluent. After 48-hours of incubation, the average chlorine residual from the raw, HPC-830 and
FS-400 column samples were reduced by 97%, 69% and 76%, respectively. Implementation of an
integrated process would drastically reduce the required amount of chlorine that UCF would have
to introduce to the water supply, which would suggest that DBP formation in the PWS and costs
associated with the purchasing of chemicals would both be reduced. Additionally, the integrated
process would allow for a more sustainable chlorine residual in the UCF PWS, as the decay of
chlorine residual from the pilot column effluent encountered less reduction than the raw and
Page 105
87
ozonated samples. Average TTHM and HAA5 formations at 24-hours and 48-hours of incubation
are included in Table 5-9.
Table 5-9: DBP Formation Experimentation Results of the Integrated Ozone-GAC Pilot Study
Sample
Average
Chlorine Dose Average TTHMs Average HAA5s
Dose (mg/l Cl2)
24-hr TTHM
Formation
(ppb)
48-hr TTHM
Formation
(ppb)
48-hr HAA5
Formation (ppb)
Raw1 7.3 83 95 40
Ozone Skid 5.2 75 91 44
HPC-830 3.9 42 46 19
FS-400 3.8 49 54 22
1: Raw samples were collected from the UCF well influent line and aerated overnight.
As compared to the average formations of TTHMs and HAA5s observed from the chlorinated and
aerated UCF groundwater, the ozone generator effluent, HPC-830 and FS-400 pilot columns
reduced the formation of TTHMs at 48-hours of incubation on average by 4.2%, 49% and 43%,
respectively. The formation of HAA5s at 48-hours of incubation were also reduced on average by
the HPC-830 and FS-400 pilot columns by 52% and 43%, respectively. Before being treated by
the integrated process, the formation potential for TTHMs of the aerated groundwater exceeded
the MCL for TTHMs by approximately 15 ppb. Post-treatment by the integrated process, TTHM
formation was reduced by half. Additionally, the HAA5 formation potential of the aerated
groundwater was already under the MCL; however, the integrated process was also able to reduce
its formation by half. Displayed in Figure 5-22 are the speciation of THMs analyzed from DBP
experimentation completed on sampled effluent from the pilot columns over the course of the
integrated study.
Page 106
88
Figure 5-22. THM FP and Speciation for the Integrated Ozone-GAC study at 48-hours
The general water quality and DBP formation potential of the aerated UCF groundwater used as
reference for the analysis can be found in APPENDIX A. The major speciation of THMs from the
effluent of the pilot columns was chloroform, followed closely by DBCM. This would suggest that
trace amounts of bromide in some form are available in the supply, however they are not available
in a high enough concentration to form brominated DBPs in large quantities. Formation of TTHMs
at 48-hours of incubation analyzed from effluent from the FS-400 pilot column were consistently
higher than formations observed from effluent of the HPC-830 column by an average of 16%, or
7.2 ppb. Additionally, effluent from both pilot columns remained below the MCL for TTHMs
throughout the entirety of the study. Initial TTHM analysis on the pilot column effluent revealed
formations of TTHMs below 10 ppb. However, after seven weeks of operation the formation of
TTHMs at 48-hours of incubation had increased to approximately 43 ppb and 54 ppb for the HPC-
Page 107
89
830 and FS-400 pilot columns, respectively. After Week 8 and beyond the surpassing of 50% DOC
and UV254 breakthrough, effluent from both pilot columns contained formations of TTHMs which
remained between 40 ppb and 70 ppb. This plateauing in column TTHM formation may display a
shift from adsorption to biological mode of treatment by the columns, however further analysis
was not completed. Additionally, the average reduction of TTHMs from the effluent of the HPC-
830 and FS-400 pilot columns after Week 8, as compared to the average groundwater formation
potential results collected in mid-January, 2021, were 54 ppb and 62 ppb, respectively. On average,
and in relation to the influent stream, the HPC-830 column removed 44% of TTHMs and 38% of
HAA5s, while the FS-400 column removed 40% of TTHMs and 26% of HAA5s at 48-hours of
incubation. The reduction of individual THM speciation formations observed from the HPC-830
and FS-400 pilot column effluents can also be observed in Figure 5-23 and Figure 5-24.
Figure 5-23: Impact on THM Speciation by the HPC-830 Pilot Column
Page 108
90
Figure 5-24: Impact on THM Speciation by the FS-400 Pilot Column
Concentrations are shown as either a positive concentration, displaying a removal of the
constituent after treatment, or a negative concentration, displaying an increase in the constituent
after treatment. It is to be noted that formations of bromoform were detected below the MDL of
the instrument (at > 0.7 ppb) so conclusions on the removal proficiency of the integrated process
for the compound could not be made. Chloroform was discovered to be the THM with the highest
removal rate and BDCM was found to be added to the system after treatment by the integrated
treatment process pilot. From Week 1 to the Week 13, the removal efficiency by the integrated
process for chloroform and DBCM was reduced from 70 ppb and 15 ppb to approximately 40 ppb
and near zero, respectively. However, bromide analysis completed on the UCF groundwater shows
that the ambient concentration of bromide in the supply was less than 0.005 mg/l, and the observed
formations of brominated THMs in the DBP formation experimentation yielded results that would
Page 109
91
align with these results. This would suggest that the risks to public health attributed from the
consumption of brominated DBPs would be minimal. To determine the efficiency of either pilot
column to reduce TTHMs over their extended use, relations between estimated TTHM formation
concentrations at predicted EBVs of operation can be observed in Figure 5-25.
Figure 5-25: Pilot Column EBVs to TTHM Exhaustion
The FS-400 and HPC-830 pilot columns were also estimated to surpass the MCL for TTHMs at
approximately 15,000 EBVs and 22,500 EBVs, respectively. This would suggest that the HPC-
830 carbon type would be more efficient at reducing DBP formations for a longer period of
operation as compared to the FS-400 carbon type if both columns were allowed to operate until
total TTHM MCL exhaustion. To satisfy this claim, the TTHMs and coinciding DOC and UV254
measurements taken at the time of formation analysis for both carbon types are included in Figure
5-26.
Page 110
92
Figure 5-26: Pilot Column UV254 (above) and DOC (below) to TTHM Exhaustion
Page 111
93
The average effluent DOC and UV254 values resulting from the ozone generator were 2.1 mg/l and
0.028 cm-1, respectively. These observed values were in close approximation to the estimated pilot
column DOC and UV254 values at TTHM exhaustion from Figure 5-26, which were 1.9 mg/l for
both pilot columns and 0.030 cm-1 for the HPC-830 pilot column and 0.032 cm-1 for the FS-400
pilot column. As such, the estimations made in the previously estimated model of EBVs to TTHM
exhaustion for either column is more probable, as the estimated DOC and UV254 levels at the time
of exhaustion coincide with the actual effluent ozone generator NOM results. Additionally, the
resulting 48-hour speciation and formation of HAA5s sampled throughout the duration of the
integrated ozone-GAC study are included in Figure 5-27.
Figure 5-27: HAA Formation of the Integrated Ozone-GAC Pilot at 48-hours of Incubation
Page 112
94
Effluent from the ozone generator averaged higher HAA5 concentrations as compared to the
aerated UCF groundwater, however both sampling locations produced HAA5s below the MCL of
60 ppb. Initial DBP formation experimentation conducted on the effluent water of the pilot
columns showed formations of HAA5s below the concentration of 5 ppb for either carbon type.
From Week 8 to Week 10, a spike in HAA5 concentration had occurred during a coinciding rise
in UV254 breakthrough, which rose from 35% to 50%. This spike in HAA5 concentration and
UV254 breakthrough from approximately 4100 EBV to 5000 EBV (coinciding to approximately
200 to 300 hours of runtime) coincided to the HAA5 concentrations for the HPC-830 and FS-400
carbon columns increasing from 13 ppb to 32 ppb and 16 ppb to 30 ppb, respectively. During this
same period, the formation of TTHMs increased from 43 ppb to 57 ppb for the HPC-830 column
and from 54 ppb to 61 ppb for the FS-400 column. In the final four weeks and as compared to the
average HAA5 formation potential of the aerated UCF groundwater, the HPC-830 column
removed 38% of HAA5s at 48-hours of incubation, while the FS-400 column removed 26% of
HAA5s at 48-hours of incubation. On average, the HPC-830 column was observed to reduce 1.7
ppb more HAA5s on average as compared to the FS-400 column. Further observations on the
reduction of HAA5s by the integrated process for either pilot column can be observed in Figure 5-
28 and Figure 5-29.
Page 113
95
Figure 5-28: Impact on 48-hour HAA Speciation for the HPC-830 Pilot Column
Figure 5-29: Impact on 48-hour HAA Speciation for the FS-400 Pilot Column
Page 114
96
Removal efficiency for the main species of HAAs formed by the integrated process reduced as the
study progressed for both pilot columns. From Week 1 to Week 8, the removal of TCA was
sustained at approximately 15 ppb, however from Week 8 to Week 11, the removal efficiency of
TCA fell from approximately 15 ppb to near zero for both pilot columns. Overall, the HPC-830
pilot column was more effective at removing HAA5s as compared to the FS-400 pilot column,
however both pilot columns operated admirably to reduce formations of HAA5s to concentrations
well below the MCL. From Week 8 to the end of the piloting period, both pilot columns were
producing trace amounts of DBAA, however the formations did not exceed 5 ppb.
Carbon Results
Extended use of the pilot columns within a treatment system utilizing an advanced oxidation
process through ozonation resulted in alterations to the chemical characteristics of the HPC-830
and FS-400 carbon types through impact to the hardness, iodine number and apparent density.
Such changes for the top and bottom six inches of either pilot column can be observed in Table 5-
10.
Table 5-10: Characteristics of Carbon Types at Start and Finish
Carbon
Condition Carbon Type
Iodine Number
(mg/g)
Hardness
(Abrasion Number) Apparent Density (g/cc)
Virgin Carbon HPC-830 1000 (min) >80 0.27 (min), 0.37 (max)
FS-400 1050 (min) 75 0.54
Exhausted
Carbon
HPC-
830
Top 860 60 0.37
Bottom 790 79 0.57
FS-400 Top 780 77 0.58
Bottom 820 85 0.60
Page 115
97
As compared between the top and bottom six-inches of either pilot column, the hardness of the
HPC-830 and FS-400 carbon columns was reduced by 8 Abrasion Number (AN) and 19 AN.
However, when compared to the stock characteristics of the carbon types, the hardness of the FS-
400 column increased and the hardness of the HPC-830 decreased. The impact on hardness of the
carbon could be attributed to the oxidizing capacity of the water, as the influent to the pilot columns
carried a residual of ozone that was depleted by the time water exited the pilot columns. The iodine
numbers of both carbon types were also reduced by 175 for the HPC-830 carbon type and 250 for
the FS-400 carbon type. Apparent density of either carbon type also increased, with the bottoms
of either pilot columns being denser than the top portions. This may have occurred because the
flow of the system forced the fines from the tops to the bottoms of the pilot columns, compacting
the carbon at the bottom. Impacts on the apparent density can also be attributed to the design of
the pilot column casings themselves and may not be a factor when applied to full-scale application
as GAC contactors retain different hydraulic characteristics. Additional changes to particle
distribution for the top and bottom six inches of the pilot columns can be observed in Figure 5-30
and Figure 5-31.
Page 116
98
Figure 5-30: Exhausted Column Top and Bottom Particle Distributions
Figure 5-31: Exhausted Pilot Column Percent Finer Distribution Curves
Page 117
99
Figure 5-30 and Figure 5-31 both reveal a shift of larger particles from the top to the bottom of the
GAC pilot beds, and loss of small size carbon fines in the bottom sections of either pilot column.
Additionally, the percent finer curves for the top sections of either carbon type display better “well-
graded” profiles when compared to the percent finer curves of their associated bottom sections.
This is perhaps because the columns were not backwashed during the ozone-GAC study period.
Finer activated carbon particle sizes allow better access to the surface area and faster adsorption
kinetics; however, a lower effective size will have a higher pressure drop and will filter smaller
particles which can result in a higher backwash frequency compared to GAC with a higher
effective size.
Quality Control and Quality Assurance
Quality control and quality assurance was completed for both studies presented in the prior results.
Precision control charts for the DOC, UV254 and DBP formation results from the integrated ozone-
GAC study can be observed in Figure 5-32, Figure 5-33, Figure 5-34 and Table 5-11, and for the
stand-alone ozonation study can be observed in Figure 5-35, Table 5-12, and Table 5-13. Values
above the warning and critical limits were due to the detection limits of monitoring equipment and
other known factors, and the resulting values were not included in the prior analysis. Many UV254,
DOC and TTHM measurements that failed the precision control charts were also low level, which
causes the data to be more prone unusually high RPD values while comparing duplicates to the
actual results, resulting in disingenuous calculations. As such, some data that was found to exceed
the warning and critical levels were judged to be valid for presentation. Percent recovery results
were proven to be valid when the measured spikes were between 80% - 120%. HAA5 results sent
to Advanced Environmental Laboratories, Inc. (Altamonte Springs, Fl) and carbon results from
Page 118
100
Calgon Carbon laboratory (Moon Township, Pa) were also deemed valid as they corresponded to
current National Environmental Laboratory Accreditation Program (NELAC) standards and/or
state certification programs where applicable, per technical reports provided by the associated
laboratories.
Figure 5-32: Precision Control Chart for DOC Results of the Integrated Ozone-GAC Study
Page 119
101
Figure 5-33: Precision Control Chart for UV254 Results from the Integrated Ozone-GAC Study
Figure 5-34: Precision Control Chart for TTHM Results from the Integrated Ozone-GAC Study
Page 120
102
Table 5-11: Historical TTHM Percent Recovery data for the Integrated Ozone-GAC Study
Sample and Date TTHM (ppb) Spike (ppb) Recovery (%)
Column A 48 (1/13) 38.5 245 103
Column A 48 (1/15) 47.6 236 94
Column B 48 (1/15) 59.9 234 87
Column A 48 (1/27) 64.0 236 86
Column B 48 (1/27) 69.0 270 101
Column B 24 (2/8) 57.0 262 103
Column B 24 (2/24) 49.0 261 106
Figure 5-35: Precision Control Chart of TTHM Dupes from the Stand-alone Ozonation Study
Page 121
103
Table 5-12: Historical TTHM Percent Recovery data from the Stand-alone Ozonation Study
Sample and Date TTHM (ppb) Spike (ppb) Recovery (%)
Ozone #2 24hr (1/27) 76.6 270.6 97%
Ozone #3 24hr (1/27) 71.2 251.7 90%
Ozone #4 48hr (2/3) 86.3 271.0 92%
Ozone #5 48hr (2/5) 83 279 98%
Ozone #1 24hr (2/25) 78.4 283.2 102%
Table 5-13: Historical UV254 RPD from the Stand-alone Ozonation Study
Sample and Date UV254 (cm-1) Replicate RPD (%)
Ozone #5 (February 8) 0.0181 0.0181 0.00
Ozone #5 (February 25) 0.0199 0.0198 0.50
Page 122
104
CHAPTER 6. CONCLUSIONS
An evaluation on the efficiency of two potable water treatment processes, including a stand-alone
ozonation process and an integrated ozonation and GAC filtration process, was completed. Such
processes were operated and studied to determine the treatment efficiency for either process to
reduce DBP precursors and minimize formations of DBPs through operation of the pilot unit
installed at the UCF WTP. General conclusions and recommendations for future master planning
of the UCF PWS are as follows.
DOC and UV254 Composition
Natural organics supplied within the UCF groundwater, as monitored through DOC and UV254,
varied from 1.95 mg/l to 4.51 mg/l and from 0.0641 cm-1 to 0.0914 cm-1, respectively, and averaged
2.57 mg/l and 0.0765 cm-1 for either of the previously stated parameters. Analysis on the organic
composition of UCF Well 3 and Well 4 completed by UCF ESEI on January 3, 2019, also as
measured through DOC and UV254, were 2.03 mg/l and 0.0830 cm-1, respectively. These values
lie within the range of DOC and UV254 observed during the integrated ozone-GAC study and are
in agreement with historic Utility-collected water quality results.
Implementation of the stand-alone ozonation study upon the UCF groundwater was determined to
be effective in degrading its incoming fraction of UV254 absorbent NOM and ineffective at
reducing its incoming DOC fraction of NOM. As compared to source water conditions, the lowest
dose of ozone reduced levels of DOC and UV254 by 4% and 61%, respectively, while the highest
dose of ozone reduced levels of DOC and UV254 by 18% and 78%, respectively. Performance for
the lowest and highest doses of ozone trial to reduce NOM from the source water was found to be
Page 123
105
unacceptable, as more than half of the UV254 and a small portion of DOC was degraded by the
either ozone dosage. Additionally, a higher dose of ozone than those trialed in this study was
required to further reduce DBP formation would cause the utility to incur higher O&M costs,
making a stand-alone ozonation process unaffordable. As such, further exploration on a stand-
alone ozonation process was not pursued.
NOM treatment by the integrated treatment process proved to effectively reduce the amount of
DBP precursors supplied in the UCF groundwater source. This was completed through use of an
applied dose of approximately 7.2 mg/l O3, resulting in approximately 0.37 mg/l O3 residual. As
such, a dose of ozone ample to break through the chemical demand of the groundwater supply
resulted in sufficient NOM degradation. Ozone oxidation of the groundwater supply also allowed
for an improved performance of NOM reduction by the pilot-scale GAC pilot columns as
compared to the existing conditions and a prior GAC pilot study conducted by ESEI at the UCF
WTF revealed that ozone oxidation enhance precursor removal.
Comparatively between the two piloted carbon types, the HPC-830 carbon column proved to be
more efficient in reducing DOC while the FS-400 carbon column was more efficient in reducing
UV254 absorbent organics. If operated continuously, the HPC-830 and FS-400 pilot columns would
exhaust for DOC breakthrough at approximately 35,000 EBVs and 30,000 EBVs, respectively.
The HPC-830 and FS-400 pilot columns would also exhaust for UV254 breakthrough at an
estimated 25,000 EBVs and 40,000 EBVs, respectively. However, these estimates are based on
the data collected for the pilot operations period. The operating times on these analogous studies
are longer, and after the beds were biologically active; it is not clear as to whether the UCF pilot
beds had transitioned to a full biological mode. It is noted that the DBP formation potentials did
level off at the end of the study, which could be indicative that the beds may have been in the
Page 124
106
process of transitioning to biological mode, which would possibly extend projected EBVs. The
DOC exhaustion approximation projected in this evaluation, although lower in projection, also
align with results from studies performed by other Central Florida potable water purveyors
studying the effectiveness of an integrated ozone-GAC process to treat groundwater containing
DBP precursors (Lamoureaux 2013; Reiss 2016). In those prior studies performed by the City of
Sanford (Lamoureux, 2013) and Polk County Utilities Division (Reiss 2016), influent DOC
exhaustion was projected to (in general) occur after approximately 50,000 EBVs.
As compared to the stand-alone ozonation process, the integrated ozone-GAC process was
determined to more effective in minimizing DBP precursors from the UCF groundwater supply.
The integrated process was also able to sustainably reduce both DOC and UV254 fractions of NOM
for extended operation, which outperformed results from the stand-alone ozonation treatment
study and the previous UCF ESEI stand-alone GAC treatment study.
DBP Formation Findings
As of mid-January, the UCF groundwater supply TTHM and HAA5 formation potential after
incubating 48-hours at 30oC averaged 95 ppb and 40 ppb, respectively. A review of DBP results
from early-2021 were much lower than results presented by UCF ESEI in early-2019, where the
UCF Wells 3 and 4 contained TTHM formation potentials, averaged between the two wells, at
approximately 200 ppb at 48-hours of incubation. As the observed formation potential for TTHMs
observed in mid-January of 2021 remain well above the MCL, a requirement for further
remediation by the Utility will need to be fulfilled.
The stand-alone ozonation study was found to ineffectively minimize the formation of TTHMs, as
the highest dose of ozone trialed resulted in TTHM formation that remained above the MCL for
Page 125
107
both trials. Results from the stand-alone ozonation process indicated that the formation of TTHMs
after 24-hours and 48-hours of incubation, and at an average between both trials, would be reduced
from 97 ppb to 81 ppb and from 80 ppb to 65 ppb as the dose of ozone was increased. This equated
to an approximate 19% and 16% reduction of TTHMs, as compared between the lowest and highest
doses of ozone at 24-hours and 48-hours, respectively. Additionally, the formation of HAA5s were
unaffected at lower doses and slightly increased at the highest dose of ozone. The further reduction
in DBP formation through the production of an ozone dose higher than those trialed in this study
was not investigated, since ozonation is highly energy intensive and the power requirement to
achieve such a dose may prove to be costly to the Utility. Additionally, higher doses of ozone
applied to the Utility’s PWS may increase HAA5 formation profoundly, resulting in the
requirement for further remediation.
The integrated ozone-GAC process successfully reduced the formation of TTHMs and HAA5s
well after 50% DOC and UV254 breakthrough had been achieved by the pilot columns. The HPC-
830 and FS-400 columns were estimated to reduce their associated TTHMs to below the MCL for
approximately 22,500 EBVs and 15,000 EBVs, respectively. As expected, the HPC-830 carbon
type’s affinity to efficiently reduce the DOC fraction of NOM present in the supply after ozone
oxidation allowed the carbon to also actively minimize the formation of the DBP for an extended
period of time, as compared to the FS-400 pilot column which more efficiently treated for the
UV254 fraction of NOM and was found to exhaust for TTHMs much sooner. In relation to the
influent stream, the HPC-830 column removed 44% of TTHMs and 38% of HAA5s at 48-hours
of incubation, while the FS-400 column removed 40% of TTHMs and 26% of HAA5s at 48-hours
of incubation for the final 1000 EBVs of the study.
Page 126
108
As compared to the stand-alone ozonation treatment process, the integrated ozone-GAC treatment
process was again determined to be effective in reducing the formation of TTHMs and HAA5s
from the source waters. As related to the TTHM formation of the UCF groundwater supply, TTHM
reduction by the integrated treatment process for the HPC-830 and FS-400 carbon types
outperformed results obtained by the ozonation treatment processes by about 20% at 7,000 EBVs
of treatment.
Page 127
109
CHAPTER 7. RECOMMENDATIONS
Given the results derived from the integrated ozone-GAC pilot study, it was recommended to the
UCF Utility that future master planning for potable water treatment processes on campus should
include an integrated ozone-GAC treatment process. If the scenario were to be chosen, then it
would also be recommended to the Utility that the exploration on the installation of an additional
reservoir before the GAC process and ozonation process to contain pre-ozonated supplies also be
pursued. This suggested reservoir would require a contact time equal to the ozone decay rate of
the supply, which was estimated to be no more than 30-minutes and no less than 10-minutes. This
would allow for the oxidation capacity of the flow to be minimized before reaching the GAC
process, prolonging the life of the carbon within the GAC contactors and possibly lowering the
carbon replacement frequency. Carbon results support this recommendation, as it was shown that
the oxidative capacity of the pre-ozonated flow that was loaded into the GAC pilot columns
lowered the hardness of the tops and bottoms of the HPC-830 and FS-400 carbon types by 24%
and 9.5%, respectively.
It is also recommended that the Utility explore a design concept that allows for operation of an
integrated ozone-GAC process of treatment to include full-scale GAC contactors arranged in a
series configuration. A series configuration typically includes a lead and a lag contactor which
includes two contactors on-line and in series during operation. The primary bed, or “worker bed”,
operates in the position of lead vessel and removes most of the DBP precursors fragments produced
by the ozonation process, usually to acceptable levels, just by itself. The second bed, or “polisher
vessel”, acts as the lag vessel and provides a safeguard against premature breakthrough or
exhaustion from the worker bed. The primary unit can be taken off-line at the first hint of
breakthrough leakage, or at a preset level of breakthrough leakage (i.e., 50% of inlet
Page 128
110
concentration), or at total exhaustion (inlet contaminant level equals effluent level). Once taken
off-line, the vessel may be rebedded and placed into the polisher position. The design of such a
system should incorporate the proper appurtenances, piping, valves, and connections to allow the
switching of the worker and polisher vessels when needed. Additionally, it would be important to
consider the underdrain and header systems available for use in GAC vessels now provided on the
market, as new and improved designs allow for improved flow distribution. The underdrain system
controls the distribution of flow entering and exiting the vessel, and consistent and uniform
distribution of flow is required during operation of the GAC vessels. If improper underdrain and
header systems were to be implemented, then poor flow distribution may result in faster
breakthrough and increased media usage rates and channeling may also occur if large filters are
operated too slowly. To assist in distributed flow conditioning, internal cone distributors are
available on the market which provides for an improved media utilization. Figure 7-1 displays an
engineer drawing of an activated carbon adsorber vessel with a conical distributor in use at Polk
County Utilities Division’s Central Regional Water Producing Facility that treats central Florida
groundwater using an integrated ozone-GAC process.
Page 129
111
Figure 7-1: Example of an Engineered GAC Vessel with an Internal Cone Distributor
Source: Polk County Utilities Division, Winter Haven, Florida.
Page 130
112
APPENDIX. WATER QUALITY RESULTS
Page 131
113
Table A-1: Water Quality Results for the Combined Ozone-GAC Pilot DBP Experimentation
Dosing
Date Sample
Initial
Chlorine
Dose (mg/L
Cl2)
Free Chlorine (mg/L Cl2) pH Temperature (oC) Turbidity (NTU)
0-hr 24-hr 48-hr 0-hr 24-hr 48-hr 0-hr 24-hr 48-hr 0-hr 24-hr 48-hr
November
23, 2020
Skid 5.25 2.90 - 0.63 7.52 - 7.79 29.0 - 26.7 1.02 - 0.10
HPC 3.00 1.62 - 1.09 7.39 - 7.59 29.9 - 27.1 0.23 - 0.12
F400 2.75 0.95 - 0.27 7.37 - 7.68 29.9 - 27.1 0.29 - 0.15
December
21, 2020
Skid 5.25 2.28 - 0.73 7.69 - 7.69 28.7 - 28.7 0.47 - 0.47
HPC 3.00 1.34 - 0.26 7.71 - 7.71 29.0 - 29.5 0.26 - 0.28
January 13,
2021
Raw 7.50 2.94 - 0.37 7.57 - 8.27 21.6 - 27.5 0.36 - 0.10
Skid 5.00 2.00 - 0.25 7.64 - 7.71 25.4 - 26.1 0.13 - 0.08
HPC 5.00 2.22 - 1.65 7.47 - 7.64 25.5 - 26.4 0.12 - 0.09
F400 5.00 2.68 - 1.26 7.46 - 7.76 26.1 - 26.7 0.17 - 0.13
January 15,
2021
Skid 5.25 2.76 1.64 0.85 7.65 - 7.63 25.7 - 27.4 0.25 - 0.12
HPC 3.75 2.40 2.60 1.83 7.45 - 7.51 26.0 - 27.6 0.11 - 0.10
F400 4.75 1.52 0.99 0.79 7.52 - 7.56 25.8 - 26.6 0.12 - 0.08
January 18,
2021
Raw 7.50 2.98 0.67 0.53 7.49 - 8.16 18.8 - 27.5 0.68 - 0.12
Skid 5.25 2.12 0.76 0.53 7.61 - 7.63 24.6 - 25.0 0.31 - 0.21
HPC 3.75 1.62 0.92 0.76 7.47 - 7.59 24.4 - 25.7 0.15 - 0.10
F400 3.75 1.64 0.66 0.59 7.49 - 7.68 24.5 - 25.6 0.15 - 0.12
Page 132
114
Dosing
Date Sample
Initial
Chlorine
Dose (mg/L
Cl2)
Free Chlorine (mg/L Cl2) pH Temperature (oC) Turbidity (NTU)
0-hr 24-hr 48-hr 0-hr 24-hr 48-hr 0-hr 24-hr 48-hr 0-hr 24-hr 48-hr
January 27,
2021
Skid 5.25 3.08 1.16 0.43 7.41 7.75 7.70 27.4 25.2 25.7 0.57 0.11 0.12
HPC 4.25 2.74 1.54 1.50 7.42 7.61 7.70 28.2 26.4 27.4 0.18 0.08 0.08
F400 4.25 2.58 1.34 1.08 7.47 7.63 7.41 27.5 26.5 26.8 0.17 0.09 0.12
February 8,
2021
Skid 5.00 2.68 0.98 0.67 7.58 7.69 7.61 25.1 28.1 27.1 0.45 0.12 0.11
HPC 3.75 2.14 1.36 1.09 7.43 7.65 7.60 25.5 28.1 27.8 0.17 0.11 0.15
F400 3.75 2.14 1.04 0.80 7.45 7.66 7.26 25.3 27.8 27.0 0.11 0.10 0.10
February 15,
2021
HPC 3.75 2.18 1.38 1.00 7.33 7.66 7.63 26.8 26.2 26.4 0.16 0.14 0.13
F400 3.75 2.36 1.63 1.44 7.36 7.56 7.65 27.2 26.0 26.6 0.13 0.13 0.12
February 24,
2021
HPC 3.25 2.08 1.28 1.13 7.31 7.54 7.51 26.9 26.8 27.2 - 0.27 0.14
F400 3.25 1.69 1.13 0.92 7.33 7.59 7.58 26.8 27.8 28.1 - 0.14 0.15
Page 133
115
Table: A-2: Water Quality of Stand-alone Ozonation DBP Experimentation
Dosing Date Sample
Initial
Chlorine Dose
(mg/L Cl2)
Free Chlorine (mg/L Cl2) pH Temperature (oC) Turbidity (NTU)
0-hr 24-hr 48-hr 0-hr 48-hr 0-hr 48-hr 0-hr 48-hr
January
27th, 2021
#1 5.00 2.62 0.88 0.64 7.41 7.80 27.4 25.7 0.57 0.12
#2 5.00 2.90 0.98 0.70 7.78 7.78 24.5 25.8 0.35 0.11
#3 5.00 2.98 1.10 0.70 7.75 7.76 24.9 26.2 0.42 0.25
#4 5.00 2.92 1.22 0.88 7.69 7.61 21.6 27.2 0.20 0.10
#5 5.00 2.84 1.50 1.16 7.68 7.80 27.2 27.2 0.13 0.13
March 1st,
2021
#1 5.00 2.78 0.92 0.66 7.58 7.76 26.8 26.8 0.18 -
#2 5.00 2.86 1.06 0.71 7.49 7.58 27.3 27.5 0.33 -
#3 5.00 2.80 1.19 0.81 7.41 7.56 25.8 27.5 0.35 -
#4 5.00 3.28 1.34 0.98 7.50 7.49 27.5 27.4 0.89 -
#5 5.00 2.92 1.31 0.97 7.49 7.43 26.4 27.3 0.26 -
Page 134
116
REFERENCES
Abbt-Braun, G., Lankes, U., and Frimmel, F.H. (2004). Structural Characterization of Aquatic
Humic Substances - The Need for a Multiple Method Approach. Aquatic Science, Vol.
66, 151-170.
Aiken, G.R., McKnight, D.M. and Thorn, K.A. (1992). Isolation of hydrophilic organic acids
from water using nonionic macroporous resins. Organic Geochemistry, Vol. 18, Iss. 4,
567-573.
Babi, K.G., Koumenides, K.M., Nikolaou, A.D., Makri, C.A., Tzoumerkas, F.K., Lekkas, T.D.
(2007). Pilot study of the removal of THMs, HAAs and DOC from drinking water by
GAC adsorption. Desalination, Vol. 210, 215–224.
Baghoth, S.A., Sharma, S.K., Amy, G.L. (2010). Tracking natural organic matter (NOM) in
drinking water treatment plant using fluorescence excitation-emission matrices and
PARAFAC. Water Research, Vol. 45, Iss. 2, 797–809.
Baird, R.B., Eaton, A.D. and Rice, E.W. (2017). Standards and Methods for the Examination of
Water and Wastewater. American Public Health Association; American Water Works
Association, Water Environment Federation.
Bellar, T. A., J. J. Lichtenberg, and R. C. Kroner. (1974). The occurrence of organohalides in
chlorinated drinking waters. Journal American Water Works Association, Vol. 66, 703-
706.
Berry, M., Taylor, C., King, W., Chew, Y., Wenk, J. (2017). Modelling of Ozone Mass-Transfer
through Non-Porous Membranes for Water Treatment. Water, Vol. 9, 452.
Bhatnagar, A., Sillanpää, M., (2017). Removal of natural organic matter (NOM) and its
constituents from water by adsorption – A review. Chemosphere, Volume 166, 497–510.
Brandstetter, A., Sletten, R.S., Mentler, A., Wenzel, W.W. (1996). Estimating dissolved organic
carbon in natural waters by UV absorbance (254 nm). Zeitschrift für Pflanzenernährung
und Bodenkunde, Vol. 159, Iss., 6, 605-607.
Bush, P. and Johnson, R. (1988). Ground-water hydraulics, regional flow, and groundwater
development of the Floridian Aquifer in Florida and in parts of Georgia, South Carolina,
and Alabama, U.S. Governing Printing Office, Washington, D.C., USGS Professional
Paper 1403-C.
Calgon Carbon. (2015). Data Sheet, HPC Series Super 830 Mass830 Ultra 830 Granular
Activated Carbon. Calgon Carbon, a Kurary Company. DS-HPC83015-EIN-E1.
Calgon Carbon. (2019). Data Sheet, Filtrasorb 400 Granular Activated Carbon. Calgon Carbon,
a Kurary Company. DS-FILTRA40019-EIN-E1.
Page 135
117
Can, Z.S., Gurol, M. (2003). Formaldehyde Formation During Ozonation of Drinking Water.
Ozone: Science & Engineering, Vol. 25, 41-51.
Cedergren, M. I., A. J. Selbing, O. Lofman, and B. A. J. Kallen. (2002). Chlorination byproducts
and nitrate in drinking water and risk for congenital cardiac defects. Environmental
Research, Vol. 89, 124-130.
Chaukura, N., Marais, S.S., Moyo, W., Mbali, N., Thakalekoala, L.C., Ingwani, T., Mamba,
B.B., Jarvis, P. and Nkambule, T.T.I., (2020). Contemporary issues on the occurrence
and removal of disinfection byproducts in drinking water - A review. Journal of
Environmental Chemical Engineering, Vol. 8, 103659.
Chen, W. J., and C. P. Weisel. 1998. Halogenated DBP concentrations in a distribution system.
Journal American Water Works Association, Vol. 90, 151-163.
Cheng, W., Dastgheib, S.A., Karanfil, T. (2005). Adsorption of dissolved natural organic matter
by modified activated carbons. Water Research, Vol. 39, 2281–2290.
Chowdhury, F.L., Bérubé, P.R., Mohseni, M. (2008). Characteristics of Natural Organic Matter
and Formation of Chlorinated Disinfection By-Products from Two Source Waters that
Respond Differently to Ozonation. Ozone: Science & Engineering Vol. 30, 321–331.
Clark, R.M. and Sivaganesan, M. (1998). Predicting Chlorine Residuals and Formation of
TTHMs in Drinking Water. Journal of Environmental Engineering, Vol. 124, 1203-1210.
Duranceau, S.J., Trupiano, V.M., Lowenstine, M., Whidden, S., and Hopp, J. (2010). Innovative
Hydrogen Sulfide Treatment Methods: Moving Beyond Packed Tower Aeration. Florida
Water Resources Journal, 4-14.
Edzwald, J.K. (2011). Water Quality and Treatment: A handbook on drinking water. McGraw-
Hill, AWWA, 10.1-10.97.
Environmental Systems Engineering Institute. (2019a). “UCF Utilities and Engineering Services
Water System, Disinfection By-Product Formation Potential Assessment.” Orlando, FL:
University of Central Florida Department of Civil, Environmental and Construction
Engineering, Environmental Systems Engineering Institute (ESEI).
Environmental Systems Engineering Institute. (2019b). “Utilities and Engineering Services
Water Plant Spray Aeration Demonstration and GAC Treatment Assessment for DBP
Control.” Orlando, FL: University of Central Florida Department of Civil, Environmental
and Construction Engineering, Environmental Systems Engineering Institute (ESEI).
EPA. (United States Environmental Protection Agency). 1998. Stage 1 Disinfectants and
Disinfection byproducts rule. Federal Register 63:69389-69476.
EPA. (United States Environmental Protection Agency). 2007. National Water Program Fiscal
Year 2007 Guidance. US EPA Web site at
http://water.epa.gov/resource_performance/planning/upload/FY2007_NWPG_Final_Web
.pdf
Page 136
118
EPA. (2012). EPA Drinking Water Advice Note – Advice Note No 4. Version 2. Disinfection
By-Products in Drinking Water. Office of Environmental Enforcement, EPA.
EPA. (1979a). National Interim Primary Drinking Water Regulations; Control of
Trihalomethanes in Drinking Water; Final Rule. Federal Register, Vol. 44, No. 231, 40
CFR Part 141.
EPA. (1979b). Oxidation Techniques in Drinking Water Treatment: Drinking Water Pilot Project
Report llA Advanced Treatment Technology. Office of Drinking Water, EPA-570/9-79-
020 CCMS-111.
EPA. (1998). National Primary Drinking Water Regulations: Disinfectants and Disinfection
Byproducts. Federal Register 63 FR 69390, Vol. 63, No. 241.
EPA. (1999). Alternative Disinfectants and Oxidants Guidance Manual, Office of Water, US
Environmental Protection Agency: Washington, D.C..
EPA. (2006). National Primary Drinking Water Regulations: Stage 2 Disinfectants and
Disinfection Byproducts Rule; Final Rule. Federal Register 71 FR 388, Vol. 71, No. 2.
Escobar, I.C., Hong, S., Randall, A.A. (2000). Removal of assimilable organic carbon and
biodegradable dissolved organic carbon by reverse osmosis and nanofiltration
membranes. Journal of Membrane Sciences, Vol. 175, Iss., 1, 1-17.
Espie, S., Marsili, L., MacGregor S.J. and Anderson, J.G., (2001). Investigation of dissolved
ozone production using plasma discharges in liquid. Pulsed Power Plasma Science 2001.
28th IEEE International Conference on Plasma Science and 13th IEEE International
Pulsed Power Conference. Digest of Papers, Vol. 1, 616-619.
Federal Register. (1979). National Interim Primary Drinking Water Regulations, Control of
Trihalomethanes in Drinking Water, Final Rule; U.S. EPA, Federal Register, Vol. 44,
No. 231.
Guardian Manufacturing. (2021). Ozone Generator – Installation & Operation Manual. Cocoa,
FL: Guardian Ozone: Safer Food Through Science & Engineering.
Gunten, U.V. (2003). Ozonation of drinking water: Part II. Disinfection and by-product
formation in presence of bromide, iodite and chlorine. Water Research, Vol. 37, Iss. 7,
1467-1487.
Hoigné, J. (1998). Chemistry of Aqueous Ozone and Transformation of Pollutants by Ozonation
and Advanced Oxidation Processes. Berlin, Heidelberg: Springer, Quality and Treatment
of Drinking Water II, The Handbook of Environmental Chemistry, Vol. 5.
Hua, G. and Reckhow, D.A. (2008). DBP Formation during chlorination and chloramination:
Effect of reaction time, pH, dosage and temperature. Journal of AWWA, Vol. 100, 82-95.
Huang, C.-H., Chen, C.-Y., Wang, G.-S. (2019). Temperature Dependence of characteristics of
organic precursors, bromide, and disinfection byproduct formation. Science of the Total
Environment, Volume 662, 746-754.
Page 137
119
Huang, W.J. and Chen, L.Y. (2004). Assessing the Effectiveness of Ozonation Followed by
GAC Filtration in Removing Bromate and Assimilable Organic Carbon. Environmental
Technology, Vol. 25, No. 4, 403-412.
Hudson, N., Baker, A., Reynolds, D. (2007). Fluorescence analysis of dissolved organic matter
in natural, waste, and polluted waters – a review. River Research Application, Vol. 23,
631-649.
IACR. (2004). IARC Working Group on the Evaluation of Carcinogenic Risks to Humans. Some
drinking-water disinfectants and contaminants, including arsenic. Monographs on
chloramine, chloral and chloral hydrate, dichloroacetic acid, trichloroacetic acid and 3-
chloro-4-(dichloromethyl)-5-hydroxy-2(5H)-furanone. IARC Monographs on the
Evaluation of the Carcinogenic Risks to Humans, Vol. 84, 269–477.
Iriarte-Velasco, U., Álvarez-Uriarte, J., Chimeno-Alanís, N. and González-Velasco J. (2008).
Natural Organic Matter Adsorption onto Granular Activated Carbon: Implications in the
Molecular Weight and Disinfection Byproducts Formation. Industrial & Engineering
Chemistry Research, Vol. 47, 7868-7876.
Karnik, B.S., Davies, Baumann, S.H. and Masten, S.J. (2005). The effects of combined
ozonation and filtration on disinfection by-product formation. Water Research, Vol. 39,
2839-2850.
Kim, H.C. and Yu, M.J., (2005). Characterization of natural organic matter in conventional water
treatment processes for selection of treatment processes focused on DBPs control. Water
Research, Vol. 39, 4779-4789.
Kim, J., Kang, B. (2008). DBPs removal in GAC filter-adsorber. Water Research Vol. 42, 145–
152.
Krasner, S. W., H. S. Weinberg, S. D. Richardson, S. J. Pastor, R. Chinn, M. J. Sclimenti, G. D.
Onstad, and A. D. Thruston, Jr. (2006). The occurrence of a new generation of
disinfection byproducts. Environmental Science & Technology Vol. 40, 7175-7185.
Kruithof, J.C., Meijers, R.T. and Schippers, J.C. (1993). Formation, restriction of formation and
removal of bromate. Water Supply, Vol. 11, Nos. 3/4, 331-342.
Lamoureux, T.R. (2013). “Ozone and GAC Treatment of a Central Florida Groundwater for
Sulfide and Disinfection By-Product Control.” Orlando, FL: University of Central Florida
Thesis Archives.
Liang, L. and Singer, P.C. (2003). Factors Influencing the Formation of Relative Distribution of
Haloacetic Acids and Trihalomethanes in Drinking Water. Environmental Science and
Technology, Vol. 37, 2920-2928.
Li, J., Topphoff, M., Fischer, K. and Gmehling, J. (2001). Prediction of Gas Solubilities in
Aqueous Electrolyte Systems Using the Predictive Soave-Redlich-Kwong Model.
Industrial & Engineering Chemistry Research, Vol. 40, Iss. 16, 3703-3710.
Page 138
120
Loeb, B., Thompson, C., Drago, J., Takahara, H. and Baig, S. (2012). Worldwide ozone capacity
for treatment of drinking water and wastewater: a review. The Journal of the
International Ozone Association, Vol. 34, Iss. 1, 64-77.
Lou, J.-C., Yang, C.-Y., Chang, C.-J., Chen, W.-H., Tseng, W.-B., Han, J.-Y. (2014). Analysis
and removal of assimilable organic carbon (AOC) from treated drinking water using a
biological activated carbon filter system. Journal of Environmental Chemical
Engineering, Vol. 2, 1684–1690.
Lyn, T.L., and Taylor, J.S. (1992). Assessing Sulfur Turbidity Formation Following Chlorination
of Hydrogen Sulfide in Groundwater. Journal, American Water Works Association, Vol.
84, Iss. 9, 103-112.
Mandell, M.J., Reiss, H., (1975). Scaled particle theory: Solution to the complete set of scaled
particle theory conditions: Applications to surface structure and dilute mixtures. Journal
of Statistical Physics, Vol. 13, 113–128.
Marais, S.S., Ncube, E.J., Msagati, T.A.M., Mamba, B.B., Nkambule, T.T.I. (2018). Comparison
of natural organic matter removal by ultrafiltration, granular activated carbon filtration
and full scale conventional water treatment. Journal of Environmental Chemical
Engineering, Vol. 6, 6282–6289.
Michael, G.E., Miday, R.K., Bercz, J.P., Miller, R.G., Greathouse, D.G., Kraemer, D.F., and
Lucas, J.B. (1981). Chlorine dioxide water disinfection: a prospective epidemiology
study. Environmental Health, Vol. 36, Iss. 1, 20-27.
Mills, A., Belghazi, A., Rodman, D. and Hitchens, H. (1996). The removal of bromate from
potable water using granular activate charcoal. Journal of the Institution of Water and
Environmental Management, Vol. 10, No. 3, 215-217.
Molnar, J., Agbaba, J., Dalmacija, B., Klašnja, M., Watson, M. and Kragulj, M. (2012). Effects
of Ozonation and Catalytic Ozonation on the Removal of Natural Organic Matter from
Groundwater. Journal of Environmental Engineering, Vol. 138, 804–808.
Morris, R.D., Aude, A.M., Angelillo, I.F., Chalmers, T.C. and Mosteller, F. (1995). Chlorination
by-products and cancer: a meta-analysis. American Journal of Public Health, Vol. 82,
955–963.
Najm, I.N. and Krasner, S.W., (1995) Effects of bromide and NOM on by-product formation.
Journal of American Water Works Association, Vol. 87, 106–115.
Nieuwenhuijsen, M.J., (2000). Chlorination disinfection byproducts in water and their
association with adverse reproductive outcomes: a review. Occupational and
Environmental Medicine, Vol. 57, 73–85.
Nkambule, T.I., Krause, R.W.M., Haarhoff, J. and Mamba, B.B. (2012). A three-step approach
for removing organic matter from South African water sources and treatment plants.
Physics and Chemistry of the Earth, Parts A/B/C, Vol. 50-52, 132-139.
Page 139
121
OSHA. (1994). Occupational Safety and Health Standards. United States Department of Labor,
29 CFR 1910.1000.
Owen, D.M., Amy, G.L., Chowdhury, Z.K., Paode, R., McCoy, G. and Viscosil, K. (1995).
NOM characterization and treatability. Journal of American Water Works Association,
Vol. 86, 46-56.
Owen, D.M., Amy, G.L., and Chowdhary Z.K. (1993). Characterization of Natural Organic
Matter and Its Relationship to Treatability. Denver, CO: American Water Works
Association Research Foundation.
Pizzi, N. G. (2005). Water treatment operator handbook. Denver, CO: American Water Works
Association.
Plasma Technics. (2021). PTI Plasma Technics Application Guide. Racine, WI: PTI.
Postigo, C., Emiliano, P., Barceló, D. and Valero, F.N. (2018). Chemical characterization and
relative toxicity assessment of disinfection byproduct mixtures in a large drinking water
supply network. Journal of Hazardous Materials, Vol. 359, 166-173.
Rye, R.O., Back, W., Hanshaw, B.B., Rightmire C.T., and Pearson, F.J. (1981). The origin and
isotropic composition of dissolved sulfide in groundwater from carbonate aquifers in
Florida and Texas. Geochimica et Cosmochimica Acta, Vol. 45, Iss. 10, 1941-1950.
Reckhow, D.A., Knocke, W.R., Kearney, M.J., Parks, C.A. (1991). Oxidation of Iron and
Manganese by Ozone. Ozone: Science & Engineering, Vol. 13, 675–695.
Reiss Engineering. (2016). “Polk County, Florida Central Regional Water Production Facility
Pilot Study Report.” PCU Project 2014-2-10-0. Winter Haven, FL: Reiss Engineering, 20
3rd St. S.W., Suite 202, Winter Haven, FL 33880.
Rice, R. (1999). Ozone in the United States of America – State-of-the-art. The Journal of the
International Ozone Association, Vol. 21, No. 2, 99-118.
Richardson, S.D. (2002). The role of GC-MS and LC-MS in the discovery of drinking water
disinfection by-products. Journal of Environmental Monitoring, Vol 4, 1-9.
Richardson, S. D., J. E. Simmons, and G. Rice. (2002). Disinfection byproducts: The next
generation. Environmental Science & Technology, Vol. 36, 198-205.
Rodriguez, M. J., and J. B. Serodes. 2001. Spatial and temporal evolution of trihalomethanes in
three water distribution systems. Water Research, Vol. 35, 1572-1586.
Rodriguez, M. J., M. Huard, and J. B. Sérodes. 2004. Experimental study of the formation of
chlorination by-products in potable water of Quebec City, Canada. Bulletin of
Environmental Contamination & Toxicology, Vol. 72, 211-218.
Rook, J. J. (1974). Formation of Haloforms during Chlorination of Natural Waters. Water
Treatment Examination, Vol. 23, 234-243.
Page 140
122
Rook, J.J. (1976). Haloforms in Drinking Water. Journal of American Water Works Association,
Vol. 68, No. 3, 168-172.
Ruddick, J.A., Villeneuve, D.C., Chi I and Valli, V.E. (1983) A teratological assessment of four
trihalomethanes in the rat. Journal of Environmental Science Health, Vol. 18, Iss. 3, 333–
49.
Sadiq, R., and M. J. Rodriguez. 2004. Disinfection by-products (DBPs) in drinking water and
predictive models for their occurrence: a review. Science of the Total Environment, Vol.
321, 21-46.
Sahu, O., Singh, N. (2019). Significance of bioadsorption process on textile industry wastewater.
The Impact and Prospects of Green Chemistry for Textile Technology, 367–416.
Salameh, E., Tarawneh, A. and Al-Raggad, M. (2016). Origin of high bromide concentration in
the water sources in Jordan and in the Dead Sea water. Arabian Journal of Geosciences,
Vol. 9, No. 414.
Schaefer, C.E., Nguyen, D., Culina, V.M., Guelfo, J., Kumar, N. (2020). Application of Rapid
Small-Scale Column Tests for Treatment of Perfluoroalkyl Acids using Anion Exchange
Resin and Granular Activated Carbon in Groundwater with Elevated Organic Carbon.
Industrial & Engineering Chemistry Research, Vol. 59, 16832-16837.
Schers, G., Walker, P. and Condran, M. (2015). The Future of Water Supply in Florida – Case
Study, Water Online.
Scovazzo, P., Camper, D., Kieft, J., Poshusta, J., Koval, C. and Noble, R. (2004). Regular
Solution Theory and CO2 Gas Solubility in Room-Temperature Ionic Liquids. Industrial
& Engineering Chemistry Research, Vol. 43, 6855–6860.
Sepúlveda, N. and Tiedema, C. (2012). Groundwater flow and water budget in the surficial and
Floridan aquifer systems in east-central Florida. Reston, VA: U.S. Geological Survey,
USGS Numbered Series, 1132.
Shukla, T. and S.J. Duranceau. Disinfection By-Products Control for a Small System. Florida
Section American Water Works Association 2019 Fall Conference: Building a Resilient
Utility. Omni Orlando Resort at Champions Gate, FL (December 8-12, 2019).
Siddiqui, M., Zhai, W., Amy, G., Mysore, C., (1996). Bromate ion removal by activated carbon.
Water Research Vol. 30, No. 7, 1651–1660
Sillanpää, M. (2015). Natural organic matter in water: Characterization and treatment methods.
Elsevier Inc, IWA Publishing, 33-39.
Silva, L.M.D., Jardim, W.F. (2006). Trends and strategies of ozone application in environmental
problems. Química Nova, Vol. 29, 310–317.
Smith, M.K., Randall, J.L., Read, E.J. and Stober, J.A. (1992). Developmental toxicity of
dichloroacetate in the rat. Teratology, Vol. 46, Iss. 3, 217-223.
Page 141
123
Sohn, J., Amy, G. and Yoon, Y. (2006). Bromide ion incorporation into brominated disinfection
by-products. Water, Air & Soil Pollution, Vol. 174, 265-277.
Sontheimer, H., Crittenden J. and Summers, R.S. (1988). Activated Carbon for Water Treatment,
2nd ed.. Forschungstelle Engler – Bunte-Institute, Universität Karlsruhe, Karlsruhe,
Germany.
Speth, T. and Miltner, R. (1998). Technical Note: Adsorption capacity of GAC for synthetic
organics. Journal of AWWA, Vol. 90, 171-174.
Tak, S. and Vellanki, B.P. (2018). Natural organic matter as precursors to disinfection
byproducts and its removal using conventional and advances processes: state of the art
review. Journal of Water Health, Vol. 16, Iss. 8, 681-703.
Thurman, E.M. (1985). Organic geochemistry of natural waters. Springer: Developments in
Biochemistry, 103-110.
WHO (2006). Guidelines for Drinking Water Quality First Addendum to Third Addition. World
Health Organization, Vol. 1.
Win, Y. (2000). Influence of oxidation of dissolved organic matter (DOM) on subsequent water
treatment processes. Water Research, Vol. 34, 2098–2104.
Woo, Y.-T., D. Lai, J. L. McClain, M. K. Manibusam, and V. Dellarco. 2002. Use of
mechanism-based structure-activity relationships analysis in carcinogenic potential
ranking for drinking water disinfection by-products. Environmental Health Perspectives,
Vol. 110, 75-87.
Wood, P.R. and Demarco, J. (1979). Treatment of Groundwater with Granular Activated Carbon.
Journal of American Water Works, Vol. 71, Iss. 11, 674-682.
World Health Organization (1993). Guidelines for drinking-water quality, 2nd edition, Volume
1: Recommendations. World Health Organization, Geneva.
Zhang, Y.-Q., Wu, Q.-P., Zhang, J.-M., Yang, X.-H., (2015). Removal of bromide and bromate
from drinking water using granular activated carbon. Journal of Water and Health, Vol.
13, 73–78.