Evaluation of Subsurface Exploration, Sampling, and Water-Quality-Analysis Methods at an Abandoned Wood-Preserving Plant Site at Jackson, Tennessee By WILLIAM S. PARKS, JOHN K. CARMICHAEL, and JUNE E. MIRECKI U.S. GEOLOGICAL SURVEY Water-Resources Investigations Report 93-4108 Prepared in cooperation with the U.S. Environmental Protection Agency, Region IV, Waste Management Division, North Superfund Remedial Branch Memphis, Tennessee 1993
Transcript
Evaluation of Subsurface Exploration, Sampling, and Water-Quality-Analysis Methods at an Abandoned Wood-Preserving Plant Site at Jackson, Tennessee
By WILLIAM S. PARKS, JOHN K. CARMICHAEL, and JUNE E. MIRECKI
U.S. GEOLOGICAL SURVEYWater-Resources Investigations Report 93-4108
Prepared in cooperation with the U.S. Environmental Protection Agency, Region IV, Waste Management Division, North Superfund Remedial Branch
Memphis, Tennessee 1993
U.S. DEPARTMENT OF THE INTERIOR BRUCE BABBITT, Secretary
U.S. GEOLOGICAL SURVEY DALLAS L PECK, Director
Any use of trade, product, or firm name in this report is for identification purposes only and does not constitute endorsement by the U.S. Geological Survey.
For additional information write to:
District Chief U.S. Geological Survey 810 Broadway, Suite 500 Nashville, Tennessee 37203
Copies of this report can be purchased from:
U.S. Geological Survey Books and Open-File Reports Section Federal Center, Box 25425 Denver, Colorado 80225
Summary and conclusions ..................................................... 20References cited ........................................................... 21
FIGURES
1. Map showing location of the American Creosote Worksabandoned plant site at Jackson, Tennessee ....................................... 3
2. Diagram showing geophysical log and lithology encountered in stratigraphic test hole Md:G-365 drilled at station 4 at the American Creosote Works abandoned plant site .................................. 6
3. Map showing potentiometric surface of the alluvial aquifer, March 1990 ..................... 74. Hydrographs showing water levels recorded in well Md:G-284
in the alluvial aquifer and well Md:G-326 in the Fort Pillow aquifer at the American Creosote Works abandoned plant site ............................ 8
5. Diagram showing Direct Push Technology piezocone and Hydrocone tools .................... 106. Diagram showing logs of point-stress data measured with the Direct
Push Technology piezocone tool and depths of ground-water samples collected with the Hydrocone tool at stations 2 and 5 at the American Creosote Works abandoned plant site .................................... 11
7. Diagram showing relation of toxicity (EC50) of contaminants in ground-water samples to depth below land surface at stations 2 and 5 at the American Creosote Works abandoned plant site ............................. 20
TABLES
1. Post-Cretaceous geologic units underlying the American CreosoteWorks abandoned plant site at Jackson, Tennessee ................................... 5
2. Hydraulic conductivities, lithologies, and relative densities of sediment collected with the Direct Push Technology (DPT) Hydrocone and piezocone tools, March 1991 ...................................... 12
Contents iii
Page3. Volatile organic compounds detected in ground-water samples
collected with the Direct Push Technology (DPT) Hydrocone tool and by pumping several monitoring wells, March 1991 ................................ 14
4. Polynuclear aromatic hydrocarbons, phenolic compounds (including pentachlorophenol), and nitrogen-containing heterocyclic compounds detected in ground-water samples collected with the Direct Push Technology (DPT) Hydrocone tool, by pumping several monitoring wells, and by pumping through a modified bit-auger, March-April 1991 .......................... 16
5. Phenol concentrations detected in ground-water samples collected with the Direct Push Technology (DPT) Hydrocone tool, by pumping several monitoring wells, and by pumping through a modified bit-auger, March-April 1991 .............. 18
6. Toxicity data for ground-water samples collected with the Direct Push Technology (DPT) Hydrocone tool, by pumping several monitoring wells, and by pumping through a modified bit-auger, March-April 1991 ..................... 19
CONVERSION FACTORS, VERTICAL DATUM, AND WELL-NUMBERING SYSTEMS
Multiply By To obtain
inchfootmileacre
2.5400.30481.6090.4047
centimetermeterkilometersquare hectometer
Sea level: In this report "sea level" refers to the National Geodetic Vertical Datum of 1929 a geodetic datum derived from a general adjustment of the first-order level nets of the United States and Canada, formerly called Sea Level Datum of 1929.
Station and well numbers: In this report, data-collection stations where subsurface methods were evaluated and water-quality- monitoring well numbers follow those assigned during the onsite Remedial Investigation/Feasibility Study (S&ME, Inc., 1988). However, continuous water-level observation wells and stratigraphic test holes are numbered using the U.S. Geological Survey, Water Resources Division, well-numbering system for Tennessee.
Tennessee District well-numbering system: Wells in Tennessee are identified according to the numbering system that is used by the U.S. Geological Survey, Water Resources Division. The well number consists of three parts:
(1) an abbreviation of the name of the county in which the well is located;
(2) a letter designating the 7 1/2-minute topographic quadrangle on which the well is plotted; quadrangles are lettered from left to right across the county beginning in the southwest corner of the county; and
(3) a number generally indicating the numerical order in which the well was inventoried.
For example, Md:G-284 indicates that the well is located in Madison County on the "G" quadrangle and is identified as well 284 in the numerical sequence.
iv Evaluation of subsurface exploration, sampling, and water-quality-analysis methods at an abandoned wood-preserving plant site at Jackson, Tennessee
ACRONYMS
ACW American Creosote Works, Inc.ASTM American Society for Testing and Materials
GC/PID Gas chromatography with photo-ionization detectionHPLC High-performance liquid chromatography
NRP National Research ProgramPAH Polynuclear aromatic hydrocarbonPCP Pentachlorophenol
RI/FS Remedial Investigation/Feasibility StudyUSEPA U.S. Environmental Protection Agency
USGS U.S. Geological SurveyVOC Volatile organic compound
Contents
Evaluation of Subsurface Exploration, Sampling, and Water-Quality-Analysis Methods at an Abandoned Wood-Preserving Plant Site at Jackson, Tennessee
By William S. Parks, John K. Carmichael, and June E. Mirecki
Abstract
Subsurface sampling using both Direct Push Technology (DPT) and a modified-auger drilling method were evaluated in 1991 by the U.S. Geological Survey (USGS) at the Ameri can Creosote Works, Inc. (ACW) abandoned plant site at Jackson, Tennessee. These meth ods were used to collect lithologic data and ground-water samples in an area known to be affected by subsurface creosote and pentachlo- rophenol (PCP) contamination. The ground- water samples were analyzed using (1) gas chromatography with photo-ionization detection (GC/PID), (2) high-performance liquid chro matography (HPLC), (3) CHEMetrics color- imetric phenol analysis, and (4) Microtox toxicity bioassay.
The DPT piezocone tool provided litho logic data at two onsite stations to a depth of penetration refusal which was about 35 feet below land surface. From these data, sampling depths were selected and ground-water samples were collected with the DPT Hydrocone tool. With the assistance of an auger rig, the sam pling depth of the Hydrocone tool was extended to about 65 feet below land surface by pushing the tool in advance of the augers once a preselected depth was reached. Follow ing the DPT work, a modified-auger method of ground-water-sample collection was tested. This method left doubt as to the integrity of
the samples collected once zones of contamina tion were penetrated.
Use of GC/PID and HPLC proved to be the most effective methods for analysis of ground-water samples for detection of creosote components, PCP, and other organic com pounds. Results produced using these methods showed that the highest concentrations of con taminants were detected at depths of less than about 35 feet below land surface. However, naphthalene and methylene chloride were detected in a few samples from depths of as deep as 135 feet below land surface. The CHEMetrics phenol method of analysis was not sensitive enough to definitively measure phenolic compounds in ground-water samples. Microtox-bioassay data indicated that toxicity associated with contaminants in the ground- water samples extended to depths of about 55 feet below land surface. Ground-water samples from depths of less than about 35 feet showed acute toxicity.
INTRODUCTION
American Creosote Works, Inc. (ACW) oper ated a wood-preserving plant at Jackson, Tennes see, for about 50 years (1930's until December 1981). Both creosote and pentachlorophenol were used in the wood-preserving process. Operations at this facility caused significant soil, ground-water, and surface-water contamination, and in 1984 the
Introduction
abandoned plant site was designated a U.S. Envi ronmental Protection Agency (USEPA) National Priorities List Superfund site. Although a Remedial Investigation/Feasibility Study (RI/FS) was conducted for the USEPA at the ACW site (S&ME, Inc., 1988), insufficient data existed to assess the associated effects on nearby surface waters or to provide an accurate description of the extent and characteristics of any offsite ground- water contamination. In 1990, the U.S. Geological Survey (USGS) began a cooperative investigation with the North Superfund Remedial Branch, Waste Management Division of the USEPA, Region IV, to determine and document lexicological effects on nearby surface waters, to delineate and characterize ground-water contamination in nearby offsite areas, and to assess the potential for water-supply contam ination.
Access to the offsite areas where the ground- water investigation was planned is limited because of low-lying, swampy terrain. In addition, the depths of possible contaminant migration deter mined during the work for the onsite RI/FS (S&ME, Inc., 1988) exceeded the capabilities of most small, light-weight drilling rigs. For these reasons, during March and April 1991, two subsur face exploratory methods for lithologic data collec tion and ground-water sampling were evaluated. Also, four methods for water-quality analysis were evaluated.
This report describes an onsite evaluation of subsurface exploratory and sampling methods. In addition, it includes a compilation of the lithologic and water-quality data collected and new informa tion about the hydrogeology at the ACW site. A description of the onsite evaluation of methods also was presented at the Hazardous Materials Control Resources Institute (HMC)/Superfund '92 Confer ence, held in Washington, D.C., December 1-3, 1992, and is published as an article in the confer ence proceedings (Parks and others, 1992).
which is approximately 60 acres in size, is bounded on the north by Central Creek, on the east by industrial properties, on the south by the Seaboard Railroad and the South Fork Forked Deer River, and on the west by Central Creek.
The ACW site is on the alluvial plain of the South Fork Forked Deer River, the major stream draining the Jackson area. The river flows gener ally from southeast to northwest where it passes close to the southwestern corner of the ACW site (fig. 1). Central Creek, a minor tributary to the South Fork Forked Deer River, flows generally westward from an urban area in west Jackson, through a commercial and industrial area, and along part of the northern border of the site. Near the northwestern corner of the site, the creek turns approximately 90 degrees, flowing southeastward along the site's western border and entering the South Fork Forked Deer River near the southwest ern corner of the site.
The terrain at the ACW site is flat, except for the relief provided by the stream channels, which is about 15 feet in the area. Land-surface altitudes range from about 340 feet above sea level along the South Fork Forked Deer River to about 350 feet near the northeastern corner of the site. The site is partially protected from flooding by levees on the west and south.
Areas to the west and south of the ACW site where the ground-water investigation was planned are on the swampy alluvial plain of the South Fork Forked Deer River and are subject to seasonal flooding. These areas are isolated from the site by Central Creek and the embankment of the Seaboard Railroad. Access to these offsite areas is along a utility line right-of-way that crosses the alluvial plain for a distance of about one-half mile from improved roads. For these reasons, the offsite areas generally are accessible only during dry times of the year.
SITE DESCRIPTION
The ACW abandoned plant site (fig. 1) is located in the southwestern part of the city of Jackson, Madison County, Tennessee. The site,
HYDROGEOLOGIC SETTING
Post-Cretaceous geologic units underlying the ACW site are the Clayton Formation, Porters Creek Clay, Old Breastworks Formation, and
Evaluation of subsurface exploration, sampling, and water-quality-analysis methods at an abandoned wood-preserving plant site at Jackson. Tennessee
TENNESSEE 89°
35°45'
""Jackson, Madison County
EXPLANATION
O Station 4 U.S. GEOLOGICAL SURVEY STRATIGRAPHIC TEST HOLE
Station 5 LOCATIONS OF SUB- (Wells 5S, SURFACE EXPLORATION 5M, 5D) EVALUATIONS AND
WELLS SAMPLED FOR WATER QUALITY
Well 3D WELL SAMPLED FOR WATER QUALITY
35°30'
88°45'
MADISON , COUNTY /
AmericanCreosote Works
abandoned plantsite
5 MILESj
5 KILOMETERS
Site boundary
Well 3D
Station 4U.S. HIGHWAY 45 BYPASS
AmericanWorks
abandoned N
i100 METERS
Base modified from S&ME, Inc., 1988
Figure 1. Location of the American Creosote Works abandoned plant site at Jackson, Tennessee.
Hydrogeologic setting 3
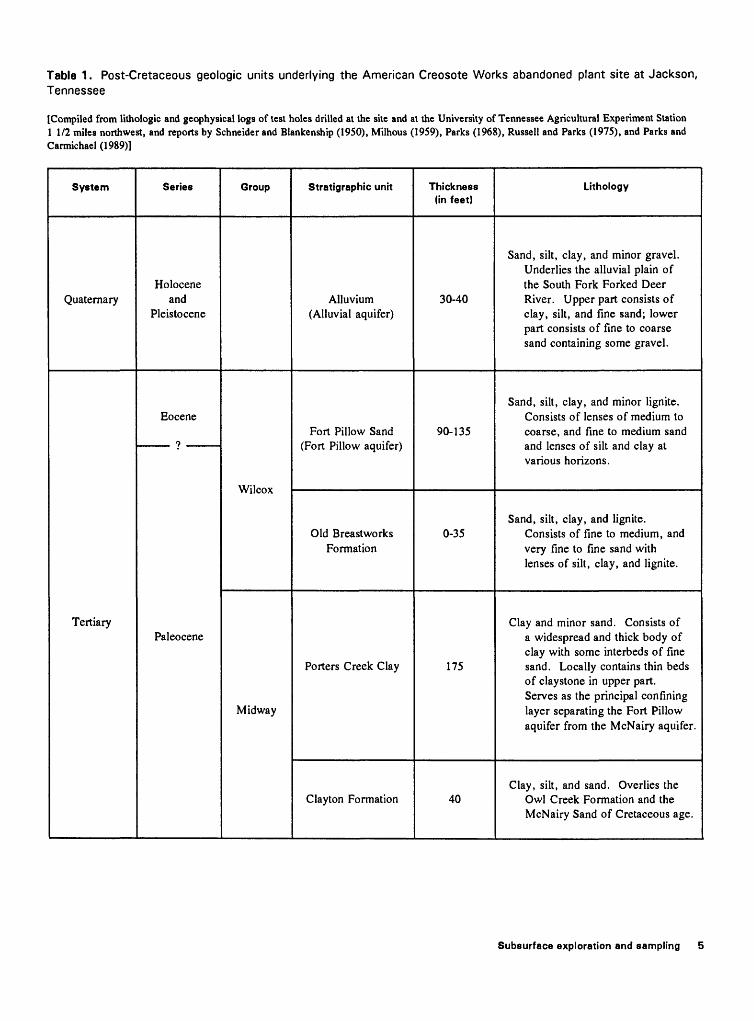
Fort Pillow Sand of Tertiary age and the alluvium of Quaternary age (table 1). The Fort Pillow Sand and alluvium consist primarily of unconsolidated and semi-consolidated sand with silt and clay layers at various stratigraphic horizons. These geologic units comprise the Fort Pillow aquifer (Parks and Carmichael, 1989) and alluvial aquifer. At the ACW site, the Fort Pillow aquifer and alluvial aquifer are not separated by a confining unit of any significant thickness or areal extent.
The uppermost part of the alluvium consists primarily of clay and silt with some interbedded fine sand and serves as a relatively thin (5 to 20 feet) upper confining unit for the alluvial aqui fer. The Clayton Formation and Porters Creek Clay consist predominantly of clay and serve as a relatively thick (about 215 feet) lower confining layer separating the Fort Pillow aquifer from the McNairy aquifer (table 1). The Old Breastworks Formation, between the top of the Porters Creek Clay and the base of the Fort Pillow Sand, consists largely of very fine sand with interbedded clay and probably serves more as a confining unit than as an aquifer. The base of the Fort Pillow aquifer ranges from about 125 to 155 feet below land surface at the ACW site. A geophysical log and the lithology encountered in a stratigraphic test well drilled by the USGS at station 4 (fig. 2) shows the geologic sequence beneath the ACW site just north of the highly contaminated area (fig. 1).
The alluvial aquifer at the ACW site is semi- confined. Water levels generally are high, rising to about 2 to 9 feet below land surface. In general, water-level altitudes in the alluvial aquifer range from about 343 feet above sea level in wells at the higher altitudes at the northeastern part of the site to about 337 feet above sea level in the southeast ern part near the South Fork Forked Deer River (fig. 3). Thus, ground-water flow in the alluvial aquifer generally is from northeast to southwest across the site toward the river.
Water levels were recorded continuously in well Md:G-284 screened from 25 to 35 feet in the alluvial aquifer, and well Md:G-326 screened from 134 to 154 feet in the Fort Pillow aquifer. Both of these wells are near the northeastern corner of the
ACW site (fig. 3). Hydrographs (fig. 4) show that water levels fluctuated similarly in both aquifers throughout the period of record (February 1990- May 1993). This similarity of water-level fluctua tions and the slight difference in hydraulic heads (less than 1 foot) in these wells indicate that the alluvial aquifer and the Fort Pillow aquifer respond as a single aquifer in the area of the ACW site.
SUBSURFACE EXPLORATION AND SAMPLING
Direct Push Technology (DPT) subsurface exploratory and ground-water sampling methods were evaluated by the USGS at the ACW site to assess their suitability for overcoming problems of accessibility and depth of exploration in the offsite areas. DPT was selected because the equipment is lightweight (rig weighs about 5,000 pounds) and portable (can be hauled behind a truck or bull dozer). In addition, DPT methods have been used successfully to depths greater than 200 feet below land surface in some areas (James P. Handley, In-Situ Technology, Inc., oral commun., 1991). Because of the advertised advantages, the USGS, working with personnel from In-Situ Technology, Inc., and Environmental Management Corporation (EMC), both of Orlando, Florida, developed a program to evaluate DPT methods at existing onsite stations 2 and 5 (fig. 1).
Stations 2 and 5 were selected for this evalua tion because they are downgradient from the highly contaminated area at the ACW site (fig. 1). Litho- logic and water-quality data also were available for these stations from stratigraphic test holes and from shallow, intermediate, and deep wells installed for the RI/FS (S&ME, Inc., 1988). As part of this evaluation, a USGS auger rig assisted with the DPT data collection and also was used to evaluate a modified-auger method of subsurface sampling, as described below.
Direct Push Technology Methods
Evaluation of DPT methods of lithologic and ground-water-quality data collection was conducted
4 Evaluation of subsurface exploration, sampling, and water-quality-analysis methods at an abandoned wood-preserving plant site at Jackson, Tennessee
Table 1. Post-Cretaceous geologic units underlying the American Creosote Works abandoned plant site at Jackson, Tennessee
[Compiled from lithologic and geophysical logs of test holes drilled at the site and at the University of Tennessee Agricultural Experiment Station 1 1/2 miles northwest, and reports by Schneider and Blankenship (1950), Milhous (1959), Parks (1968), Russell and Parks (1975), and Parks and Carmichael (1989)]
System
Quaternary
Tertiary
Series
Holocene and
Pleistocene
Eocene
?
Paleocene
Group
Wilcox
Midway
Stratigraphic unit
Alluvium (Alluvial aquifer)
Fort Pillow Sand (Fort Pillow aquifer)
Old Breastworks Formation
Porters Creek Clay
Clayton Formation
Thickness (in feet)
30-40
90-135
0-35
175
40
Lithology
Sand, silt, clay, and minor gravel. Underlies the alluvial plain of the South Fork Forked Deer River. Upper part consists of clay, silt, and fine sand; lower part consists of fine to coarse sand containing some gravel.
Sand, silt, clay, and minor lignite. Consists of lenses of medium to coarse, and fine to medium sand and lenses of silt and clay at various horizons.
Sand, silt, clay, and lignite. Consists of fine to medium, and very fine to fine sand with lenses of silt, clay, and lignite.
Clay and minor sand. Consists of a widespread and thick body of clay with some interbeds of fine sand. Locally contains thin beds of clay stone in upper part. Serves as the principal confining layer separating the Fort Pillow aquifer from the McNairy aquifer.
Clay, silt, and sand. Overlies the Owl Creek Formation and the McNairy Sand of Cretaceous age.
Subsurface exploration and sampling 5
Altitude of land surface: 344 feet above sea level
ce
az
oUl CD
Ul Ul
i i
0
20
40
60
80-
100 -
120-
140-
160-
180
200
220
240
7-ray (dashed)
Sp
o
o
LITHOLOGYClay, medium-gray to
moderate brownSand, very light-gray
to light-gray, fine- to coarse-grained; contains some
v pebbles________Sand, very light-gray
\
to grayish orange, fine- to coarse grained; contains some clay________
play, dark yellowish- brown
Sand, light gray to dusky yellow, fine- to coarse grained; contains some clay
Sand, light olive-gray, fine to medium- grained; contains interbeds of clay
Clay, dark-gray
Rock at about 203 feetClay, dark-gray
Total depth reached: 223 feet below land surface
EXPLANATION
7-ray (dashed)
Sp
TRACE OF GAMMA-RAY LOG
TRACE OF SPONTANEOUS POTENTIAL LOG
TRACE OF RESISTANCE LOG
Figure 2. Geophysical log and lithology encountered in stratigraphic test hole Md:G-365 drilled at station 4 at the American Creosote Works abandoned plant site. (Location shown on fig. 1.)
Evaluation of subsurface exploration, campling, and water-quality-analysis method* at an abandoned wood-preserving plant site at Jackson, Tennessee
U.S. HIGHWAY 45 BYPASS
Siie boundary
Md:G-284 Md:G-326
i i100 METERS Study area
Base modified from S&ME, Inc., 1988
EXPLANATION
-337 --- POTENTIOMETRIC CONTOUR Showsaltitude at which water level stood in wells. Dashed where approximately located. Contour interval 1 foot. Datum is sea level
Md:G-326
WELL IN WHICH WATER LEVELS WERE MEASURED
X WELL IN WHICH WATER LEVELS WERERECORDED CONTINUOUSLY AND NUMBER
DIRECTION OF GROUND-WATER FLOW
Figure 3. Potentiometric surface of the alluvial aquifer, March 1990.
Subsurface exploration and sampling 7
orZ
UI DC
< UI QU.
10
Md:G-284 Depth: 35 feet
FMAMJJASONDJFMAMJJASONDJFMAMJJASONDJFMAM
1990 1991 1992 1993
UI DC
0£. UI
I
O
Si<
10
Md:G-326 Depth: 154 feet
Missing record
FMAMJJASONDJFMAMJJASONDJFMAMJJASONDJFMAM
1990 1991 1992 1993
Figure 4. Water levels recorded in well Md:G-284 in the alluvial aquifer and well Md:G-326 in the Fort Pillow aquifer at the American Creosote Works abandoned plant site. (Location of wells shown in fig. 3.)
8 Evaluation of subsurface exploration, sampling, and water-quality-analysis methods at an abandoned wood-preserving plant site at Jackson. Tennessee
from March 17-26, 1991. The lithologic data was collected using a piezocone tool, an electric-cone penetrometer (ASTM-D3441) modified for the measurement of pore-water pressure-related data (fig. 5). This tool was pushed hydraulically as deep as possible at stations 2 and 5 (fig. 1) using a small trailer-mounted rig. As the tool was pushed, real-time data for point stress, sleeve friction, and pore pressure (fig. 5) were measured and recorded by a computer on the DPT rig. Following collec tion, these data were processed by another com puter in a support vehicle. Diagrams showing traces for the point-stress and sleeve-friction measurements were plotted, and lithology was interpolated by comparison with a data base of physical characteristics stored in the computer.
The DPT piezocone tool was capable of pene trating only to depths of about 35 feet, the depth of first refusal, at stations 2 and 5 because of high sediment densities encountered beneath the ACW site. When the piezocone tool reached refusal depth, it was removed from the ground, the DPT rig was moved, and the auger rig was set up over the same location. A small diameter borehole then was drilled using 3 1/4-inch inside-diameter (I.D.) hollow-stem augers to about 10 feet below the depth of first refusal of the piezocone tool. The augers were left in the ground, the auger rig was moved, and the DPT rig was repositioned over the augers. The piezocone tool was inserted through the augers to the bottom of the hole and an attempt was made to push the tool into the undisturbed interval ahead of the auger bit until refusal occurred again. It was found, however, that even with the assistance of the augers, the piezocone tool could not be pushed beyond the total depth augered. Further attempts to push the piezocone tool through the augers were abandoned.
Lithologies interpolated from the interval logged with the piezocone tool were evaluated to select depths for collection of water-quality samples. Six 1-foot sampling intervals were selected in the upper 36 feet at station 2, and five were selected at station 5, based on the interpolated lithologic data and the point-stress log (fig. 6). The sampling depths were selected at the tops and bottoms of fine-sand zones overlain and underlain by silt or clay. After determining the sample
intervals, the DPT rig was moved a few feet away from the first hole. Ground-water sampling then was conducted with a DPT Hydrocone, a cone-penetrometer-type tool (fig. 5). The Hydrocone tool was pushed to the selected depths and a sample for water-quality analysis was collected. After a sample was collected from the depth of refusal of the DPT equipment, an attempt was made to extend the depth of sampling using the auger rig. Sampling intervals below the 35-foot DPT depth of refusal were selected from natural gamma-ray geophysical logs made in stratigraphic test holes at stations 2 and 5 for the RI/FS (S&ME, Inc., 1988). Using the combined DPT/auger- assisted method, the depth of sample collection with the Hydrocone tool was successfully extended to 65 feet below land surface.
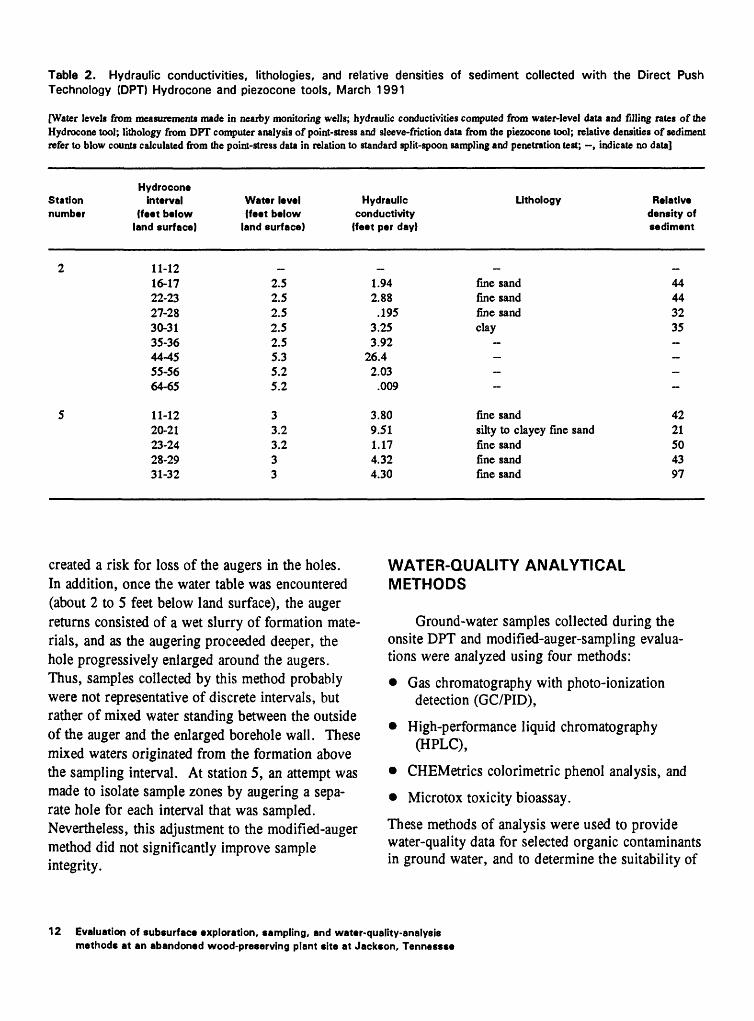
As the samples were collected with the Hydrocone tool, the filling rate of the sampler was recorded by the computer on the rig. From these data, a value for hydraulic conductivity was calcu lated for the sample interval by a computer pro gram using the method of Bouwer and Rice (1976). These hydraulic conductivity values (table 2) com bined with data from piezocone tests show that the alluvial aquifer consists of many discrete fine-sand zones having variable hydraulic conductivity. These fine-sand zones are separated by lenses of silty clay or clay presumably having lower hydrau lic conductivities.
Modified-Auger Method
Evaluation of a modified-auger method of sampling was conducted by the USGS from April 1-6, 1991, at stations 2 and 5 (fig. 1), after the DPT work was completed. For this evaluation, a trailer-mounted drilling rig was used to auger holes near the locations where the DPT tests were conducted. The holes were drilled using 3 1/4-inch I.D. hollow-stem augers. The lowest section in the auger string (bit auger) was modified by drilling 1/2-inch diameter holes along its entire length and by inserting a removable 5-foot long by 2-inch I.D. wire-wrapped stainless-steel well screen inside. At each station, a hole was progressively augered to approximately the same depths as the intervals
Subsurface exploration and sampling 9
Argon gas back pressure
Sleeve frictionmeasured
electronically
Porepressuresmeasured
electronically
Point stressmeasured
electronically
Water level sensor
Tip opens toexpose 24-inch,0.01-inch slotted
screen
PIEZOCONE TOOL
HYDROCONE TOOL
Figure 5. Direct Push Technology piezocone and Hydrocone tools. (Modified from schematics in In-Situ Technology, Inc., unpublished product literature.)
10 Evaluation of subsurface exploration, sampling, and water-quality-analysis methods at an abandoned wood-preserving plant site at Jackson, Tennessee
STATION 2 STATION 5
POINT STRESS, INKILOGRAMS PER
SQUARE CENTIMETER
POINT STRESS, INKILOGRAMS PER
SQUARE CENTIMETER
Water sample depth, in feet
11-12
16-17
22-23
27-28
30-31
35-36
oJf a:13 CO
az
o
U.
z
a.Ulo
5 -
10 -
15 -
20 -
25 -
30 -
35 -J
Water sample depth, in feet
11-12
20-21
23-24
28-29
31-32
40 -J
Figure 6. Logs of point-stress data measured with the Direct Push Technology piezocone tool and depths of ground- water samples collected with the Hydrocone tool at station 2 and 5 at the American Creosote Works abandoned plant site.
sampled with the DPT Hydrocone tool. Standing water in the augers was evacuated with a centrifu gal pump, and ground-water samples were collected with a submersible pump.
During this evaluation, a few ground-water samples also were collected below the penetration refusal depth of the DPT equipment. Intervals for collection of these samples were selected from
natural gamma-ray geophysical logs made in the stratigraphic test holes at stations 2 and 5 for the RI/FS (S&ME, Inc., 1988). The modified-auger method made it possible to extend the maximum depth of sample collection to about 90 feet below land surface. However, the method was only partly successful because of clogging of the screen, slow recovery of the water in the augers after purging, and the time involved in this operation
Subsurface exploration and sampling 11
Table 2. Hydraulic conductivities, lithologies, and relative densities of sediment collected with the Direct Push Technology (DPT) Hydrocone and piezocone tools, March 1991
[Water levels from measurements made in nearby monitoring wells; hydraulic conductivities computed from water-level data and filling rates of the Hydrocone tool; lithology from DPT computer analysis of point-stress and sleeve-friction data from the piezocone tool; relative densities of sediment refer to blow counts calculated from the point-stress data in relation to standard split-spoon sampling and penetration test; , indicate no data]
Station number
2
5
Hydrocone interval
(feet below land surface)
11-1216-1722-2327-2830-3135-3644-4555-5664-65
11-1220-2123-2428-2931-32
Water level (feet below
land surface)
_2.52.52.52.52.55.35.25.2
33.23.233
Hydraulic conductivity (feet per day)
_1.942.88
.1953.253.92
26.42.03
.009
3.809.511.174.324.30
Lithology
..
fine sandfine sandfine sandclay
----
fine sandsilty to clayey fine sandfine sandfine sandfine sand
Relative density of sediment
_44443235- --
4221504397
created a risk for loss of the augers in the holes. In addition, once the water table was encountered (about 2 to 5 feet below land surface), the auger returns consisted of a wet slurry of formation mate rials, and as the augering proceeded deeper, the hole progressively enlarged around the augers. Thus, samples collected by this method probably were not representative of discrete intervals, but rather of mixed water standing between the outside of the auger and the enlarged borehole wall. These mixed waters originated from the formation above the sampling interval. At station 5, an attempt was made to isolate sample zones by augering a sepa rate hole for each interval that was sampled. Nevertheless, this adjustment to the modified-auger method did not significantly improve sample integrity.
WATER-QUALITY ANALYTICAL METHODS
Ground-water samples collected during the onsite DPT and modified-auger-sampling evalua tions were analyzed using four methods:
Gas chromatography with photo-ionization detection (GC/PID),
High-performance liquid chromatography (HPLC),
CHEMetrics colorimetric phenol analysis, and
Microtox toxicity bioassay.
These methods of analysis were used to provide water-quality data for selected organic contaminants in ground water, and to determine the suitability of
12 Evaluation of subsurface exploration, sampling, and water-quality-analysis methods at an abandoned wood-preserving plant site at Jackson, Tennessse
each method for use in delineating the extent of the contaminant plume in offsite areas.
All of the above methods were used to analyze ground-water samples collected with the DPT Hydrocone tool and by pumping wells 2D, 3D, 5S, 5M, and 5D, (fig. 1) while the DPT work was being conducted. HPLC, CHEMetrics phenol analysis, and the Microtox bioassay (no GC/PID) were used to analyze samples collected by the modified-auger method and by pumping wells 2S and 2M (fig. 1) while the modified-auger work was being conducted.
Gas Chromatography with Photo-lonization Detection
GC/PID analyses of ground-water samples were conducted in the field at the ACW site by EMC personnel during the DPT evaluation. Head- space analysis of 21 samples collected with the DPT Hydrocone tool and by pumping wells 2D, 3D, 5S, 5M, and 5D (table 3) were made for a reduced list of volatile organic compounds (VOCs) from modified USEPA Methods 601 (halocarbons) and 602 (aromatics) compounds (U.S. Environ mental Protection Agency, 1984a, b).
GC/PID analysis of samples collected at station 5 with the Hydrocone tool and from wells 5S and 5M showed that the highest concentrations of VOCs were detected at depths not greater than 32 feet below land surface (table 3). Below 32 feet, trichloroethylene was detected at a concen tration of 6 /ig/L in a Hydrocone sample from a depth of 54 to 55 feet. Station 5 is the closest downgradient in the direction of ground-water flow from the highly contaminated area (fig. 1).
GC/PID analysis of samples collected at station 2 with the Hydrocone tool showed that the highest concentrations of VOCs were detected at depths not greater than 31 feet below land surface (table 3). Below 31 feet, methylene chloride was detected at a concentration of 9 /xg/L in a Hydrocone sample from a depth of 64 to 65 feet. Station 2 is the farthest downgradient in the direction of ground- water flow from the highly contaminated area (fig. 1).
Well 3D (fig. 1), screened from 125.5 to 135.5 feet below land surface (table 3), was resampled for GC/PID analysis during the DPT evaluation because methylene chloride had been detected at an estimated concentration of 120 /ig/L in a sample collected from this well during the RI/FS (S&ME, Inc., 1988). Methylene chloride was detected at a concentration of 150 /ig/L in this second sample (table 3), indicating that this com pound was present at a depth near the base of the Fort Pillow aquifer at this locality.
Results of the GC/PID analyses indicate that this method can be used to detect VOCs in ground water at the ACW site at the microgram-per-liter level. A significant advantage of performing the GC/PID determinations in the field was that ana lytical data could be evaluated within minutes after the samples were collected. Rapid turnaround time for these analyses also facilitated adjustments of sampling depths during the evaluation.
High-Performance Liquid Chromatography
HPLC analyses of ground-water samples (table 4) were conducted at the USGS National Research Program (NRP) laboratory in Menlo Park, California, following methods developed at a similar site at Pensacola, Florida (Goerlitz and Franks, 1989). Twenty-four samples, collected in amber glass bottles and preserved in the field with mercuric chloride, were shipped (chilled, in cool ers) to the laboratory after collection and were analyzed on the day of arrival. The results of the HPLC analyses provided concentration data for selected poly nuclear aromatic hydrocarbons (PAHs), phenolic compounds (including PCP), and nitrogen-containing heterocyclic compounds in ground-water samples. The list of HPLC analytes chosen was from research at the Pensacola, Florida site (Goerlitz and Franks, 1989).
HPLC analysis of samples collected at station 5 with the DPT Hydrocone tool and the modified- auger method and from wells 5S and 5M showed that the highest concentrations of PAHs, phenolic compounds (including PCP), and nitrogen- containing heterocyclic compounds were detected at depths not greater than 32 feet below land surface
Water-quality analytical methods 13
Table 3. Volatile organic compounds detected in ground-water samples collected with the Direct Push Technology (DPT) Hydrocone tool and by pumping several monitoring wells, March 1991
[Analyses conducted by Michael D. Claycomb, Environmental Management Corporation, Orlando, Florida, using a Photovac 10SSO gas chromatograph with photo-ionization detection (GC/PID). /ug/L, micrograms per liter, values given as < (les* than) indicate that concentrations were below the detection limits of the analytical method and do not indicate the presence or absence of a compound; - sample from 31-32 feet at station 5 was highly contaminated with creosote and was not analyzed]
(table 4). Below 32 feet, naphthalene was detected in a concentration of 4 /jg/L in a sample from well 5M screened at a depth of 57 to 62 feet.
HPLC analysis of samples collected at station 2 with the Hydrocone tool and from wells 2S and 2M showed that the highest concentrations of PAHs, phenolic compounds (including PCP), and nitrogen-containing heterocyclic compounds were
detected at depths not greater than 36 feet below land surface (table 4). Below 36 feet, naphthalene was detected in concentrations of 5 /jg/L in a Hydrocone sample from a depth of 64 to 65 feet and 2 /jg/L in a sample from well 2D screened from 116.5 to 126.5 feet.
Naphthalene was also detected at a concentra tion of 2 /ig/L in a sample from well 3D (fig. 1).
14 Evaluation of subsurface exploration, sampling, and water-quality-analysis methods at an abandoned wood-preserving plant site at Jackson, Tennessee
Table 3. Volatile organic compounds detected in ground-water samples collected with the Direct Push Technology (DPT) Hydrocone tool and by pumping several monitoring wells, March 1991-Continued
Stationor wellnumber
Hydrocone orscreenedinterval
(feet belowland surface)
1.1-Di-chloro-
propaneU/g/L)
MethylenechlorideU/g/D
Tetra-chloro-ethaneU/g/U
1.1.1-Tri-chloro-ethaneU/g/L)
1.1.2-Tri-chloro-ethaneU/g/D
1.1.2.2-Tetrachloro-
ethaneU/g/L)
Trichloro-ethylene
U/g/D
Trans-1,2-dichloro-ethylene
U/g/L)
VinylchlorideU/g/L)
DPT Hvdrocone Tool
2
5
11-1216-1722-2327-2830-3135-3644-4555-5664-65
11-1220-2123-2428-2931-3254-55
<5<5<5<5<5<5<5<5<5
<5<5<5<5
<5
<5<564
<5<5<5<5<5
9
<5<5<5<5
<5
<5<5<5<5<5<5<5<5<5
<5<5<5<5
_<5
<5<5<5<5<5<5<5<5<5
<5<5<5<5
_<5
<5<5<5<5<5<5<5<5<5
<5<5<5<5
_<5
<5<5<5<5<5<5<5<5<5
<5<5<5<5
_<5
<5<5<5<5<5<5<5<5<5
<523
6<5_6
<5<5<5<5<5<5<5<5<5
<5<5<5<5_
<5
<5<5<5<5<5<5<5<5<5
<5<5<5<5_
<5
Monitoring Wells
2D
3D
5S5M5D
116.5-126.5
125.5-135.5
14.5-19.557-62
100.5-110.5
<5
<5
<5<5<5
<5
150
15<5<5
<5
<5
<5<5<5
<5
<5
<5<5<5
<5
<5
<5<5<5
<5
<5
<5<5<5
<5
<5
<5<5<5
<5
<5
<5<5<5
<5
<5
<5<5<5
Well 3D was resampled during the DPT evaluation because an estimated concentration of 120 jug/L of methylene chloride had been detected in a sample from this well during the RI/FS (S&ME, Inc., 1988).
Relatively high concentrations of quinolinone (60 /*g/L), isoquinolinone (20 /*g/L), PCP (110 /*g/L), quinoline (60 /*g/L), 2,5-dimethyl-
phenol (30 jug/L), indene (140 jug/L), naphthalene (1,000 /*g/L), 2-methlynaphthalene (230 /*g/L), and 1,2-dihydroacenaphthalene (60 /-ig/L) were detected in a sample collected with the modified-auger method at a depth of 82 to 87 feet below land surface at station 2. Concentrations of these com pounds at a depth of 82 to 87 feet agree neither with the results of the other water-quality data nor with the toxicity data collected at stations 2 and 5
Water-quality analytical methods 15
Table 4. Polynuclear aromatic hydrocarbons, phenolic compounds (including pentachlorophenol), and nitrogen- containing heterocyclic compounds detected in ground-water samples collected with the Direct Push Technology (DPT) Hydrocone tool, by pumping several monitoring wells, and by pumping through a modified bit-auger, March-April 1991
[Analyses conducted by Donald F. Goerlitz, U.S. Geological Survey, at the National Research Program laboratory at Menlo Park, California, using a Waters Associates Model ALC/GPC 204 high-performance liquid chromatograph; ng/L, micrograms per liter, values given as < (l«s than) indicate that the concentrations were below the detection limits and do not indicate the presence or absence of a compound]
Hydrocone or screened
Station interval or well (feet below number land surface)
16 Evaluation of subsurface exploration, sampling, and water-quality-analysis methods at an abandoned wood-preserving plant site at Jackson, Tennessee
Table 4. Polynuclear aromatic hydrocarbons, phenolic compounds (including pentachlorophenol), and nitrogen- containing heterocyclic compounds detected in ground-water samples collected with the Direct Push Technology (DPT) Hydrocone tool, by pumping several monitoring wells, and by pumping through a modified bit-auger, March-April 1991 -Continued
Station or well number
Hydrocone or screened interval
(feet below land surface)
2.5-di- methyl- phenol U/g/U
3,5-di- methyl- phenol 0/g/U
2.3-di- methyl- phenol U/g/U
2.4-di- methyl- phenol U/g/U
2.6-di- methyl- phenol U/g/U
Benzo- thio-
phene U/g/U
Indene U/g/U
Naphtha lene
U/g/U
2-methyl- naphtha-
lene U/g/U
1.2-dihydro- acenaphtha-
lene U/g/U
DPT Hvdrocone Tool
2
5
11-1216-1722-2327-2830-3135-3655-5664-65
11-1220-2123-2428-2931-32
<5870
1,200130<5<5<5<5
<5100<5<5<5
<536016050
<5<5<5<5
100280<580
<5
<5<5<5<5<5<5<5<5
<5<5<5<5<5
<5870
1,100<5<5<5<5<5
140170<5<5320
<5910<550
<5<5<5<5
<5420<5<5840
<1300800400260190<1<1
501,100
5050
100
<1<1
1,6001,000
<1<1<1<1
9802,400
10050
2,100
24,1005,8006,7002,5003,600
<15
1,8005,4001,0001,2005,900
<1800440760630260<1<1
1,200500500300810
<1560610240170130<1<1
520680700280780
Monitoring Wells
2S2M2D
3D
5S5M5D
12-1730-35
116.5-126.5
125.5-135.5
14.5-19.557-62
100.5-110.5
38080
<5
<5
790<5<5
<5<5<5
<5
<5<5<5
<5<5<5
<5
<5<5<5
<5<5<5
<5
<5<5<5
<5<5<5
<5
<5<5<5
70<1<1
<1
<1<1<1
520410<1
<1
700<1<1
2,8007,600
2
2
1,7004
<1
3501,200
<1
<1
1,200<1<1
320260<1
<1
520<1<1
Modified-Auger Method
2
5
12-1722-2782-87
24-29
17066030
60
<5<5<5
<5
<5<5<5
<5
<5<5<5
<5
<5<5<5
<5
<1<1<1
<1
1001,200
140
1,100
1,3005,8001,000
3,700
130560230
1,000
70400
60
750
Water-quality analytical methods 17
(discussed below). Water-quality data obtained using the Hydrocone tool and by pumping moni toring wells show that concentrations of contami nants are highest above about 36 feet at station 2. The high concentrations detected at 82 to 87 feet at station 2 probably are the result of contamination of the augers after penetrating the upper 36 feet at this location, although concentration data for all com pounds do not support this hypothesis (table 4).
The HPLC method detected PAHs, phenolic compounds (including PCP), and nitrogen- containing heterocyclic compounds in ground-water samples at the microgram-per-liter level. These data were valuable for identifying the vertical extent and composition of the contaminant plume. However, these data would have been more useful if the analyses had been made in the field at the ACW site, as was done for HPLC analyses at the Pensacola site (D.F. Goerlitz, U.S. Geological Survey, oral commun., 1991). By conducting HPLC analyses in the field, sampling depths could be determined or adjusted during subsurface exploration.
CHEMetrics Phenol Analyses
CHEMetrics phenol analyses (American Public Health Association and others, Method 5530D, p. 5-33, 1992) were conducted in the field shortly after the ground-water samples were collected (station 5 only) and again in a laboratory at Memphis State University (MSU) (stations 2 and 5, table 5). In general, the field results seemed unre liable, but are given for comparison. Field- conducted CHEMetrics analyses were discontinued midway through work at station 5 during the DPT evaluation, but were resumed during the modified- auger evaluation to test the reliability of the analyti cal technique on samples collected using this method. Problems encountered using the CHEMetrics method were:
Only phenol (C6H5OH) is detected using this method. Other important phenolic compounds, including PCP and para-substituted phenols, cannot be detected. No colorimetric response was shown when HPLC standard solutions
Table 5. Phenol concentrations detected in ground- water samples collected with the Direct Push Technology (DPT) Hydrocone tool, by pumping several monitoring wells, and by pumping through a modified bit-auger, March-April 1991
[Field analyses conducted by lames A. Kingsbury, U.S. Geological Survey, at the site; laboratory analyses conducted by William S. Parks and June E. Mirecki, U.S. Geological Survey, at Memphis State University, Memphis, Tennessee; both field and laboratory analyses conduted using a CHEMetrics Model P-12 Phenols test kit; mg/L, milligrams per liter, indicates no data; sample from 11-12 feet at station 2 was of insufficient volume for analysis; sample from 31-32 feet at station 5 was highly contaminated and was not analyzed]
18 Evaluation of subsurface exploration, sampling, and water-quality-analysis methods at an abandoned wood-preserving plant site at Jackson, Tennessee
(consisting of pyridine, quinoline, PCP, and naphthalene) were tested at MSU.
Many of the samples were cloudy from sus pended material when first collected. This obscured colorimetric comparison in the field. Results of analyses at MSU were more reliable because suspended material had settled. Cen- trifuging the samples in the field might resolve this problem.
Initial colors of processed samples were differ ent enough from the colorimetric comparator that it was difficult to make reliable compari sons. Extending color development time from 5 to 10 minutes (recommended in the kit) to 15 to 20 minutes provided more reproducible results.
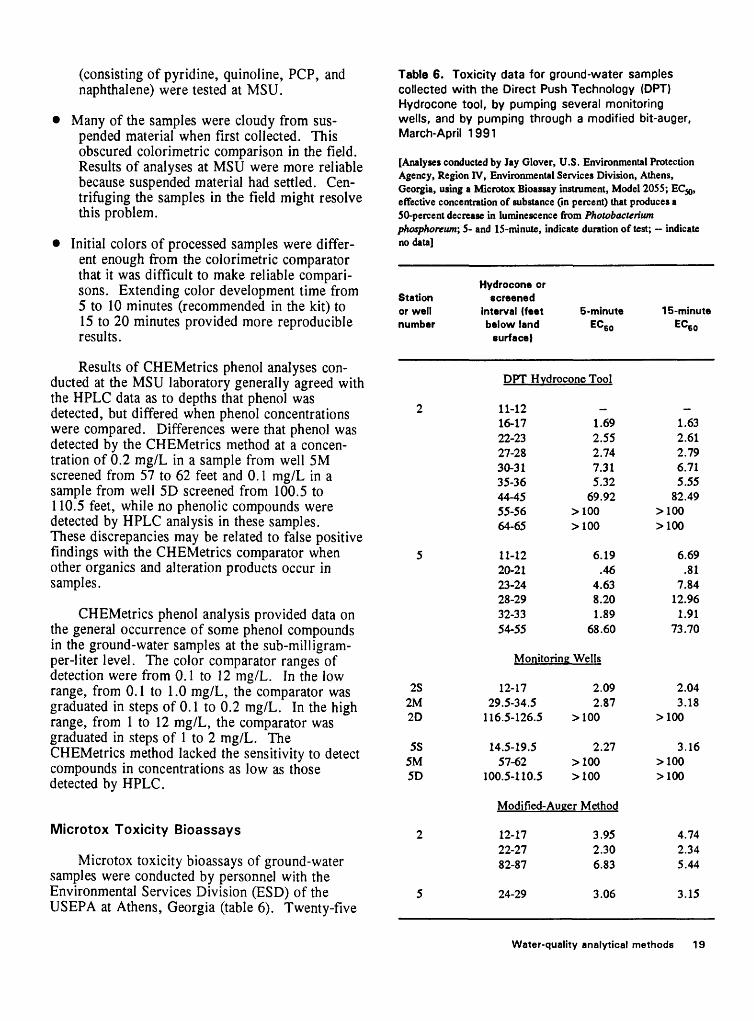
Results of CHEMetrics phenol analyses con ducted at the MSU laboratory generally agreed with the HPLC data as to depths that phenol was detected, but differed when phenol concentrations were compared. Differences were that phenol was detected by the CHEMetrics method at a concen tration of 0.2 mg/L in a sample from well 5M screened from 57 to 62 feet and 0.1 mg/L in a sample from well 5D screened from 100.5 to 110.5 feet, while no phenolic compounds were detected by HPLC analysis in these samples. These discrepancies may be related to false positive findings with the CHEMetrics comparator when other organics and alteration products occur in samples.
CHEMetrics phenol analysis provided data on the general occurrence of some phenol compounds in the ground-water samples at the sub-mill igram- per-liter level. The color comparator ranges of detection were from 0.1 to 12 mg/L. In the low range, from 0.1 to 1.0 mg/L, the comparator was graduated in steps of 0.1 to 0.2 mg/L. In the high range, from 1 to 12 mg/L, the comparator was graduated in steps of 1 to 2 mg/L. The CHEMetrics method lacked the sensitivity to detect compounds in concentrations as low as those detected by HPLC.
Microtox Toxicity Bioassays
Microtox toxicity bioassays of ground-water samples were conducted by personnel with the Environmental Services Division (ESD) of the USEPA at Athens, Georgia (table 6). Twenty-five
Table 6. Toxicity data for ground-water samples collected with the Direct Push Technology (DPT) Hydrocone tool, by pumping several monitoring wells, and by pumping through a modified bit-auger, March-April 1991
[Analyses conducted by Jay Glover, U.S. Environmental Protection Agency, Region IV, Environmental Services Division, Athens, Georgia, using a Microtox Bioassay instrument, Model 2055; ECX, effective concentration of substance (in percent) that produces a 50-percent decrease in luminescence from Photobacterium phosphoreum; S- and 15-minute, indicate duration of test; indicate no data]
samples were shipped to the ESD laboratory, and EC50 data were determined from 5- and 15-minute tests following methods described by ManTech Environmental Technology, Inc. (1990). EC50 refers to the effective concentration of a substance (in percent) that produces a 50-percent decrease in luminescence from Photobacteriwn phosphoreum. Any decrease in luminescence from these organ isms is directly related to the metabolic state of the bacterial cell and, thus, can be used as indicator of toxicity.
Microtox bioassay results indicate that ground- water samples collected from depths of less than about 35 feet below land surface at onsite stations 2 and 5 produced acute toxicity, with a dramatic
decrease in toxicity below this depth (fig. 7). Virtu ally no toxicity was associated with the samples collected below 55 feet at stations 2 and 5, except in the modified-auger-method sample collected from 82 to 87 feet at station 2. Toxicity of sam ples at this depth interval probably was the result of residual contamination from the augers after pene trating the upper 36 feet at this location.
SUMMARY AND CONCLUSIONS
Direct Push Technology (DPT) and a modified-auger method of sampling were conducted by the USGS at the American Creosote Works, Inc., USEPA Superfund site at Jackson, Tennessee,
STATION 2 STATION 5
20u<I 40 </i
60
80
100
& 120
140
>100
Toxicity decreases
ii i i i i iii
Toxicity decreases
i i i i i i i
>100
>100
0 50 100 0 50 100
EFFECTIVE CONCENTRATION 50 , 15-MINUTE TEST, IN PERCENT
Note: Graphs do not include toxicity results for samples collected by modified auger method.
Figure 7. Relation of toxicity (EC 60 ) of contaminants in ground-water samples to depth below land surface at stations 2 and 5 at the American Creosote Works abandoned plant site.
20 Evaluation of subsurface exploration, sampling, and water-quality-analysis methods at an abandoned wood-preserving plant site at Jackson. Tennessee
to collect lithologic and ground-water-quality data in an area known to be affected by subsurface con tamination. The ground-water samples were ana lyzed using (1) gas chromatography with photo-ionization detection (GC/PID), (2) high-per formance liquid chromatography (HPLC), (3) CHEMetrics phenol analysis, and (4) Microtox toxicity bioassay. The work was conducted to evaluate selected methods of subsurface explora tion, sampling, and water-quality analysis to plan for an investigation of ground-water contamination in nearby offsite areas. These areas are in the low- lying alluvial plain of the South Fork Forked Deer River and are difficult to access except during dry times of the year.
The DPT piezocone tool provided detailed lithologic data in the alluvial aquifer at two onsite stations to a depth of penetration refusal of about 35 feet below land surface. From these data, depths were selected for sampling, and ground- water samples were collected using the DPT Hydrocone tool. The depth of sampling with the DPT Hydrocone tool was extended to about 65 feet below land surface with the assistance of augering techniques by pushing the tool in advance of the hollow-stem augers. Results from the DPT work at the two onsite stations confirmed that the alluvial aquifer at the ACW site is contaminated with creo sote and related organic compounds. The alluvial aquifer consists of alternating sandy and clayey zones that vary in hydraulic conductivity.
Following completion of the DPT work, a modified-auger method of ground-water-sample collection was tested. This method consisted of augering to depths selected from gamma-ray logs made in monitoring wells at the two onsite stations and collection of ground-water samples by pumping through a perforated bit-auger modified to contain a small-diameter well screen. The method was only partly successful because of clogging of the screen and slow recovery of the water in the augers after purging. Also, the time involved in this operation created a risk for loss of the augers in the holes. However, depths to about 90 feet were sampled. The modified-auger method left doubt as to the integrity of the samples collected because of the possibility of residual contaminants on the augers after penetrating zones of contamination.
GC/PID and HPLC methods of water-quality analysis provided the most useful data concerning contaminant concentrations in the ground water and proved to be the two most effective of the four methods evaluated. The GC/PID and HPLC analy ses of ground-water samples collected at the two onsite stations indicated that volatile organic compounds, polynuclear aromatic hydrocarbons, phenolic compounds (including pentachlorophenol), and nitrogen-containing heterocyclic compounds occur in the highest concentrations in the alluvial aquifer at depths of less than about 35 feet below land surface. Trichloroethylene and methylene chloride were detected in a few ground-water sam ples from depths to about 65 feet, and naphthalene and methylene chloride were detected in a few samples from depths to about 135 feet.
CHEMetrics analyses provided generalized data on the occurrence of some phenolic com pounds in ground water supplemental to the HPLC data. Microtox toxicity bioassays indicated that toxicity associated with contaminants in ground- water samples from the two onsite stations extended to depths of about 55 feet below land surface beneath the ACW site. Samples from depths of less than 35 feet produced acute toxicity.
REFERENCES CITED
American Public Health Association, American Water Works Association, and Water Environment Feder ation, 1992, Standard methods for the examination of water and wastewater (18th ed.): Washington, D.C., American Public Health Association, 1,268 p.
Bouwer, H., and Rice, R.C., 1976, A slug test for determining hydraulic conductivity of unconfined aquifers with completely or partially penetrating wells: Water Resources Research, v. 12, no. 3, p. 423-428.
Goerlitz, D.F., and Franks, B.J., 1989, Use of on-site high-performance liquid chromatography to evalu ate the magnitude and extent of organic contamina tion in aquifers: Ground Water Monitoring Review, v. 9, no. 2, p. 122-129.
ManTech Environmental Technology Inc., 1990, Region IV, Ecological Support Branch, Standard operating procedures for toxicity testing hazardous waste assessment; SOP XXII. Prepared by ManTech
References cited 21
Environmental Technology, Inc., Environmental Services Assistance Team, Athens, Georgia, for the U.S. Environmental Protection Agency, Region IV, Environmental Services Division, Athens, Georgia (under contract no. 68-01-7456), March 1990.
Milhous, H.C., 1959, Well logs in Tennessee: Tennes see Division of Geology Bulletin 62, 606 p.
Parks, W.S., 1968, Geologic map of the Jackson South quadrangle, Tennessee: Tennessee Division of Geology GM 438-SE, scale 1:24,000.
Parks, W.S., and Carmichael, J.K., 1989, Geology and ground-water resources of the Fort Pillow Sand in western Tennessee: U.S. Geological Survey Water-Resources Investigations Report 89-4120, 20 p.
Parks, W.S., Carmichael, J.K., and Mirecki, I.E.,1992, Creosote plume sampling and analysis at an abandoned wood-preserving plant site: Proceed ings for the HMC/Superfund '92 Conference and Exhibition, Washington, D.C., December 1-3, 1992, p. 214-216.
Russell, E.E., and Parks, W.S., 1975, Stratigraphy of the outcropping Upper Cretaceous, Paleocene, and lower Eocene in western Tennessee (including
descriptions of younger fluvial deposits): Tennes see Division of Geology Bulletin 75, 126 p.
S&ME, Inc., 1988, Final remedial investigation report, American Creosote Works Site, Jackson, Tennes see: Prepared by S&ME, Inc., Atlanta, Georgia, for the U.S. Army Corps of Engineers, Kansas City, Missouri (under contract no. DACW41-86-C- 0104), S&ME Document no. 86015A-0146, July 1988.
Schneider, R.R., and Blankenship, R.E., 1950, Subsur face geologic cross-section from Claybrook, Madison County, to Memphis, Shelby County, Tennessee: Tennessee Division of Geology Ground-Water Investigations Preliminary Chart 1.
U.S. Environmental Protection Agency, 1984a, Appen dix A to Part 136 Methods for organic chemical analysis of municipal and industrial wastewater. Method 601-purgeable halocarbons: 40 CFR Part 136, Federal Register, v. 49, no. 209, October 26, 1984, p. 29-39.
1984b, Appendix A to Part 136~Methods fororganic chemical analysis of municipal and indus trial wastewater. Method 602~purgeable aromatics: 40 CFR Part 136, Federal Register, v. 49, no. 209, October 26, 1984, p. 40-48.
22 Evaluation of subsurface exploration, sampling, and water-quality-analysis methods at an abandoned wood-preserving plant site at Jackson, Tennessee