Page 1
1
Evolution in the Relationship between Nitrogen Fertilizer and Natural Gas Prices in the U.S.
Oranuch Wongpiyabovorn
November 4, 2021
Abstract
The U.S. nitrogen fertilizer industry has experienced several changes over the past two
decades, such as innovation in natural gas extraction, increasing demand for corn at the global
level, and mergers between fertilizer producers. In this paper, I found three structural changes in
the relationship between nitrogen and natural gas prices: (i) in October 2006; (ii) in March 2010
and (iii) in October 2016. By estimating the pass-through rates to anhydrous ammonia and
granular urea prices, the results show that the changes in Henry Hub natural gas price strongly
influence on both ammonia and urea prices before March 2010. However, the international natural
gas price instead plays a dominant role afterward, potentially because of a domestic production
capacity constraint and relatively high price of international natural gas. The positive impact of
corn price changes is observed between October 2006 and September due to an increase in demand
for fuel ethanol.
Page 2
2
1. Introduction
To maintain food production for the growing world population, nitrogen fertilizer is
commonly applied in U.S. agriculture to support crop yields and improve product quality.
Nitrogen is an essential nutrient for crops and accounted for 57 percent of total nutrient
consumption in 2014. One crop that intensively uses nitrogen fertilizer is corn, which is the largest
crop in the United States in 2019 (87.2 million acres planted or 36.8% of total acreage planted1).
Corn is the main feedstock for ethanol, which is blended in transportation fuel in the United States
because of its abundance and low price, and is the main feed row crop in the United States.
Natural gas is the primary input used to produce nitrogen fertilizers, typically accounting
for 72%-85% of ammonia production cost (Huang, 2007). Since 2006, there has been a
substantial increase in shale gas production in the U.S. due to a combination of innovations in
horizontal drilling and hydraulic fracturing. The technological progress has increased domestic
natural gas production, so natural gas prices eventually dropped and have remained at a
historically low level since 2009.
A lower price for natural gas into nitrogen production has the potential to decrease the
price of nitrogen fertilizer. However, there are two other factors that are likely to increase
nitrogen prices. The first factor is global corn production expansion to meet the demand for
ethanol driven by government policy and environmental concerns. In the global context, 37
industrialized countries and the European Community legally committed to reducing greenhouse
gas (GHG) emissions under the Kyoto Protocol. The first commitment period of the Kyoto
Protocol covered 2008 until 2012. In addition, developing countries were indirectly involved as
industrialized countries were allowed to comply with the GHG reduction commitment by
1 Estimated data as of January 10, 2020 by United States Department of Agriculture (USDA).
Page 3
3
investing in emission-reducing projects in developing countries. As a result, the government of
many countries, such as Canada, European Union member countries, India, and Brazil, have
launched policies to stimulate ethanol and biofuel use and production in their countries. In the
meantime, the U.S. renewable fuel standard, which sets the volume requirement of ethanol that
blends in fuel used in the transportation sector, became effective in 2008. Both would increase
global demand for ethanol and demand for corn, implying a potential increase in demand for
nitrogen fertilizer. The second factor is the change in fertilizer market structure, specifically the
horizontal mergers between CF and Terra Industries in March 2010 and between Potash Corp
and Agrium in January 2018. The mergers create the potential for less price competition in the
industry, possibly leading to a higher price, lower consumer surplus, and greater deadweight loss
(Mortan, 2019). In addition, there are other factors that are likely to affect nitrogen prices, for
instance, shifts in production capacity, changes in government regulation, and increases in
storage and transportation costs.
Huang (2007) indicated that the prices of nitrogen fertilizers were closely correlated with
natural gas prices during the period of 2000-2005. In contrast, more recent studies have shown
that the movement of fertilizer prices has been driven by demand pressure rather than natural gas
prices (Beckman and Riche, 2015; Etienne et al., 2016). The presence of a structural change in
the U.S. fertilizer industry was also stressed by prior literature. From January 2001 to December
2013, Beckman and Riche (2015) found a structural change occurring in June 2008, potentially
because of an increase in demand for corn. Meanwhile, Bushnell and Humber (2017) examined
the data from January 1998 to January 2016 and discovered a break occurring in January 2010, the
year that CF and Terra Industries combined. The inconsistent outcomes of these studies indicate
that there may exist more than one structural change. To my knowledge, the prior related research
Page 4
4
has considered at most one structural break in the relationship between the prices of U.S. nitrogen
fertilizer and natural gas.
This study examines two research questions. The first question is whether the relationship
between natural gas and nitrogen prices changes over time? If it does, what are the major causes?
Secondly, how much do natural gas and corn prices pass through to nitrogen fertilizer prices?
Furthermore, how has the relationship evolved over the last two decades?
Understanding the structure of the U.S. fertilizer industry is crucial for farmers and
policymakers since fertilizer is the main input of crops to improve yields. If nitrogen fertilizer and
natural gas prices are not strongly correlated, the hedging of natural gas futures on nitrogen prices
would be ineffective. It suggests that natural gas futures cannot be used to reduce the risk of
volatile fertilizer prices. Additionally, lower natural gas prices are likely to benefit fertilizer
producers in the presence of market power, rather than farmers. Higher nitrogen prices might
cause higher food prices and higher transportation costs via higher corn and ethanol costs,
potentially resulting in higher prices of other goods.
To examine the stability of the relationships among natural gas, nitrogen, and corn prices,
I apply the tests for multiple structural changes introduced by Bai and Perron (1998, 2003). In the
study, I use monthly data of anhydrous ammonia, granular urea, Henry Hub natural gas,
international natural gas, and corn price series during the period of February 1997 – January 2020.
Three structural changes are found: (i) October 2006; (ii) March 2010; and (iii) October 2016. The
first break is partly the result of the combination of technological progress in shale gas production
and an increase in global demand for corn. The second break is related to the consolidation
between CF Industries and Terra Industries. Lastly, the break occurring after the third quarter of
Page 5
5
2016 likely occurs because of high supply of corn, the merger between Agrium and Potash Corp.,
and increases in domestic production capacity of nitrogen fertilizers.
Then, the pass-through rates of domestic natural gas, international natural gas, and corn
prices to fertilizer prices are calculated by using the seemingly unrelated regression. The results
suggest that the Henry Hub natural gas price was the most influential factor on the nitrogen
prices before March 2010, but it is no longer the main factor. Instead, nitrogen prices depend
more on international natural gas price afterward, potentially because of relatively high prices of
international natural gas prices and a domestic production capacity constraint that restricts lower
cost to not pass through to final products.
The pass-through rates of the shift in input prices to anhydrous ammonia prices are highly
volatile over the sample period with the highest pass-through rate at 112% during October 2006
– February 2010 and the lowest rate at 25.4% between March 2010 and September 2016. The
shift in ammonia prices depends less on supply side after March 2010 possibly due to high corn
prices and the merger between CF and Terra Industries. Similarly, the pass-through of input
price changes to granular urea price is volatile with a high at 77% in the second period and a low
at 5.3% in the latest regime. The impact of corn price changes on both ammonia and urea prices
are positive during October 2006 – September 2016, reflecting increasing global demand for fuel
ethanol. However, from the fourth quarter 2016, the shift in corn prices negatively affects both
nitrogen prices, in part, due to a stable demand for biofuel and high maize supply that put
downward pressure on corn prices.
The outcomes support the argument of more than one structural break in the relationship
among anhydrous ammonia, its main input, and output prices. The incomplete and negative total
pass-through to ammonia and urea prices, especially in the last regime, suggests that the presence
Page 6
6
of many other factors that likely affect the nitrogen industry, including the merger between
Agrium and PotashCorp in January 2018, completion of many capacity expansion projects, the
change in government regulation, and increasing costs of transportation and storage.
The remainder of this study is organized as follows. The next section provides background
on the U.S. nitrogen market and related factors. Section 3 reviews the literature, and
methodologies are described in section 4. Furthermore, data and summary statistics are shown in
section 5. Section 6 reports empirical results, and section 7 concludes.
2. Background
Fertilizers are classified by their content of three principal nutrients: nitrogen,
phosphorus, and potassium. In this study, I solely focus on nitrogen-based fertilizers that are
intensively used in corn production, accounting for about 15-20 percent of the total operating
costs of corn production.
In this paper, I consider two main types of nitrogen fertilizers: (i) anhydrous ammonia,
which is a gas that is stored as a liquid under pressure; and (ii) granular urea, which is a solid
product. Ammonia is the primary raw material to produce all other nitrogen fertilizers. It is also
directly applied as a fertilizer due to its low production cost, high nitrogen content (82.2%
nitrogen), and relative stability in soils. Anhydrous ammonia can be directly injected into the
ground. Liquid ammonia then expands into a gas and is absorbed in the soil. Since anhydrous
ammonia is a dangerous chemical, special equipment is required and often adds to the expense.
Anhydrous ammonia is usually applied during both spring and fall.
Urea, which has the highest nitrogen content among solid nitrogen fertilizers (46.6%
nitrogen), is the world’s most popular nitrogen fertilizer. Granular urea is dry and highly
resistant to moisture, so it is easy to transport and store. The usage of urea has surpassed and
Page 7
7
nearly replaced ammonium nitrate as fertilizer over the past decade. Unlike ammonia, granular
urea is applied to the soil’s surface, then combines with water to form ammonia. Nitrogen from
urea, however, can be significantly lost to the atmosphere if urea remains on the soil surface
during warm weather. As a result, applying urea in the fall is generally not as effective as
ammonia. Typically, farmers use anhydrous ammonia during the pre-plant season, while urea is
more preferred for in-season fertilizer applications.
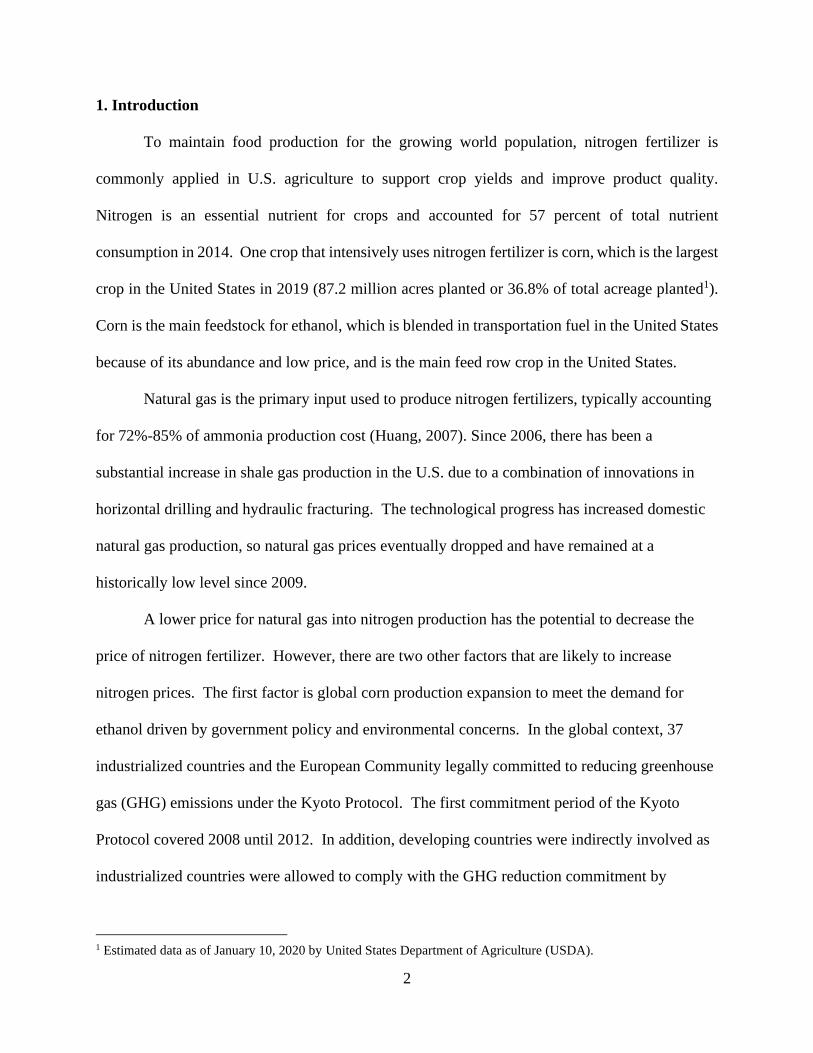
Natural gas is the primary input for both anhydrous ammonia and urea. Due to the
substantial increase in shale gas production in the U.S., the annual average domestic natural gas
prices were between $2.52-4.39 per million Btu during the period of 2009 – 2019, compared to
$8.86 per million Btu in 2008. Theoretically, if other factors are unchanged, a decline in natural
gas prices will increase fertilizer production, and therefore, reduce fertilizer prices. Practically,
however, falling domestic natural gas prices seem to have limited impacts on fertilizer prices.
Figure 2.1 indicates the divergence between domestic ammonia and natural gas prices starting
around 2009. Specifically, while the prices of natural gas have become lower because of the
shale gas development, ammonia prices have increased. Thus, there are other factors driving the
fertilizer price volatility, such as a shift to a global supply chain, an increase in crop production
driven by feed and fuel needs, the volatility of prices of raw materials, and the volatility in
exchange rates (Beckman, Borchers, and Jones, 2013).
Page 8
8
Source: EIA, Green Markets, Bloomberg
Figure 2.1 U.S. ammonia, Henry Hub natural gas, and corn prices between January 1997 – February 2020
One of the most mentioned factors explaining the recent fluctuation in fertilizer prices is
the expansion of fuel ethanol production, which requires higher maize and sugar cane
production, leading to greater fertilizer usage. The 1990 Clean Air Act Amendments were the
first U.S legislation that considered emission reductions from vehicles. U.S. ethanol production
was intensified due to the U.S. renewable fuel standard (RFS) program under the Energy Policy
Act of 2005 and the Energy Independence and Security Act of 2007. Starting from 2008, the
U.S. Environmental Protection Agency (EPA) has set yearly volume requirements of renewable
fuels to blend in automobile fuel. However, the level of U.S. nitrogen consumption barely
changed due to increasing efficiency of fertilizer use. Comparing 7-year averages, the nitrogen
consumption levels before and after RFS implementation were not significantly different, 12,320
thousand tons (between 2001-2007) and 12,764 thousand tons (between 2008-2014).
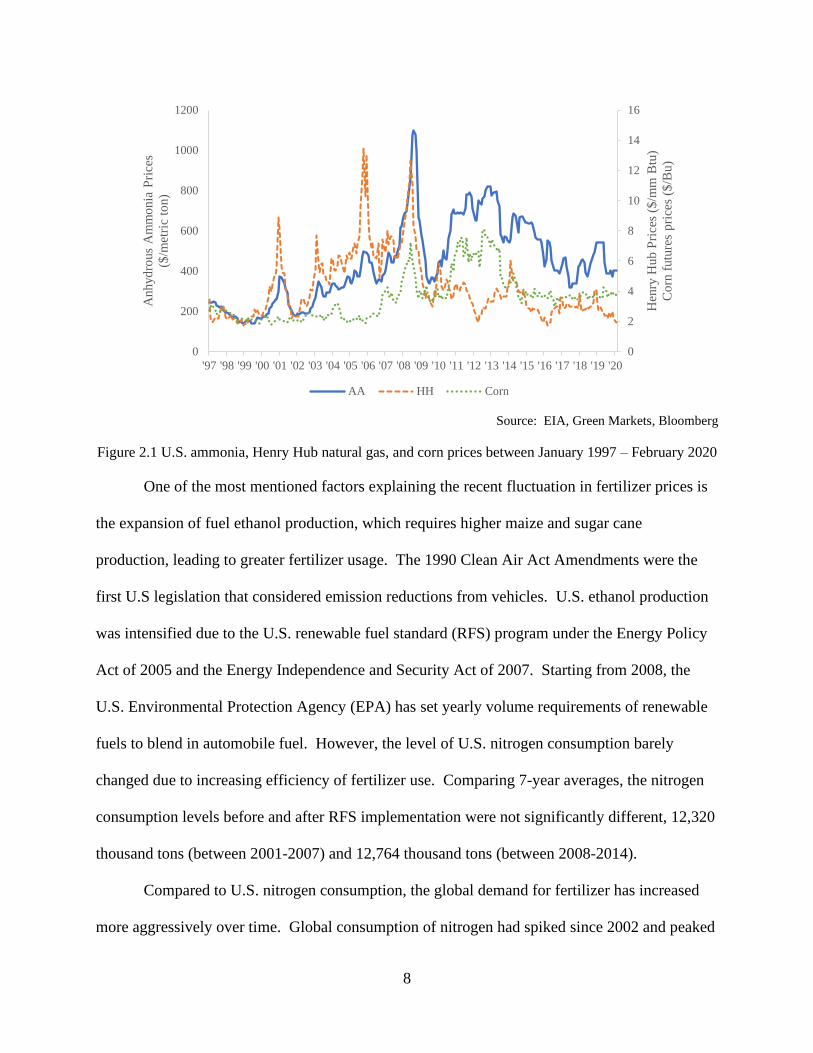
Compared to U.S. nitrogen consumption, the global demand for fertilizer has increased
more aggressively over time. Global consumption of nitrogen had spiked since 2002 and peaked
0
2
4
6
8
10
12
14
16
0
200
400
600
800
1000
1200
'97 '98 '99 '00 '01 '02 '03 '04 '05 '06 '07 '08 '09 '10 '11 '12 '13 '14 '15 '16 '17 '18 '19 '20
Hen
ry H
ub
Pri
ces
($/m
m B
tu)
Co
rn f
utu
res
pri
ces
($/B
u)
Anhyd
rous
Am
mo
nia
Pri
ces
($/m
etri
c to
n)
AA HH Corn
Page 9
9
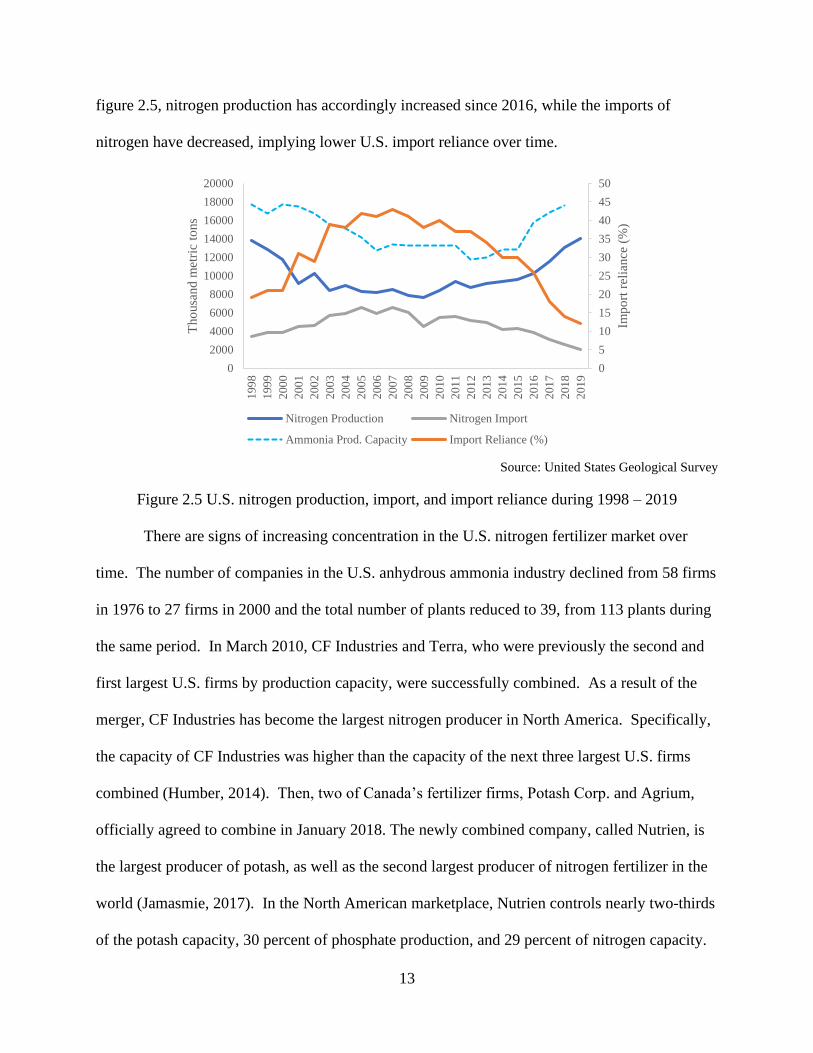
in 2012 (see figure 2.2). The move of substituting fossil fuel with ethanol globally significantly
increased in the early 2000s. Accordingly, fuel ethanol production has strongly grown since
2001 with slight declines in 2011-2012 (see figure 2.3). Furthermore, the Kyoto Protocol’s first
commitment (2008-2012) is an international agreement that aims to reduce greenhouse gas
(GHG) emissions. During the first commitment period, only 37 industrialized countries and the
EU-15 agreed to reduce their emissions by an average of 5 percent compared to 1990 levels. The
EU Member States adopted the Renewable Energy Sources Directive in early 2009. The
Directive aimed to increase the share of renewable energy in the EU to 20% of gross final energy
consumption in 2020. Additionally, it also required that at least 10% of all energy used in the
transportation sector comes from renewable sources in 2020. This mainly involved biofuels,
such as ethanol and biodiesel.
Source: International Fertilizer Association
Figure 2.2 U.S. and world nitrogen consumption between 1995-2018 (the base year 1995 = 100)
80
90
100
110
120
130
140
150
199
5
199
6
199
7
199
8
199
9
200
0
200
1
200
2
200
3
200
4
200
5
200
6
200
7
200
8
200
9
201
0
201
1
201
2
201
3
201
4
201
5
201
6
201
7
201
8
Nit
rogen
Co
nsu
mp
tio
n I
nd
ex
(bas
e yea
r 1
99
5 =
10
0)
World US
Page 10
10
Source: Energy information Administration
Figure 2.3 Fuel Ethanol Production by Country during 1995 – 2019
Developing countries were indirectly involved through the Clean Development
Mechanism projects that allowed industrialized countries with a GHG reduction commitment to
invest in emission-reducing projects in developing countries as an alternative. Many countries,
such as Canada, India, and Brazil, have launched policies to stimulate ethanol and biofuel usage
and production in their countries. Even though Brazil was not legally bound to cut its emission
under the accord, Brazil has been one of the top ethanol producers for decades alongside the
U.S., as seen in figure 2.3.
Another attempt to deal with greenhouse gas emissions internationally is the Paris climate
agreement, signed on November 4, 2016, by 90 countries, including the U.S. The accord aims to
keep the global average temperature rise in the 21st century well below 2 degrees Celsius above
pre-industrial levels. During Trump’s presidency, the U.S. withdrew from the Paris agreement,
which now has 187 members. Then, on February 19, 2021, President Joseph Biden signed an
executive order to rejoin the Paris agreement.
0
200
400
600
800
1000
1200
1400
1600
1800
2000
199
5
199
6
199
7
199
8
199
9
200
0
200
1
200
2
200
3
200
4
200
5
200
6
200
7
200
8
200
9
201
0
201
1
201
2
201
3
201
4
201
5
201
6
201
7
201
8
201
9
Fuel
Eth
ano
l P
rod
uct
ion
(Tho
usa
nd
Bar
rels
per
Day
)
US Brazil EU ROW
Page 11
11
Corn-based ethanol is widely used in the U.S., while the main feedstock for ethanol in
Brazil is sugarcane, which is also a heavy nitrogen user. For the EU, the primary feedstocks for
ethanol production are sugar beet, wheat, and corn. Consequently, demand for nitrogen in these
countries likely increases as they produce more ethanol to meet the rising demand.
Consequently, higher international nitrogen prices are expected.
Figure 2.2 shows the apparent relationship between anhydrous ammonia and corn prices
during 2007 – 2014 when corn prices were relatively high. The crop price surges in 2007-08 and
2010-12 were partly due to weather shocks, leading to tightening supply. Meanwhile, the
relatively stable corn prices in 2015-2019 reflected the abundance of maize supply.
Source: USDA QuickStat
Figure 2.4 U.S. Corn production between 1997 – 2020
According to United States Geological Survey (USGS) statistics, more than 35% of U.S.
nitrogen consumption had relied on imports between 2003 – 2012, with a peak at 43% in 2007.
In addition, the U.S. has been one of the top importers of nitrogen fertilizer since the 1990s. In
2018, the U.S. was the largest importer of ammonia and the third-largest importer of urea. The
0
2,000
4,000
6,000
8,000
10,000
12,000
14,000
16,000
199
7
199
8
199
9
200
0
200
1
200
2
200
3
200
4
200
5
200
6
200
7
200
8
200
9
201
0
201
1
201
2
201
3
201
4
201
5
201
6
201
7
201
8
201
9
202
0
U.S
. C
orn
Pro
duct
ion (
mil
lio
n b
ush
els)
Page 12
12
dependency on imported nitrogen fertilizers indicates that domestic nitrogen prices may also rely
on international natural gas prices.
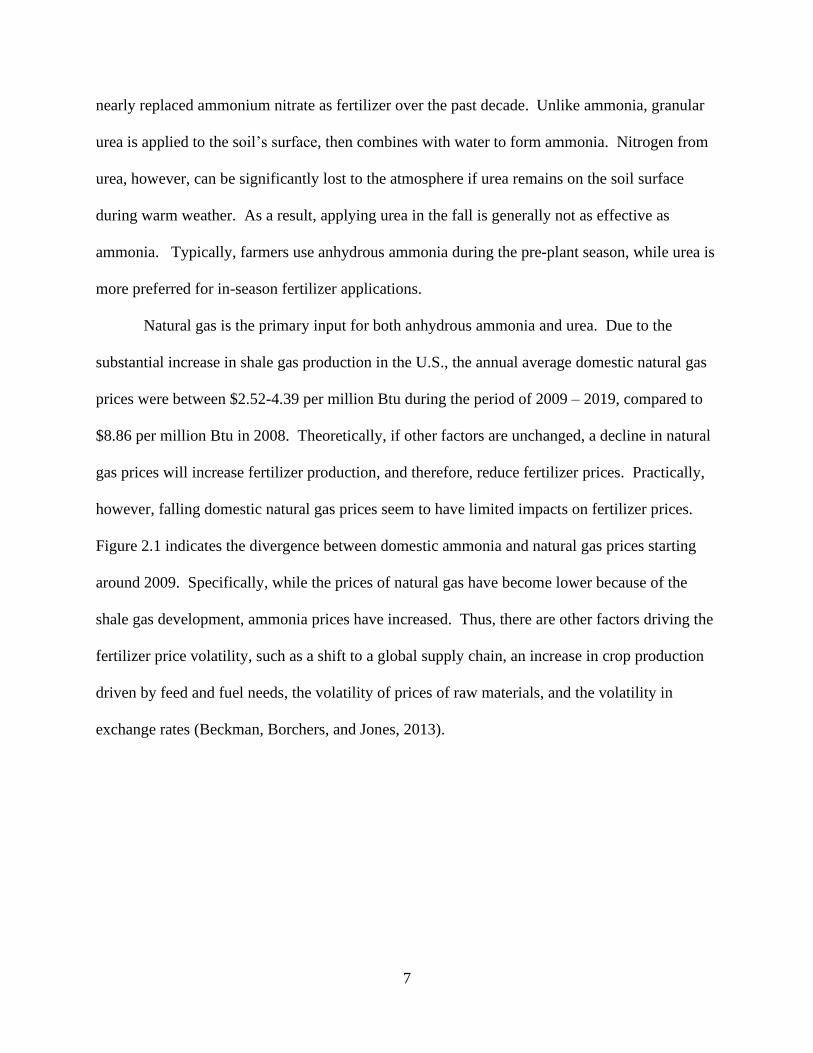
Before 2000, U.S. ammonia production capacity had increased to 17.7 million tons.
However, relatively high natural gas prices during the 2002-08 period attributed to U.S. nitrogen
plant closures, resulting in declining domestic production capacity. The total production
capacity of ammonia was lowest at 11.8 million tons in 2012. While domestic production of
nitrogen dropped, imports increased to meet demand as seen in figure 2.5. As a result of
capacity constraints of domestic producers, lower domestic natural gas prices due to the shale
gas revolution seem to not translate to lower fertilizer prices in the short term, as there was
strong demand for imported fertilizers (Ruder and Bennion, 2013).
Prolonged low prices of domestic natural gas due to technological progress in natural gas
production led to an increase in nitrogen production capacity. In 2013, there were 14 ammonia
plants proposed in the U.S., with nearly 12 million tons of new capacity. CF Industries’ new
urea plant in Donaldsonville, LA was completed in the third quarter of 2015, and then new
ammonia and urea plants in Port Neal, IA, as well as new ammonia plants in Donaldsonville,
LA, have become operational since the fourth quarter of 2016. Additionally, Koch’s new
900,000 ton-per-year urea plant and a capacity increase to the existing ammonia plant in Enid,
OK have started in 2017. Agrium (now Nutrien)’s capacity increased by 145,000 tons/year at
their ammonia plant and a new 610,000 ton-per-year urea plant in Borger, TX, was completed in
2017. In April 2018, Iowa Fertilizer Company’s new greenfield nitrogen fertilizer production
facility in Wever, IA officially operated with an annual production of up to 2 million metric tons
of nitrogen fertilizer products. The capacity of anhydrous ammonia production in the U.S.
sharply increased to 15.8 million tons in 2016, up from 12.8 million tons in 2015. As shown in
Page 13
13
figure 2.5, nitrogen production has accordingly increased since 2016, while the imports of
nitrogen have decreased, implying lower U.S. import reliance over time.
Source: United States Geological Survey
Figure 2.5 U.S. nitrogen production, import, and import reliance during 1998 – 2019
There are signs of increasing concentration in the U.S. nitrogen fertilizer market over
time. The number of companies in the U.S. anhydrous ammonia industry declined from 58 firms
in 1976 to 27 firms in 2000 and the total number of plants reduced to 39, from 113 plants during
the same period. In March 2010, CF Industries and Terra, who were previously the second and
first largest U.S. firms by production capacity, were successfully combined. As a result of the
merger, CF Industries has become the largest nitrogen producer in North America. Specifically,
the capacity of CF Industries was higher than the capacity of the next three largest U.S. firms
combined (Humber, 2014). Then, two of Canada’s fertilizer firms, Potash Corp. and Agrium,
officially agreed to combine in January 2018. The newly combined company, called Nutrien, is
the largest producer of potash, as well as the second largest producer of nitrogen fertilizer in the
world (Jamasmie, 2017). In the North American marketplace, Nutrien controls nearly two-thirds
of the potash capacity, 30 percent of phosphate production, and 29 percent of nitrogen capacity.
0
5
10
15
20
25
30
35
40
45
50
0
2000
4000
6000
8000
10000
12000
14000
16000
18000
20000
199
8
199
9
200
0
200
1
200
2
200
3
200
4
200
5
200
6
200
7
200
8
200
9
201
0
201
1
201
2
201
3
201
4
201
5
201
6
201
7
201
8
201
9
Imp
ort
rel
iance
(%
)
Tho
usa
nd
met
ric
tons
Nitrogen Production Nitrogen Import
Ammonia Prod. Capacity Import Reliance (%)
Page 14
14
Other factors that would affect retail nitrogen prices are transportation and storage costs.
Anhydrous ammonia is required to transport under pressure, while dry urea is easier to transport.
Truck, rail, barge, and ocean vessels can be used to ship nitrogen products. In addition,
anhydrous ammonia can also be transported via pipeline. Fertilizer producers usually sign a
long-term contract with minimum volume commitments of ammonia shipped via pipeline.
Therefore, the pipeline tariff is relatively fixed over the contract period. Rail was one of the
main modes of anhydrous ammonia transportation. In 2007, 3.9 million tons of it was shipped
by rail, whereas 1.7 million tons by barge. According to U.S. Bureau of Labor Statistics, the
changes in producer price indices of rail and truck transportation between 2004 – 2019 were in
the same direction. However, the change for rail freight rate was more aggressive, relative to
truck rate change. Compared to the 2004 price, rail carriers increased their charge 74.5% by
2019, while truck only charged 42.2% more. Unlike transportation costs, the price of
warehousing and storage only increased 6.1% in 2019 from the price in 2007.
3. Literature Review
Early research has found that historical prices of nitrogen fertilizers were closely related
to natural gas prices during the period of 2000-2005 (Huang, 2007). However, more recent
studies have shown that the movement of fertilizer prices has been driven by the changes in
fertilizer demand, particularly increasing demand for corn, rather than natural gas prices. Li
(2016) examined the change in market competitiveness of the North American nitrogen fertilizer
industry during the period of 1999 – 2011. By using a Bayesian-based time-varying parameter
approach, he found that the changes in nitrogen price followed its marginal productivity closer
than its marginal cost and this tended to be stronger over the post-2006 period. Moreover, the
Page 15
15
impact of capacity utilization on nitrogen price increased over time, implying the potential for
higher market power in the industry caused by the capacity constraint.
Beckman and Riche (2015) have found the presence of a structural change occurring in
June 2008 by using a Quandt likelihood ratio test. Particularly, the relationship between
fertilizer and corn prices significantly increased after the break point. Furthermore, Bushnell and
Humber (2017) have analyzed the pass-through of U.S. natural gas prices to anhydrous ammonia
prices during the period of January 1998 – January 2016 by using a distributed lag regression.
They found a significant shift of pass-through rate around 2010, potentially resulting from a
merger of two leading producers in the fertilizer industry. The short-run pass-through of Henry
Hub natural gas price changes changed from 55% in the pre-2010 period to no pass-through after
2010. Meanwhile, the pass-through of the changes in corn price increased from an insignificant
number before January 2010 to 41% during the post-2010 period. The results of these studies
suggested that there may exist more than one structural break in nitrogen-based fertilizer prices,
caused by a decline in input prices, an increase in demand, and/or a shift in market concentration.
The earlier studies have focused on at most one structural break in the U.S. fertilizer market.
Moreover, some articles did not consider the potential structural break in price series when
testing for unit root, as well as cointegration.
Prior literature has studied the relationships among energy, fertilizer, and corn prices
using a time series approach. Humber (2014) estimated the impact of the 2010 merger by
adopting a structural vector autoregressive model. The results showed that the presence of a
merger increased fertilizer prices by 75 percent. In addition, the impulse response functions
indicated the unidirectional causality from natural gas prices to fertilizer price and bidirectional
causality between corn futures and fertilizer prices. The error correction model is the method
Page 16
16
that is often used to investigate both short- and long-run relationships among natural gas,
fertilizer, and corn prices (Beckman and Riche, 2015; Etienne et al., 2016). Beckman and Riche
(2015) have found that before June 2008, ammonia and corn prices had no significant
relationship, while no linkage between natural gas and ammonia prices was found after June
2008. Without consideration of a structural change, Etienne et al. (2016) found that a 1%
increase in the long-run average natural gas price reflects a 0.6% increase in the ammonia price,
while the cross-price elasticity between ammonia and corn was close to unity during the period
of 1994-2014. In the short run, a change in natural gas price has a significant impact on
ammonia price, but demand pressures from the corn market failed to significantly affect
ammonia prices.
In addition, there exist asymmetric volatilities in food and fertilizer prices. Specifically,
when energy prices increase, commodity and fertilizer prices also rise, whereas energy prices
decrease, those prices did not move together (Ott, 2012). Hernandez and Torero (2013) have
shown a 10-percentage point increase in level of concentration in a fertilizer market causes urea
prices to increase 8.2-16.5 percent by using a dynamic panel approach. In addition, a study of
the impact of mergers on productivity and market power found little evidence of an increase in
productivity, while average price markups substantially increased following a horizontal merger
(Blonigen and Pierce, 2016).
These outcomes indicate the potential existence of market power in the U.S. nitrogen
fertilizer industry. However, market power is not the sole reason of the unexplained divergence
between nitrogen and natural gas prices. As mentioned earlier, farmers’ decision of nitrogen use
can be also affected by shifts in other factors, such as the cost of transportation and storage,
which are usually not included in regressions due to limited data.
Page 17
17
4. Methodologies
4.1 Tests for Structural Breaks
U.S. natural gas and corn prices are likely to experience structural changes resulting from
the shale gas revolution and increasing demand for ethanol, respectively, which could chain to
domestic fertilizer prices. To test for stationarity of individual price series, I adopt the GLS-
based unit root test with multiple structural breaks under both the null and the alternative
hypotheses proposed in Carrion-i-Silvestre et al. (2009). Since the number of breaks in each
price series is also unknown, I identify the number of breaks by applying a sequential testing
procedure proposed in Kejriwal and Perron (2010).
The next step is to investigate whether the relationship between nitrogen and natural gas
prices has been stable over time. Based on the stationary test results (shown in section 6), all
price series are cointegrated of order 1. Therefore, I apply the tests for multiple structural breaks
in linear models suggested by Bai and Perron (1998, 2003). The tests endogenously determine
the number of structural changes and estimate the breakpoints. Another advantage of these
methods is that they allow for serial correlation and heterogeneity in the errors when no lagged
dependent presents as a regressor. The linear regression with m structural break (𝑚 + 1 regimes)
can be expressed as:
𝑦𝑡 = 𝒙𝑡′ 𝜷 + 𝒛𝑡
′ 𝜹𝑗 + 𝑢𝑡 (1)
where 𝑡 = 𝑇𝑗−1 + 1, . . . , 𝑇𝑗, 𝑗 = 1, . . . , 𝑚 + 1, 𝑇0 = 0, 𝑇𝑚+1 = 𝑇, and 𝑇 is the sample size. The
breakpoint (𝑇1, . . . , 𝑇𝑚) are treated as unknown. 𝑦𝑡 denotes the dependent variable (the first
difference of nitrogen prices). 𝒙𝑡 (𝑝 ×1) and 𝒛𝑡 (𝑞 × 1) are the vector of explanatory variables,
while 𝜷 and 𝜹𝑗 (𝑗 = 1, … , 𝑚 + 1) are the corresponding vectors of coefficients, where the
parameter 𝜷 does not vary across regimes. In this study, the regressors 𝒛𝑡 consist of the first
Page 18
18
differences of U.S. natural gas, international natural gas, and corn prices. Meanwhile, 𝒙𝑡
contains constant and seasonal dummy variables in the case of homogeneous error distributions.
I exclude 𝒙𝑡 in the least squares regression in the tests that allow heterogeneity in error
distributions across the breaks. The associated estimates of the parameters �̂�𝑗 are estimated by
minimizing the global sum of squares residuals of the objective function:
𝑆𝑇(𝑇1, . . , 𝑇𝑚) = ∑ ∑ [𝑦𝑡 − 𝒛𝑡′ 𝜹𝑗]
2
𝑇𝑖
𝑡=𝑇𝑖−1+1
.
𝑚+1
𝑖=1
(2)
Denote 𝑆𝑇(𝑇1, . . . , 𝑇𝑚) as the sum of squares residual with the estimated parameters. Then the
estimates of break points are obtained by a global minimization of the sum of squared residuals:
(�̂�1, . . . , �̂�𝑚) = 𝑎𝑟𝑔 min𝑇1,...,𝑇𝑚
𝑆𝑇(𝑇1, . . . , 𝑇𝑚)
I adopted two classes of tests for multiple unknown structural breaks introduced by Bai
and Perron (1998). The first test is the double maximum test of no structural break (𝑚 = 0)
versus an unknown number of structural breaks given an upper bound 𝑀 (0 < 𝑚 ≤ 𝑀). The test
statistics are based on sup 𝐹-statistics. There are two versions of test statistics: unweighted
(𝑈𝐷𝑀𝑎𝑥 𝐹𝑇) test statistics with equal weights across sup 𝐹-statistics; and weighted
(𝑊𝐷𝑀𝑎𝑥 𝐹𝑇) test statistics with individual weights based on critical values. Another test is the
sequential test of the null hypothesis of 𝑙 breaks against the alternative of 𝑙 + 1 breaks. The test
focuses on the difference in the sum of squared residuals between two models. Nevertheless, the
Bai and Perron tests are found to be highly sensitive the kind of tests, the assumption on the
number of breaks, and trimming parameters (Muthuramu and Uma Maheswari, 2019).
4.2 Pass-through Estimation
After identifying the number of breaks and break dates in the cointegrated regression, I
estimate the pass-through rates of the explanatory variables (natural gas and corn prices) to
Page 19
19
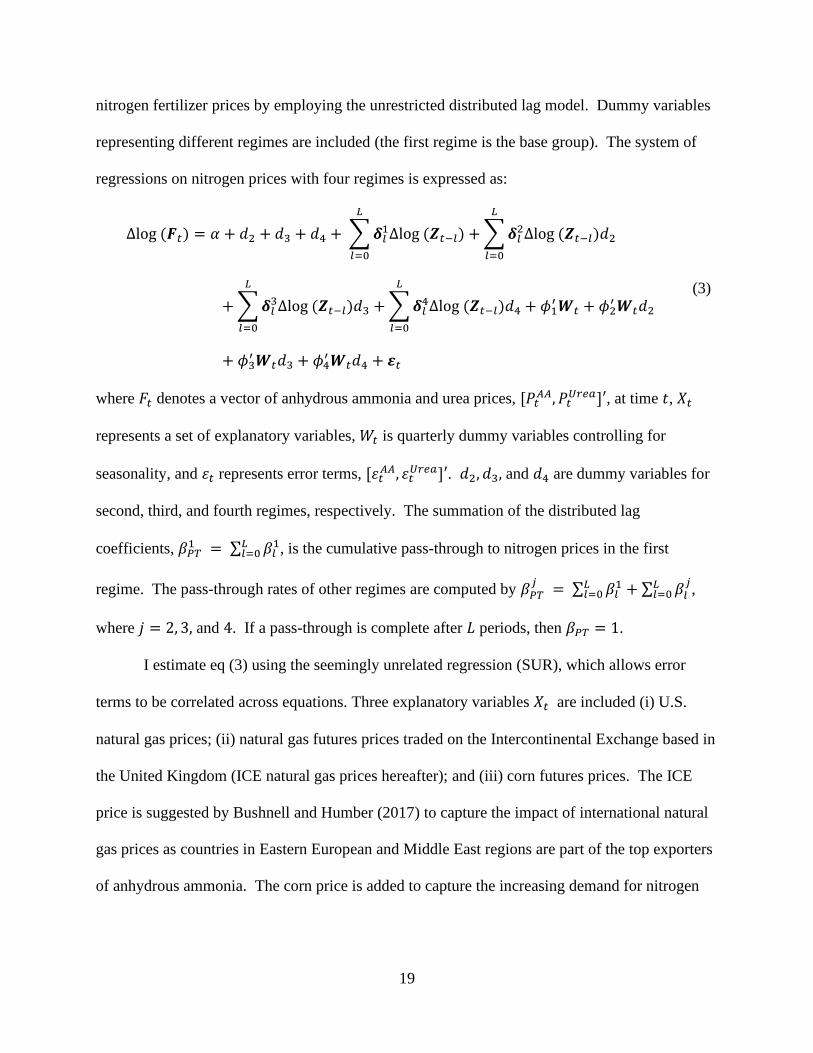
nitrogen fertilizer prices by employing the unrestricted distributed lag model. Dummy variables
representing different regimes are included (the first regime is the base group). The system of
regressions on nitrogen prices with four regimes is expressed as:
Δlog (𝑭𝑡) = 𝛼 + 𝑑2 + 𝑑3 + 𝑑4 + ∑ 𝜹𝑙1Δlog (𝒁𝑡−𝑙)
𝐿
𝑙=0
+ ∑ 𝜹𝑙2Δlog (𝒁𝑡−𝑙)𝑑2
𝐿
𝑙=0
+ ∑ 𝜹𝑙3Δlog (𝒁𝑡−𝑙)𝑑3
𝐿
𝑙=0
+ ∑ 𝜹𝑙4Δlog (𝒁𝑡−𝑙)𝑑4
𝐿
𝑙=0
+ 𝜙1′ 𝑾𝑡 + 𝜙2
′ 𝑾𝑡𝑑2
+ 𝜙3′ 𝑾𝑡𝑑3 + 𝜙4
′ 𝑾𝑡𝑑4 + 𝜺𝑡
(3)
where 𝐹𝑡 denotes a vector of anhydrous ammonia and urea prices, [𝑃𝑡𝐴𝐴, 𝑃𝑡
𝑈𝑟𝑒𝑎]′, at time 𝑡, 𝑋𝑡
represents a set of explanatory variables, 𝑊𝑡 is quarterly dummy variables controlling for
seasonality, and 𝜀𝑡 represents error terms, [𝜀𝑡𝐴𝐴, 𝜀𝑡
𝑈𝑟𝑒𝑎]′. 𝑑2, 𝑑3, and 𝑑4 are dummy variables for
second, third, and fourth regimes, respectively. The summation of the distributed lag
coefficients, 𝛽𝑃𝑇1 = ∑ 𝛽𝑙
1𝐿𝑙=0 , is the cumulative pass-through to nitrogen prices in the first
regime. The pass-through rates of other regimes are computed by 𝛽𝑃𝑇𝑗
= ∑ 𝛽𝑙1𝐿
𝑙=0 + ∑ 𝛽𝑙𝑗𝐿
𝑙=0 ,
where 𝑗 = 2, 3, and 4. If a pass-through is complete after 𝐿 periods, then 𝛽𝑃𝑇 = 1.
I estimate eq (3) using the seemingly unrelated regression (SUR), which allows error
terms to be correlated across equations. Three explanatory variables 𝑋𝑡 are included (i) U.S.
natural gas prices; (ii) natural gas futures prices traded on the Intercontinental Exchange based in
the United Kingdom (ICE natural gas prices hereafter); and (iii) corn futures prices. The ICE
price is suggested by Bushnell and Humber (2017) to capture the impact of international natural
gas prices as countries in Eastern European and Middle East regions are part of the top exporters
of anhydrous ammonia. The corn price is added to capture the increasing demand for nitrogen
Page 20
20
fertilizers. Instead of spot prices, using corn futures prices is more reasonable as the planting
decision occurs before corn prices are known due to the nature of agricultural products.
The U.S. and international natural gas prices are included to capture the shift in the
supply side of nitrogen production, while corn futures represent the change in demand for
nitrogen fertilizers. However, these explanatory variables cannot fully explain the variation in
nitrogen prices. There are other factors that might affect nitrogen prices, for example, potential
market power, government regulation and nitrogen’s transportation and storage costs. In
addition, the omission of the costs of transportation and storage could also result in a biased
estimation. Particularly, transportation and storage costs are positively related to corn prices. It
would likely cause an overestimation of the pass-through of the changes in corn prices.
5. Data The data used in this study are of monthly frequency during the period of February 1997
– January 2020 (276 observations), which covers the changes in the U.S. fertilizer industry
discussed earlier. Henry Hub natural gas spot prices (HH) are obtained from the U.S. Energy
Information Administration. Wholesale prices of anhydrous ammonia and granular urea sold
within the U.S. Corn Belt are used to represent for nitrogen end user price, obtained from Green
Markets/Bloomberg. The prices of No. 2 yellow corn futures traded on the Chicago Board of
Trade are obtained from Bloomberg. Additionally, to capture the plausible impact of
international natural gas prices, I adopt futures prices of natural gas traded on the
Intercontinental Exchange (ICE), obtained from Bloomberg.
Table 5.1 reports that anhydrous ammonia prices are, on average, higher and more
volatile than urea prices using the entire sample. Meanwhile, the mean of ICE natural gas prices
is greater than the mean of HH prices. Table 5.2 shows that the correlations between
Page 21
21
international natural gas and nitrogen prices are substantially higher than those of domestic gas
and nitrogen prices. Besides, corn prices are highly related to nitrogen prices.
Table 5.1 also illustrates the summary statistics of the data during four time periods based
on the three structural breaks: (i) October 2006; (ii) March 2010; and (iii) October 20162. The
average prices of both types of nitrogen fertilizers are higher and more volatile between October
2006 to September 2016, compared to the prices before October 2006 and after the third quarter
of 2016. The averages of corn future prices fairly followed the trend of nitrogen prices as they
increased after the first break and slightly declined after the third structural break. Also, I notice
that the volatility of nitrogen and corn prices dramatically dropped in the last time interval.
Meanwhile, Henry Hub natural gas prices were high and volatile during the pre-March 2010
period, compared to the average HH prices at $3.45 per million Btu during March 2010 –
September 2016, and at $2.9 per million Btu during October 2016 – January 2020. Unlike the
HH gas prices, the mean of Intercontinental Exchange natural gas prices rose to $10 per million
Btu during October 2006 – February 2010 and stayed relatively high afterward.
6. Empirical Results
Pass-through Estimations with Full Sample
To outline the analysis, I will explore pass-through rates with no structural break before
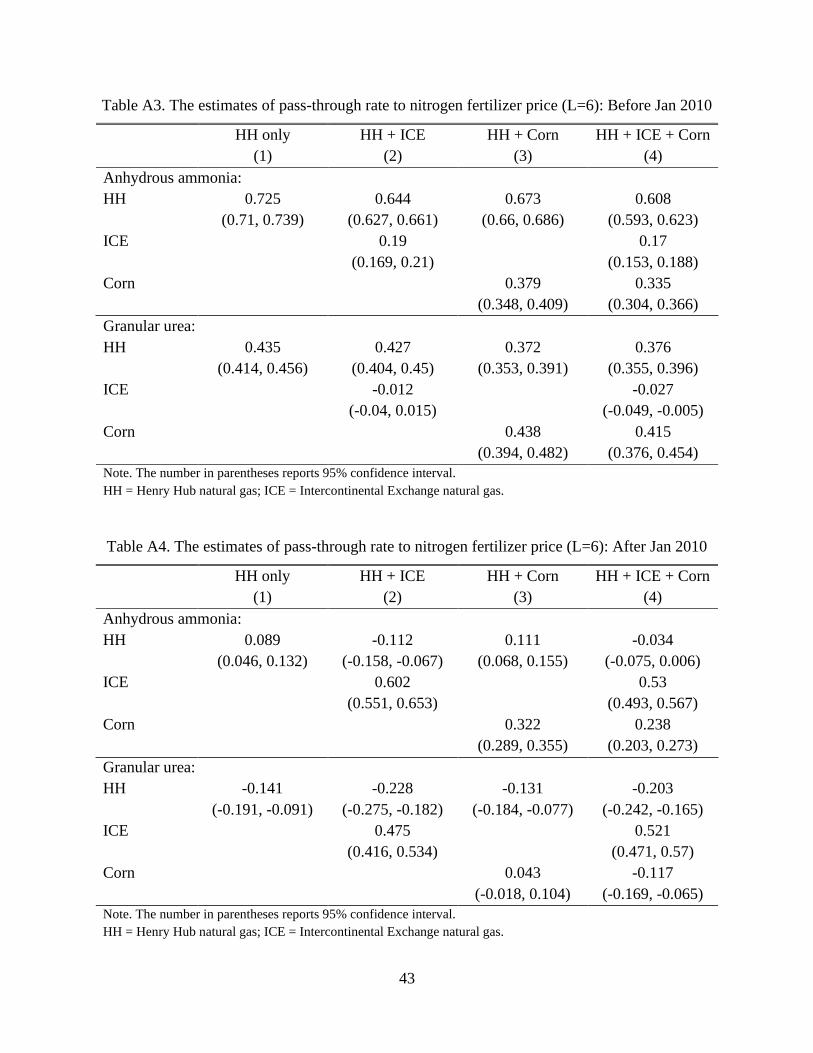
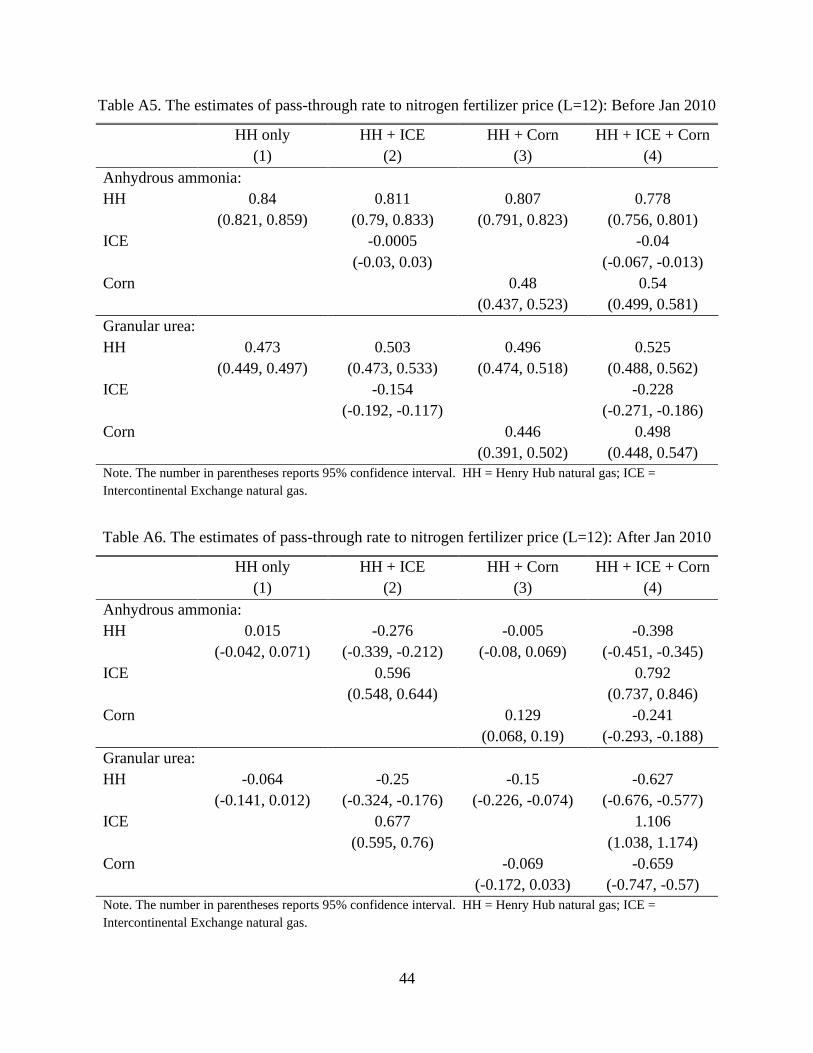
moving to the models with structural breaks. The estimates of the pass-through to anhydrous
ammonia and granular urea prices in eq (3) are computed using the seemingly unrelated
regression. Bushnell and Humber (2017) used lag 3, 6, and 12 for explanatory variables to
represent the short-, middle-, and long-run pass-through. In this paper, I select only lag 3 for
explanatory variables to preserve degrees of freedom. Additionally, the coefficients of higher
2 More details in section 6.
Page 22
22
lags are more likely to be small and insignificant3, reflecting that nitrogen producers are more
likely to adjust their prices within 3-4 months of input price changes.
The estimates of pass-through rates for the whole sample are reported in table 6.1. The
regression on ammonia prices is shown in the upper section of the table, while the lower section
illustrates the regression on urea prices. Column (1) indicates that the pass-through rate of the
change in domestic natural gas prices in the first model (HH only) is approximately 46.1% for
anhydrous ammonia and 27.3% for urea, and the pass-through rate of the Henry Hub price
changes declines as more control variables are added (see columns (2)-(4)). These results imply
that the Henry Hub natural gas price is unlikely to be the sole factor influencing the shift in
nitrogen prices. In regression (4), which adds both international natural gas and corn futures
prices, the pass-through of the changes of HH natural gas, ICE natural gas, and corn prices to
ammonia prices are 38.9%, 22%, and 20.8%, respectively, and to urea price are 17.6%, 24.1%,
and 34.1%, respectively. In other words, 61% of the changes in anhydrous ammonia prices are
explained by the changes in input prices (HH and ICE natural gas), while 20.8% are from the
shift in output prices (corn). The estimated pass-through of the shift in HH prices to urea prices
is notably lower (17.6%-27.3%), which is intuitive because urea contains less nitrogen content
than anhydrous ammonia. Surprisingly, the changes in corn prices have more influence on urea
prices than on anhydrous ammonia prices.
The outcomes indicate that the changes in domestic natural gas prices are not likely to be
the sole factor affecting the fluctuation in anhydrous ammonia and urea prices. Thus, the
primary model in this paper is the model with the first differences of HH natural gas, ICE natural
gas, and corn prices and their lags as regressors.
3 Based on the results on the models with one structural break in table A3-A6 in appendix
Page 23
23
Tests for Multiple Structural Changes
Next, I test for the existence of structural changes in the relationship among nitrogen, its
input, and its output prices. First, I check whether the price series are stationary. However, if
there are structural breaks in the price series, the conventional unit root test may not provide an
accurate outcome. Hence, I identify the number of structural breaks in individual price series
proposed by Kejriwal and Perron (2010). Multiple structural changes are found in all price series
over the sample period. Then, I employ the GLS-based unit root test allowing for multiple
unknown structural breaks and both level and slope shifts developed by Carrion-i-Silvestre et al.
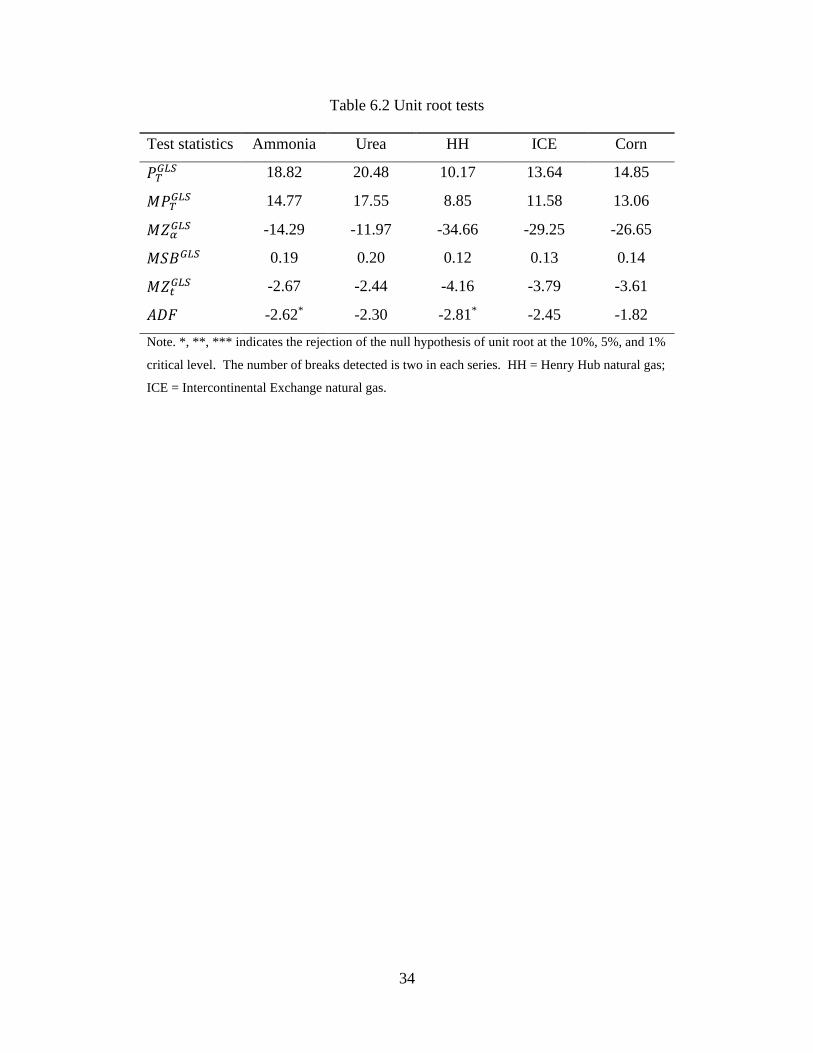
(2009). Table 6.2 reports the results of the GLS-based and the augmented Dickey-Fuller (ADF)
unit root tests. All GLS-based test statistics cannot reject the null hypothesis of a unit root at 5%
significant level for all other series, indicating that these individual series are integrated.
Meanwhile, the ADF tests show similar results except for ammonia and domestic natural gas
price series, which are found to be trend stationary. These results indicate that the conventional
unit root test would provide a misleading outcome in the presence of structural breaks.
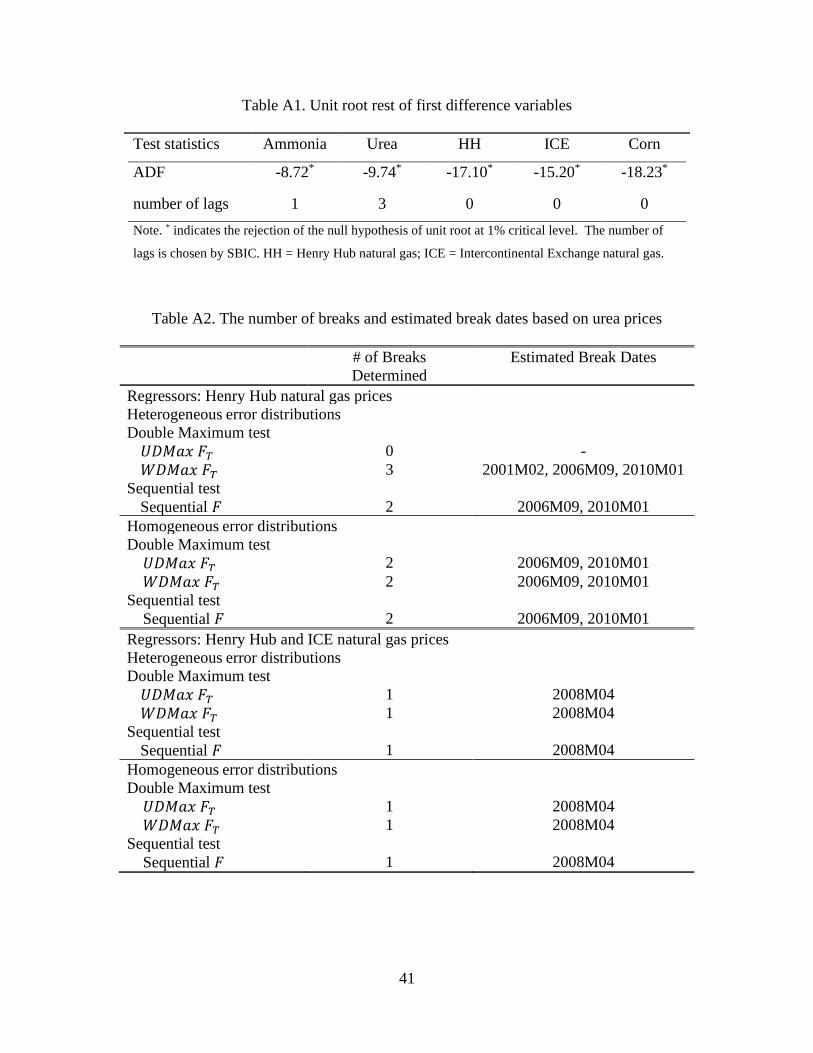
The first differences of all individual price series are found to have no break within the
series. Without a structural break, the ADF unit root test can be applied to the first difference of
these series. The results show a strong rejection of the null hypothesis of a unit root in all series
(see table A1 in appendix). Thus, I can conclude that all price series are integrated of order one
or I(1), and their first differences are stationary.
Next, I adopt a method in Bai and Perron (1998, 2003) to test for the existence of
structural breaks in the relationship between natural gas, corn, and ammonia prices. The least-
squares regressions are in the forms of Δ log( 𝑃𝑡𝐴𝐴) = 𝛼 + ∑ 𝛽𝑙Δ log( 𝑋𝑡−𝑙)
𝐿𝑙=0 + 𝜙′𝑊𝑡 + 𝜀𝑡,
where 𝐹𝑡 denote anhydrous ammonia prices, 𝑋𝑡 represents Henry Hub natural gas, ICE natural
Page 24
24
gas and corn prices, and 𝑊𝑡 is quarterly dummy variables. Only the parameters 𝛽𝑙 are tested for
parameter stability. I apply the tests with 15% trimming, so the maximum number of breaks is 5.
Table 6.3 shows the results of the tests for multiple structural changes in the relationship
among anhydrous ammonia, natural gas, and corn prices. In the model with only the first
difference of domestic natural gas price and its lags as regressors, the outcomes strongly support
the results of one break in April 2010, corresponding to the merger between CF Industries and
Terra Industries. In the meantime, the tests detect 3-5 breaks in the regression with the first
differences of Henry Hub natural gas, ICE natural gas, and corn prices and their lags. I also
apply the tests on urea prices, the outcomes are entirely different with none or 4-5 structural
changes (see table A2 in appendix).
Despite inconsistency between the results from the tests on ammonia and urea prices,
ammonia prices are used to represent nitrogen prices since anhydrous ammonia is the main type
of nitrogen fertilizers used for growing maize in the U.S. Corn Belt. Furthermore, three
structural breaks can preserve more degrees of freedom in each subsample. Therefore, I estimate
the pass-through rates in four regimes corresponding to the ammonia model results.
The first detected break occurred in October 2006, in part, because of the shale gas
development and increasing global nitrogen consumption. The merger agreement between CF
and Terra Industries finalized and is likely to be the main reason for the structural change in
March 2010. Lastly, after the third break in October 2016, many production capacity expansion
projects were completed, which increase domestic nitrogen production. In the meantime, high
corn supply put downward pressure on the prices.
Page 25
25
Pass-through Estimations with One Structural Break
Here, I assume one structural break occurring in January 2010, same as in Bushnell and
Humber (2017). Table 6.4 shows the substantial decline in the estimates of the pass-through rate
of domestic natural gas prices to nitrogen prices after January 2010. In particular, more than half
of Henry Hub price changes contribute to the changes in anhydrous ammonia prices before
January 2010, then the pass-through drops to 1.4%. Meanwhile, the transmission of the shift in
HH prices on urea prices drops to a negative value between January 2010 and January 2020,
from almost 40%. Prior to 2010, the changes in ICE natural gas prices have a low impact on
nitrogen prices. Then, ICE price changes have become the dominant factor in nitrogen price
changes during the post-2010 period, accounting for 38% of the anhydrous ammonia price
changes and 61% of the urea price changes. In total, the contribution of the input price (HH and
ICE natural gas) changes to the variation in anhydrous ammonia prices decreases to 40% after
2010, from 74%.
Before January 2010, the output price changes have greater effects on urea prices than on
ammonia prices. These estimates are unexpected since anhydrous ammonia has been mainly
used for growing corn in the U.S. Corn Belt for years. However, after January 2010, the impact
of corn price changes on anhydrous ammonia prices more than double, but its effect on urea
prices sharply subsides.
Compared to Bushnell and Humber (2017)’s article, the estimates of pass-through rate
during the pre-January 2010 period are similar. Specifically, the pass-through of Henry Hub,
ICE, and corn price changes to anhydrous ammonia prices were 0.55, 0.18, and 0.15, relative to
0.58, 0.16, and 0.13 in table 6.4. After January 2010, the estimates of the pass-through rate of
HH price changes are approximately 1% in both studies. Nevertheless, the shift in international
Page 26
26
natural gas prices has greater impact and the changes in corn prices has lower effect on
anhydrous ammonia prices in this paper. The input pass-through rate found in this paper is
39.6% versus 29% in their paper. Meanwhile, Bushnell and Humber (2017) found that the effect
of corn price changes is more dominant with the pass-through rate of 41% versus 29.7% in this
paper. The differences in outcomes are because the post-2010 period in Bushnell and Humber
(2017) was between January 2010 and January 2016, implying that there may exist another
structural change after January 2010.
Pass-through Estimations with Three Structural Changes
Now I consider three structural changes occurring in October 2006, March 2010, and
October 2016. Table 6.5 shows a significant shift in the correlation coefficients among nitrogen
fertilizer, natural gas, and corn prices across time periods. The correlation between HH natural
gas and nitrogen prices considerably drops from 0.67-0.71 in October 2006 – February 2010 to
0.12-0.14 during March 2010 – September 2016. After the third quarter of 2016, the correlation
between domestic natural gas and ammonia prices slightly regains to 0.22, while the correlation
between HH and urea prices continues to decrease to 0.06. The correlation coefficients between
international natural gas and nitrogen prices gradually decline over time. However, the
correlations between ICE and nitrogen prices have been stronger than the correlations between
HH and nitrogen prices since October 2006.
The correlation coefficients between nitrogen and corn prices are relatively high at 0.71-
0.81 for anhydrous and at 0.67-0.77 for urea during October 2006 – September 2016. However,
the correlations sharply fall to 0.22 for ammonia and 0.30 for urea after September 2016. These
Page 27
27
changes in correlation coefficients support the multiple structural breaks in the relationship
between nitrogen fertilizer, its input and output prices.
Table 6.6 reports the results of the pass-through estimation of the full model with three
breaks. In the first regime (before October 2006), Henry Hub price variation is the major factor
that drives the changes in anhydrous ammonia prices, followed by ICE price changes. Similarly,
the changes in HH and ICE prices dominantly transmit to urea prices during the same period.
The pass-through rate of input price changes is approximately 65.5% to ammonia prices and
44.4% to urea prices. The fluctuation in demand-side did not have a positive impact on nitrogen
prices in this period, indicating that nitrogen prices followed closer its marginal costs rather than
relative low corn prices during the period.
In the second regime, during October 2006 – February 2010, increasing global ethanol
demand likely increase the impact of corn price variation on ammonia and urea prices with the
pass-through rates of 11.8% and 61.1%, respectively. The increase in shale gas production in the
U.S. and higher average natural gas prices abetted a strong pass through of the input price
changes with the pass-through rate of 112% in the ammonia case and 76% in the urea case.
The second structural break occurs in March 2010, coinciding with the merger between
CF Industries and Terra Industries. In addition, high volatility of corn prices is observed during
the third regime with a peak at $8.06 per bushel. Accordingly, the pass-through of corn price
changes on ammonia prices rises to 35.2%. For the urea model, however, the transmission of
corn price changes considerably diminishes to 11.9%. In contrast to the previous regimes,
anhydrous ammonia and urea prices negatively respond to the changes in Henry Hub natural gas
prices with the pass-through rates of -14.6% and -33.6%, respectively, during March 2010 –
September 2016, corresponding to a decline in Henry Hub average price to $3.5 per MMBtu.
Page 28
28
The fluctuation in ICE prices dominantly induces changes in the prices of both nitrogen types,
rather than domestic natural gas price changes as in the previous two regimes, potentially
because of relatively high international natural gas prices at $9 on average. Overall, the impact
of input price variation on anhydrous ammonia prices plummets to 25.4% from 112% in the
previous period, and the effect on urea prices drops to 39.8% from 76%.
In the fourth regime starting in the fourth quarter of 2016, many capacity expansions
have been completed and started operation and the merger between Agrium and Potash Corp
finalized in January 2018. The negative transmission of domestic natural gas price changes to
ammonia and urea prices persists from the earlier time interval. Likewise, the transmission of
ICE gas price changes stays strong at the pass-through rates of 44% for the ammonia case and
61% for the urea model. The total effect of input price changes slightly rises to 32.6% on
anhydrous ammonia prices, while the effect on urea prices sharply drops to 5.2% due to strong
negative effects of HH price changes. The demand pressure is unlikely to have a significant
impact on nitrogen prices in this regime, indicated by negative pass-through of corn price
changes to both nitrogen prices during the period. These results are partly due to stable demand
for biofuel and high supply of corn, leading to decreases in corn prices and its volatility.
The transmission of input price changes on anhydrous ammonia prices is strongest during
October 2006 – February 2010, when domestic natural gas production and prices were
skyrocketing. The pass-through rate plummets during March 2010 – September 2016 and lightly
regains afterward. The overall pass-through rates (HH, ICE, and corn price changes) of nitrogen
prices are highly volatile throughout the sample period. The total pass-through rate to ammonia
prices peaks at 124% during the second regime and hits the bottom at 12.3% after the third
break.
Page 29
29
The changes in the relationship among nitrogen, natural gas, and corn prices over time
indicate that multiple factors have a great impact on nitrogen prices. Nitrogen prices are likely to
adjust based on volatile factor prices. The sharp decline in pass-through rates of input price
changes and the increase in pass-through of output price changes after March 2010 indicates a
potential increase in market concentration as CF Industries and Terra Industries merged.
However, the impact of merger in January 2018 is not clear partially due to insufficient
observations. The incomplete pass-through reflects the effects of other factors, such as the
changes in capital costs, the changes in government regulation, an increase in transportation and
storage costs, especially rail rates. An average rail rate in 2010-2019 was 31.5% greater than the
average in 2004-2009. Concurrently, the average truck rate increased 17.4%, and the average
water transportation price increased 19.9% during the same period.
7. Conclusions
As the main input of anhydrous ammonia, natural gas price is expected to highly affect
anhydrous ammonia and other nitrogen fertilizer product prices under perfect competition. Due
to new innovations in natural gas extraction, domestic natural gas prices have dropped to a
relative low level. Even though prior literature showed that anhydrous ammonia and Henry Hub
spot prices were highly correlated during the period of 2000-2005, more recent data indicated
that the impact of other factors may dominate.
This study examines the changes in the relationship between the prices of nitrogen
fertilizer and its related factors. Three structural changes are found during February 1997 –
January 2020: (i) October 2006; (ii) March 2010; and (iii) October 2016. The first structural
change is likely to occur as a result of increasing natural gas production and demand for ethanol,
while the second break is expected to occur due to the merger between two leading firms and the
Page 30
30
decline in domestic natural gas prices. The structural break in the fourth quarter of 2016 happens
potentially because of increasing production capacity of U.S. nitrogen fertilizer and high corn
supply.
I employ the seemingly unrelated regression to estimate pass-through rates of natural gas
and corn prices to anhydrous ammonia and urea prices. Henry Hub natural gas prices is found as
the dominant factor on nitrogen prices during the pre-March 2010 period. However, the results
provide evidence that nitrogen prices instead depend more on international natural gas price after
March 2010, possibly due to high import reliance and relatively high international natural gas
prices. The pass-through rates of the shift in input prices to both ammonia and urea prices are
highly volatile over the sample period. The highest pass-through rate of input price changes is in
the second regime when natural gas prices were averagely high and highly volatile.
The impact of corn price changes on anhydrous ammonia prices sharply increases after
October 2006, reflecting an increase in global demand for fuel ethanol. However, starting in the
fourth quarter 2016, the shift in corn prices has lost its significance on ammonia prices and the
pass-through rate drastically drop to a negative value, in part, due to a stable global demand for
ethanol and high maize supply that put downward pressure on corn prices. Likewise, urea prices
positively respond to corn price changes between October 2006 and September 2016, with a
remarkably high pass-through rate during October 2006 – February 2010.
The changes in the estimates of pass-through for anhydrous ammonia price support the
existence of more than one structural break in the relationship among nitrogen, natural gas, and
corn prices. However, the outcomes for granular urea price are more ambiguous since the
structural breaks are determined by using ammonia prices and urea contains lower percentage of
nitrogen.
Page 31
31
The incomplete total pass-through rate indicates that some influencing factors are missing
from the estimation, especially in the post-September 2016 period. Other factors affecting the
U.S. nitrogen fertilizer market include the merger between Agrium and PotashCorp in January
2018, the completion of many capacity expansion projects, the change in government regulation,
and increasing costs of transportation and storage.
Page 32
32
Table 5.1 Summary statistics
Variables Mean Std. Dev. Min Max
Full sample (276 Obs):
Ammonia 437.64 200.77 140 1,100
Urea 303.58 137.28 105 880
HH 4.27 2.18 1.72 13.42
ICE 7.10 3.84 1.56 20.97
Corn 358.71 151.58 180.25 806.5
Feb 1997 – Sep 2006 (115 Obs):
Ammonia 265.09 94.26 140 495
Urea 191.51 60.95 105 335
HH 4.49 2.45 1.72 13.42
ICE 4.77 3.73 1.56 16.38
Corn 228.24 30.10 180.25 320
Oct 2006 – Feb 2010 (41 Obs):
Ammonia 559.02 214.70 340 1,100
Urea 422.07 151.34 260 880
HH 6.55 2.29 2.99 12.69
ICE 10 4.22 4.56 20.97
Corn 419.27 94.50 320.75 724.75
Mar 2010 – Sep 2016 (79 Obs):
Ammonia 633.35 113.29 400 820
Urea 413.67 101.17 220 775
HH 3.45 0.88 1.73 6
ICE 9.08 2.20 4.51 12.60
Corn 513.22 153.36 301.5 806.5
Oct 2016 – Jan 2020 (40 Obs):
Ammonia 424.75 64.19 320 540
Urea 287.88 37.84 210 395
HH 2.89 0.45 2.02 4.09
ICE 6.83 1.32 3.21 9.73
Corn 368.95 20.09 336.75 427
Note. This table shows the summary statistics of anhydrous ammonia, urea, HH, ICE, and corn
prices. The unit of measure for nitrogen is $/short ton, for natural gas is $/MMBtu, and for corn
is ¢/Bu. HH = Henry Hub natural gas; ICE = Intercontinental Exchange natural gas.
Page 33
33
Table 5.2 Correlation Coefficients
Ammonia Urea HH ICE Corn
Feb 1997 – Jan 2020 (276 Obs):
Ammonia 1
Urea 0.93 1
HH 0.28 0.33 1
ICE 0.80 0.82 0.56 1
Corn 0.83 0.80 -0.01 0.60 1
Note. This table shows the correlation coefficients among anhydrous ammonia, urea, HH, ICE,
and corn prices. HH = Henry Hub natural gas; ICE = Intercontinental Exchange natural gas.
Table 6.1 The estimates of pass-through rate to nitrogen fertilizer prices: Full sample
HH only
(1)
HH + ICE
(2)
HH + Corn
(3)
HH + ICE + Corn
(4)
Anhydrous ammonia:
HH 0.461
(0.456, 0.466)
0.406
(0.40, 0.411)
0.439
(0.434, 0.444)
0.389
(0.383, 0.394)
ICE 0.224
(0.218, 0.231)
0.22
(0.213, 0.226)
Corn 0.237
(0.229, 0.245)
0.208
(0.20, 0.217)
Granular urea:
HH 0.273
(0.267, 0.28)
0.211
(0.204, 0.218)
0.229
(0.223, 0.236)
0.176
(0.169, 0.182)
ICE 0.262
(0.254, 0.27)
0.241
(0.233, 0.249)
Corn 0.371
(0.361, 0.382)
0.341
(0.33, 0.351)
Note. The number in parentheses reports 95% confidence interval.
HH = Henry Hub natural gas; ICE = Intercontinental Exchange natural gas.
Page 34
34
Table 6.2 Unit root tests
Test statistics Ammonia Urea HH ICE Corn
𝑃𝑇𝐺𝐿𝑆 18.82 20.48 10.17 13.64 14.85
𝑀𝑃𝑇𝐺𝐿𝑆 14.77 17.55 8.85 11.58 13.06
𝑀𝑍𝛼𝐺𝐿𝑆 -14.29 -11.97 -34.66 -29.25 -26.65
𝑀𝑆𝐵𝐺𝐿𝑆 0.19 0.20 0.12 0.13 0.14
𝑀𝑍𝑡𝐺𝐿𝑆 -2.67 -2.44 -4.16 -3.79 -3.61
𝐴𝐷𝐹 -2.62* -2.30 -2.81* -2.45 -1.82
Note. *, **, *** indicates the rejection of the null hypothesis of unit root at the 10%, 5%, and 1%
critical level. The number of breaks detected is two in each series. HH = Henry Hub natural gas;
ICE = Intercontinental Exchange natural gas.
Page 35
35
Table 6.3 The number of breaks and estimated break dates based on ammonia prices
# of Breaks
Determined
Estimated Break Dates
Regressors: Henry Hub natural gas prices
Heterogeneous error distributions
Double Maximum test
𝑈𝐷𝑀𝑎𝑥 𝐹𝑇 1 2010M04
𝑊𝐷𝑀𝑎𝑥 𝐹𝑇 1 2010M04
Sequential test
Sequential 𝐹 1 2010M04
Homogeneous error distributions
Double Maximum test
𝑈𝐷𝑀𝑎𝑥 𝐹𝑇 1 2010M04
𝑊𝐷𝑀𝑎𝑥 𝐹𝑇 0 -
Sequential test
Sequential 𝐹 1 2010M04
Regressors: Henry Hub and ICE natural gas prices
Heterogeneous error distributions
Double Maximum test
𝑈𝐷𝑀𝑎𝑥 𝐹𝑇 1 2007M06
𝑊𝐷𝑀𝑎𝑥 𝐹𝑇 5 2003M06, 2006M10, 2010M02,
2013M06, 2016M10
Sequential test
Sequential 𝐹 1 2007M06
Homogeneous error distributions
Double Maximum test
𝑈𝐷𝑀𝑎𝑥 𝐹𝑇 1 2007M06
𝑊𝐷𝑀𝑎𝑥 𝐹𝑇 5 2003M04, 2006M09, 2010M02,
2013M06, 2016M10
Sequential test
Sequential 𝐹 0 -
Regressors: Henry Hub natural gas and corn prices
Heterogeneous error distributions
Double Maximum test
𝑈𝐷𝑀𝑎𝑥 𝐹𝑇 1 2010M04
𝑊𝐷𝑀𝑎𝑥 𝐹𝑇 5 2003M06, 2006M10, 2010M02,
2013M06, 2016M10
Sequential test
Sequential 𝐹 2 2006M10, 2010M03
Homogeneous error distributions
Double Maximum test
𝑈𝐷𝑀𝑎𝑥 𝐹𝑇 1 2010M04
𝑊𝐷𝑀𝑎𝑥 𝐹𝑇 0 -
Sequential test
Sequential 𝐹 1 2010M03
Page 36
36
Table 6.3 (cont.) The number of breaks and estimated break dates based on ammonia prices
# of Breaks
Determined
Estimated Break Dates
Regressors: Henry Hub natural gas, ICE natural gas, and corn prices
Heterogeneous error distributions
Double Maximum test
𝑈𝐷𝑀𝑎𝑥 𝐹𝑇 3 2006M10, 2010M03, 2016M10
𝑊𝐷𝑀𝑎𝑥 𝐹𝑇 5 2003M06, 2006M10, 2010M02,
2013M06, 2016M10
Sequential test
Sequential 𝐹 3 2006M10, 2010M03, 2016M10
Homogeneous error distributions
Double Maximum test
𝑈𝐷𝑀𝑎𝑥 𝐹𝑇 5 2003M06, 2006M10, 2010M02,
2013M06, 2016M10
𝑊𝐷𝑀𝑎𝑥 𝐹𝑇 5 2003M06, 2006M10, 2010M02,
2013M06, 2016M10
Sequential test
Sequential 𝐹 3 2006M10, 2010M03, 2016M10
Table 6.4 The estimates of pass-through rate to nitrogen fertilizer prices in one-break model
Before Jan 10 After Jan 10
Anhydrous ammonia:
HH 0.583
(0.576, 0.589)
0.014
(0.005, 0.023)
ICE 0.159
(0.151, 0.167)
0.382
(0.37, 0.393)
Corn 0.126
(0.116, 0.137)
0.297
(0.285, 0.31)
Granular urea:
HH 0.391
(0.383, 0.40)
-0.26
(-0.272, -0.249)
ICE 0.091
(0.081, 0.101)
0.609
(0.594, 0.625)
Corn 0.452
(0.438, 0.466)
0.156
(0.139, 0.173)
Note. The number in parentheses reports 95% confidence interval.
HH = Henry Hub natural gas; ICE = Intercontinental Exchange natural gas.
Page 37
37
Table 6.5 Correlation coefficients
Ammonia Urea HH ICE Corn
Feb 1997 – Sep 2006 (115 Obs):
Ammonia 1
Urea 0.96 1
HH 0.91 0.86 1
ICE 0.82 0.85 0.76 1
Corn -0.003 -0.01 -0.13 -0.07 1
Oct 2006 – Feb 2010 (41 Obs):
Ammonia 1
Urea 0.91 1
HH 0.67 0.71 1
ICE 0.89 0.89 0.80 1
Corn 0.71 0.77 0.78 0.83 1
Mar 2010 – Sep 2016 (79 Obs):
Ammonia 1
Urea 0.77 1
HH 0.14 0.12 1
ICE 0.70 0.71 0.49 1
Corn 0.81 0.67 0.13 0.69 1
Oct 2016 – Jan 2020 (40 Obs):
Ammonia 1
Urea 0.66 1
HH 0.22 0.06 1
ICE 0.30 0.51 0.41 1
Corn 0.22 0.30 -0.33 -0.12 1
Note. This table shows the correlation coefficients among anhydrous ammonia, urea, HH,
ICE, and corn prices. HH = Henry Hub natural gas; ICE = Intercontinental Exchange
natural gas.
Page 38
38
Table 6.6 The estimates of pass-through rate in three structural breaks model
Before Oct 06 Oct 06 – Feb 10 Mar 10 – Sep 16 Oct 16 – Jan 20
Anhydrous ammonia (Adjusted R2 = 0.45)
HH 0.50
(0.493, 0.506)
1.04
(1.025, 1.056)
-0.146
(-0.156, -0.136)
-0.118
(-0.138, 0.098)
ICE 0.186
(0.175, 0.197)
0.081
(0.07, 0.092)
0.40
(0.386, 0.415)
0.444
(0.425, 0.463)
Corn -0.273
(-0.287, -0.258)
0.118
(0.101, 0.134)
0.352
(0.34, 0.365)
-0.203
(-0.247, -0.16)
Granular urea (Adjusted R2 = 0.22)
HH 0.212
(0.204, 0.221)
1.04
(1.018, 1.062)
-0.336
(-0.35, -0.322)
-0.557
(-0.585, -0.529)
ICE 0.272
(0.257, 0.287)
-0.27
(-0.285, -0.255)
0.734
(0.714, 0.754)
0.61
(0.583, 0.636)
Corn -0.232
(-0.252, -0.212)
0.611
(0.589, 0.634)
0.119
(0.102, 0.136)
-0.679
(-0.739, -0.618)
Note. The number in parentheses reports 95% confidence interval.
HH = Henry Hub natural gas; ICE = Intercontinental Exchange natural gas.
Breushch-Pagan (1980) test statistics is 48.9 (p-value = 0.00), indicating correlated errors terms across equations.
Appendix
Source: U.S. Energy Information Administration
Figure A1. U.S. Natural Gas Marketed Production from 1997 to 2019
15000
20000
25000
30000
35000
40000
199
7
199
8
199
9
200
0
200
1
200
2
200
3
200
4
200
5
200
6
200
7
200
8
200
9
201
0
201
1
201
2
201
3
201
4
201
5
201
6
201
7
201
8
201
9
U.S
. N
atura
l G
as P
rod
uct
ion
(tho
usa
nd
mil
lio
ns
cub
ic f
eet)
Page 39
39
Source: IFASTAT
Figure A2. Ammonia Direct Application between 1995 – 2018
Source: IFASTAT
Figure A3. Urea Consumption between 1995 – 2018
65
70
75
80
85
90
95
100
105
199
5
199
6
199
7
199
8
199
9
200
0
200
1
200
2
200
3
200
4
200
5
200
6
200
7
200
8
200
9
201
0
201
1
201
2
201
3
201
4
201
5
201
6
201
7
201
8
Am
mo
nia
Dir
ect
Ap
pli
cati
on
(Bas
e yea
r 1
99
5 =
10
0)
World US
60
80
100
120
140
160
180
200
19
95
19
96
19
97
19
98
19
99
20
00
20
01
20
02
20
03
20
04
20
05
20
06
20
07
20
08
20
09
20
10
20
11
20
12
20
13
20
14
20
15
20
16
20
17
20
18
Ure
a C
on
sum
pti
on
(Bas
e ye
ar 1
99
5 =
10
0)
World US
Page 40
40
Source: EIA, Green Markets, Bloomberg
Figure A4. Ammonia, Henry Hub natural gas, and corn prices during Jan 1997- Feb 2020
0
2
4
6
8
10
12
14
16
0
200
400
600
800
1000
1200
97 98 99 00 01 02 03 04 05 06 07 08 09 10 11 12 13 14 15 16 17 18 19 20
Hen
ry H
ub
Pri
ces
($/M
MB
tu)
Co
rn f
utu
res
pri
ces
($/B
u)
Anhyd
rous
Am
mo
nia
Pri
ces
($/m
etri
c to
n)
Monthly
AA Corn HH
Oct 06 Mar 10 Oct 16
Page 41
41
Table A1. Unit root rest of first difference variables
Test statistics Ammonia Urea HH ICE Corn
ADF -8.72* -9.74* -17.10* -15.20* -18.23*
number of lags 1 3 0 0 0
Note. * indicates the rejection of the null hypothesis of unit root at 1% critical level. The number of
lags is chosen by SBIC. HH = Henry Hub natural gas; ICE = Intercontinental Exchange natural gas.
Table A2. The number of breaks and estimated break dates based on urea prices
# of Breaks
Determined
Estimated Break Dates
Regressors: Henry Hub natural gas prices
Heterogeneous error distributions
Double Maximum test
𝑈𝐷𝑀𝑎𝑥 𝐹𝑇 0 -
𝑊𝐷𝑀𝑎𝑥 𝐹𝑇 3 2001M02, 2006M09, 2010M01
Sequential test
Sequential 𝐹 2 2006M09, 2010M01
Homogeneous error distributions
Double Maximum test
𝑈𝐷𝑀𝑎𝑥 𝐹𝑇 2 2006M09, 2010M01
𝑊𝐷𝑀𝑎𝑥 𝐹𝑇 2 2006M09, 2010M01
Sequential test
Sequential 𝐹 2 2006M09, 2010M01
Regressors: Henry Hub and ICE natural gas prices
Heterogeneous error distributions
Double Maximum test
𝑈𝐷𝑀𝑎𝑥 𝐹𝑇 1 2008M04
𝑊𝐷𝑀𝑎𝑥 𝐹𝑇 1 2008M04
Sequential test
Sequential 𝐹 1 2008M04
Homogeneous error distributions
Double Maximum test
𝑈𝐷𝑀𝑎𝑥 𝐹𝑇 1 2008M04
𝑊𝐷𝑀𝑎𝑥 𝐹𝑇 1 2008M04
Sequential test
Sequential 𝐹 1 2008M04
Page 42
42
Table A2. (cont.) The number of breaks and estimated break dates based on urea prices
# of Breaks
Determined
Estimated Break Dates
Regressors: Henry Hub natural gas and corn prices
Heterogeneous error distributions
Double Maximum test
𝑈𝐷𝑀𝑎𝑥 𝐹𝑇 0 -
𝑊𝐷𝑀𝑎𝑥 𝐹𝑇 0 -
Sequential test
Sequential 𝐹 0 -
Homogeneous error distributions
Double Maximum test
𝑈𝐷𝑀𝑎𝑥 𝐹𝑇 0 -
𝑊𝐷𝑀𝑎𝑥 𝐹𝑇 2 2008M04, 2012M07
Sequential test
Sequential 𝐹 0 -
Regressors: Henry Hub natural gas, ICE natural gas, and corn prices
Heterogeneous error distributions
Double Maximum test
𝑈𝐷𝑀𝑎𝑥 𝐹𝑇 4 2001M03, 2008M04, 2011M10,
2016M02
𝑊𝐷𝑀𝑎𝑥 𝐹𝑇 5 2000M10, 2004M02, 2008M04,
2011M10, 2016M02
Sequential test
Sequential 𝐹 0 -
Homogeneous error distributions
Double Maximum test
𝑈𝐷𝑀𝑎𝑥 𝐹𝑇 4 2003M12, 2008M04, 2011M09,
2016M02
𝑊𝐷𝑀𝑎𝑥 𝐹𝑇 5 2000M10, 2004M02, 2008M04,
2011M09, 2016M02
Sequential test
Sequential 𝐹 0 -
Page 43
43
Table A3. The estimates of pass-through rate to nitrogen fertilizer price (L=6): Before Jan 2010
HH only
(1)
HH + ICE
(2)
HH + Corn
(3)
HH + ICE + Corn
(4)
Anhydrous ammonia:
HH 0.725
(0.71, 0.739)
0.644
(0.627, 0.661)
0.673
(0.66, 0.686)
0.608
(0.593, 0.623)
ICE 0.19
(0.169, 0.21)
0.17
(0.153, 0.188)
Corn 0.379
(0.348, 0.409)
0.335
(0.304, 0.366)
Granular urea:
HH 0.435
(0.414, 0.456)
0.427
(0.404, 0.45)
0.372
(0.353, 0.391)
0.376
(0.355, 0.396)
ICE -0.012
(-0.04, 0.015)
-0.027
(-0.049, -0.005)
Corn 0.438
(0.394, 0.482)
0.415
(0.376, 0.454)
Note. The number in parentheses reports 95% confidence interval.
HH = Henry Hub natural gas; ICE = Intercontinental Exchange natural gas.
Table A4. The estimates of pass-through rate to nitrogen fertilizer price (L=6): After Jan 2010
HH only
(1)
HH + ICE
(2)
HH + Corn
(3)
HH + ICE + Corn
(4)
Anhydrous ammonia:
HH 0.089
(0.046, 0.132)
-0.112
(-0.158, -0.067)
0.111
(0.068, 0.155)
-0.034
(-0.075, 0.006)
ICE 0.602
(0.551, 0.653)
0.53
(0.493, 0.567)
Corn 0.322
(0.289, 0.355)
0.238
(0.203, 0.273)
Granular urea:
HH -0.141
(-0.191, -0.091)
-0.228
(-0.275, -0.182)
-0.131
(-0.184, -0.077)
-0.203
(-0.242, -0.165)
ICE 0.475
(0.416, 0.534)
0.521
(0.471, 0.57)
Corn 0.043
(-0.018, 0.104)
-0.117
(-0.169, -0.065)
Note. The number in parentheses reports 95% confidence interval.
HH = Henry Hub natural gas; ICE = Intercontinental Exchange natural gas.
Page 44
44
Table A5. The estimates of pass-through rate to nitrogen fertilizer price (L=12): Before Jan 2010
HH only
(1)
HH + ICE
(2)
HH + Corn
(3)
HH + ICE + Corn
(4)
Anhydrous ammonia:
HH 0.84
(0.821, 0.859)
0.811
(0.79, 0.833)
0.807
(0.791, 0.823)
0.778
(0.756, 0.801)
ICE -0.0005
(-0.03, 0.03)
-0.04
(-0.067, -0.013)
Corn 0.48
(0.437, 0.523)
0.54
(0.499, 0.581)
Granular urea:
HH 0.473
(0.449, 0.497)
0.503
(0.473, 0.533)
0.496
(0.474, 0.518)
0.525
(0.488, 0.562)
ICE -0.154
(-0.192, -0.117)
-0.228
(-0.271, -0.186)
Corn 0.446
(0.391, 0.502)
0.498
(0.448, 0.547)
Note. The number in parentheses reports 95% confidence interval. HH = Henry Hub natural gas; ICE =
Intercontinental Exchange natural gas.
Table A6. The estimates of pass-through rate to nitrogen fertilizer price (L=12): After Jan 2010
HH only
(1)
HH + ICE
(2)
HH + Corn
(3)
HH + ICE + Corn
(4)
Anhydrous ammonia:
HH 0.015
(-0.042, 0.071)
-0.276
(-0.339, -0.212)
-0.005
(-0.08, 0.069)
-0.398
(-0.451, -0.345)
ICE 0.596
(0.548, 0.644)
0.792
(0.737, 0.846)
Corn 0.129
(0.068, 0.19)
-0.241
(-0.293, -0.188)
Granular urea:
HH -0.064
(-0.141, 0.012)
-0.25
(-0.324, -0.176)
-0.15
(-0.226, -0.074)
-0.627
(-0.676, -0.577)
ICE 0.677
(0.595, 0.76)
1.106
(1.038, 1.174)
Corn -0.069
(-0.172, 0.033)
-0.659
(-0.747, -0.57)
Note. The number in parentheses reports 95% confidence interval. HH = Henry Hub natural gas; ICE =
Intercontinental Exchange natural gas.
Page 45
45
References
Bai, J., and Perron, P. (1998). Estimating and testing linear models with multiple structural
changes. Econometrica, 66(1), 47-78.
Bai, J., and Perron, P. (2003). Computation and analysis of multiple structural change models.
Journal of Applied Econometrics, 18, 1-22.
Beckman, J., and Riche, S. (2015). Changes to the natural gas, corn, and fertilizer price
relationships from the biofuels era. Journal of Agricultural and Applied Economics, 47(4),
494-509.
Beckman, J., Borchers, A., and Jones, C. A. (2013). Agriculture’s supply and demand for energy
and energy products. Washington DC: U.S. Department of Agriculture, Economic Research
Service.
Blonigen, B. A., and Pierce, J. R. (2016). Evidence for the Effects of Mergers on Market Power
and Efficiency. Board of Governors of the Federal Reserve System.
doi:10.17016/FEDS.2016.082.
Bushnell, J., and Humber, J. (2017). Rethinking trade exposure: the incidence of environmental
charges in the nitrogenous fertilizer industry. Journal of the Association of Environmental
and Resource Economists, 4(3), 857-894.
Carrion-i-Silvestre , J. L., Kim, D., and Perron, P. (2009). GLS-based unit root tests with
multiple structural breaks under both the null and the alternative hypotheses. Econometric
Theory, 25(6), 1754-1792.
Etienne, X. L., Trujillo-Barrera, A., and Wiggins, S. (2016). Price and volatility transmissions
between natural gas, fertilizer, and corn markets. Agricultural Finance Review, 76(1), 151-
171.
Page 46
46
Hernandez, M. A., and Torero, M. (2013). Market concentration and pricing behavior in the
fertilizer industry: A Global Approach. Agricultural Economics, 44(6), 723-734.
Huang, W.-Y. (2007). Impact of rising natural gas prices on U.S. ammonia supply. Washington
DC: U.S. Department of Agriculture, Economic Research Service.
Humber, J. (2014). A time series approach to retrospective merger analysis: Evidence in the US
nitrogen fertilizer industry. AAEA Annual Meeting 2014. Minneapolis, MN.
Jamasmie, C. (2017). Potash Corp. and Agrium merged firm to be called Nutrien. Mining.
Available at https://www.mining.com/potash-corp-agrium-merged-firm-called-nutrien/ Last
accessed 10/26/2021.
Kejriwal, M., and Perron, P. (2010). A sequential procedure to determine the number of breaks
in trend with an integrated or stationary noise component. Journal of Time Series Analysis,
31, 305-328.
Li, C. (2016). Three essays on Agriculture Economics [Unpublished doctoral dissertation]. Iowa
State University.
Mortan, F. S. (2019). Modern U.S. antitrust theory and evidence amid rising concerns of market
power and its effects: An overview of recent academic literature. Retrieved from
https://equitablegrowth.org/research-paper/modern-u-s-antitrust-theory-and-evidence-amid-
rising-concerns-of-market-power-and-its-effects/
Muthuramu, P., and Uma Maheswari, T., (2019). Tests for structural breaks in time series
analysis: A review of recent development. Shanlax International Journal of Economics, 7(4),
66-79.
Ott, H. (2012). Fertilizer markets and their interplay with commodity and food prices. Scientific
and Technical Research Reports, Publications Office of the European Union, Seville.
Page 47
47
Ruder, J., and Bennion, E. (2013). Growing Demand for F owing Demand for Fertilizer Keeps
Prices High. Washington DC: Bureau of Labor Statistics.